
Rising stone burden meets a steady shift to endoscopy
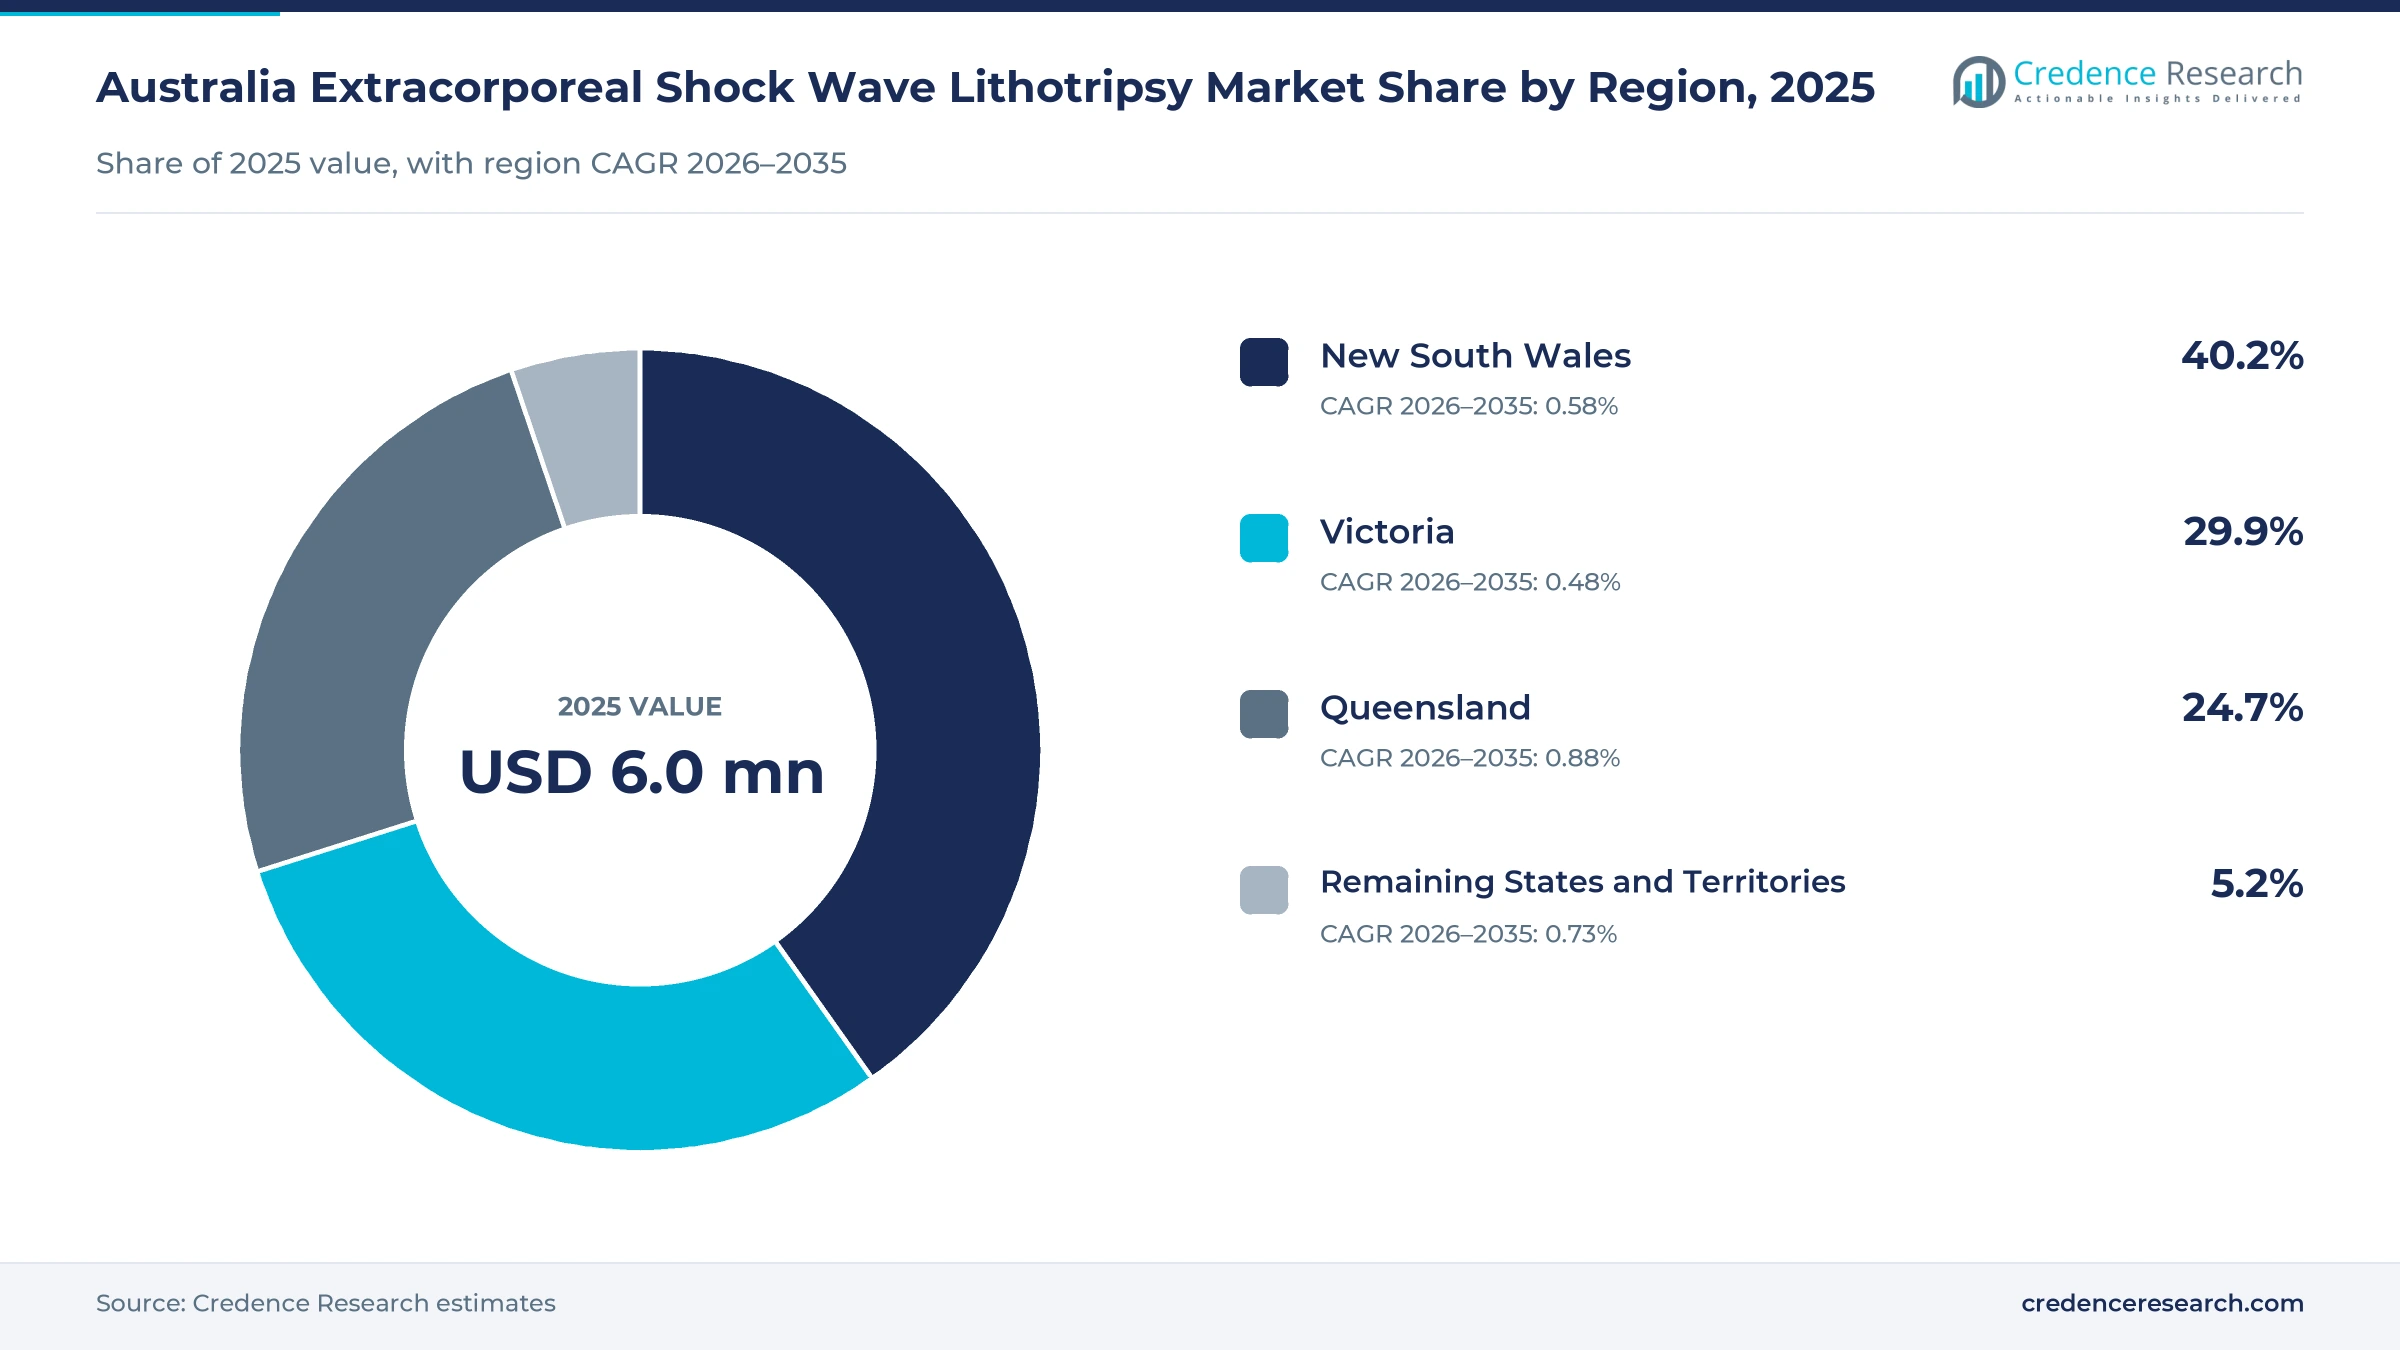
The Australia extracorporeal shock wave lithotripsy market was valued at USD 6.0 million in 2025 and is projected to increase from USD 11.6 million in 2026 to USD 12.3 million by 2035, registering a CAGR of 0.63% during 2026–2035. Demand comes from public and private hospitals that treat kidney and ureteric stones without incisions, paid through state budgets, Medicare benefits and private health insurance. New South Wales held the largest regional share, 40.2% in 2025, because it has the largest population and many urology units. Queensland is the fastest-growing region at 0.88% a year, as a high-volume Brisbane center has reported strong clearance results and called for more investment. In turn, a national study published in September 2026 showed that shock wave treatment fell to 7.4% of stone procedures in 2024, which keeps growth slow and selective.
Which stone treatment services are counted in Australia?
The estimate measures spending in Australia on clinical procedure services, equipment provision, maintenance contracts and consumables for shock wave treatment of urinary and biliary stones. It covers public hospitals, private hospitals and independent clinics and outreach services, paid by government, insurers and patients. Values are stated in USD million at current prices, excluding goods and services tax.
The estimate excludes ureteroscopy, percutaneous nephrolithotomy, open stone surgery and medical expulsion therapy, which compete for the same patients. The value chain runs from device makers and local sponsors through hospital procurement and service contracts to urology units, referring doctors and patients.
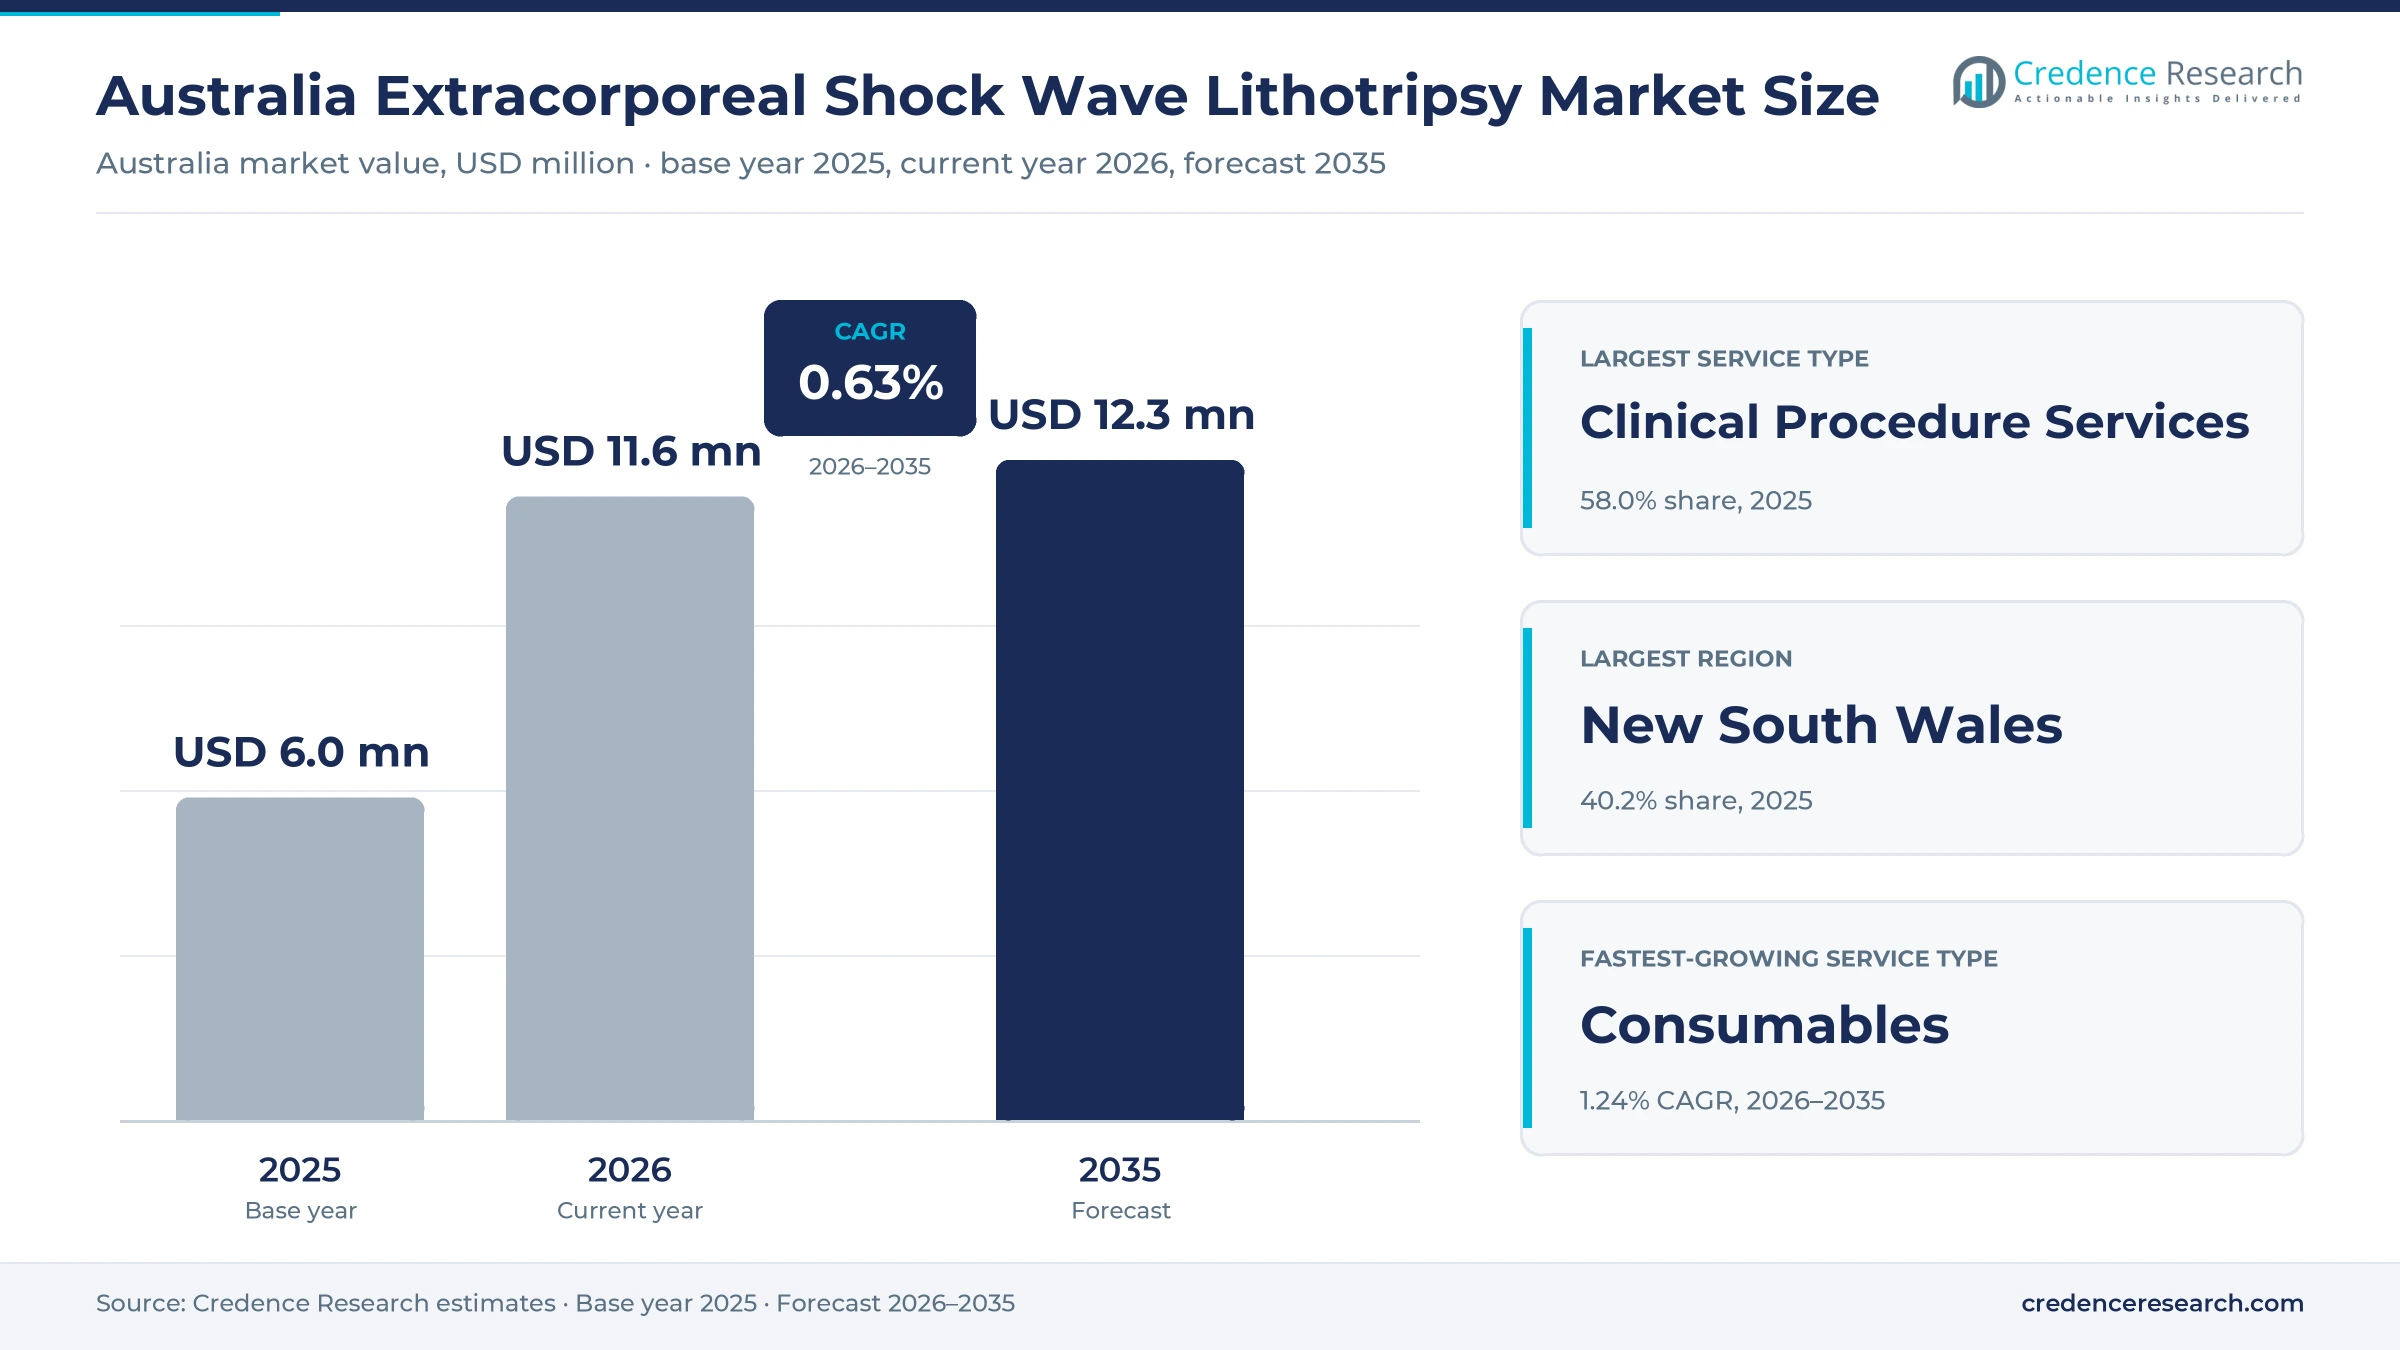
Australia Extracorporeal Shock Wave Lithotripsy Market Insights
- The Australia extracorporeal shock wave lithotripsy market was valued at USD 6.0 million in 2025 and is projected to reach USD 12.3 million by 2035, at a 0.63% CAGR during 2026–2035.
- New South Wales held 40.2% of 2025 value, because it has the largest population and a wide network of public and private urology units.
- Clinical procedure services led service types with 58.0% of 2025 value, as hospitals bill most spending per treatment session.
- In September 2026, a national study reported that shock wave treatment fell to 7.4% of all Australian stone procedures in 2024.
- Consumables grow fastest at 1.24% a year during 2026–2035, as aging units need more coupling, imaging and replacement parts.
Procedure services lead as consumables grow fastest
Why do procedure services hold most spending?
Based on service type, the market is categorized into clinical procedure services, equipment provision, maintenance contracts and consumables. Clinical Procedure Services led with 58.0% of 2025 value, because hospitals and specialists bill each treatment session, including imaging and anesthesia support. Consumables grow fastest at 1.24% a year, as hospitals keep older units running longer and buy more parts.
Which care settings perform the most treatments?
Based on care setting, the market is categorized into public hospitals, private hospitals and independent clinics and outreach services. Public Hospitals led with 52.0% of 2025 value, because statewide units and large teaching hospitals hold most fixed machines. Independent Clinics and Outreach Services grow fastest at 1.01% a year, as mobile services reach regional patients who cannot travel to city hospitals.
How do funding sources shape purchasing?
Based on customer type, the market is categorized into government-funded purchasers, insurer-funded purchasers and self-funded purchasers. Government-Funded Purchasers led with 55.0% of 2025 value, because state health departments fund statewide services, public hospital care and most outpatient referrals from emergency departments. Self-Funded Purchasers grow fastest at 0.82% a year, as some patients pay directly to avoid public waiting lists.
Why do kidney stones account for most treatments?
Based on disease area, the market is categorized into renal calculi, ureteric calculi and biliary calculi. Renal Calculi led with 68.0% of 2025 value, because small and medium kidney stones respond well to shock waves without incisions. Ureteric Calculi grow fastest at 0.83% a year, as more patients present to emergency departments with stones lodged in the ureter.
| Segment Group | Leading Sub-segment | Share, 2025 | Fastest-growing Sub-segment | CAGR, 2026–2035 |
|---|---|---|---|---|
| By Service Type | Clinical Procedure Services | 58.0% | Consumables | 1.24% |
| By Care Setting | Public Hospitals | 52.0% | Independent Clinics and Outreach Services | 1.01% |
| By Customer Type | Government-Funded Purchasers | 55.0% | Self-Funded Purchasers | 0.82% |
| By Disease Area | Renal Calculi | 68.0% | Ureteric Calculi | 0.83% |
Request a Free Sample
Fill in your details and we'll send you a free sample report.
- Sample data tables & charts
- Research methodology
Stone referrals, clear results and Medicare support demand
How do persistent stone referrals sustain treatment demand?
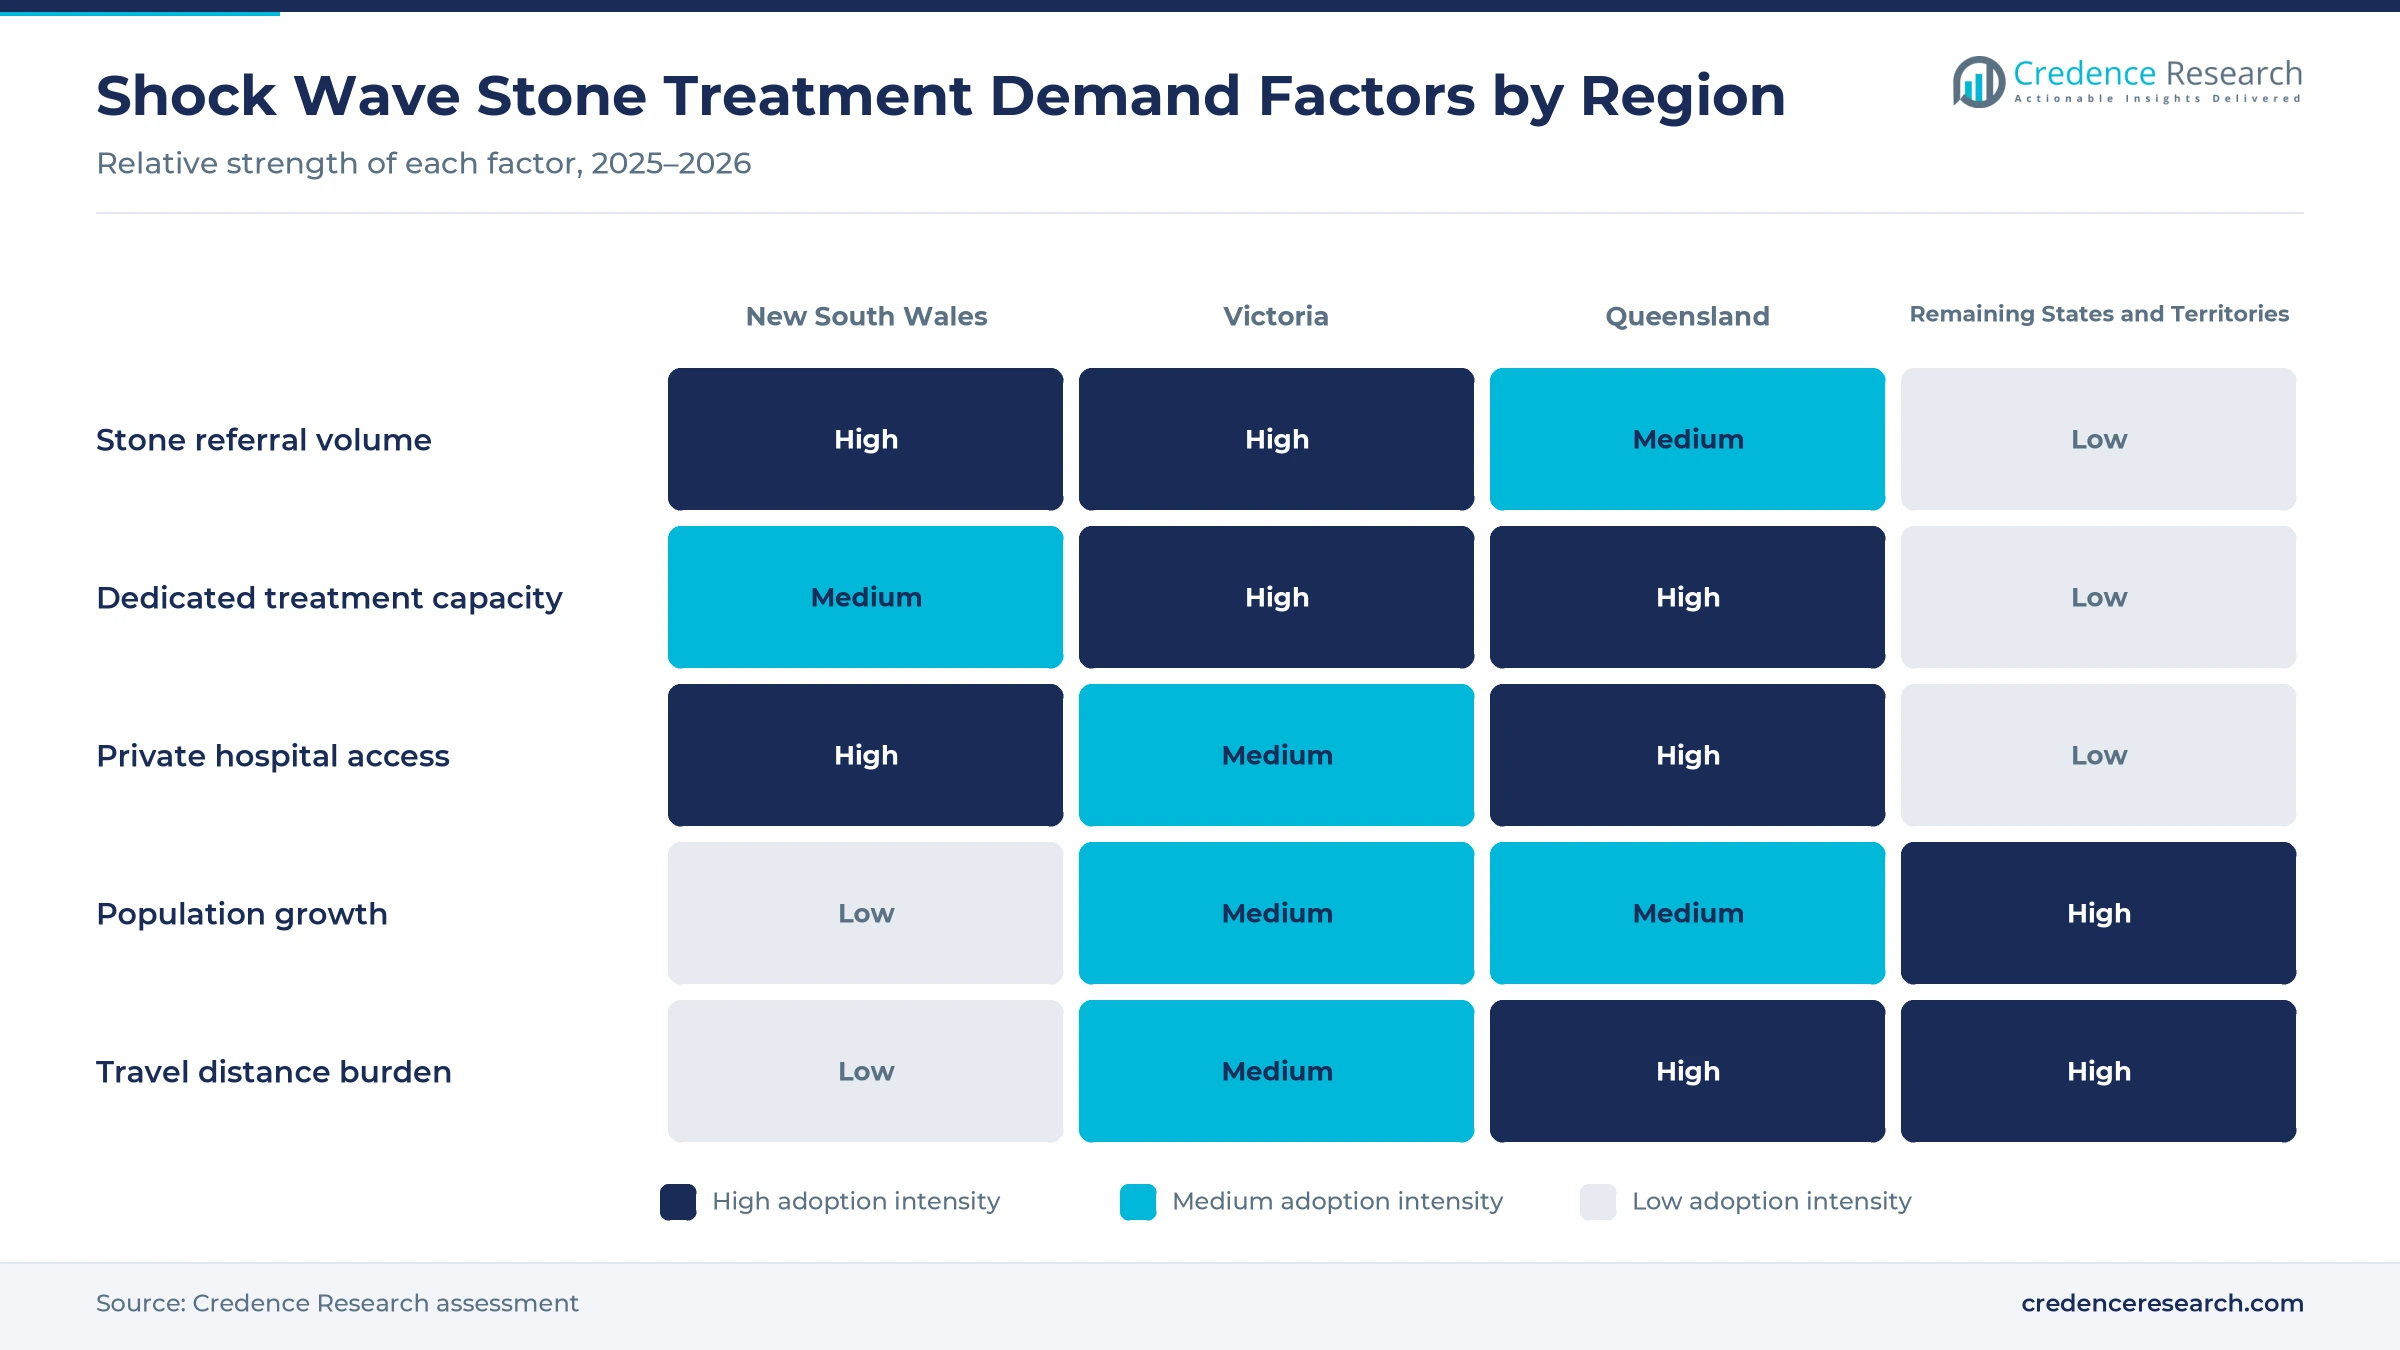
Persistent stone referrals sustain treatment demand, because more Australians present with stones each year and many need a procedure. Population-adjusted incidence of ureteric stones rose 95%, from 85.6 to 166.9 per 100,000, between 2000 and 2019, according to a national study published in February 2026. Procedural interventions rose 90% over the same period, while the intervention rate stayed near 36%. Stone surgery rates also rose from 26 to 89 per 100,000 between 1994 and 2024, as shown in a national Medicare analysis. As a result, clinical procedure services lead with 58.0% of 2025 value, because steady referrals from emergency departments and general practitioners keep treatment lists full.
Why does selective clinical effectiveness keep units in use?
Selective clinical effectiveness keeps units in use, because shock waves clear many small and medium kidney stones without incisions or general surgery. A Brisbane audit of 1,930 patients treated between January 2012 and January 2019 reported clearance of 81.9% for stones under 1 cm. Medium stones of 1 to 2 cm cleared in 60.6% of cases, while small upper calyx stones reached 87.5%. Allowing for two procedures, 89% of stones were treated successfully, according to the authors from The Prince Charles Hospital. Consequently, renal calculi lead disease areas with 68.0% of 2025 value, as urologists reserve shock wave lithotripsy for stones that respond best.
How do established reimbursement pathways support access?
Established reimbursement pathways support access, because public and private patients can both reach treatment without large personal costs. Under the national schedule, the Medicare fee for item 36546 is AUD 827.50, with a 75% benefit of AUD 620.65, as listed in the federal schedule. The item covers pre-treatment consultations and three days of post-treatment care for one side. In Victoria, the statewide unit is funded by the state and has treated over 20,000 patients since 1996. As a result, government-funded purchasers lead with 55.0% of 2025 value, while private health cover supports treatment in private hospitals such as The Wesley Hospital in Brisbane.
Why does the cost of endoscopic care favor shock waves?
The cost of endoscopic care favors shock waves for suitable stones, because scopes, theater time and disposables make ureteroscopy expensive. A Victorian public hospital study of 222 patients found a mean procedural cost of AUD 2,885 for flexible ureteroscopy. The mean episode cost reached AUD 3,510, and scopes, operating time and disposable equipment made up nearly 90% of procedural cost. The authors suggested using shock wave lithotripsy where appropriate to reduce this financial burden on public hospitals and their theater lists. In turn, public hospitals lead care settings with 52.0% of 2025 value, as managers compare shock waves with flexible ureteroscopy on cost.
Endoscopy gains while statewide and day services expand
How is the shift to endoscopic stone surgery changing demand?
The shift to endoscopic stone surgery is changing demand, because urologists increasingly treat stones with scopes and lasers. National data show that shock wave treatment peaked in 2002 and then declined by 48%. It accounted for 7.4% of all stone procedures in 2024, while ureteroscopy volumes rose sevenfold. Flexible pyeloscopy overtook shock wave treatment by 2009, and total stone procedures grew at 5.6% a year from 1994 to 2024. A Melbourne team had already reported in 2016 that shock wave lithotripsy fell by an average of 3.5% a year. As a result, spending grows slowly, while hospitals spend more on kidney stone management devices used in theaters.
Why are statewide and mobile services rising?
Statewide and mobile services are rising, because low procedure volumes make it hard for every hospital to run its own machine. St Vincent's Hospital Melbourne runs an on-site unit at Fitzroy and a mobile service that covers metropolitan and rural Victoria. Monash Health no longer provides shock wave treatment and redirects suitable patients to St Vincent's. The Fitzroy procedure takes about 30 minutes, and patients are usually ready to go home about three hours after treatment. In turn, independent clinics and outreach services grow fastest among care settings at 1.01% a year, as shared machines reach more towns. St Vincent's opened its statewide unit in 1996, long before the current shift.
Can same-day stone care open new capacity?
Same-day stone care offers a clear opening, because public theaters face rising stone workloads. Endoscopic stone destruction in public hospitals rose 323% between 2000 and 2019, compared with 48% in private hospitals. Same-day discharge rates for stone patients also converged at about 45% by 2018 and 2019. Shock wave lithotripsy runs in day procedure units, which can free operating theaters for complex cases. In February 2026, the CARI group also introduced guidelines on preventing recurrent stones, which keeps attention on stone care pathways. As a result, public hospitals can use shock waves to ease theater pressure, while urology imaging systems help select suitable stones in 2026 and beyond.
Is there room to grow with new Queensland capacity?
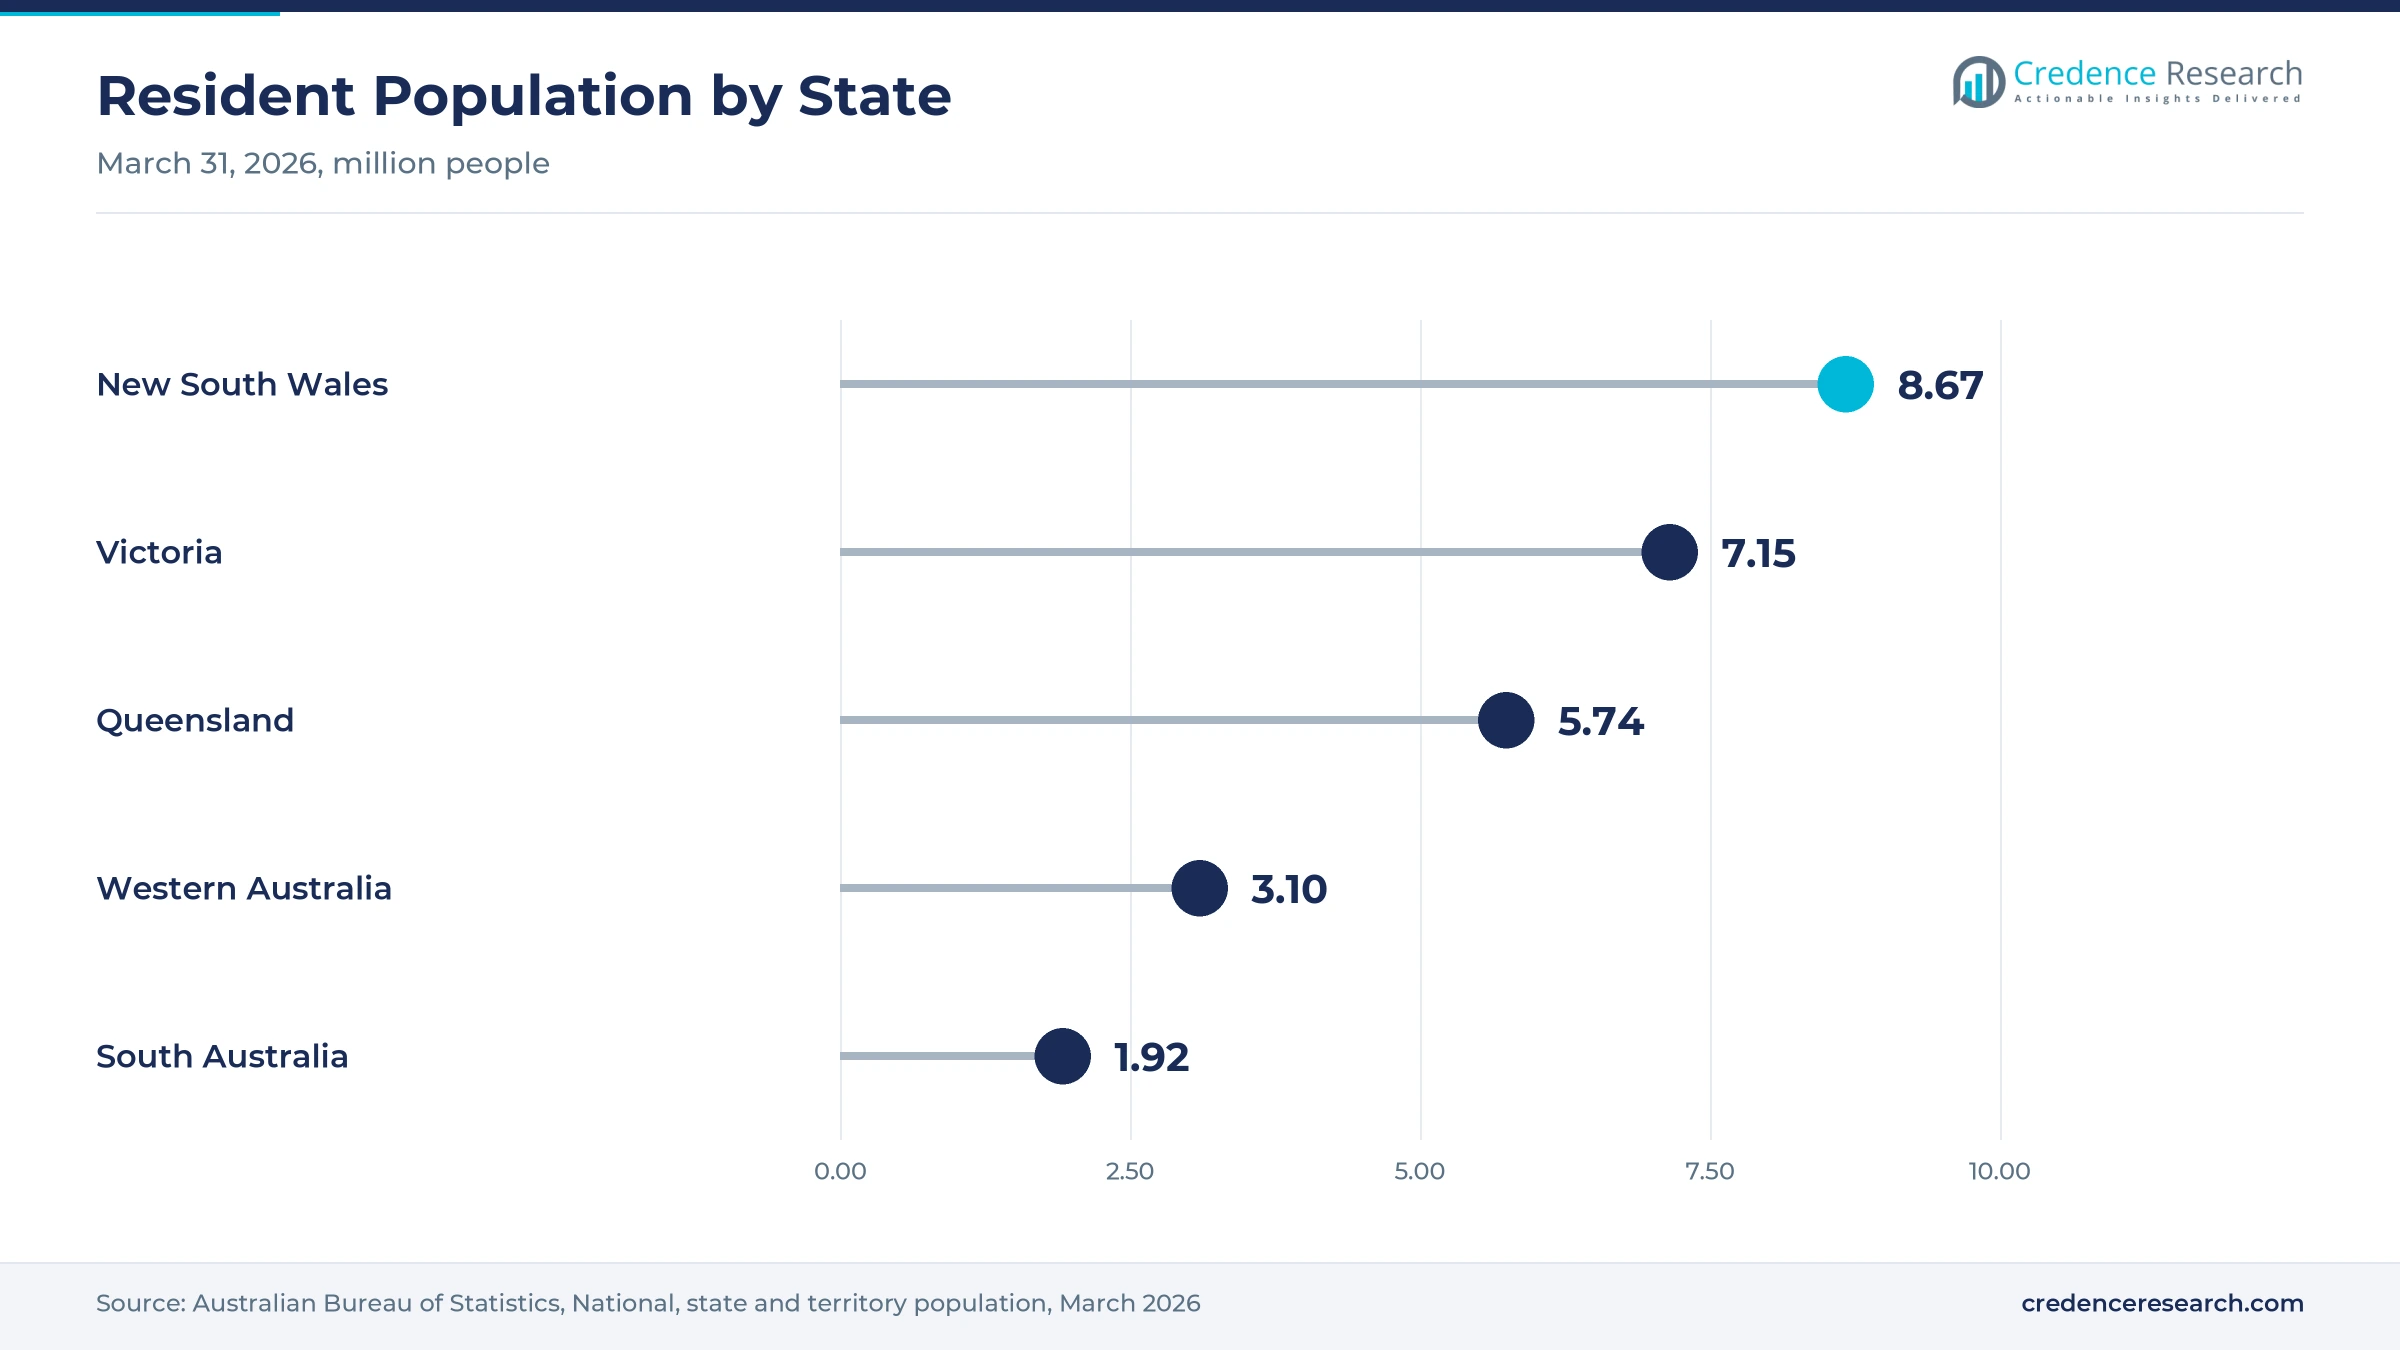
New Queensland capacity offers room to grow, because a Brisbane team has called for further investment in shock wave services in most states, and especially in Queensland. The Prince Charles Hospital lists shock wave treatment among its kidney stone services, and The Wesley Hospital offers it privately in Brisbane. Dornier lithotripsy systems appear on the national device register under ARTG 527571 and ARTG 409895, with two different local sponsors. The Brisbane team made its call for investment in a 2024 audit, and the state had 5.74 million residents in March 2026. In turn, hospitals in Brisbane can renew units and add sessions for patients from regional Queensland.
Large stones, few sites and scope skills limit growth
How do large stones limit treatment success?
Large stones limit treatment success, because shock waves break them less completely than small stones. The Brisbane audit reported clearance of only 31.3% for stones larger than 2 cm. As a result, urologists send larger stones to ureteroscopy or percutaneous surgery instead. Patients who need repeat sessions also add cost and delay, which weakens the case for shock waves in complex cases treated at busy hospitals.
Why do few treatment sites slow access?
Few treatment sites slow access, because many hospitals have closed or never installed fixed units. In Victoria, patients are directed to one statewide provider, and some health services refer patients onward instead of treating them locally. Consequently, regional patients may wait longer or travel further for care. Mobile services ease this problem, although they depend on scheduling, staffing and safe transport of the machine between towns.
How does the scope skills shift affect referrals?
The scope skills shift affects referrals, because newer urologists train mainly in ureteroscopy and laser techniques. Hospitals then build theater lists around endoscopy rather than shock waves. In turn, fewer clinicians gain experience in patient selection, targeting and energy settings for shock wave treatment. Units that keep strong results rely on heavy consultant input and frequent imaging, which takes dedicated specialist time.
Will low volumes delay equipment renewal?
Low volumes can delay equipment renewal, because hospitals struggle to justify capital spending on machines that treat a small share of stone patients. Older units then need more maintenance, replacement parts and unplanned downtime. As a result, some hospitals stop offering treatment when a machine reaches the end of its life. Shared statewide units, leasing and service contracts help spread cost, although they still need steady referral volumes.
New South Wales leads as Queensland grows fastest
| Region | Value, 2025 (USD million) | Share, 2025 | CAGR, 2026–2035 |
|---|---|---|---|
| New South Wales | 2.4 | 40.2% | 0.58% |
| Victoria | 1.8 | 29.9% | 0.48% |
| Queensland | 1.5 | 24.7% | 0.88% |
| Remaining States and Territories | 0.3 | 5.2% | 0.73% |
Why does New South Wales lead shock wave spending?
New South Wales held a 40.2% share of 2025 value and grows at 0.58% a year. The state had 8.67 million residents at March 31, 2026, the largest population in the country. Sydney urologists at Blacktown and Mount Druitt hospitals led a 2026 national study of stone surgery trends. As a result, a large referral base and many public and private urology units keep this state in the lead through 2035.
How does Victoria organize treatment through one unit?
Victoria held a 29.9% share of 2025 value and grows at 0.48% a year. The St Vincent's Hospital Statewide Lithotripsy Unit is funded by the state and runs both a Fitzroy machine and a mobile service. The unit has treated over 20,000 patients since it was established in 1996. In turn, Victoria has a centralized model that keeps machine use high while other hospitals, including Monash Health, refer patients onward.
Why is Queensland the fastest-growing region?
Queensland held a 24.7% share of 2025 value and grows fastest at 0.88% a year. The Prince Charles Hospital in Brisbane treated 1,930 eligible patients in a seven-year audit and reported higher clearance than published elsewhere. The Wesley Hospital also offers shock wave lithotripsy privately within its urology service. Consequently, public and private capacity in Brisbane supports faster growth as the state population rises and regional patients travel to the city for care.
How do the remaining states and territories access care?
Remaining states and territories held a 5.2% share of 2025 value and grow at 0.73% a year. Western Australia had 3.10 million residents and the fastest population growth at 2.1% in the year to March 2026. As a result, demand rises slowly in Perth and Adelaide, while smaller jurisdictions rely on major hospital units.
National stone studies and guidelines from 2024 to 2026
| Development | Status and market relevance |
|---|---|
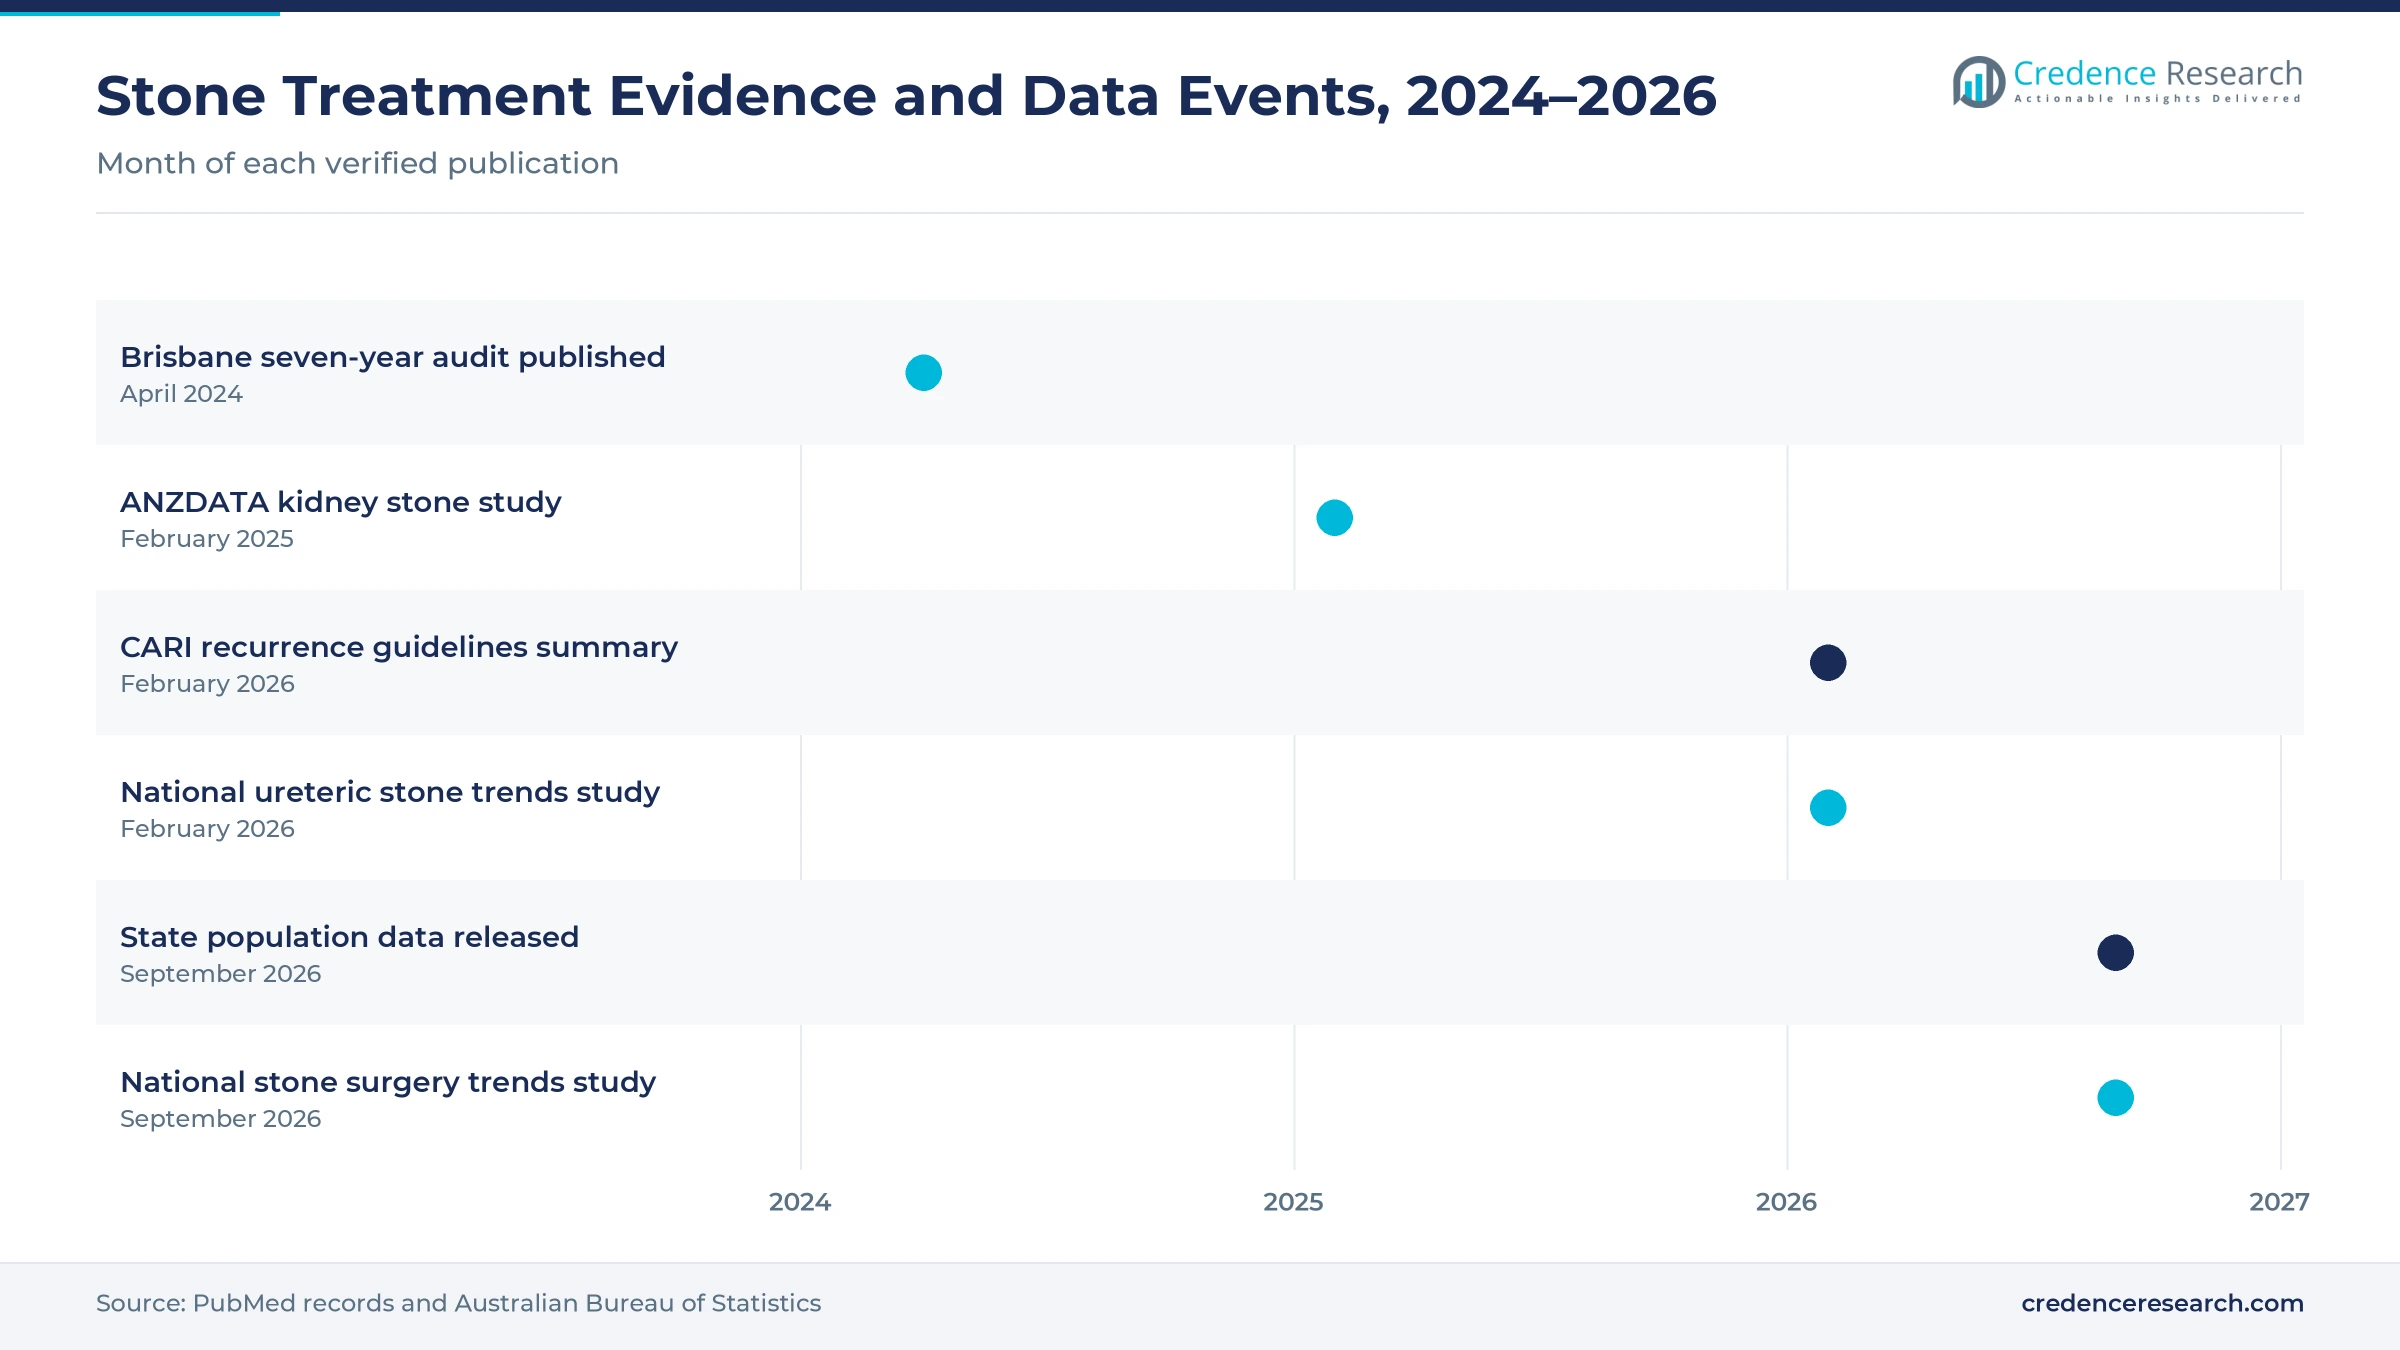
| In April 2024, BJUI Compass published a seven-year audit from The Prince Charles Hospital covering 1,930 shock wave patients. | Calls for more investment |
| In February 2025, an ANZDATA registry study reported that 834 patients started kidney replacement therapy because of kidney stones. | 1.17 per million each year |
| In February 2026, the CARI guidelines group published a summary on preventing recurrent kidney stones in Australia and New Zealand. | Nutrition therapy first |
| In February 2026, a national study reported that ureteric stone incidence rose 95% between 2000 and 2019. | Interventions up 90% |
| In September 2026, the ANZ Journal of Surgery published national trends showing shock wave treatment at 7.4% of stone procedures in 2024. | Endoscopy now dominant |
Imaging, mobile units and data tools improve clearance
- Same-day X-ray imaging confirms stone position before treatment, which the Brisbane team cites as a key reason for strong clearance.
- Frequent intraoperative imaging lets clinicians adjust targeting during each session, which reduces repeat treatments.
- Mobile lithotripter units move between metropolitan and rural hospitals, which spreads machine cost across more patients.
- Data-based decision tools compare likely success of treatment options using real-world records, which helps urologists choose patients.
Need a Custom Version of This Report?
Tailor the scope, geography, or segments to your exact requirements.
- Custom geography or segment scope
- Direct access to our analyst team
Device sponsors and hospital units shape competition
Competition combines device makers, local sponsors and hospital units that run treatment services. Dornier MedTech supplies extracorporeal lithotripsy systems that appear on the national device register under two local sponsors, including Endotherapeutics. In May 2018, Dornier introduced a lithotripter with an analytic algorithm built on real-world treatment data, which shows how makers add decision support. St Vincent's Hospital Melbourne runs the statewide unit for Victoria, with a fixed machine at Fitzroy and a mobile service. The Prince Charles Hospital runs a high-volume public service in Brisbane, and The Wesley Hospital offers treatment privately. Device suppliers compete on clearance results, imaging integration, service support and lifetime cost, while hospital units compete on waiting times, referral links and results. In September 2026, a national study announced that endoscopy now dominates stone surgery, which pushes shock wave providers to prove value for selected stones.
Companies profiled and their roles in this market
| Company | Type | Role in the market |
|---|---|---|
| Dornier MedTech | Device maker | Extracorporeal lithotripsy systems listed on the national device register |
| Endotherapeutics | Local sponsor and distributor | Sponsor of a Dornier extracorporeal lithotripsy system, ARTG 527571 |
| St Vincent's Hospital Melbourne | Public hospital unit | Statewide unit with a Fitzroy machine and mobile service |
| The Prince Charles Hospital | Public hospital unit | High-volume Brisbane service with published clearance audit |
| The Wesley Hospital | Private hospital | Offers shock wave treatment within its urology service |
Credence Research view on non-invasive stone care
Credence Research's view is that Australian spending on shock wave stone treatment will grow slowly through 2035, as rising stone burden offsets the long shift toward endoscopy. Procedure services should keep the largest share, while consumables and maintenance grow faster as hospitals keep older machines running. Queensland will add demand fastest, although New South Wales keeps the largest share. However, providers that show strong clearance for small and medium stones and share machines across regions will hold the most demand.
How the stone treatment estimate was built
The report uses 2025 as the base year, with values in USD million at current prices. Market values come from the Credence Research model, which combines stone procedure volumes, Medicare fees, hospital costs and equipment service spending. Regional shares follow the client zone split, and segment splits by service type, care setting, customer type and disease area are Credence Research estimates. Sources used are published clinical studies, government fee schedules, device register entries, hospital service pages and official statistics, and no interviews or surveys were used.
Selective use and steady referrals shape demand to 2035
The market is expected to reach USD 12.3 million by 2035, a 0.63% CAGR during 2026–2035, as steady stone referrals balance the continued shift to endoscopy. Growth should be strongest in consumables, outreach services, ureteric stones and Queensland, while New South Wales keeps the largest share. Shared statewide and mobile units should keep machines busy and spread equipment cost. In contrast, faster closure of hospital units could move more suitable stones to ureteroscopy and slow spending further.
Frequently Asked Questions
How big is the Australia extracorporeal shock wave lithotripsy market?
Which region leads shock wave stone treatment spending?
Which region grows fastest?
Which service type holds the largest share?
Why is shock wave treatment growing slowly?
How does Medicare support treatment?
Who are the leading participants in this market?
What are the main risks to growth?
Table of Content
Chapter 1 Market Segmentation
- 1.1 Segmentation Framework
- 1.1.1 Product and Service Classification
- 1.1.2 Application and End-Use Classification
- 1.1.3 Technology and Solution Classification
- 1.1.4 Customer and Distribution Channel Classification
- 1.1.5 Geographic Segmentation
- 1.1.6 Market Segment Definitions and Boundaries
- 1.2 By Service Type
- 1.2.1 Clinical Procedure Services
- 1.2.2 Equipment Provision
- 1.2.3 Maintenance Contracts
- 1.2.4 Consumables
- 1.3 By Care Setting
- 1.3.1 Public Hospitals
- 1.3.2 Private Hospitals
- 1.3.3 Independent Clinics and Outreach Services
- 1.4 By Customer Type
- 1.4.1 Government-Funded Purchasers
- 1.4.2 Insurer-Funded Purchasers
- 1.4.3 Self-Funded Purchasers
- 1.5 By Disease Area
- 1.5.1 Renal Calculi
- 1.5.2 Ureteric Calculi
- 1.5.3 Biliary Calculi
Chapter 2 Introduction
- 2.1 Report Objectives and Scope
- 2.2 Product Definition and Industry Terminology
- 2.3 Market Inclusions and Exclusions
- 2.4 Research Process
- 2.4.1 Primary Research and Expert Interviews
- 2.4.2 Secondary Research and Source Review
- 2.4.3 Top-Down and Bottom-Up Estimation
- 2.4.4 Data Triangulation and Verification
- 2.5 Market Size Measurement Basis
- 2.5.1 2025: USD 6.0 million → 2035: USD 12.3 million
- 2.6 Historical and Forecast Reference Periods
- 2.6.1 Historical Period: 2018-2025
- 2.6.2 Base Year: 2025
- 2.6.3 Forecast Period: 2025-2035
- 2.7 Research Assumptions and Limitations
Chapter 3 Executive Summary
- 3.1 Market Snapshot and Key Findings
- 3.2 Base-Year Market Size, 2025
- 3.3 Forecast Market Size, 2035
- 3.4 Revenue and Volume Growth Outlook
- 3.5 Key Demand and Supply Indicators
- 3.6 Leading Market Segments
- 3.7 Fastest-Growing Market Opportunities
- 3.8 Regional Performance Highlights
- 3.9 Technology and Industry Transformation
- 3.10 Competitive Landscape Summary
- 3.11 Analyst View and Strategic Implications
Chapter 4 Australia Extracorporeal Shock Wave Lithotripsy Market Trends and Developments
- 4.1 Historical Industry Development, 2018-2025
- 4.2 Recent Market Trends and Developments
- 4.3 Demand and Customer Behavior Trends
- 4.4 Technology and Product Innovation
- 4.5 Artificial Intelligence, Automation and Digitalization
- 4.6 Local Manufacturing and Supply Chain Realignment
- 4.7 Industry Partnerships, Mergers and Acquisitions
- 4.8 Sustainability and Circular Economy Developments
- 4.9 Government and Private Sector Investment Trends
- 4.10 Emerging Business Models and Commercialization
- 4.11 Industry Developments and Announcements
Chapter 5 Australia Extracorporeal Shock Wave Lithotripsy Market Production, Supply and Demand Analysis
- 5.1 Demand Trend and Consumption Analysis, 2018-2025
- 5.2 Demand Forecast, 2025-2035
- 5.3 Production and Output Trend, 2018-2025
- 5.4 Production and Output Forecast, 2025-2035
- 5.5 Installed Capacity and Capacity Utilization
- 5.6 Company-Wise Production Plants and Statistics
- 5.6.1 Installed Production Capacity
- 5.6.2 Actual Production
- 5.6.3 Planned Capacity and Expansion Targets
- 5.7 Supply Chain Structure and Procurement Trends
- 5.8 Supply-Demand Gap and Bottlenecks
- 5.9 Import Dependence and Sourcing Structure
- 5.10 Contract Manufacturing and Outsourcing
- 5.11 Regional Supply and Demand Concentration
Chapter 6 Australia Extracorporeal Shock Wave Lithotripsy Market Pricing Analysis
- 6.1 Pricing Structure and Measurement
- 6.2 Historical Pricing Trends, 2018-2025
- 6.3 Pricing Outlook, 2025-2035
- 6.4 Average Selling Price and Unit Economics
- 6.5 Pricing by Product and Market Segment
- 6.6 Geographic Pricing Differences
- 6.7 Key Input, Energy, Labor and Logistics Costs
- 6.8 Contract Pricing and Purchasing Models
- 6.9 Pricing Sensitivity and Competitive Positioning
- 6.10 Price, Margin and Profitability Implications
Chapter 7 Australia Extracorporeal Shock Wave Lithotripsy Market Dynamics
- 7.1 Market Growth Drivers
- 7.1.1 Demand-Side Drivers
- 7.1.2 Technology and Innovation Drivers
- 7.1.3 Infrastructure and Investment Drivers
- 7.1.4 Regulatory and Policy Drivers
- 7.2 Market Restraints
- 7.2.1 Cost and Affordability Constraints
- 7.2.2 Technology and Adoption Barriers
- 7.2.3 Supply Chain and Operational Constraints
- 7.3 Market Challenges
- 7.3.1 Competitive Pressure and Margin Erosion
- 7.3.2 Skills, Infrastructure and Implementation Gaps
- 7.4 Emerging Market Opportunities
- 7.5 Market Dynamics Impact and Time-Horizon Assessment
Chapter 8 Australia Extracorporeal Shock Wave Lithotripsy Value Chain Analysis
- 8.1 Industry Value Chain Overview
- 8.2 Upstream Suppliers and Critical Inputs
- 8.3 Technology and Component Providers
- 8.4 Manufacturing or Service Delivery
- 8.5 Distribution, Channel Partners and Integrators
- 8.6 Downstream Applications and End Users
- 8.7 Value Addition and Profit Pools
- 8.8 Vertical Integration and Outsourcing
- 8.9 Supplier Concentration and Risk
- 8.10 Supply Chain Localization and Resilience
Chapter 9 Australia Extracorporeal Shock Wave Lithotripsy Market Regulations and Policies
- 9.1 Relevant Laws, Standards and Compliance Frameworks
- 9.2 Product, Service, Safety and Quality Requirements
- 9.3 Government Policies, Incentives and Subsidies
- 9.4 Imports, Exports and Trade Barriers
- 9.5 Public Procurement and Local Content Requirements
- 9.6 Environmental and Sustainability Compliance
- 9.7 Upcoming Policy Changes and Market Implications
Chapter 10 Australia Extracorporeal Shock Wave Lithotripsy Market Hotspots and Opportunities
- 10.1 Market Opportunity Mapping and Growth Hotspots
- 10.2 High-Growth Applications and Customer Groups
- 10.3 Underserved Markets and White-Space Opportunities
- 10.4 Emerging Technology and Product Opportunities
- 10.5 New Capacity and Investment Hotspots
- 10.6 Market Entry and Expansion Opportunities
- 10.7 Distribution and Partnership Opportunities
- 10.8 Near-Term and Long-Term Commercial Potential
- 10.9 Opportunity Attractiveness and Execution Risks
Chapter 11 Australia Extracorporeal Shock Wave Lithotripsy Market Outlook, 2025-2035
- 11.1 Market Size and Analysis
- 11.1.1 Revenue (Market Measurement: 2025: USD 6.0 million → 2035: USD 12.3 million)
- 11.1.2 Market Volume and Quantity Sold
- 11.1.3 Historical Market Size, 2018-2025
- 11.1.4 Base-Year Market Size, 2025
- 11.2 Market Forecast, 2025-2035
- 11.2.1 Revenue Forecast to 2035
- 11.2.2 Volume Forecast to 2035
- 11.2.3 CAGR and Year-on-Year Growth
- 11.2.4 Incremental Revenue Opportunity
- 11.3 Forecast Assumptions and Scenario Analysis
- 11.3.1 Base-Case Forecast
- 11.3.2 Optimistic and Conservative Scenarios
- 11.3.3 Technology, Pricing and Policy Sensitivities
- 11.4 Market Attractiveness and Growth Outlook
Chapter 12 Australia Extracorporeal Shock Wave Lithotripsy Market Segmentation and Outlook
- 12.1 Segmentation Summary and Market Shares, 2025
- 12.2 Largest and Fastest-Growing Segments
- 12.3 By Service Type - Market Size and Forecast, 2025-2035
- 12.3.1 Segment Definition and Scope
- 12.3.2 Historical Market Size, 2018-2025
- 12.3.3 Revenue Forecast, 2025-2035
- 12.3.4 Volume Forecast, 2025-2035
- 12.3.5 Base-Year Market Share, 2025
- 12.3.6 Segment CAGR and Growth Drivers
- 12.3.7 Subsegment Market Size and Forecast
- 12.3.7.1 Clinical Procedure Services
- 12.3.7.2 Equipment Provision
- 12.3.7.3 Maintenance Contracts
- 12.3.7.4 Consumables
- 12.3.8 Subsegment Pricing and Adoption Trends
- 12.3.9 Leading Suppliers and Competition
- 12.3.10 Regional Demand and Opportunities
- 12.4 By Care Setting - Market Size and Forecast, 2025-2035
- 12.4.1 Segment Definition and Scope
- 12.4.2 Historical Market Size, 2018-2025
- 12.4.3 Revenue Forecast, 2025-2035
- 12.4.4 Volume Forecast, 2025-2035
- 12.4.5 Base-Year Market Share, 2025
- 12.4.6 Segment CAGR and Growth Drivers
- 12.4.7 Subsegment Market Size and Forecast
- 12.4.7.1 Public Hospitals
- 12.4.7.2 Private Hospitals
- 12.4.7.3 Independent Clinics and Outreach Services
- 12.4.8 Subsegment Pricing and Adoption Trends
- 12.4.9 Leading Suppliers and Competition
- 12.4.10 Regional Demand and Opportunities
- 12.5 By Customer Type - Market Size and Forecast, 2025-2035
- 12.5.1 Segment Definition and Scope
- 12.5.2 Historical Market Size, 2018-2025
- 12.5.3 Revenue Forecast, 2025-2035
- 12.5.4 Volume Forecast, 2025-2035
- 12.5.5 Base-Year Market Share, 2025
- 12.5.6 Segment CAGR and Growth Drivers
- 12.5.7 Subsegment Market Size and Forecast
- 12.5.7.1 Government-Funded Purchasers
- 12.5.7.2 Insurer-Funded Purchasers
- 12.5.7.3 Self-Funded Purchasers
- 12.5.8 Subsegment Pricing and Adoption Trends
- 12.5.9 Leading Suppliers and Competition
- 12.5.10 Regional Demand and Opportunities
- 12.6 By Disease Area - Market Size and Forecast, 2025-2035
- 12.6.1 Segment Definition and Scope
- 12.6.2 Historical Market Size, 2018-2025
- 12.6.3 Revenue Forecast, 2025-2035
- 12.6.4 Volume Forecast, 2025-2035
- 12.6.5 Base-Year Market Share, 2025
- 12.6.6 Segment CAGR and Growth Drivers
- 12.6.7 Subsegment Market Size and Forecast
- 12.6.7.1 Renal Calculi
- 12.6.7.2 Ureteric Calculi
- 12.6.7.3 Biliary Calculi
- 12.6.8 Subsegment Pricing and Adoption Trends
- 12.6.9 Leading Suppliers and Competition
- 12.6.10 Regional Demand and Opportunities
- 12.7 Segment Growth Comparison
- 12.8 Segment Attractiveness and Priority Matrix
Chapter 13 Australia Extracorporeal Shock Wave Lithotripsy End-Use and Application Market Outlook
- 13.1 End-Use Industry and Customer Demand Structure
- 13.2 Leading Applications and Customer Groups
- 13.3 End-Use Market Size, Share and Forecast
- 13.4 Major End-Use Industry Deep Dives
- 13.4.1 Customer Requirements and Use Cases
- 13.4.2 Demand and Replacement Cycles
- 13.4.3 Technical and Regulatory Considerations
- 13.4.4 Purchasing and Procurement Models
- 13.4.5 Leading Vendors and Distribution Channels
- 13.4.6 Forecast and Commercial Opportunities
- 13.5 Emerging Applications and Cross-Segment Demand
- 13.6 End-Use Industry Investment Priorities
Chapter 14 Australia Extracorporeal Shock Wave Lithotripsy Geographic Market Outlook, 2025-2035
- 14.1 Domestic Market Distribution and Demand Clusters
- 14.2 State- or Province-Wise Market Size and Forecast, 2025-2035
- 14.3 City and Metropolitan Market Outlook
- 14.4 Industrial, Manufacturing and Commercial Clusters
- 14.5 Geographic Concentration of Key End Users
- 14.6 Local Pricing and Purchasing Differences
- 14.7 Domestic Production Facilities and Capacity Map
- 14.8 Local Infrastructure and Project Pipeline
- 14.9 State-Level Policy and Incentive Differences
- 14.10 Subnational Investment Hotspots and Opportunities
- 14.11 Distribution and Logistics Networks
- 14.12 Domestic Competitive Footprint
Chapter 15 Australia Extracorporeal Shock Wave Lithotripsy Technology, Innovation and Sustainability Outlook
- 15.1 Technology Landscape and Maturity
- 15.2 Product, Process and Service Innovation
- 15.3 AI, Automation and Digital Tools in the Industry
- 15.4 Technology Adoption and Performance Benchmarking
- 15.5 Innovation Pipeline and R&D Investment
- 15.6 Patent and Intellectual Property Trends
- 15.7 Energy Efficiency and Resource Management
- 15.8 Sustainability, Recycling and Circularity
- 15.9 Technology Roadmap, 2025-2035
- 15.10 Risks of Obsolescence and Technology Substitution
Chapter 16 Australia Extracorporeal Shock Wave Lithotripsy Market Key Strategic Imperatives
- 16.1 Growth and Market Entry Priorities
- 16.2 High-Return Products and Segments
- 16.3 Pricing, Profitability and Cost Optimization
- 16.4 Technology Investment and Product Differentiation
- 16.5 Supply Chain Localization and Resilience
- 16.6 Distribution and Customer Acquisition
- 16.7 Partnership, Acquisition and Capacity Strategy
- 16.8 Regional Expansion Priorities
- 16.9 Short-, Medium- and Long-Term Actions
Chapter 17 Competition Outlook
- 17.1 Industry Competition Characteristics
- 17.2 Market Structure and Concentration
- 17.3 Market Share and Competitive Positioning, 2025
- 17.4 Company-Wise Revenue and Product Benchmarking
- 17.5 Production and Service Capacity Benchmarking
- 17.6 Technology, Pricing and Differentiation
- 17.7 Regional Footprint and Distribution Strength
- 17.8 Mergers, Acquisitions and Strategic Alliances
- 17.9 New Entrants and Competitive Threats
- 17.10 Porter's Five Forces and Industry Attractiveness
- 17.11 Competitive Outlook, 2025-2035
Chapter 18 Company Profiles
- 18.1 Company Coverage and Selection Criteria
- 18.2 Dornier MedTech
- 18.2.1 Business Description
- 18.2.2 Company Ownership and Geographic Presence
- 18.2.3 Product and Service Portfolio
- 18.2.4 Manufacturing and Operating Footprint
- 18.2.5 Production Capacity and Expansion Plans
- 18.2.6 Financial Performance and Investment
- 18.2.7 Market Share and Competitive Position
- 18.2.8 Technology and Innovation Capabilities
- 18.2.9 Strategic Alliances or Partnerships
- 18.2.10 Recent Developments
- 18.2.11 Growth Strategy and Outlook
- 18.3 Endotherapeutics
- 18.4 St Vincent's Hospital Melbourne
- 18.5 The Prince Charles Hospital
- 18.6 The Wesley Hospital
- 18.7 Other Relevant Market Participants
Note: Every listed company is profiled on the structure shown under the first company. The company list is preliminary and may change based on research findings, market developments, data availability and client requirements.
Chapter 19 Disclaimer
- 19.1 Research and Forecast Disclaimer
- 19.2 Data Source and Estimation Limitations
Note: The depth of individual sections depends on data availability for this market. Volume, capacity, trade and other unit-based metrics are included where applicable.

