
Chronic care, vaccines and safety rules sustain demand
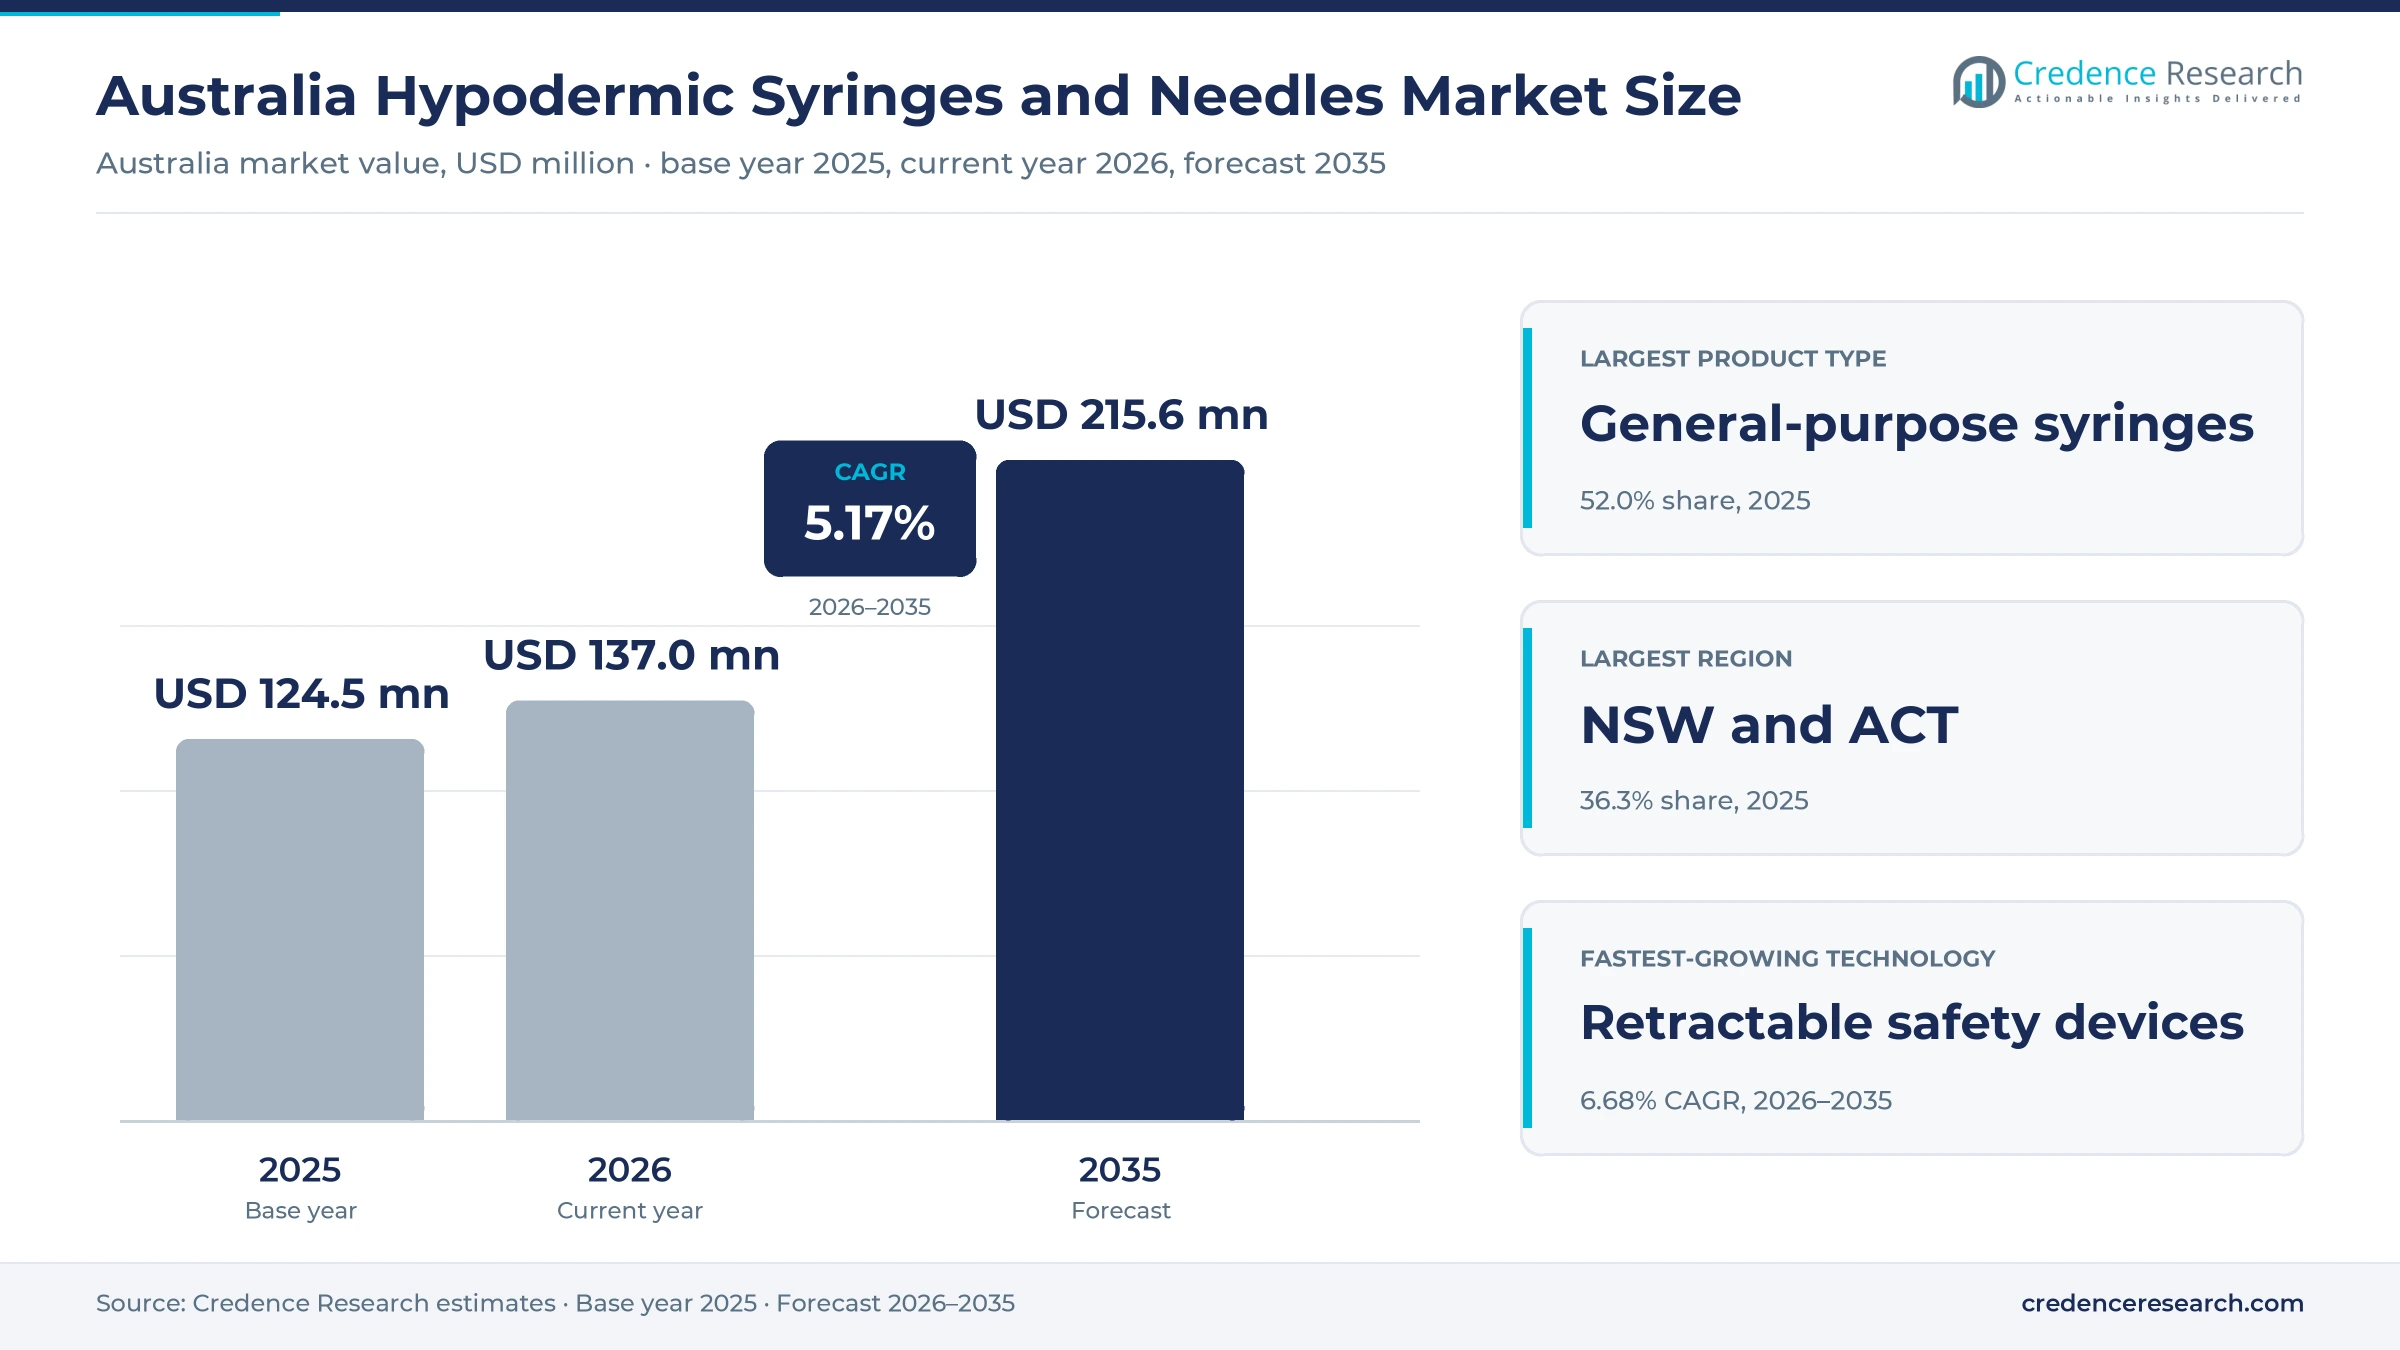
The Australia hypodermic syringes and needles market was valued at USD 124.5 million in 2025 and is projected to increase from USD 137.0 million in 2026 to USD 215.6 million by 2035, registering a CAGR of 5.17% during 2026–2035. Demand comes from hospitals, clinics, pharmacies, aged care homes and public health programs that give injections, draw blood, prepare medicines and supply clean equipment to people who inject drugs. New South Wales and ACT held the largest regional share, 36.3% in 2025, because the zone has the largest population and hospital network. Western and Central Australia is the fastest-growing region at 5.61% a year, as population and vaccination numbers in Western Australia rise quickly. In turn, NSW Health introduced a new guideline on occupational exposure in March 2024 that supports the use of safety-engineered sharps devices.
Which injection devices does the estimate cover?
The estimate measures the value of single-use general-purpose syringes, insulin syringes and standalone hypodermic and pen needles sold in Australia, in conventional, shielded safety and retractable safety designs. It counts purchases by public-sector buyers, private healthcare providers and individual purchasers through public contracts, private provider contracts, pharmacies and online medical stores.
The estimate excludes prefilled syringes sold with a drug, insulin pens and pumps, intravenous catheters and needle-free injectors. The value chain runs from overseas manufacturers through Australian subsidiaries, medical distributors and state purchasing agencies to hospitals, pharmacies, aged care homes and patients.
Australia Hypodermic Syringes and Needles Market Insights
- The Australia hypodermic syringes and needles market was valued at USD 124.5 million in 2025 and is projected to reach USD 215.6 million by 2035, registering a CAGR of 5.17% during 2026–2035.
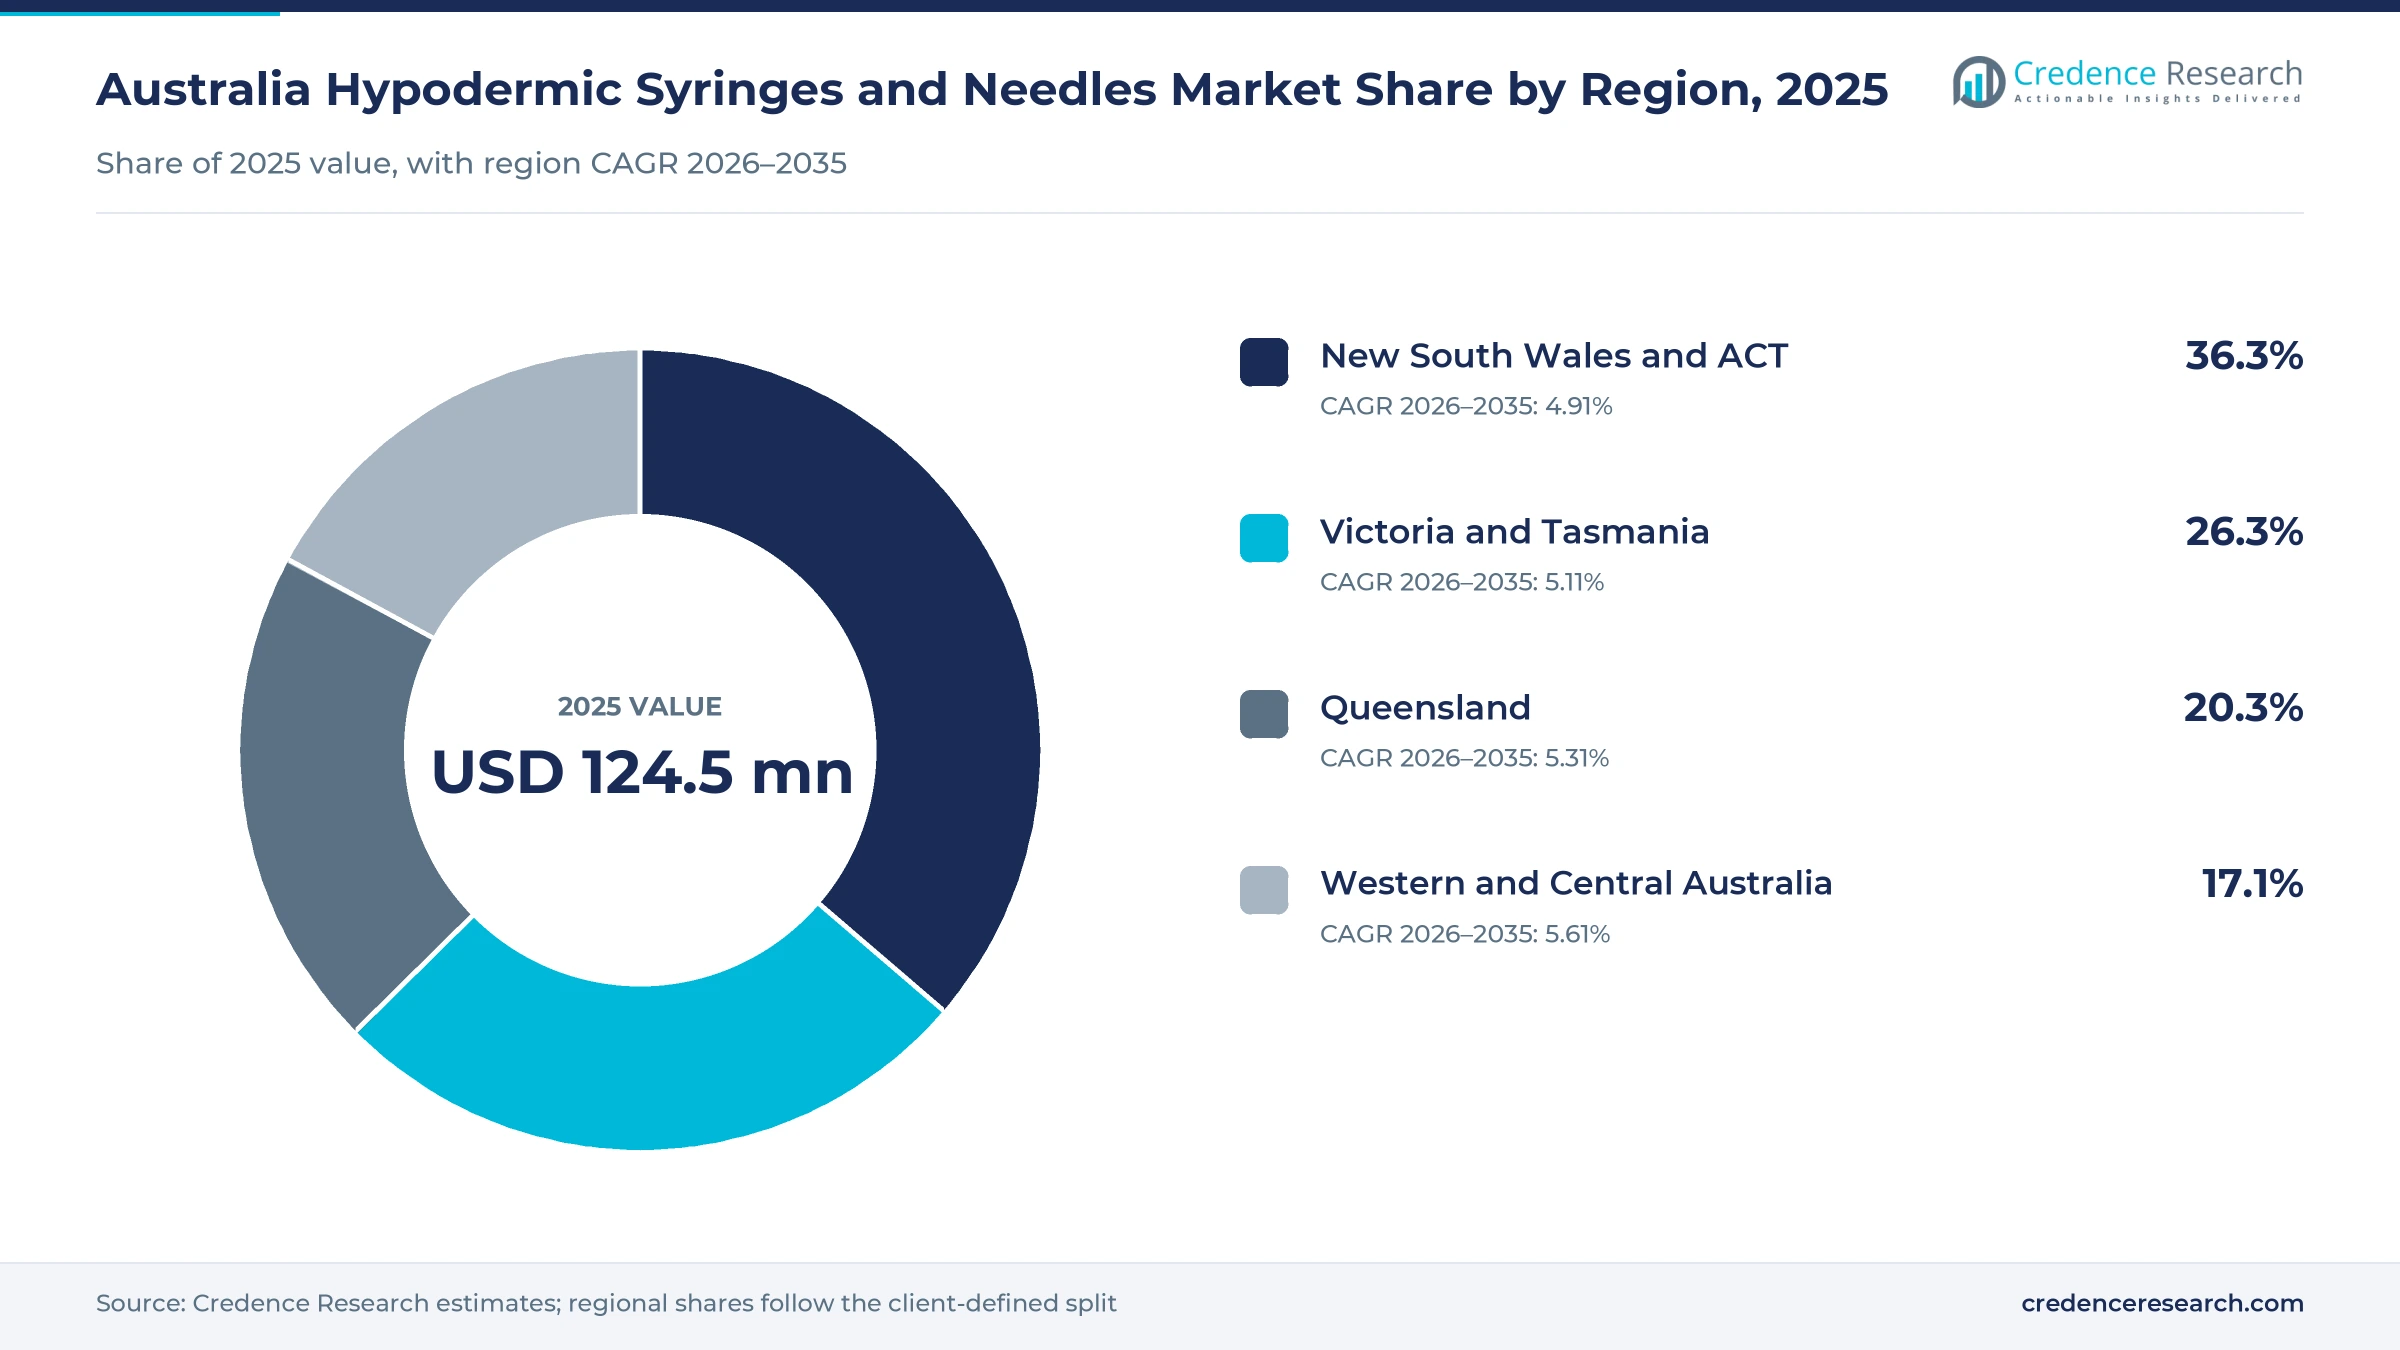
- New South Wales and ACT held a 36.3% share of 2025 value, because the zone has the most people, hospitals and vaccination episodes.
- General-purpose syringes led with a 52.0% share of 2025 value, because hospitals use them for injections, blood draws and medicine preparation every day.
- Australian needle and syringe programs distributed 64.4 million needles and syringes in 2024/25 through 4,612 outlets, according to national program data.
- Retractable safety devices grow fastest at 6.68% a year during 2026–2035, as health services adopt safety-engineered sharps to cut needlestick injuries.
General syringes lead while needles and safety devices rise
Why do general-purpose syringes lead value?
Based on product type, the market is categorized into general-purpose syringes, insulin syringes and standalone needles. General-Purpose Syringes led with a 52.0% share of 2025 value, because hospitals and clinics use them for injections, blood draws and medicine preparation. Standalone Needles grow fastest at 5.78% a year, as safety needles and pen needles gain use in hospitals, pharmacies and homes.
How do hospitals and home care split device use?
Based on care setting, the market is categorized into hospitals and clinics, ambulatory care and pharmacies, home and aged care, and public health and clinical research. Hospitals and Clinics led with a 48.0% share of 2025 value, because they give the most injections and infusions. Home and Aged Care grows fastest at 5.93% a year, as an older population receives more care at home and in aged care homes.
Why does therapeutic injection lead applications?
Based on application, the market is categorized into therapeutic injection, immunization, harm reduction and medication preparation and clinical testing. Therapeutic Injection led with a 42.0% share of 2025 value, because insulin, antibiotics and other injected medicines need daily doses. Therapeutic Injection grows fastest at 5.54% a year, as more patients with diabetes and other chronic conditions inject treatment at home.
How fast are safety designs replacing conventional devices?
Based on technology, the market is categorized into conventional devices, shielded safety devices and retractable safety devices. Conventional Devices led with a 58.0% share of 2025 value, because they cost less and remain standard for many uses outside hospitals. Retractable Safety Devices grow fastest at 6.68% a year, as health services adopt safety-engineered sharps to protect staff.
| Segment Group | Leading Sub-segment | Share, 2025 | Fastest-growing Sub-segment | CAGR, 2026–2035 |
|---|---|---|---|---|
| By Product Type | General-Purpose Syringes | 52.0% | Standalone Needles | 5.78% |
| By Care Setting | Hospitals and Clinics | 48.0% | Home and Aged Care | 5.93% |
| By Application | Therapeutic Injection | 42.0% | Therapeutic Injection | 5.54% |
| By Technology | Conventional Devices | 58.0% | Retractable Safety Devices | 6.68% |
Request a Free Sample
Fill in your details and we'll send you a free sample report.
- Sample data tables & charts
- Research methodology
Diabetes care, safety buying and public health lift volumes
How does chronic disease treatment lift injection volumes?
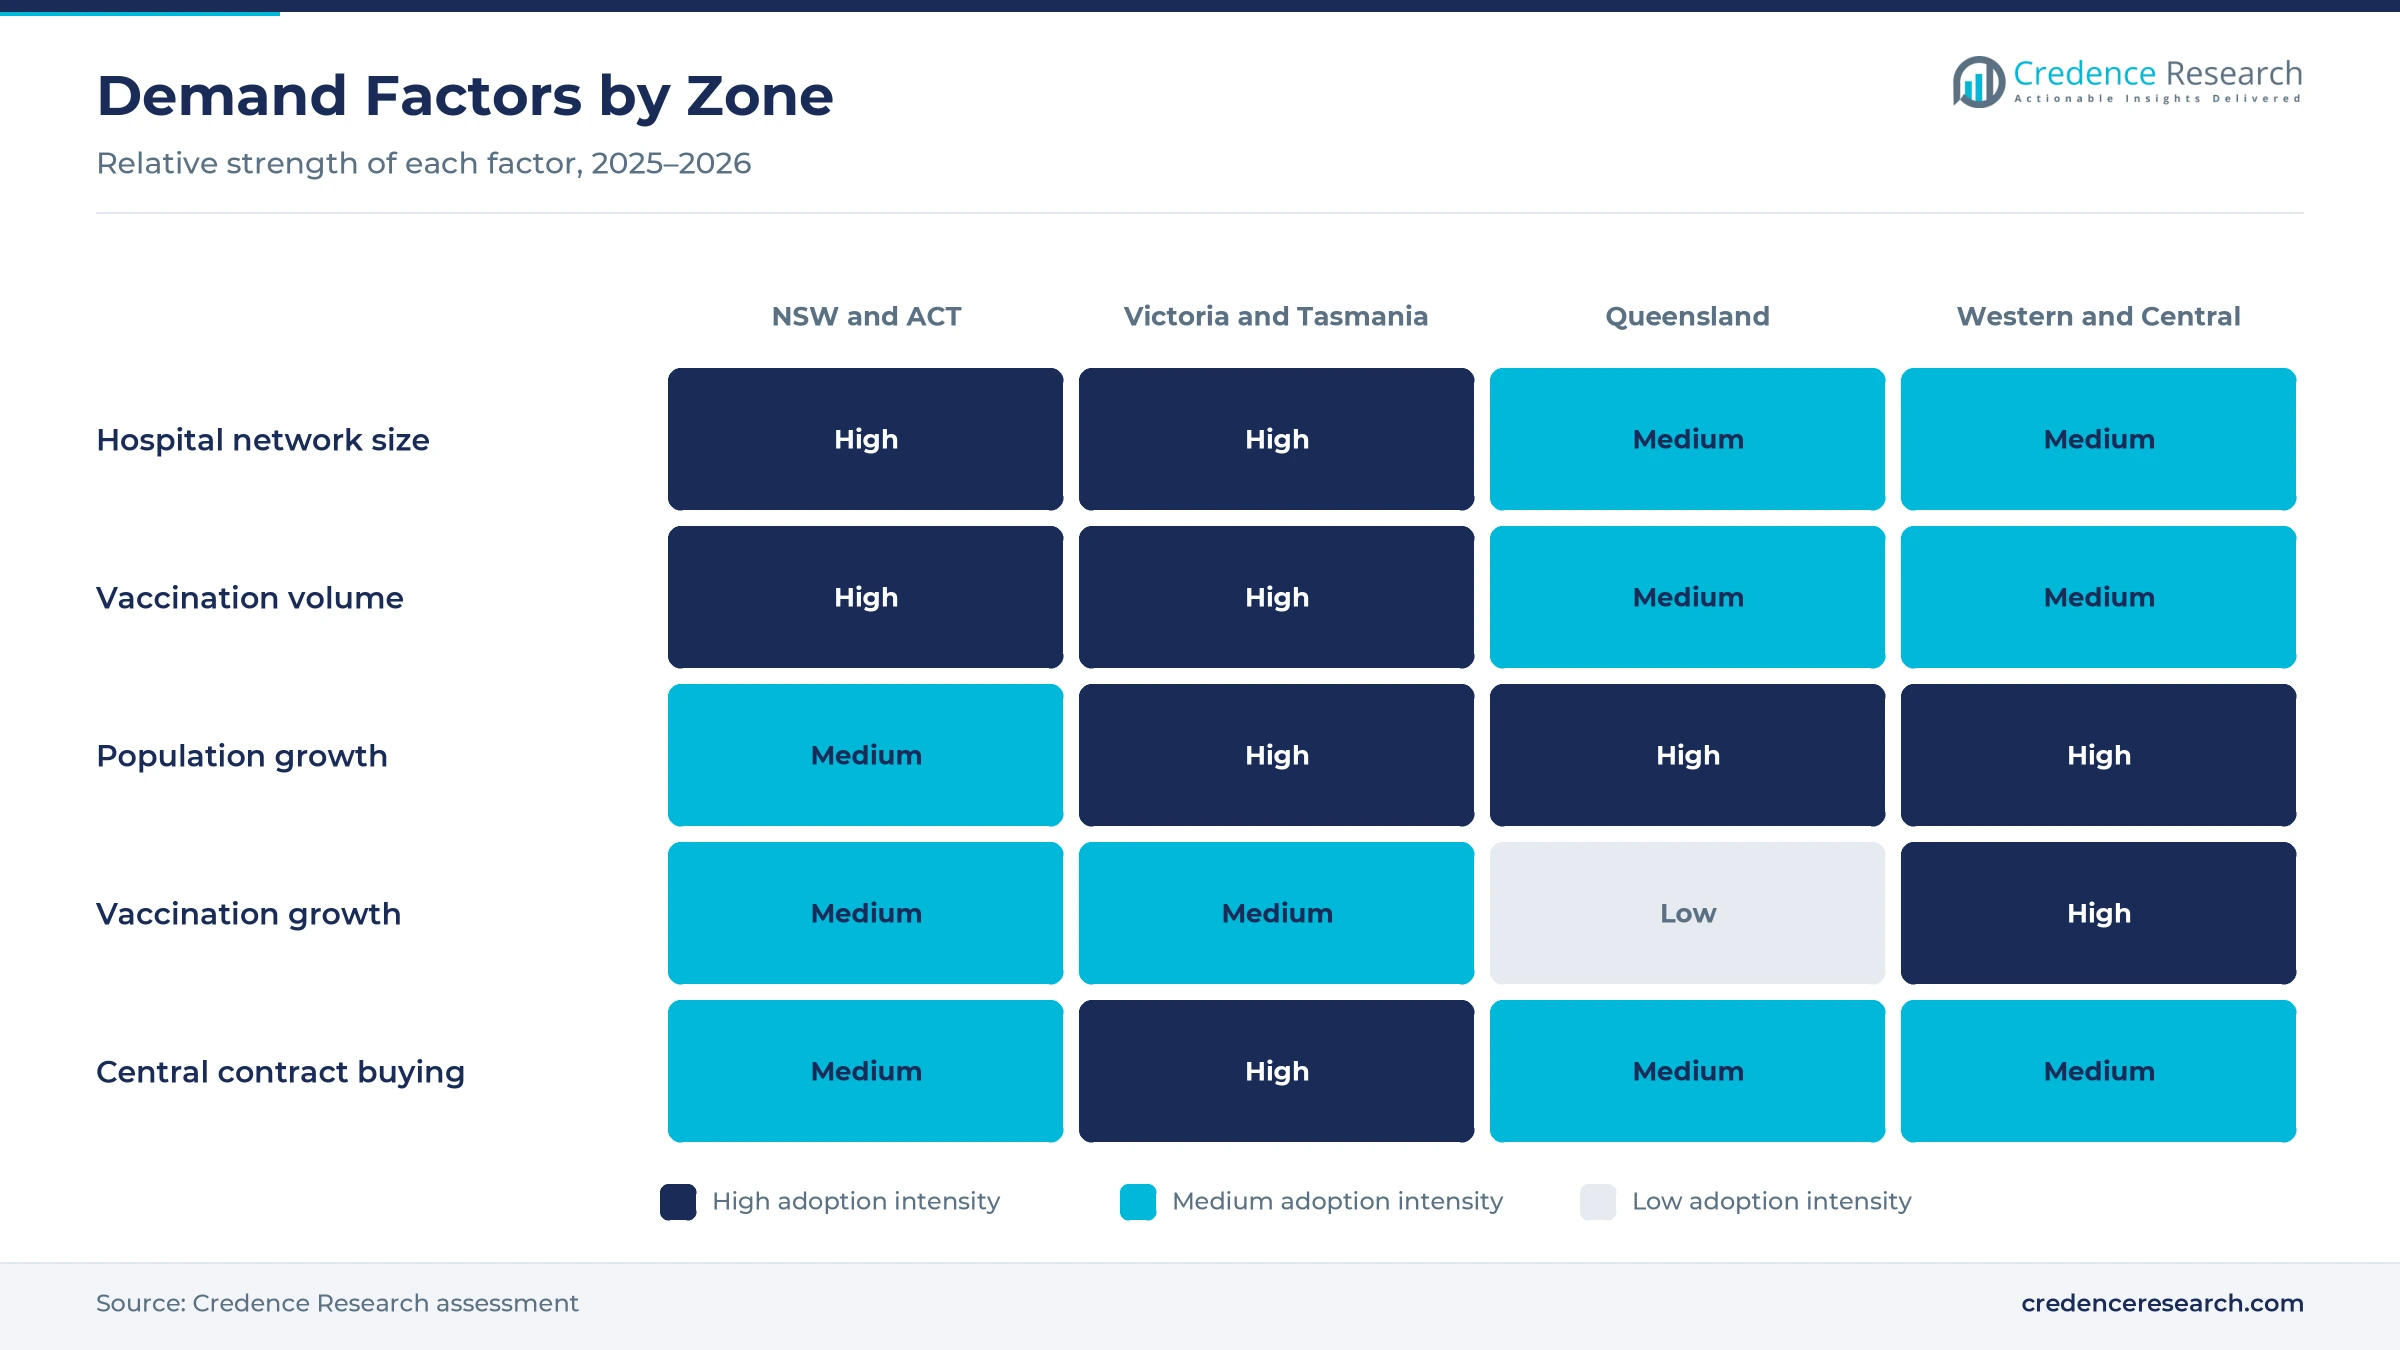
Chronic disease treatment lifts injection volumes, because people with diabetes and other long-term conditions need regular injected medicines. Diabetes affected 7.4% of Australians aged 20 to 79 in 2024, according to the World Bank. People registered with the National Diabetes Services Scheme receive syringes and pen needles free, with up to 1,200 units every 180 days. People aged 65 and over also made up 18.1% of the population in 2025, which raises demand for injected therapies, blood tests and vaccines in clinics, pharmacies and homes. As a result, therapeutic injection holds 42.0% of 2025 value, while sales of human insulin and related injectables keep pharmacy demand steady.
Why does clinical safety procurement shape demand?
Clinical safety procurement shapes demand, because state purchasing agencies now list safety products alongside conventional devices. The Victorian hypodermic needles and syringes contract ran from Oct. 1, 2022, to Sept. 30, 2026, with one two-year option still available. It covers safety hypodermic needles, safety syringes, safety insulin syringes and safety insulin pen needles for public hospitals. NSW Health also issued a guideline on March 7, 2024, stating that safety-engineered sharps devices help cut sharps injuries. In turn, shielded and retractable safety devices gain share each year, because hospitals must trial new devices in the target area and review them within 12 months of introduction.
How does recurring public health demand support volumes?
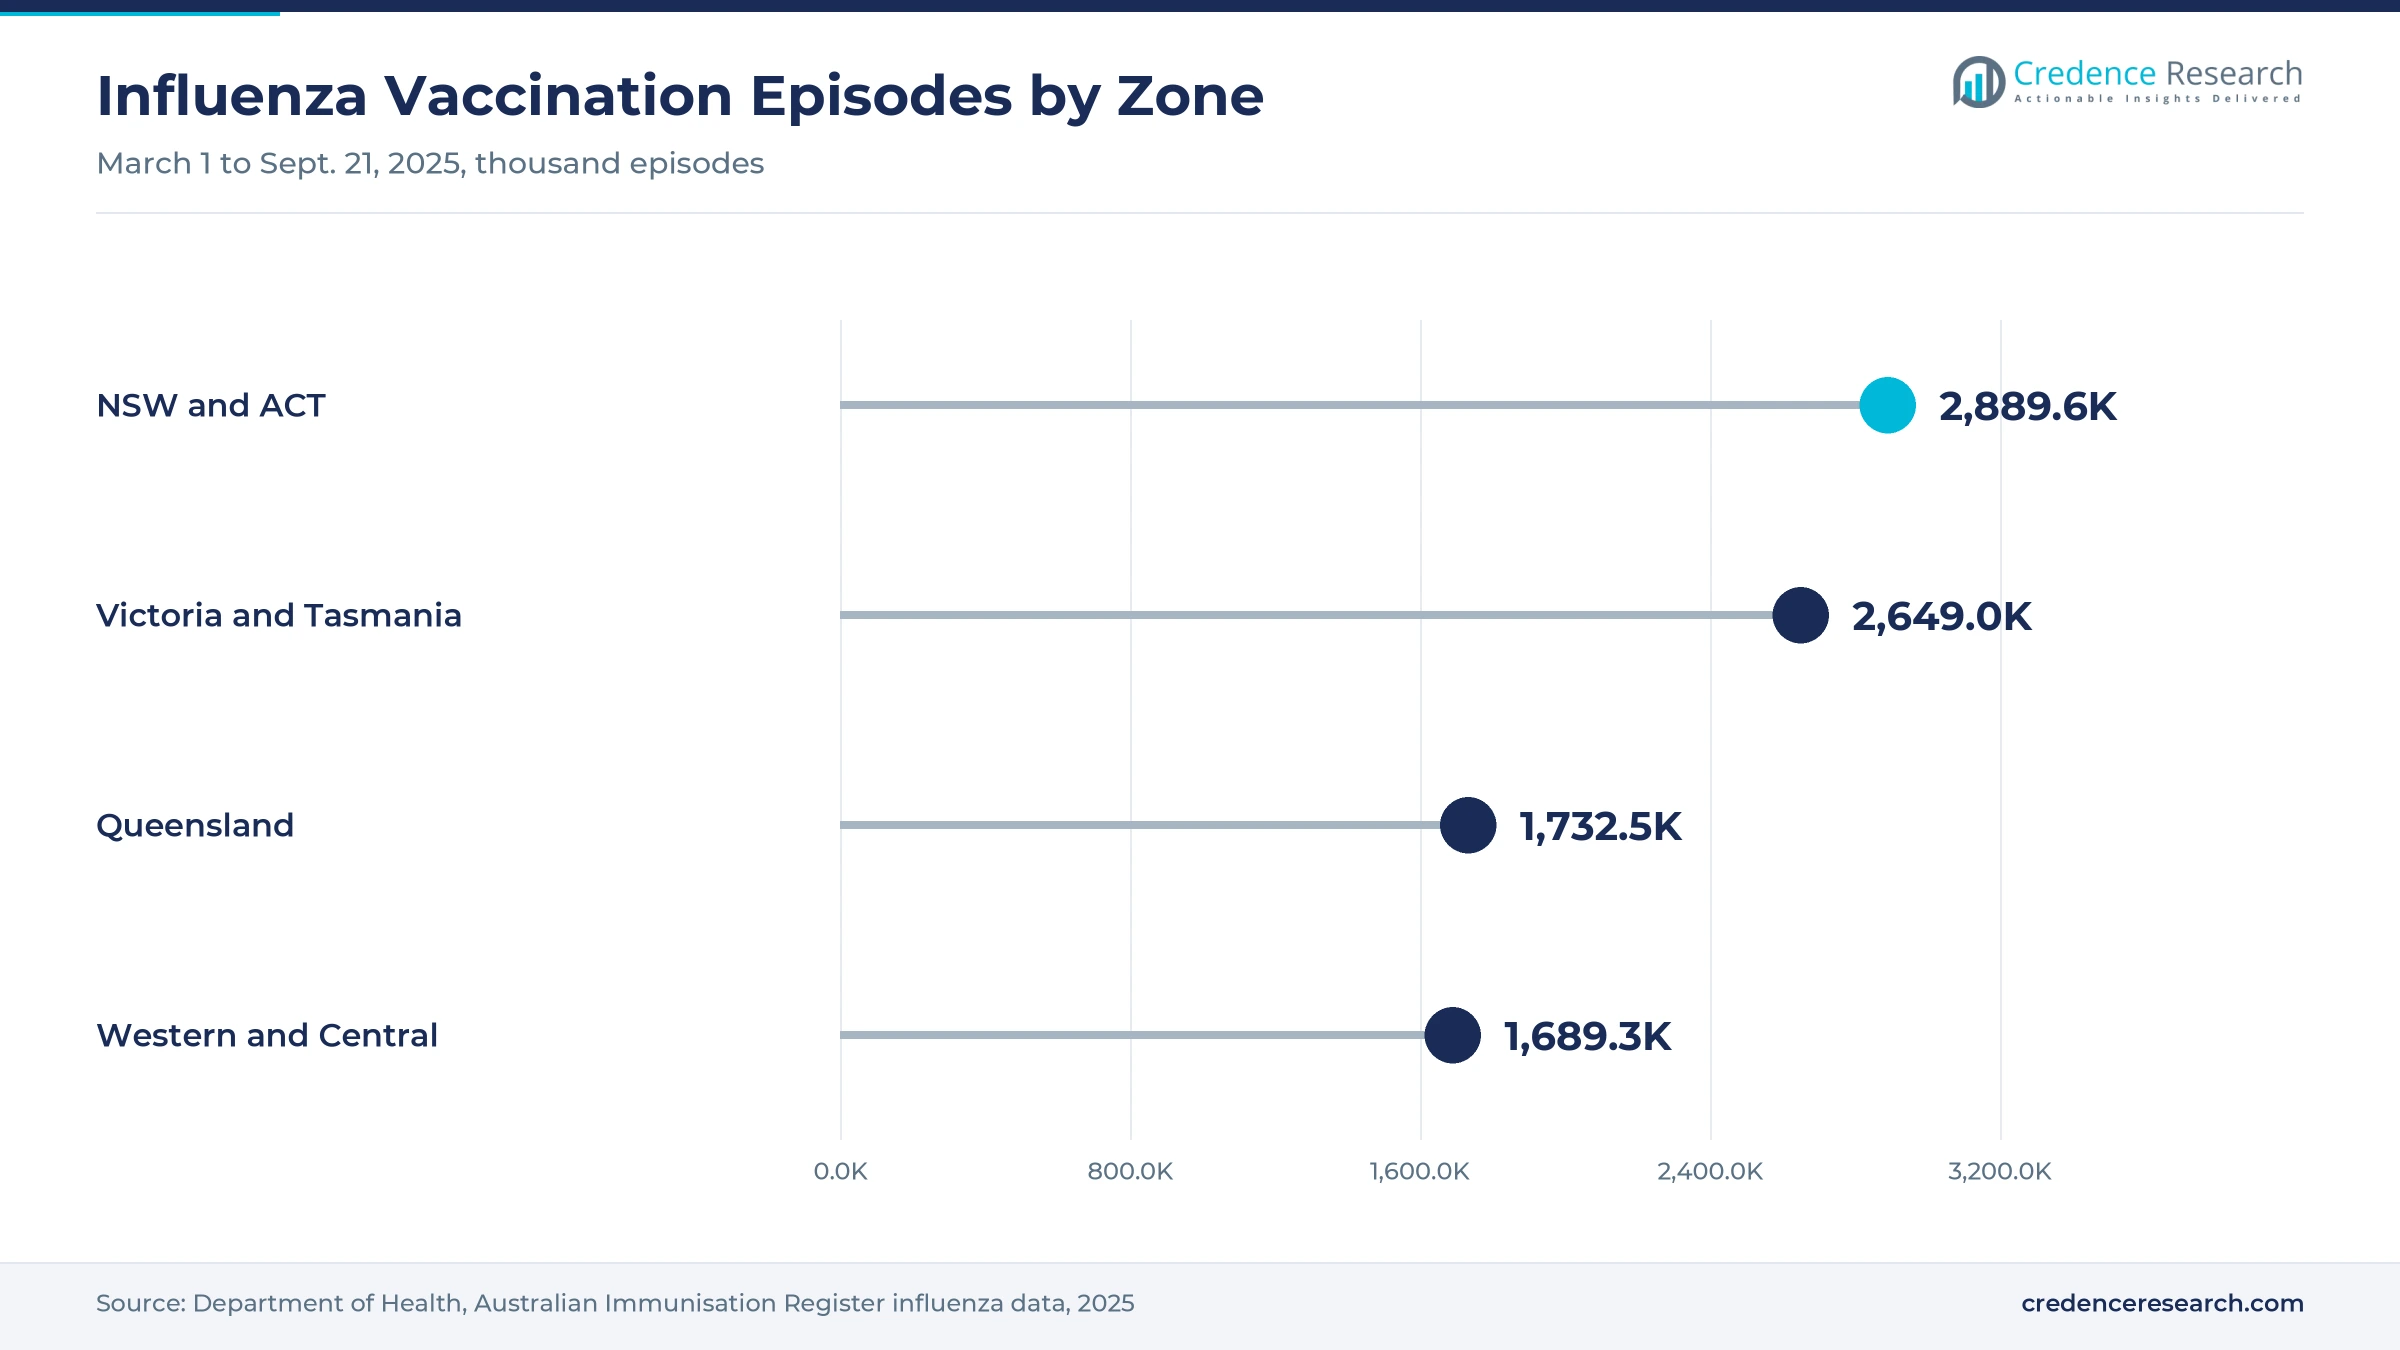
Recurring public health demand supports volumes, because every vaccination season needs millions of needles and syringes. Australian providers recorded 8,960,904 influenza vaccination episodes from March 1 to Sept. 21, 2025, up 2.2% on 2024, according to the Department of Health. Western Australia recorded the largest rise, at 8.4%, while New South Wales recorded 2,683,712 episodes, the most of any state. The federal government also expanded the National Immunisation Program to include COVID-19 vaccines on Oct. 1, 2026, with adults aged 75 and over eligible for two doses a year. As a result, immunization holds a steady place, while programs such as pneumococcal vaccines add further injections each year.
Why do harm reduction programs add stable volumes?
Harm reduction programs add stable volumes, because state and territory health departments fund clean injecting equipment to prevent hepatitis C, HIV and other blood-borne infections. Australian programs distributed 64.4 million needles and syringes in 2024/25, according to the Kirby Institute. The national network had 4,612 outlets in 2025, including 3,134 pharmacy outlets and 458 syringe dispensing machines. Coverage reached 136% in 2024/25, or 889 needles and syringes per person who injects drugs each year. That coverage is more than four times the international high-coverage threshold. In turn, harm reduction gives suppliers large, regular public orders and states buy matching sharps containers for safe disposal.
Safety designs, pharmacies and vaccine changes shape use
How is the shift to safety-engineered sharps changing buying?
The shift to safety-engineered sharps is changing buying, because hospitals must reduce needlestick injuries among staff. NSW Health guideline GL2024_002, issued on March 7, 2024, says contaminated needle injuries are the main route of blood-borne virus exposure. It requires a sharps injury prevention program and a review of new safety devices within 12 months. The Victorian contract also lists at least 5 safety product types, from safety hypodermic needles and safety syringes to safety insulin syringes and safety pen needles. As a result, retractable safety devices grow fastest at 6.68% a year, while conventional devices keep 58.0% of 2025 value because they still cost less.
Why is the rise of pharmacy access notable?
The rise of pharmacy access is notable, because community pharmacies now supply both diabetes and harm reduction users. NDSS access points are usually community pharmacies, and out-of-stock products normally arrive within 24 to 48 hours. Pharmacies also made up 3,134 of the 4,612 needle and syringe program outlets across Australia in 2025, far more than any other outlet type. Registered NDSS users can also order up to a 6-month supply of syringes and pen needles before they travel overseas. In turn, ambulatory care and pharmacies grow faster than hospitals, and suppliers sell more boxed retail packs, insulin syringes, pen needles and diabetes care devices through pharmacy wholesalers.
Can the COVID-19 vaccine move to the national program open demand?
The COVID-19 vaccine move to the national program can open demand, because states now order and distribute these vaccines like other routine doses. The transition took effect on Oct. 1, 2026, replacing the standalone COVID-19 vaccine program. Adults aged 75 and over can receive 2 free doses a year, while adults aged 65 to 74 can receive 1 dose a year. Aboriginal and Torres Strait Islander people aged 50 to 74 also receive 1 dose a year. As a result, public health buyers can plan needle and syringe orders alongside influenza stock, which gives suppliers more predictable seasonal volumes across general practices, pharmacies and aged care homes.
Is there room to grow as public contracts are renewed?
Suppliers have room to grow as public contracts are renewed, because large state agreements set brands and prices for years. The principal period of the Victorian contract ended on Sept. 30, 2026, after four years, with one 2-year option left. The contract covers at least 16 product categories, from blunt and filter needles to catheter tip syringes. The Victorian supply agreement started on Oct. 1, 2022, and covered all Victorian public hospitals and health services. NSW Health also asks services to trial safety devices in the target area before wider use. In turn, suppliers with safety ranges, local stock and clinical trial support can win share, because public-sector buyers control most hospital volume in each state.
Tender pricing, waste rules and device costs test suppliers
How does tender pricing squeeze margins?
Tender pricing squeezes margins, because state purchasing agencies buy large volumes under multi-year contracts with fixed prices. As a result, suppliers of conventional syringes compete mostly on price and reliable delivery. Companies respond with safety ranges, bundled product lines and local warehousing, which help them win contracts on value rather than unit cost alone. Smaller suppliers often find it hard to meet the service terms of state contracts.
Why do safety device costs slow adoption?
Safety device costs slow adoption, because shielded and retractable designs cost more than conventional syringes and needles. In turn, clinics, aged care homes and community programs with tight budgets keep buying standard devices for many uses. Suppliers respond with injury cost data, staff training and trial stock, which help buyers compare the full cost of needlestick injuries against higher unit prices over a year of use.
How do sharps waste rules add cost?
Sharps waste rules add cost, because every used needle must go straight into a rigid, puncture-resistant container at the point of use. As a result, hospitals, pharmacies and needle programs pay for containers, collection and treatment of clinical waste. Suppliers respond with integrated safety devices and smaller packs, which reduce handling and help buyers meet state rules on safe disposal of used sharps in every care setting.
Why does import dependence create supply risk?
Import dependence creates supply risk, because most syringes and needles sold in Australia are made overseas and shipped through a few distributors. In turn, freight delays or factory problems can cause shortages during busy vaccination seasons. Buyers respond with buffer stock, multiple approved brands and longer supply contracts, which keep hospitals and programs supplied when shipments arrive late or demand rises suddenly.
NSW and ACT lead as Western and Central Australia rises
| Region | Value, 2025 (USD million) | Share, 2025 | CAGR, 2026–2035 |
|---|---|---|---|
| New South Wales and ACT | 45.2 | 36.3% | 4.91% |
| Victoria and Tasmania | 32.7 | 26.3% | 5.11% |
| Queensland | 25.3 | 20.3% | 5.31% |
| Western and Central Australia | 21.3 | 17.1% | 5.61% |
Why do New South Wales and the ACT hold the top share?
New South Wales and ACT held a 36.3% share of 2025 value and grow at 4.91% a year, because the zone has the largest population and hospital network. New South Wales recorded 2,683,712 influenza vaccination episodes from March to September 2025, the most of any state. The ACT recorded a further 205,914 episodes in the same period, up 5.8% on 2024. As a result, the zone leads hospital, pharmacy and vaccination demand, and Sydney hospitals buy the largest volumes of safety devices in the country.
How do Victoria and Tasmania support demand?
Victoria and Tasmania held a 26.3% share of 2025 value and grow at 5.11% a year, because Melbourne has a dense network of public and private hospitals. Victoria recorded 2,427,960 influenza vaccination episodes in the 2025 season, up 3.0%. Tasmania recorded a further 221,075 episodes in the same season, up 2.2%. Victorian public hospitals also buy needles and syringes through a single state contract, which concentrates volume with awarded suppliers and makes each renewal important for brand shares.
What shapes demand in Queensland?
Queensland held a 20.3% share of 2025 value and grows at 5.31% a year, because the state gains residents through interstate and overseas migration. Queensland added about 90,100 people in the year to March 2026. However, it was the only state where influenza vaccination episodes fell in 2025, by 1.1% to 1,732,463, which shows how seasonal demand can vary. Population growth in Brisbane and south-east Queensland still adds hospital and pharmacy volume each year.
Why is Western and Central Australia growing fastest?
Western and Central Australia held a 17.1% share of 2025 value and grows fastest at 5.61% a year, because Western Australia had the fastest population growth of any state, at 2.1%, in the year to March 2026. Western Australian influenza vaccination episodes also rose 8.4% in 2025. As a result, hospitals and pharmacies in Perth and Adelaide add steady volume.
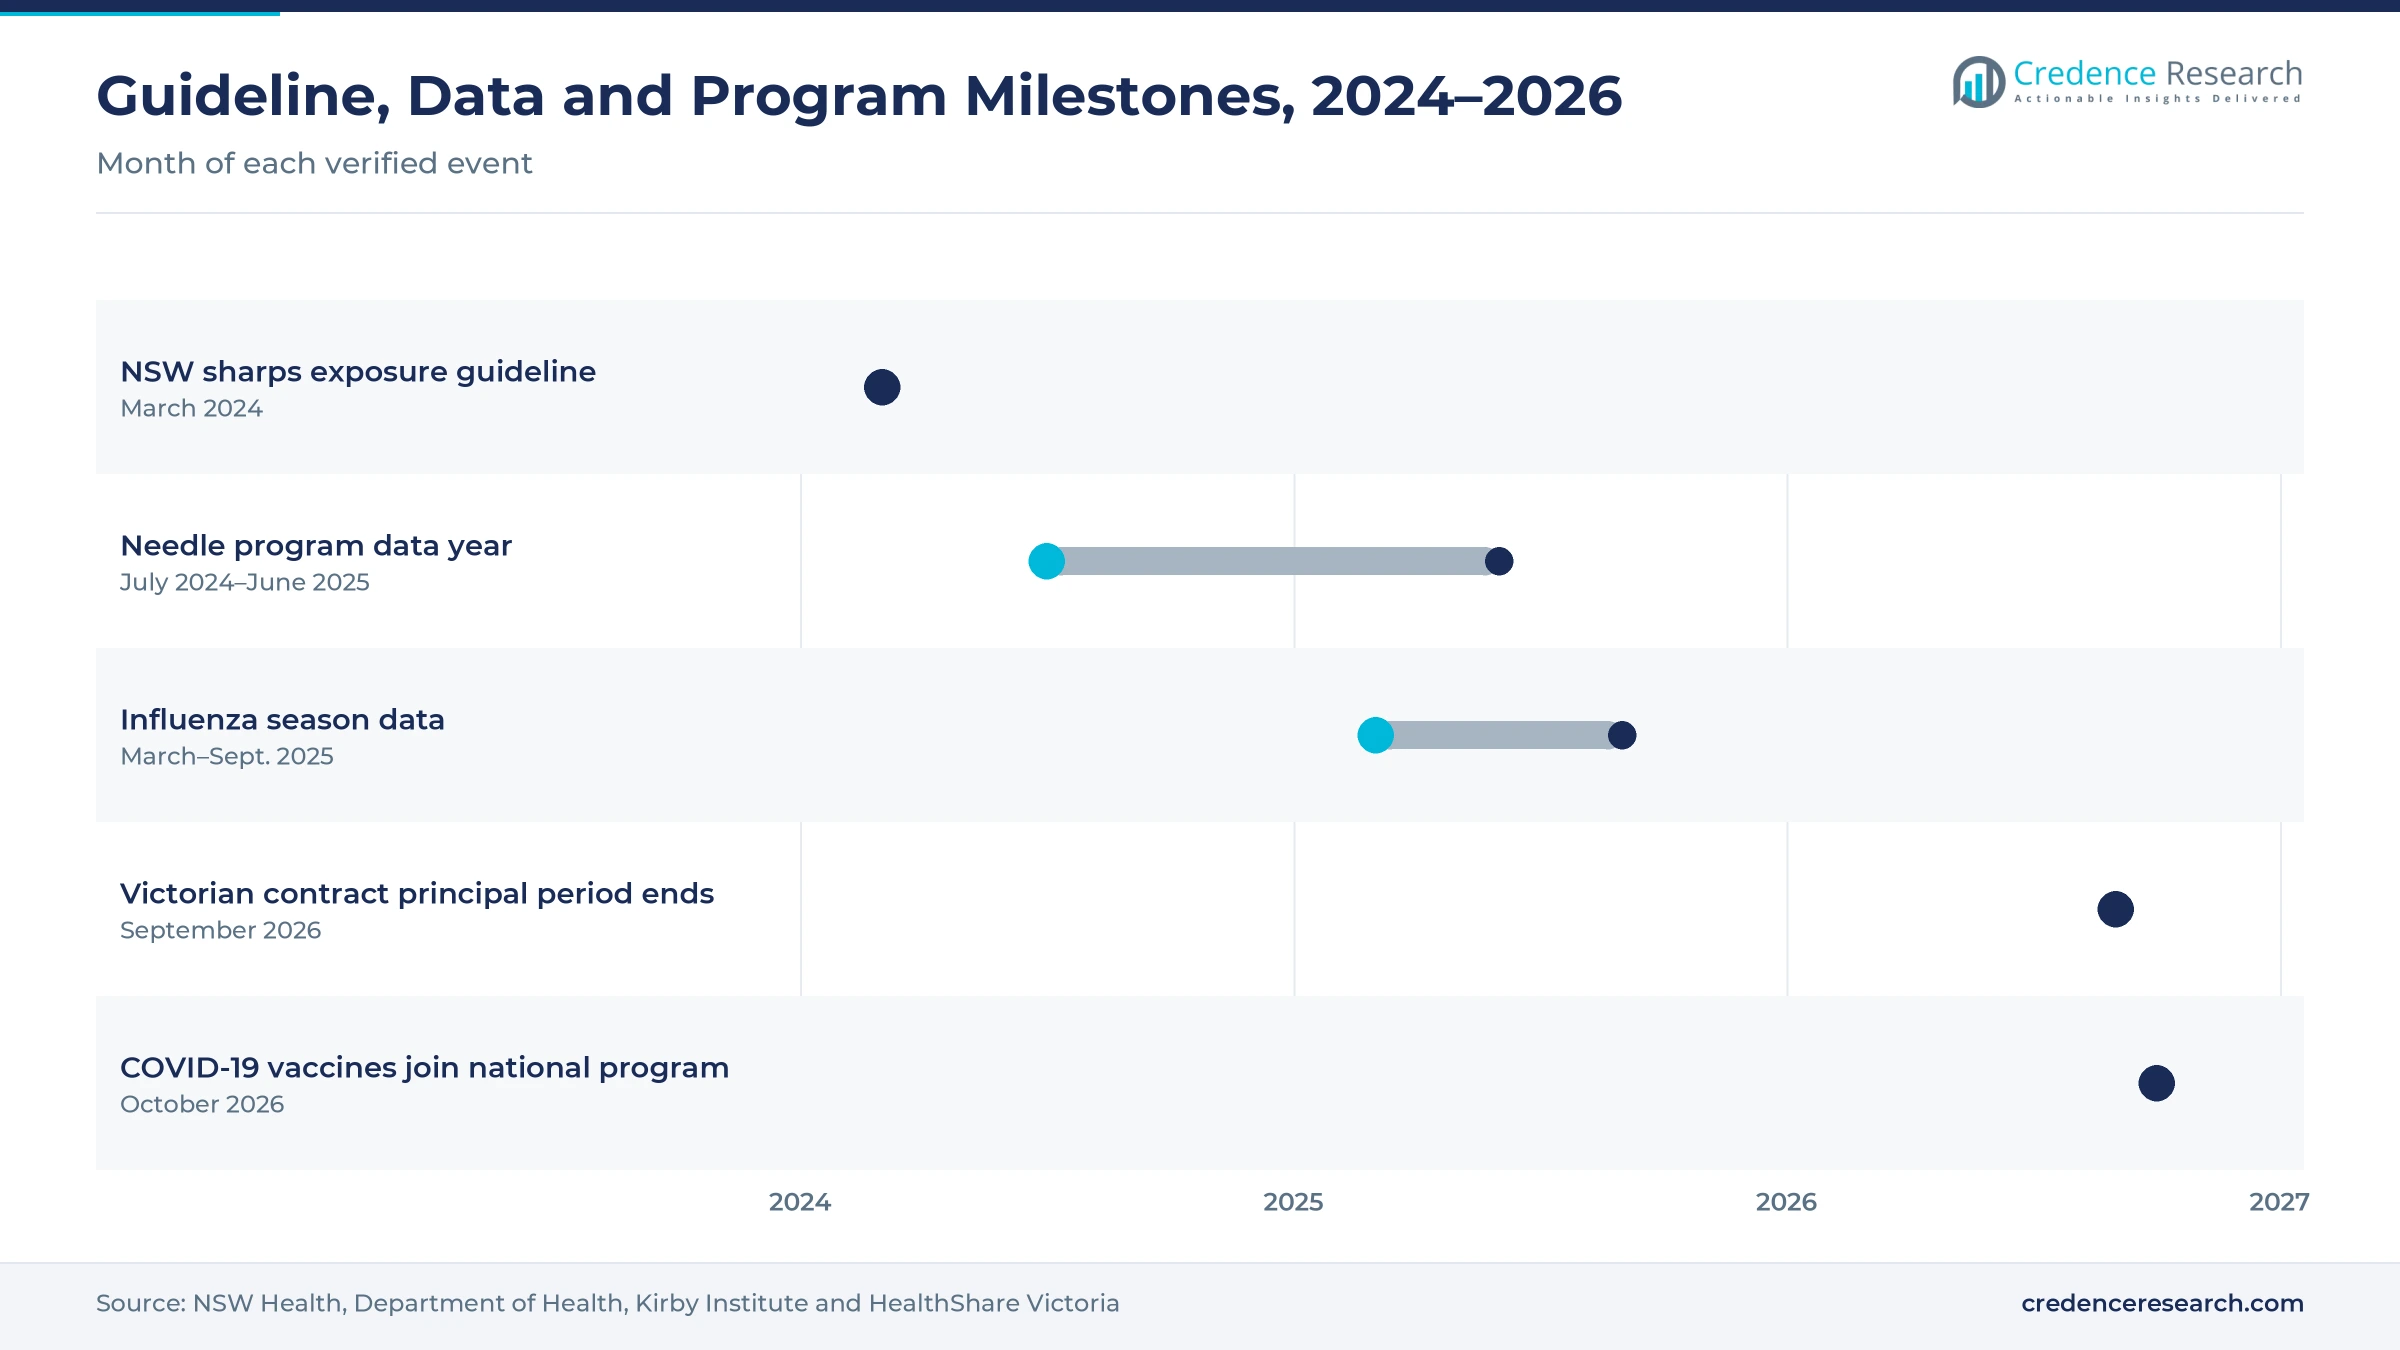
Guidelines, vaccine data and contract milestones, 2024–2026
| Development | Status and market relevance |
|---|---|
| In March 2024, NSW Health introduced a guideline on blood and body substance exposure that supports safety-engineered sharps devices. | Requires review of new devices within 12 months |
| In September 2025, federal data showed 8,960,904 influenza vaccination episodes from March 1 to Sept. 21, 2025. | Up 2.2% on 2024 |
| In September 2026, the principal period of the Victorian hypodermic needles and syringes supply agreement ended after four years. | One two-year option remains |
| In October 2026, the federal government expanded the National Immunisation Program to include COVID-19 vaccines, with states handling ordering. | Adds routine seasonal injections |
Shielded and retractable designs cut sharps injuries
- Conventional devices use a standard barrel, plunger and exposed needle, which keeps unit costs low and suits many routine uses in clinics and community programs.
- Shielded safety devices cover the needle with a hinged or sliding shield after use, which lowers the risk of needlestick injuries without changing the injection technique.
- Retractable safety devices pull the needle back into the barrel once the dose is given, which removes most exposure to the sharp and prevents reuse.
Need a Custom Version of This Report?
Tailor the scope, geography, or segments to your exact requirements.
- Custom geography or segment scope
- Direct access to our analyst team
Global makers compete through tenders and distributors
Competition is led by global device makers that supply Australian hospitals, pharmacies and programs through local subsidiaries and medical distributors. Terumo syringes are sold to Australian healthcare businesses in sizes from 1 mL to 60 mL, with luer lock, luer slip, catheter and eccentric tip options. Braun Omnifix three-piece syringes are available through Australian laboratory and medical suppliers, while Nipro insulin syringes with fixed 27G and 29G needles are sold by Australian medical retailers. Rivals compete on safety features, needle comfort, reliable supply and price. Because state purchasing agencies decide which brands public hospitals buy, suppliers with full safety ranges and local stock win more contracts. Distributors also help brands reach pharmacies, aged care homes and general practices that order in smaller volumes.
Which companies supply Australian buyers?
| Company | Type | Role in the market |
|---|---|---|
| B. Braun | Global device maker | Omnifix syringes sold through Australian suppliers |
| Terumo | Global device maker | Syringes from 1 mL to 60 mL sold to Australian healthcare businesses |
| Nipro | Global device maker | Insulin syringes with fixed needles sold by Australian retailers |
Credence Research view on injection device demand
Credence Research's view is that Australian demand for syringes and needles will grow steadily because chronic disease care, vaccination and harm reduction create repeat use every year. General-purpose syringes remain the largest value pool, while safety designs add the fastest growth as hospitals act on needlestick injury guidance. Contract renewals in the larger states will decide which brands gain share. Suppliers with full safety ranges, reliable local stock and pharmacy reach should gain the most, while tender pricing keeps margins tight.
How the national injection device estimate was built
The report uses 2025 as the base year on a calendar basis, and market values come from the Credence Research model. That model combines vaccination statistics, needle and syringe program data, public procurement documents, health department guidelines, population statistics and supplier product listings. Segment splits and zone growth rates are Credence Research estimates, while zone shares follow the client-defined split. Sources used are official statistics, government publications, research institute program data and supplier listings, and no interviews or surveys were used.
Safety devices and home care carry growth to 2035
Device value is expected to reach USD 215.6 million by 2035, a 5.17% CAGR during 2026–2035, as Australians need more injected treatment, vaccination and harm reduction services. Growth should be strongest in safety devices, home care and pharmacy channels, because health services and patients move toward safer and more convenient products. Public contract renewals will shape brand shares in each state. Stronger safety rules would speed the shift away from conventional devices, while tight budgets could slow it.
Frequently Asked Questions
How big is the Australia hypodermic syringes and needles market?
Which product type leads Australian value?
Which region leads the Australian market?
How many needles and syringes do Australian harm reduction programs supply?
How many influenza vaccinations were given in Australia in 2025?
Which technology is growing fastest?
Who are the leading companies in the Australian market?
What are the main challenges for suppliers?
Table of Content
Chapter 1 Market Segmentation
- 1.1 Segmentation Framework
- 1.1.1 Product and Service Classification
- 1.1.2 Application and End-Use Classification
- 1.1.3 Technology and Solution Classification
- 1.1.4 Customer and Distribution Channel Classification
- 1.1.5 Geographic Segmentation
- 1.1.6 Market Segment Definitions and Boundaries
- 1.2 By Product Type
- 1.2.1 General-Purpose Syringes
- 1.2.2 Insulin Syringes
- 1.2.3 Standalone Needles
- 1.3 By Care Setting
- 1.3.1 Hospitals and Clinics
- 1.3.2 Ambulatory Care and Pharmacies
- 1.3.3 Home and Aged Care
- 1.3.4 Public Health and Clinical Research
- 1.4 By Application
- 1.4.1 Therapeutic Injection
- 1.4.2 Immunisation
- 1.4.3 Harm Reduction
- 1.4.4 Medication Preparation and Clinical Testing
- 1.5 By Technology
- 1.5.1 Conventional Devices
- 1.5.2 Shielded Safety Devices
- 1.5.3 Retractable Safety Devices
Chapter 2 Introduction
- 2.1 Report Objectives and Scope
- 2.2 Product Definition and Industry Terminology
- 2.3 Market Inclusions and Exclusions
- 2.4 Research Process
- 2.4.1 Primary Research and Expert Interviews
- 2.4.2 Secondary Research and Source Review
- 2.4.3 Top-Down and Bottom-Up Estimation
- 2.4.4 Data Triangulation and Verification
- 2.5 Market Size Measurement Basis
- 2.5.1 2025: USD 124.5 million → 2035: USD 215.6 million
- 2.6 Historical and Forecast Reference Periods
- 2.6.1 Historical Period: 2018-2025
- 2.6.2 Base Year: 2025
- 2.6.3 Forecast Period: 2025-2035
- 2.7 Research Assumptions and Limitations
Chapter 3 Executive Summary
- 3.1 Market Snapshot and Key Findings
- 3.2 Base-Year Market Size, 2025
- 3.3 Forecast Market Size, 2035
- 3.4 Revenue and Volume Growth Outlook
- 3.5 Key Demand and Supply Indicators
- 3.6 Leading Market Segments
- 3.7 Fastest-Growing Market Opportunities
- 3.8 Regional Performance Highlights
- 3.9 Technology and Industry Transformation
- 3.10 Competitive Landscape Summary
- 3.11 Analyst View and Strategic Implications
Chapter 4 Australia Hypodermic Syringes and Needles Market Trends and Developments
- 4.1 Historical Industry Development, 2018-2025
- 4.2 Recent Market Trends and Developments
- 4.3 Demand and Customer Behavior Trends
- 4.4 Technology and Product Innovation
- 4.5 Artificial Intelligence, Automation and Digitalization
- 4.6 Local Manufacturing and Supply Chain Realignment
- 4.7 Industry Partnerships, Mergers and Acquisitions
- 4.8 Sustainability and Circular Economy Developments
- 4.9 Government and Private Sector Investment Trends
- 4.10 Emerging Business Models and Commercialization
- 4.11 Industry Developments and Announcements
Chapter 5 Australia Hypodermic Syringes and Needles Market Production, Supply and Demand Analysis
- 5.1 Demand Trend and Consumption Analysis, 2018-2025
- 5.2 Demand Forecast, 2025-2035
- 5.3 Production and Output Trend, 2018-2025
- 5.4 Production and Output Forecast, 2025-2035
- 5.5 Installed Capacity and Capacity Utilization
- 5.6 Company-Wise Production Plants and Statistics
- 5.6.1 Installed Production Capacity
- 5.6.2 Actual Production
- 5.6.3 Planned Capacity and Expansion Targets
- 5.7 Supply Chain Structure and Procurement Trends
- 5.8 Supply-Demand Gap and Bottlenecks
- 5.9 Import Dependence and Sourcing Structure
- 5.10 Contract Manufacturing and Outsourcing
- 5.11 Regional Supply and Demand Concentration
Chapter 6 Australia Hypodermic Syringes and Needles Market Pricing Analysis
- 6.1 Pricing Structure and Measurement
- 6.2 Historical Pricing Trends, 2018-2025
- 6.3 Pricing Outlook, 2025-2035
- 6.4 Average Selling Price and Unit Economics
- 6.5 Pricing by Product and Market Segment
- 6.6 Geographic Pricing Differences
- 6.7 Key Input, Energy, Labor and Logistics Costs
- 6.8 Contract Pricing and Purchasing Models
- 6.9 Pricing Sensitivity and Competitive Positioning
- 6.10 Price, Margin and Profitability Implications
Chapter 7 Australia Hypodermic Syringes and Needles Market Dynamics
- 7.1 Market Growth Drivers
- 7.1.1 Demand-Side Drivers
- 7.1.2 Technology and Innovation Drivers
- 7.1.3 Infrastructure and Investment Drivers
- 7.1.4 Regulatory and Policy Drivers
- 7.2 Market Restraints
- 7.2.1 Cost and Affordability Constraints
- 7.2.2 Technology and Adoption Barriers
- 7.2.3 Supply Chain and Operational Constraints
- 7.3 Market Challenges
- 7.3.1 Competitive Pressure and Margin Erosion
- 7.3.2 Skills, Infrastructure and Implementation Gaps
- 7.4 Emerging Market Opportunities
- 7.5 Market Dynamics Impact and Time-Horizon Assessment
Chapter 8 Australia Hypodermic Syringes and Needles Value Chain Analysis
- 8.1 Industry Value Chain Overview
- 8.2 Upstream Suppliers and Critical Inputs
- 8.3 Technology and Component Providers
- 8.4 Manufacturing or Service Delivery
- 8.5 Distribution, Channel Partners and Integrators
- 8.6 Downstream Applications and End Users
- 8.7 Value Addition and Profit Pools
- 8.8 Vertical Integration and Outsourcing
- 8.9 Supplier Concentration and Risk
- 8.10 Supply Chain Localization and Resilience
Chapter 9 Australia Hypodermic Syringes and Needles Market Regulations and Policies
- 9.1 Relevant Laws, Standards and Compliance Frameworks
- 9.2 Product, Service, Safety and Quality Requirements
- 9.3 Government Policies, Incentives and Subsidies
- 9.4 Imports, Exports and Trade Barriers
- 9.5 Public Procurement and Local Content Requirements
- 9.6 Environmental and Sustainability Compliance
- 9.7 Upcoming Policy Changes and Market Implications
Chapter 10 Australia Hypodermic Syringes and Needles Market Hotspots and Opportunities
- 10.1 Market Opportunity Mapping and Growth Hotspots
- 10.2 High-Growth Applications and Customer Groups
- 10.3 Underserved Markets and White-Space Opportunities
- 10.4 Emerging Technology and Product Opportunities
- 10.5 New Capacity and Investment Hotspots
- 10.6 Market Entry and Expansion Opportunities
- 10.7 Distribution and Partnership Opportunities
- 10.8 Near-Term and Long-Term Commercial Potential
- 10.9 Opportunity Attractiveness and Execution Risks
Chapter 11 Australia Hypodermic Syringes and Needles Market Outlook, 2025-2035
- 11.1 Market Size and Analysis
- 11.1.1 Revenue (Market Measurement: 2025: USD 124.5 million → 2035: USD 215.6 million)
- 11.1.2 Market Volume and Quantity Sold
- 11.1.3 Historical Market Size, 2018-2025
- 11.1.4 Base-Year Market Size, 2025
- 11.2 Market Forecast, 2025-2035
- 11.2.1 Revenue Forecast to 2035
- 11.2.2 Volume Forecast to 2035
- 11.2.3 CAGR and Year-on-Year Growth
- 11.2.4 Incremental Revenue Opportunity
- 11.3 Forecast Assumptions and Scenario Analysis
- 11.3.1 Base-Case Forecast
- 11.3.2 Optimistic and Conservative Scenarios
- 11.3.3 Technology, Pricing and Policy Sensitivities
- 11.4 Market Attractiveness and Growth Outlook
Chapter 12 Australia Hypodermic Syringes and Needles Market Segmentation and Outlook
- 12.1 Segmentation Summary and Market Shares, 2025
- 12.2 Largest and Fastest-Growing Segments
- 12.3 By Product Type - Market Size and Forecast, 2025-2035
- 12.3.1 Segment Definition and Scope
- 12.3.2 Historical Market Size, 2018-2025
- 12.3.3 Revenue Forecast, 2025-2035
- 12.3.4 Volume Forecast, 2025-2035
- 12.3.5 Base-Year Market Share, 2025
- 12.3.6 Segment CAGR and Growth Drivers
- 12.3.7 Subsegment Market Size and Forecast
- 12.3.7.1 General-Purpose Syringes
- 12.3.7.2 Insulin Syringes
- 12.3.7.3 Standalone Needles
- 12.3.8 Subsegment Pricing and Adoption Trends
- 12.3.9 Leading Suppliers and Competition
- 12.3.10 Regional Demand and Opportunities
- 12.4 By Care Setting - Market Size and Forecast, 2025-2035
- 12.4.1 Segment Definition and Scope
- 12.4.2 Historical Market Size, 2018-2025
- 12.4.3 Revenue Forecast, 2025-2035
- 12.4.4 Volume Forecast, 2025-2035
- 12.4.5 Base-Year Market Share, 2025
- 12.4.6 Segment CAGR and Growth Drivers
- 12.4.7 Subsegment Market Size and Forecast
- 12.4.7.1 Hospitals and Clinics
- 12.4.7.2 Ambulatory Care and Pharmacies
- 12.4.7.3 Home and Aged Care
- 12.4.7.4 Public Health and Clinical Research
- 12.4.8 Subsegment Pricing and Adoption Trends
- 12.4.9 Leading Suppliers and Competition
- 12.4.10 Regional Demand and Opportunities
- 12.5 By Application - Market Size and Forecast, 2025-2035
- 12.5.1 Segment Definition and Scope
- 12.5.2 Historical Market Size, 2018-2025
- 12.5.3 Revenue Forecast, 2025-2035
- 12.5.4 Volume Forecast, 2025-2035
- 12.5.5 Base-Year Market Share, 2025
- 12.5.6 Segment CAGR and Growth Drivers
- 12.5.7 Subsegment Market Size and Forecast
- 12.5.7.1 Therapeutic Injection
- 12.5.7.2 Immunisation
- 12.5.7.3 Harm Reduction
- 12.5.7.4 Medication Preparation and Clinical Testing
- 12.5.8 Subsegment Pricing and Adoption Trends
- 12.5.9 Leading Suppliers and Competition
- 12.5.10 Regional Demand and Opportunities
- 12.6 By Technology - Market Size and Forecast, 2025-2035
- 12.6.1 Segment Definition and Scope
- 12.6.2 Historical Market Size, 2018-2025
- 12.6.3 Revenue Forecast, 2025-2035
- 12.6.4 Volume Forecast, 2025-2035
- 12.6.5 Base-Year Market Share, 2025
- 12.6.6 Segment CAGR and Growth Drivers
- 12.6.7 Subsegment Market Size and Forecast
- 12.6.7.1 Conventional Devices
- 12.6.7.2 Shielded Safety Devices
- 12.6.7.3 Retractable Safety Devices
- 12.6.8 Subsegment Pricing and Adoption Trends
- 12.6.9 Leading Suppliers and Competition
- 12.6.10 Regional Demand and Opportunities
- 12.7 Segment Growth Comparison
- 12.8 Segment Attractiveness and Priority Matrix
Chapter 13 Australia Hypodermic Syringes and Needles End-Use and Application Market Outlook
- 13.1 End-Use Industry and Customer Demand Structure
- 13.2 Leading Applications and Customer Groups
- 13.3 End-Use Market Size, Share and Forecast
- 13.4 Major End-Use Industry Deep Dives
- 13.4.1 Customer Requirements and Use Cases
- 13.4.2 Demand and Replacement Cycles
- 13.4.3 Technical and Regulatory Considerations
- 13.4.4 Purchasing and Procurement Models
- 13.4.5 Leading Vendors and Distribution Channels
- 13.4.6 Forecast and Commercial Opportunities
- 13.5 Emerging Applications and Cross-Segment Demand
- 13.6 End-Use Industry Investment Priorities
Chapter 14 Australia Hypodermic Syringes and Needles Geographic Market Outlook, 2025-2035
- 14.1 Domestic Market Distribution and Demand Clusters
- 14.2 State- or Province-Wise Market Size and Forecast, 2025-2035
- 14.3 City and Metropolitan Market Outlook
- 14.4 Industrial, Manufacturing and Commercial Clusters
- 14.5 Geographic Concentration of Key End Users
- 14.6 Local Pricing and Purchasing Differences
- 14.7 Domestic Production Facilities and Capacity Map
- 14.8 Local Infrastructure and Project Pipeline
- 14.9 State-Level Policy and Incentive Differences
- 14.10 Subnational Investment Hotspots and Opportunities
- 14.11 Distribution and Logistics Networks
- 14.12 Domestic Competitive Footprint
Chapter 15 Australia Hypodermic Syringes and Needles Technology, Innovation and Sustainability Outlook
- 15.1 Technology Landscape and Maturity
- 15.2 Product, Process and Service Innovation
- 15.3 AI, Automation and Digital Tools in the Industry
- 15.4 Technology Adoption and Performance Benchmarking
- 15.5 Innovation Pipeline and R&D Investment
- 15.6 Patent and Intellectual Property Trends
- 15.7 Energy Efficiency and Resource Management
- 15.8 Sustainability, Recycling and Circularity
- 15.9 Technology Roadmap, 2025-2035
- 15.10 Risks of Obsolescence and Technology Substitution
Chapter 16 Australia Hypodermic Syringes and Needles Market Key Strategic Imperatives
- 16.1 Growth and Market Entry Priorities
- 16.2 High-Return Products and Segments
- 16.3 Pricing, Profitability and Cost Optimization
- 16.4 Technology Investment and Product Differentiation
- 16.5 Supply Chain Localization and Resilience
- 16.6 Distribution and Customer Acquisition
- 16.7 Partnership, Acquisition and Capacity Strategy
- 16.8 Regional Expansion Priorities
- 16.9 Short-, Medium- and Long-Term Actions
Chapter 17 Competition Outlook
- 17.1 Industry Competition Characteristics
- 17.2 Market Structure and Concentration
- 17.3 Market Share and Competitive Positioning, 2025
- 17.4 Company-Wise Revenue and Product Benchmarking
- 17.5 Production and Service Capacity Benchmarking
- 17.6 Technology, Pricing and Differentiation
- 17.7 Regional Footprint and Distribution Strength
- 17.8 Mergers, Acquisitions and Strategic Alliances
- 17.9 New Entrants and Competitive Threats
- 17.10 Porter's Five Forces and Industry Attractiveness
- 17.11 Competitive Outlook, 2025-2035
Chapter 18 Company Profiles
- 18.1 Company Coverage and Selection Criteria
- 18.2 B. Braun
- 18.2.1 Business Description
- 18.2.2 Company Ownership and Geographic Presence
- 18.2.3 Product and Service Portfolio
- 18.2.4 Manufacturing and Operating Footprint
- 18.2.5 Production Capacity and Expansion Plans
- 18.2.6 Financial Performance and Investment
- 18.2.7 Market Share and Competitive Position
- 18.2.8 Technology and Innovation Capabilities
- 18.2.9 Strategic Alliances or Partnerships
- 18.2.10 Recent Developments
- 18.2.11 Growth Strategy and Outlook
- 18.3 Terumo
- 18.4 Nipro
- 18.5 ICU Medical
- 18.6 Other Relevant Market Participants
Note: Every listed company is profiled on the structure shown under the first company. The company list is preliminary and may change based on research findings, market developments, data availability and client requirements.
Chapter 19 Disclaimer
- 19.1 Research and Forecast Disclaimer
- 19.2 Data Source and Estimation Limitations
Note: The depth of individual sections depends on data availability for this market. Volume, capacity, trade and other unit-based metrics are included where applicable.

