
Clinic growth and digital upgrades lift Gulf dental capex
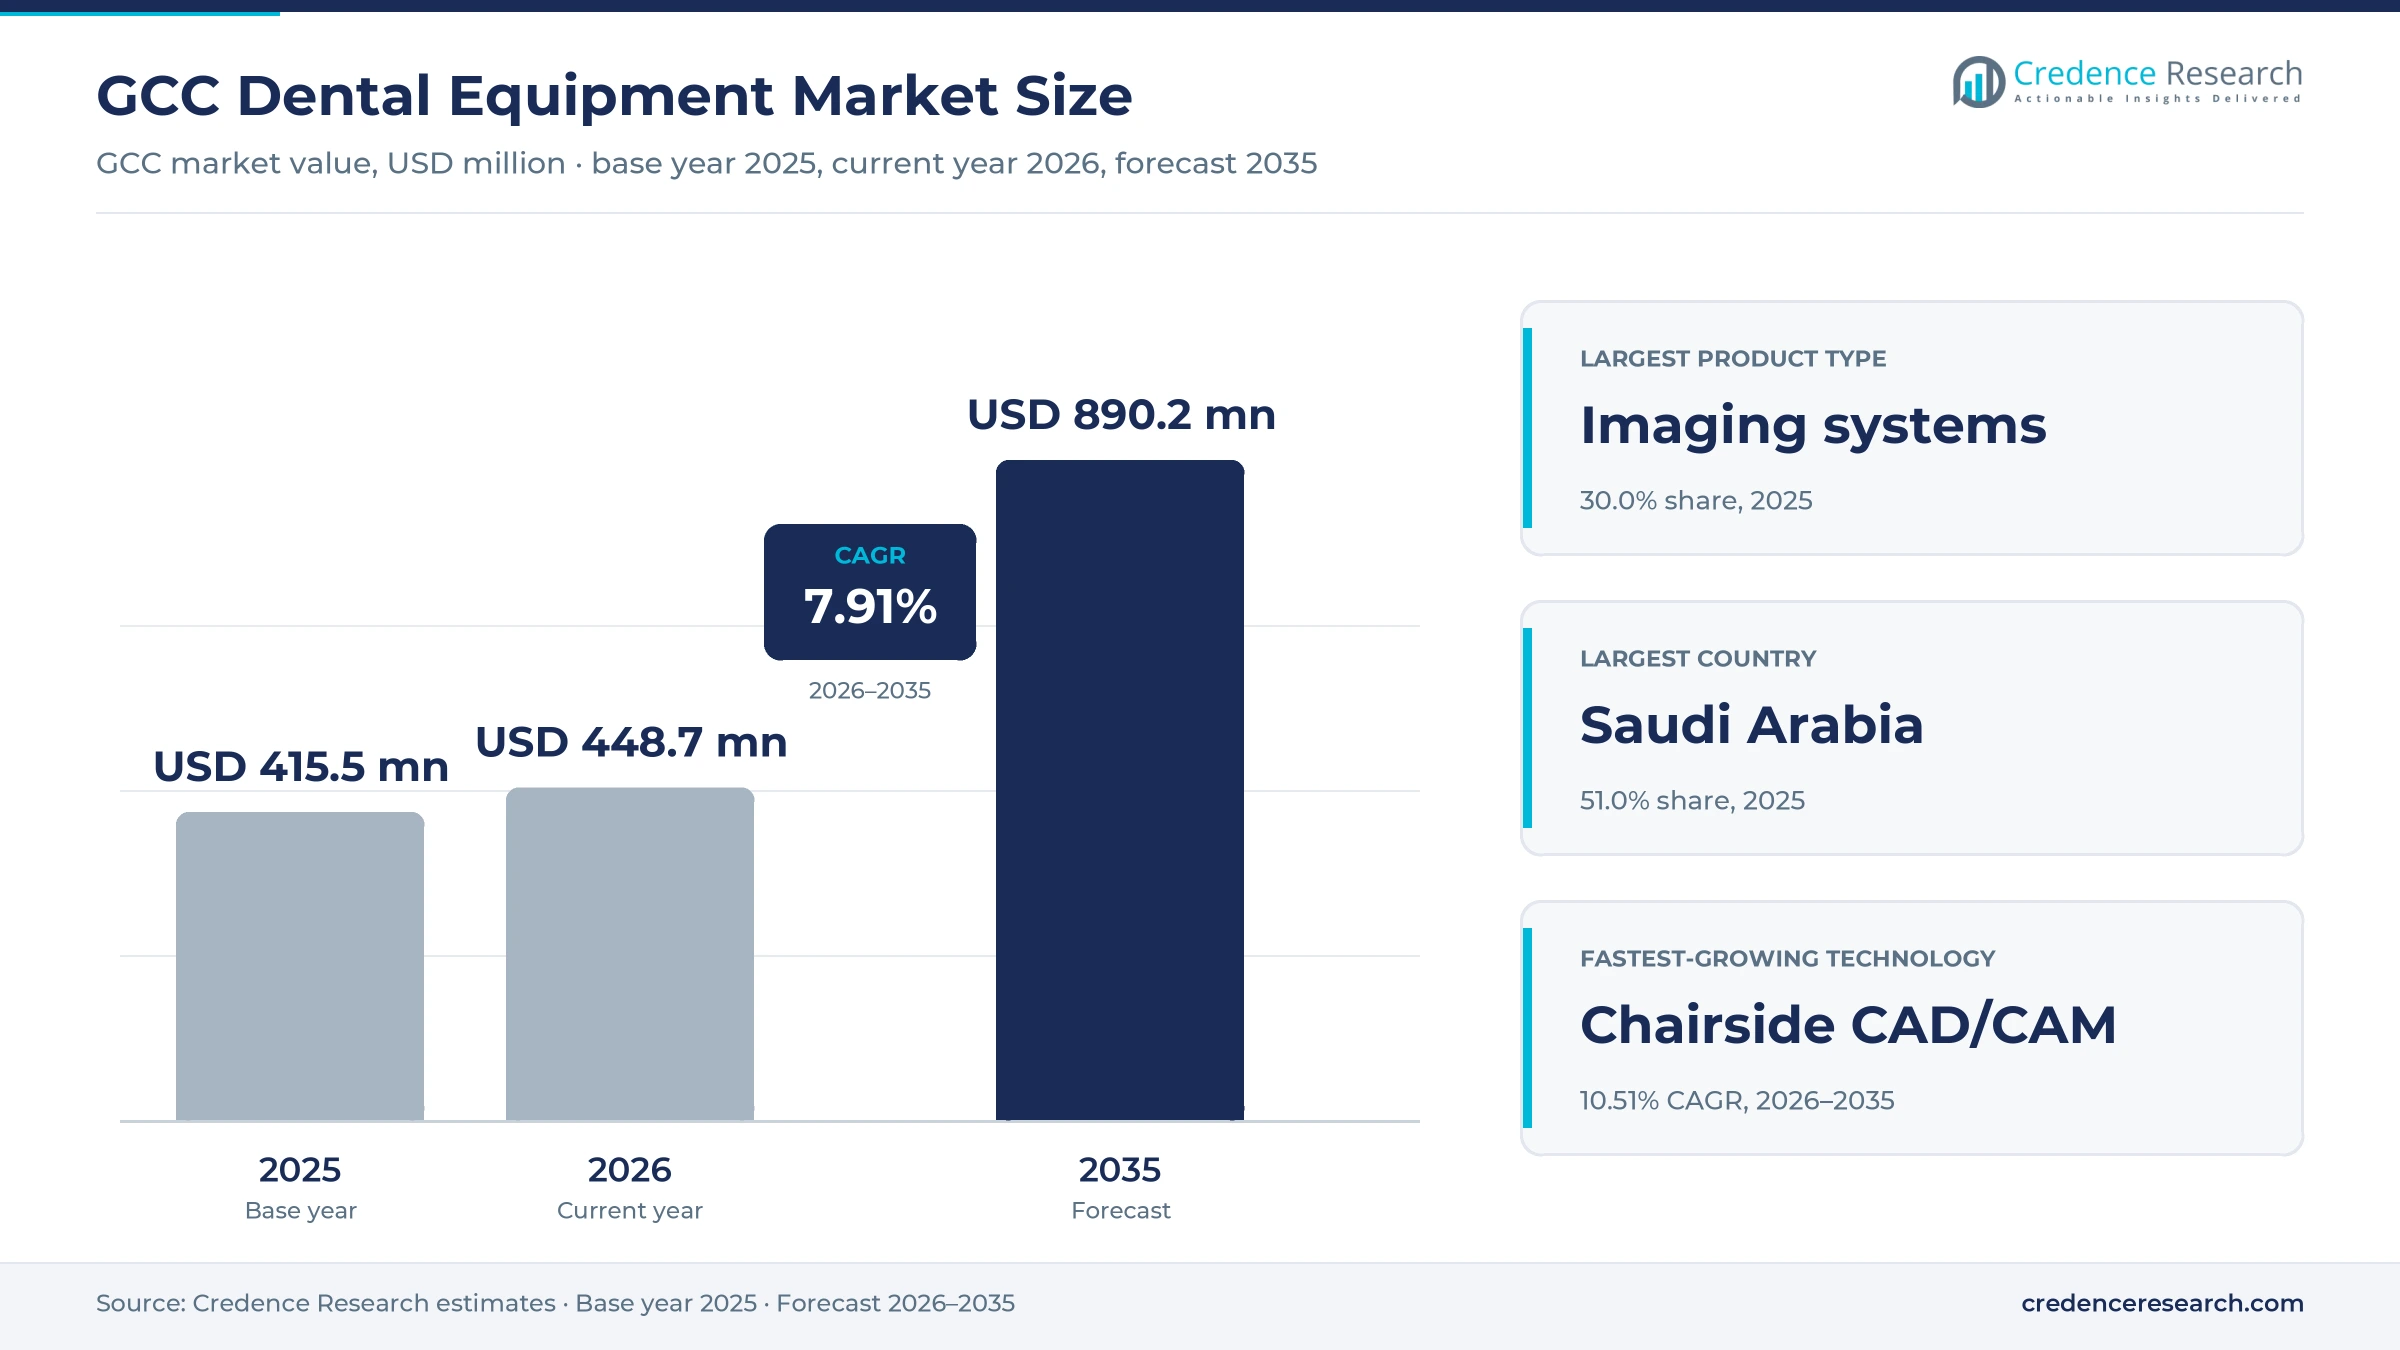
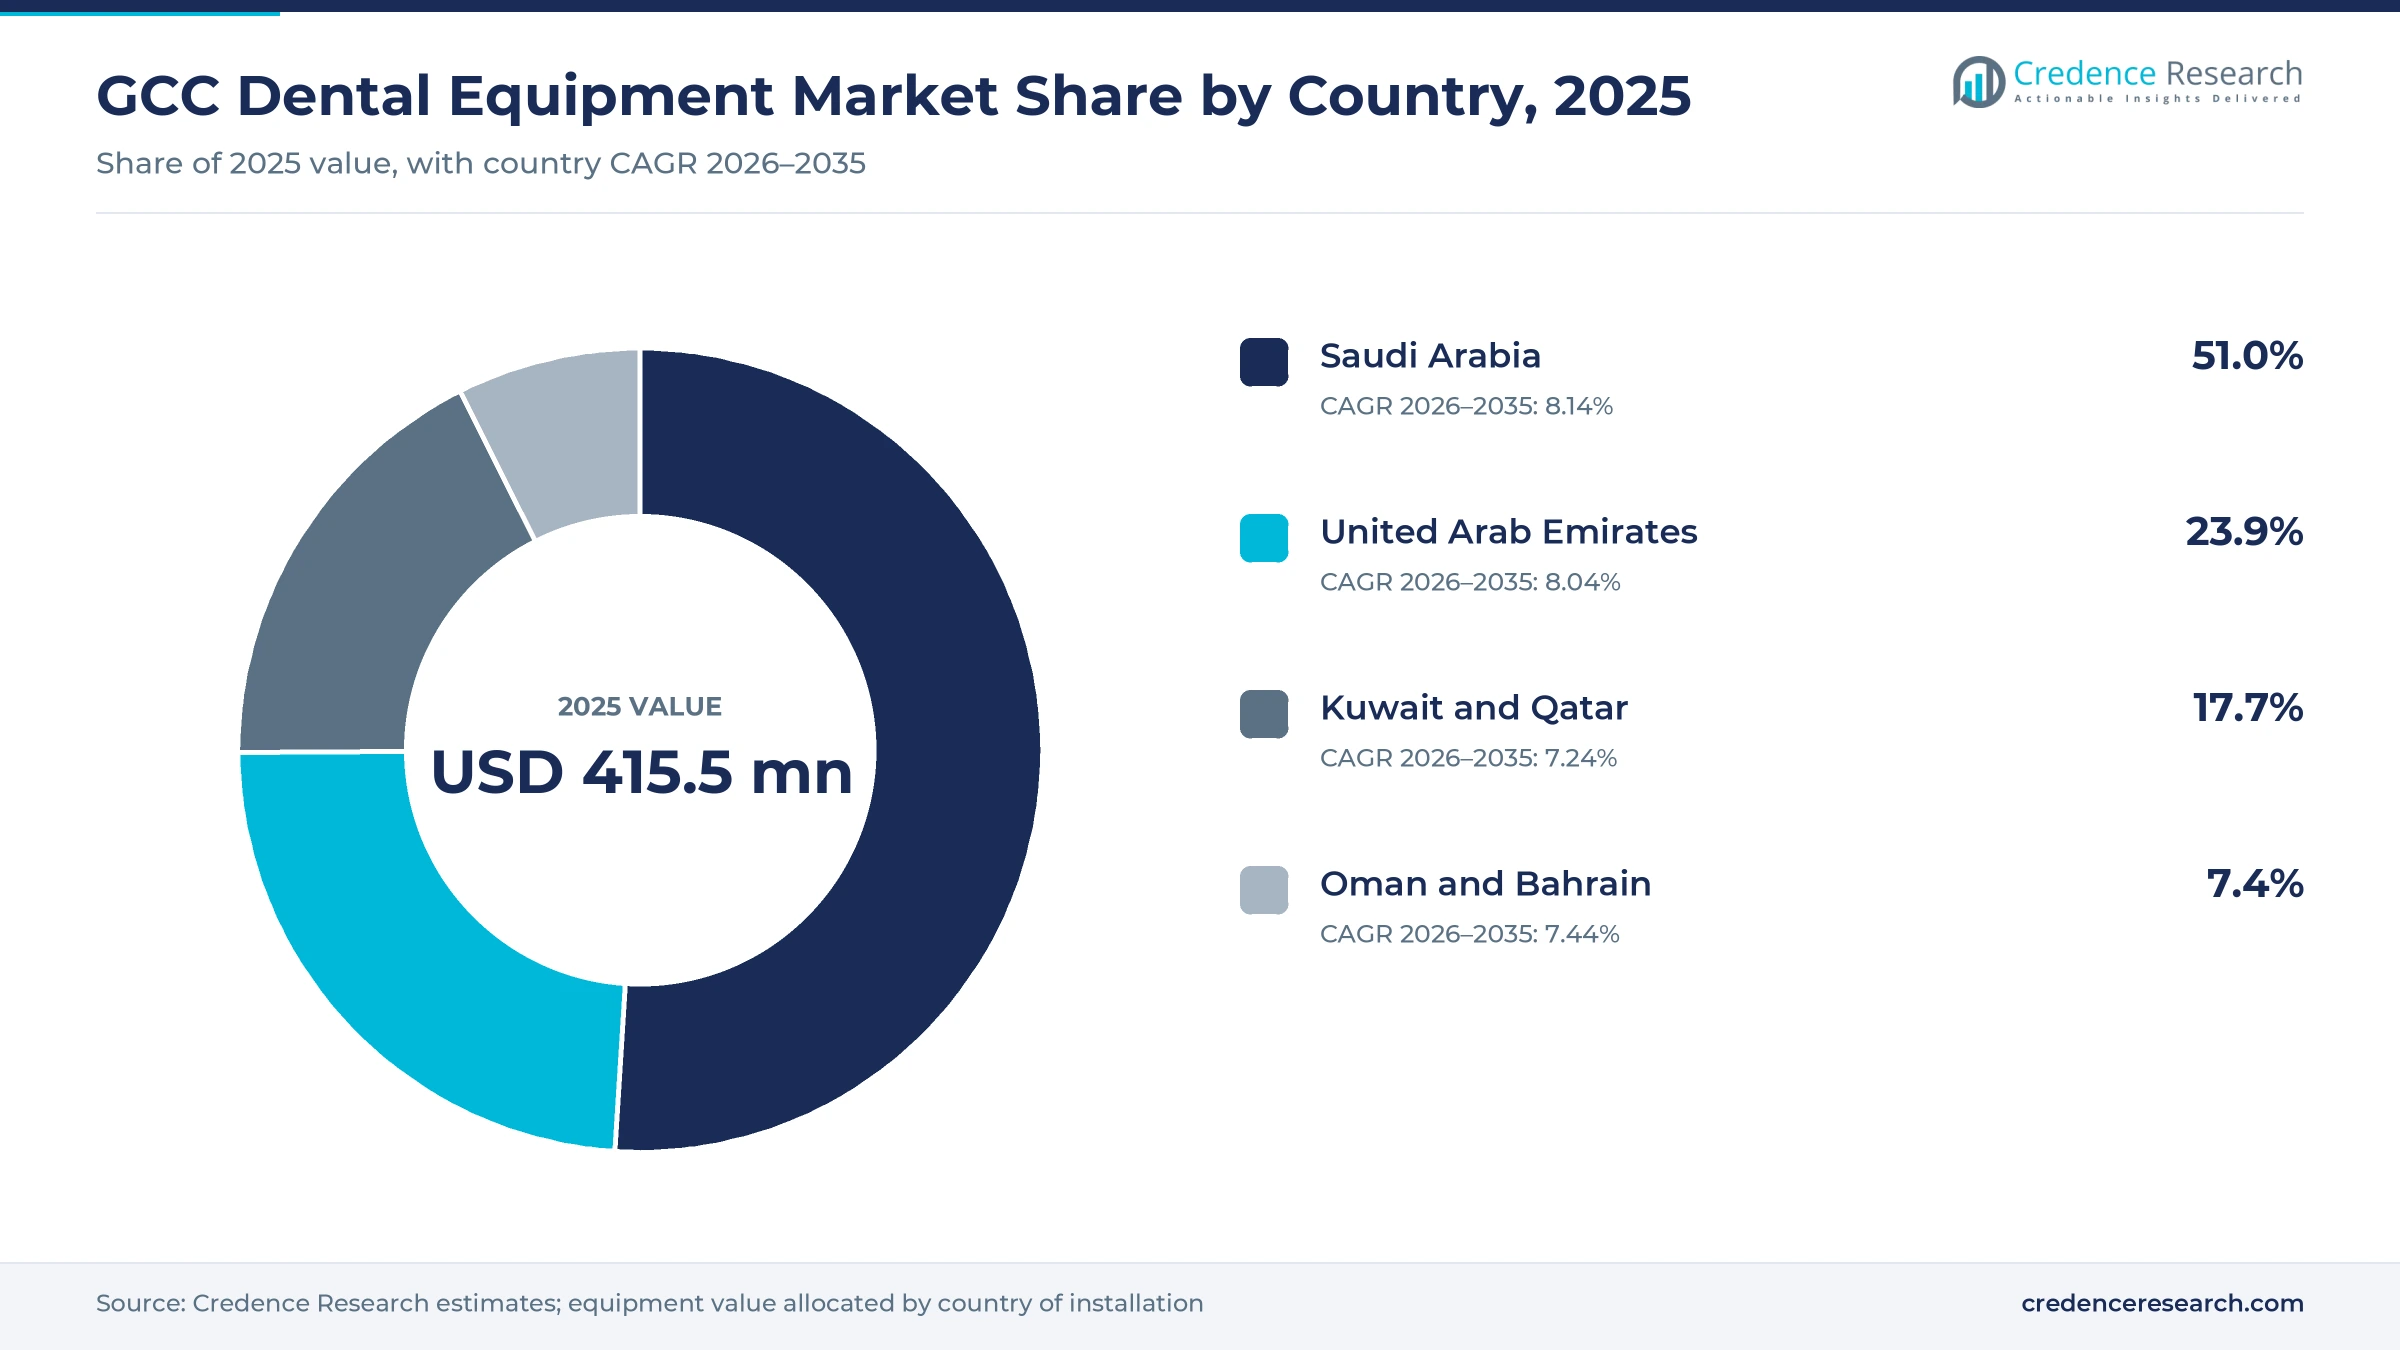
The GCC dental equipment market was valued at USD 415.5 million in 2025 and is projected to increase from USD 448.7 million in 2026 to USD 890.2 million by 2035, registering a CAGR of 7.91% during 2026–2035. Demand comes from public dental centers, hospital departments, private clinics and fast-growing dental chains that buy imaging systems, treatment units, scanners and sterilization lines, almost all of them imported. Saudi Arabia held the largest country share, 51.0% in 2025, because it has the biggest population, the widest public dental network and the largest number of dentists in the Gulf. Saudi Arabia is also the fastest-growing country at 8.14% a year, as private clinics multiply and public programs widen access. In turn, the shift from film and analog chairs to 3D cone-beam imaging, intraoral scanning and chairside milling is raising the value of each clinic fit-out across Saudi Arabia, the United Arab Emirates, Kuwait, Qatar, Oman and Bahrain.
Which dental systems and devices does the estimate cover?
The estimate measures the value of dental imaging systems, treatment units and chairs, CAD/CAM and digital dentistry systems, and surgical, sterilization and support equipment installed in the six Gulf Cooperation Council countries. It counts capital equipment bought by independent clinics, dental chains, hospital departments and academic and government centers through distributors, tenders, direct sales and chain framework agreements.
The estimate excludes consumables such as filling materials, implants, aligners and impression materials, and it excludes service contracts and software subscriptions sold on their own. The value chain runs from manufacturers in Europe, the United States and Asia through regional hubs in Dubai and Riyadh to authorized distributors, procurement agencies and the clinics and hospitals that install the equipment.
GCC Dental Equipment Market Insights
- The GCC dental equipment market was valued at USD 415.5 million in 2025 and is projected to reach USD 890.2 million by 2035, registering a CAGR of 7.91% during 2026–2035.
- Saudi Arabia held a 51.0% share of 2025 value, because it counted 25,970 dentists in 2023, the largest dental workforce in the Gulf.
- Dental imaging systems led with a 30.0% share of 2025 value, because every new or upgraded clinic installs panoramic or intraoral X-ray units.
- Saudi Arabia raised the Saudization target for 20 private-sector dental professions to 55% on Jan. 27, 2026, after a 45% first phase in July 2025.
- AEEDC Dubai 2026 drew 4,319 exhibiting companies with more than 5,860 brands, which shows how many global suppliers compete for Gulf dental buyers.
Imaging leads as chairside CAD/CAM and chains grow fastest
Why do imaging systems lead Gulf equipment value?
Based on product type, the market is categorized into dental imaging systems, treatment units and chairs, CAD/CAM and digital dentistry systems, and surgical, sterilization and support equipment. Dental Imaging Systems led with a 30.0% share of 2025 value, because clinics install panoramic, intraoral and cone-beam units at high unit prices. CAD/CAM and Digital Dentistry Systems grow fastest at 9.25% a year, as practices move restorations from outside laboratories to the chair.
How do clinics and dental chains split purchases?
Based on care setting, the market is categorized into independent dental clinics, dental chains and group practices, hospital dental departments and academic and government dental centers. Independent Dental Clinics led with a 42.0% share of 2025 value, because most Gulf dentists still work in small private practices. Dental Chains and Group Practices grow fastest at 9.18% a year, as investors consolidate clinics and standardize equipment across branches.
Why are chairside and AI workflows gaining value?
Based on technology, the market is categorized into conventional analog equipment, 2D digital imaging, 3D CBCT and optical scanning, and chairside CAD/CAM and AI workflows. 2D Digital Imaging led with a 32.0% share of 2025 value, because digital sensors and panoramic units are now standard in new clinics. Chairside CAD/CAM and AI Workflows grow fastest at 10.51% a year, as premium practices offer same-day crowns and software-guided planning.
How do distributors and tenders reach Gulf buyers?
Based on sales channel, the market is categorized into authorized dental distributors, hospital and government tenders, direct manufacturer sales and dental chain framework agreements. Authorized Dental Distributors led with 45.0% of 2025 value, because most global brands sell through licensed regional partners that handle registration, installation and service. Dental Chain Framework Agreements grow fastest at 9.71% a year, as chains negotiate multi-site supply deals.
| Segment Group | Leading Sub-segment | Share, 2025 | Fastest-growing Sub-segment | CAGR, 2026–2035 |
|---|---|---|---|---|
| By Product Type | Dental Imaging Systems | 30.0% | CAD/CAM and Digital Dentistry Systems | 9.25% |
| By Care Setting | Independent Dental Clinics | 42.0% | Dental Chains and Group Practices | 9.18% |
| By Technology | 2D Digital Imaging | 32.0% | Chairside CAD/CAM and AI Workflows | 10.51% |
| By Sales Channel | Authorized Dental Distributors | 45.0% | Dental Chain Framework Agreements | 9.71% |
Request a Free Sample
Fill in your details and we'll send you a free sample report.
- Sample data tables & charts
- Research methodology
Wider access, digital replacement and imports lift demand
How does wider dental access add treatment capacity?
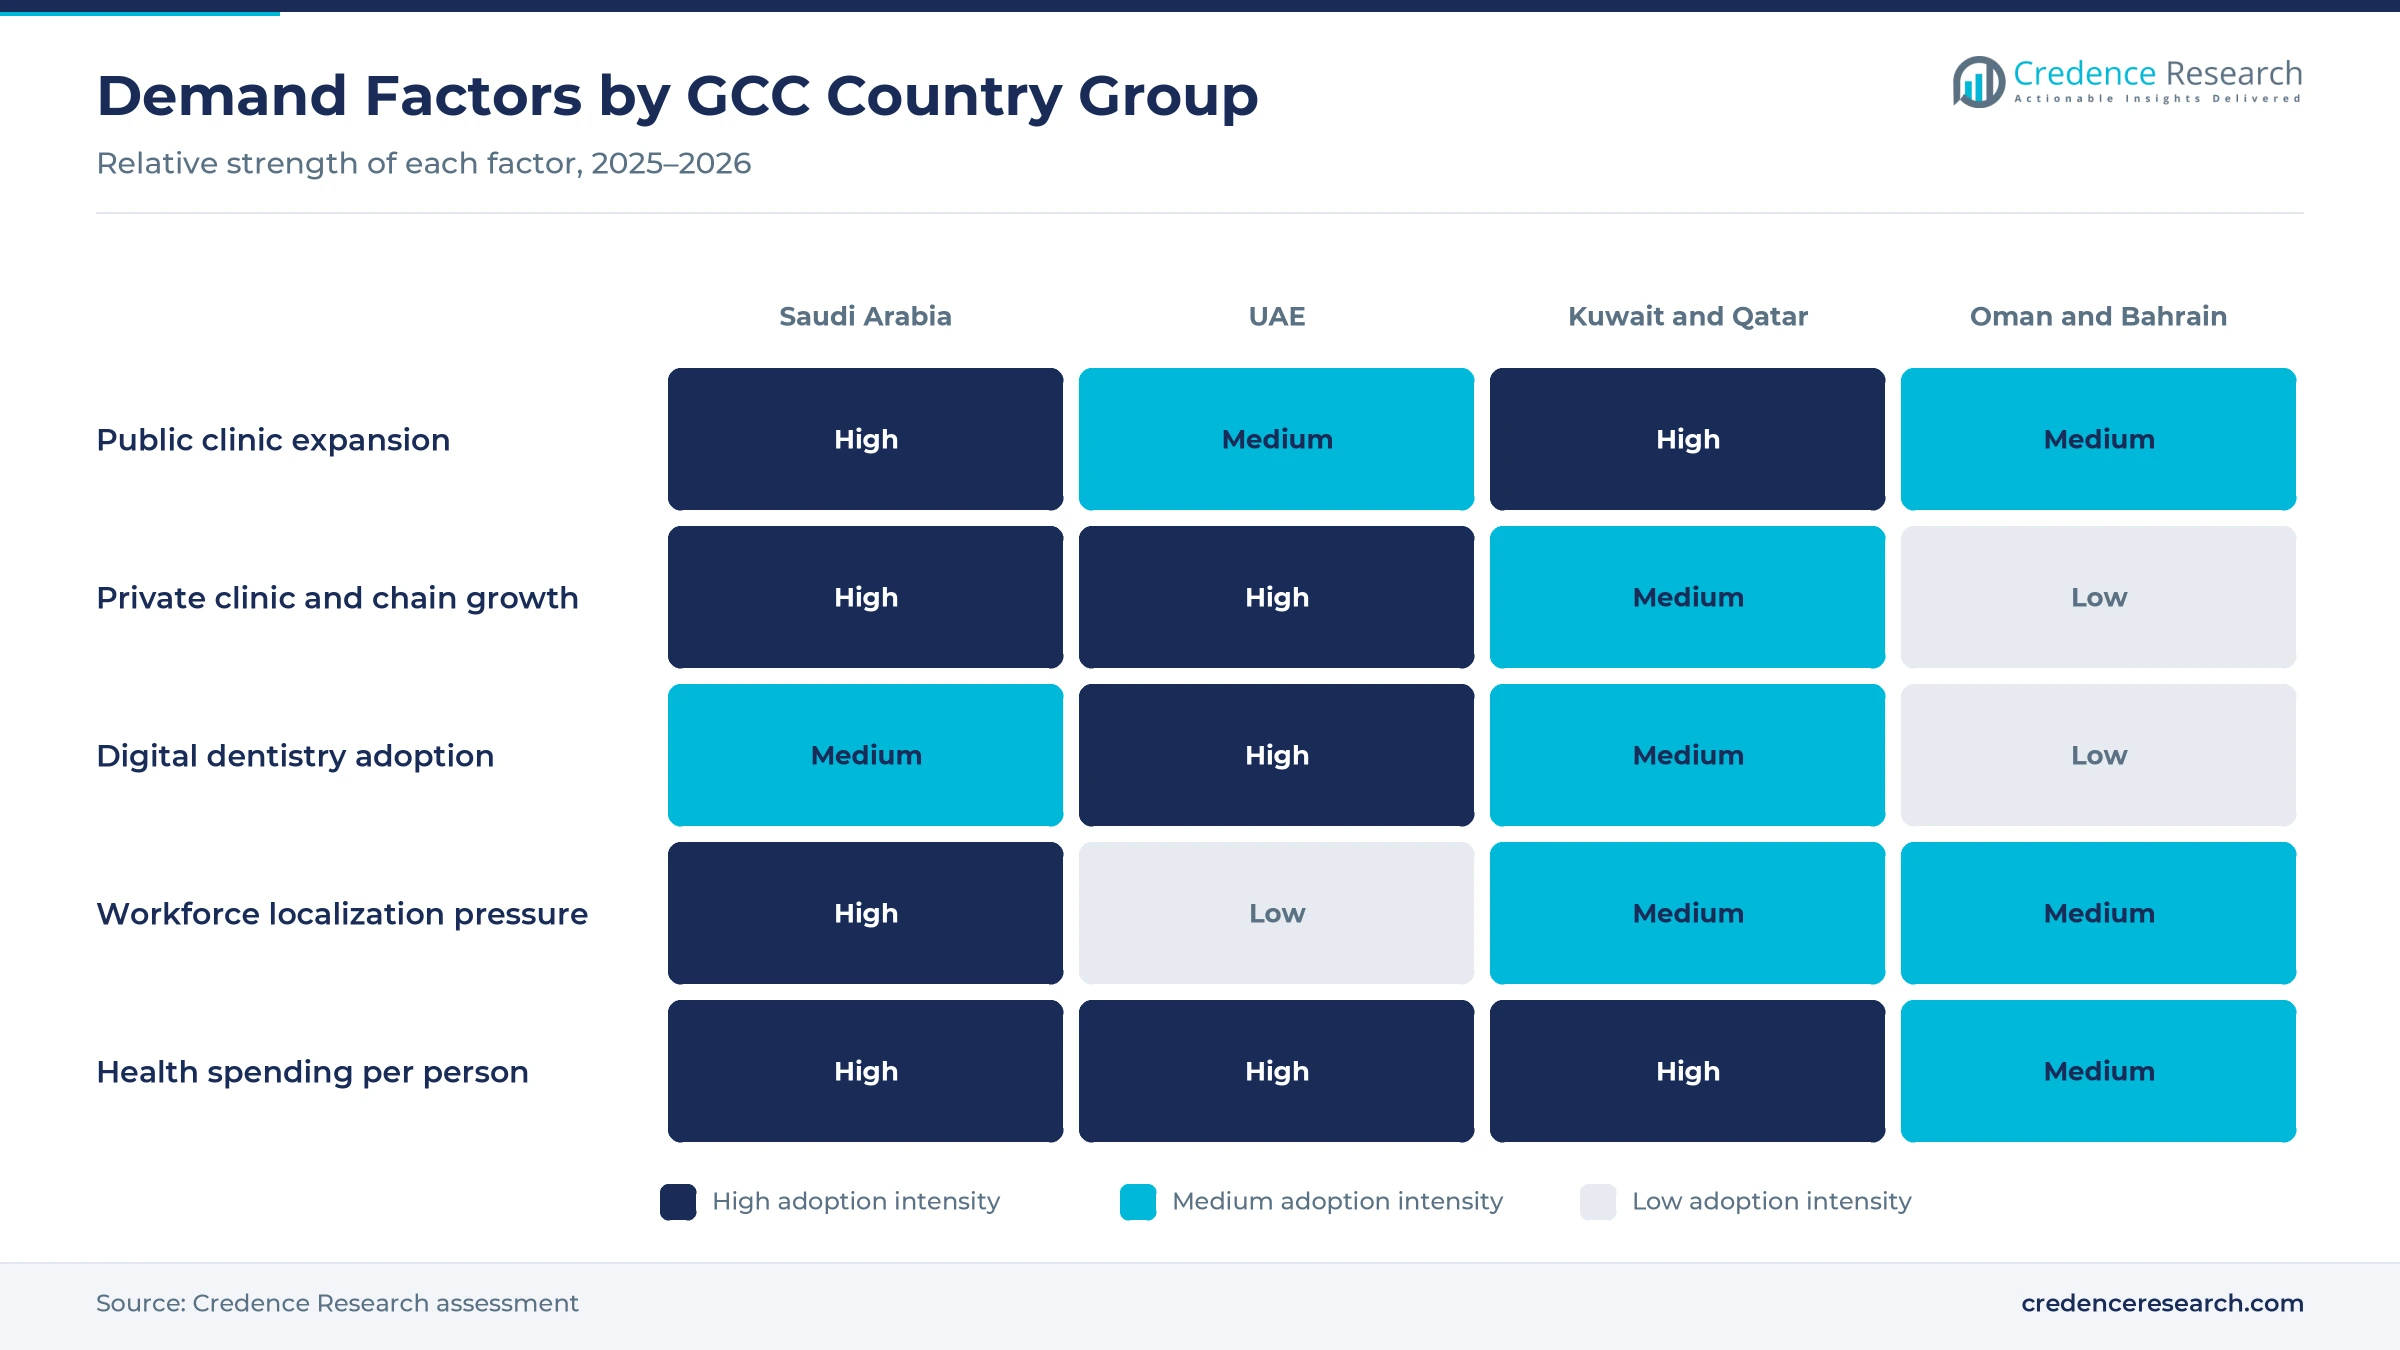
Wider dental access adds treatment capacity, because every new public clinic, hospital department and private practice must be fitted with chairs, imaging and sterilization lines. Saudi Arabia counted 25,970 dentists in 2023, of whom 13,959 were Saudi nationals, according to the General Authority for Statistics. The Saudi health ministry also reported 3,253 dental clinics in its network in July 2023, which delivered more than 4 million curative procedures. In Kuwait, the Specialized Center for Pediatric Dentistry runs 48 clinics for children, and Al-Adan Hospital opened a full dental department with radiology and sterilization during the past year. As a result, Independent Dental Clinics keep 42.0% of 2025 value, because most new chairs still go into small private practices.
Why is the digital dentistry replacement cycle lifting value?
The digital dentistry replacement cycle lifts value, because clinics that retire film units and analog chairs usually buy intraoral scanners, cone-beam imaging and milling units that cost far more. Dentsply Sirona held DS World Dubai on Feb. 2–3, 2025, with nearly 1,200 participants from more than 50 countries, and it showed Primescan Connect and Primeprint there. In January 2026, Straumann Group said its iExcel implant system, iGuide planning and SIRIOS X3 scanner were available in the Middle East. Clinicians in the region also use intraoral scanners for orthodontic and restorative cases. In turn, chairside CAD/CAM and AI workflows grow at 10.51% a year, the fastest technology rate.
How does import-led premium procurement shape spending?
Import-led premium procurement shapes spending, because nearly all Gulf dental systems are made abroad and must be registered, shipped and serviced through licensed partners that hold stock, train staff and handle repairs. Saudi regulators processed 14,227 marketing authorization requests covering 129,752 medical device products in 2025, according to an SFDA presentation on March 10, 2026. The 30th AEEDC Dubai, held Jan. 19–21, 2026, also drew 4,319 exhibiting companies with more than 5,860 brands and over 74,000 participants from 155 countries. Because buyers favor European, American and Japanese brands with local service, authorized dental distributors keep 45.0% of 2025 value.
Why does high Gulf health spending support premium fit-outs?
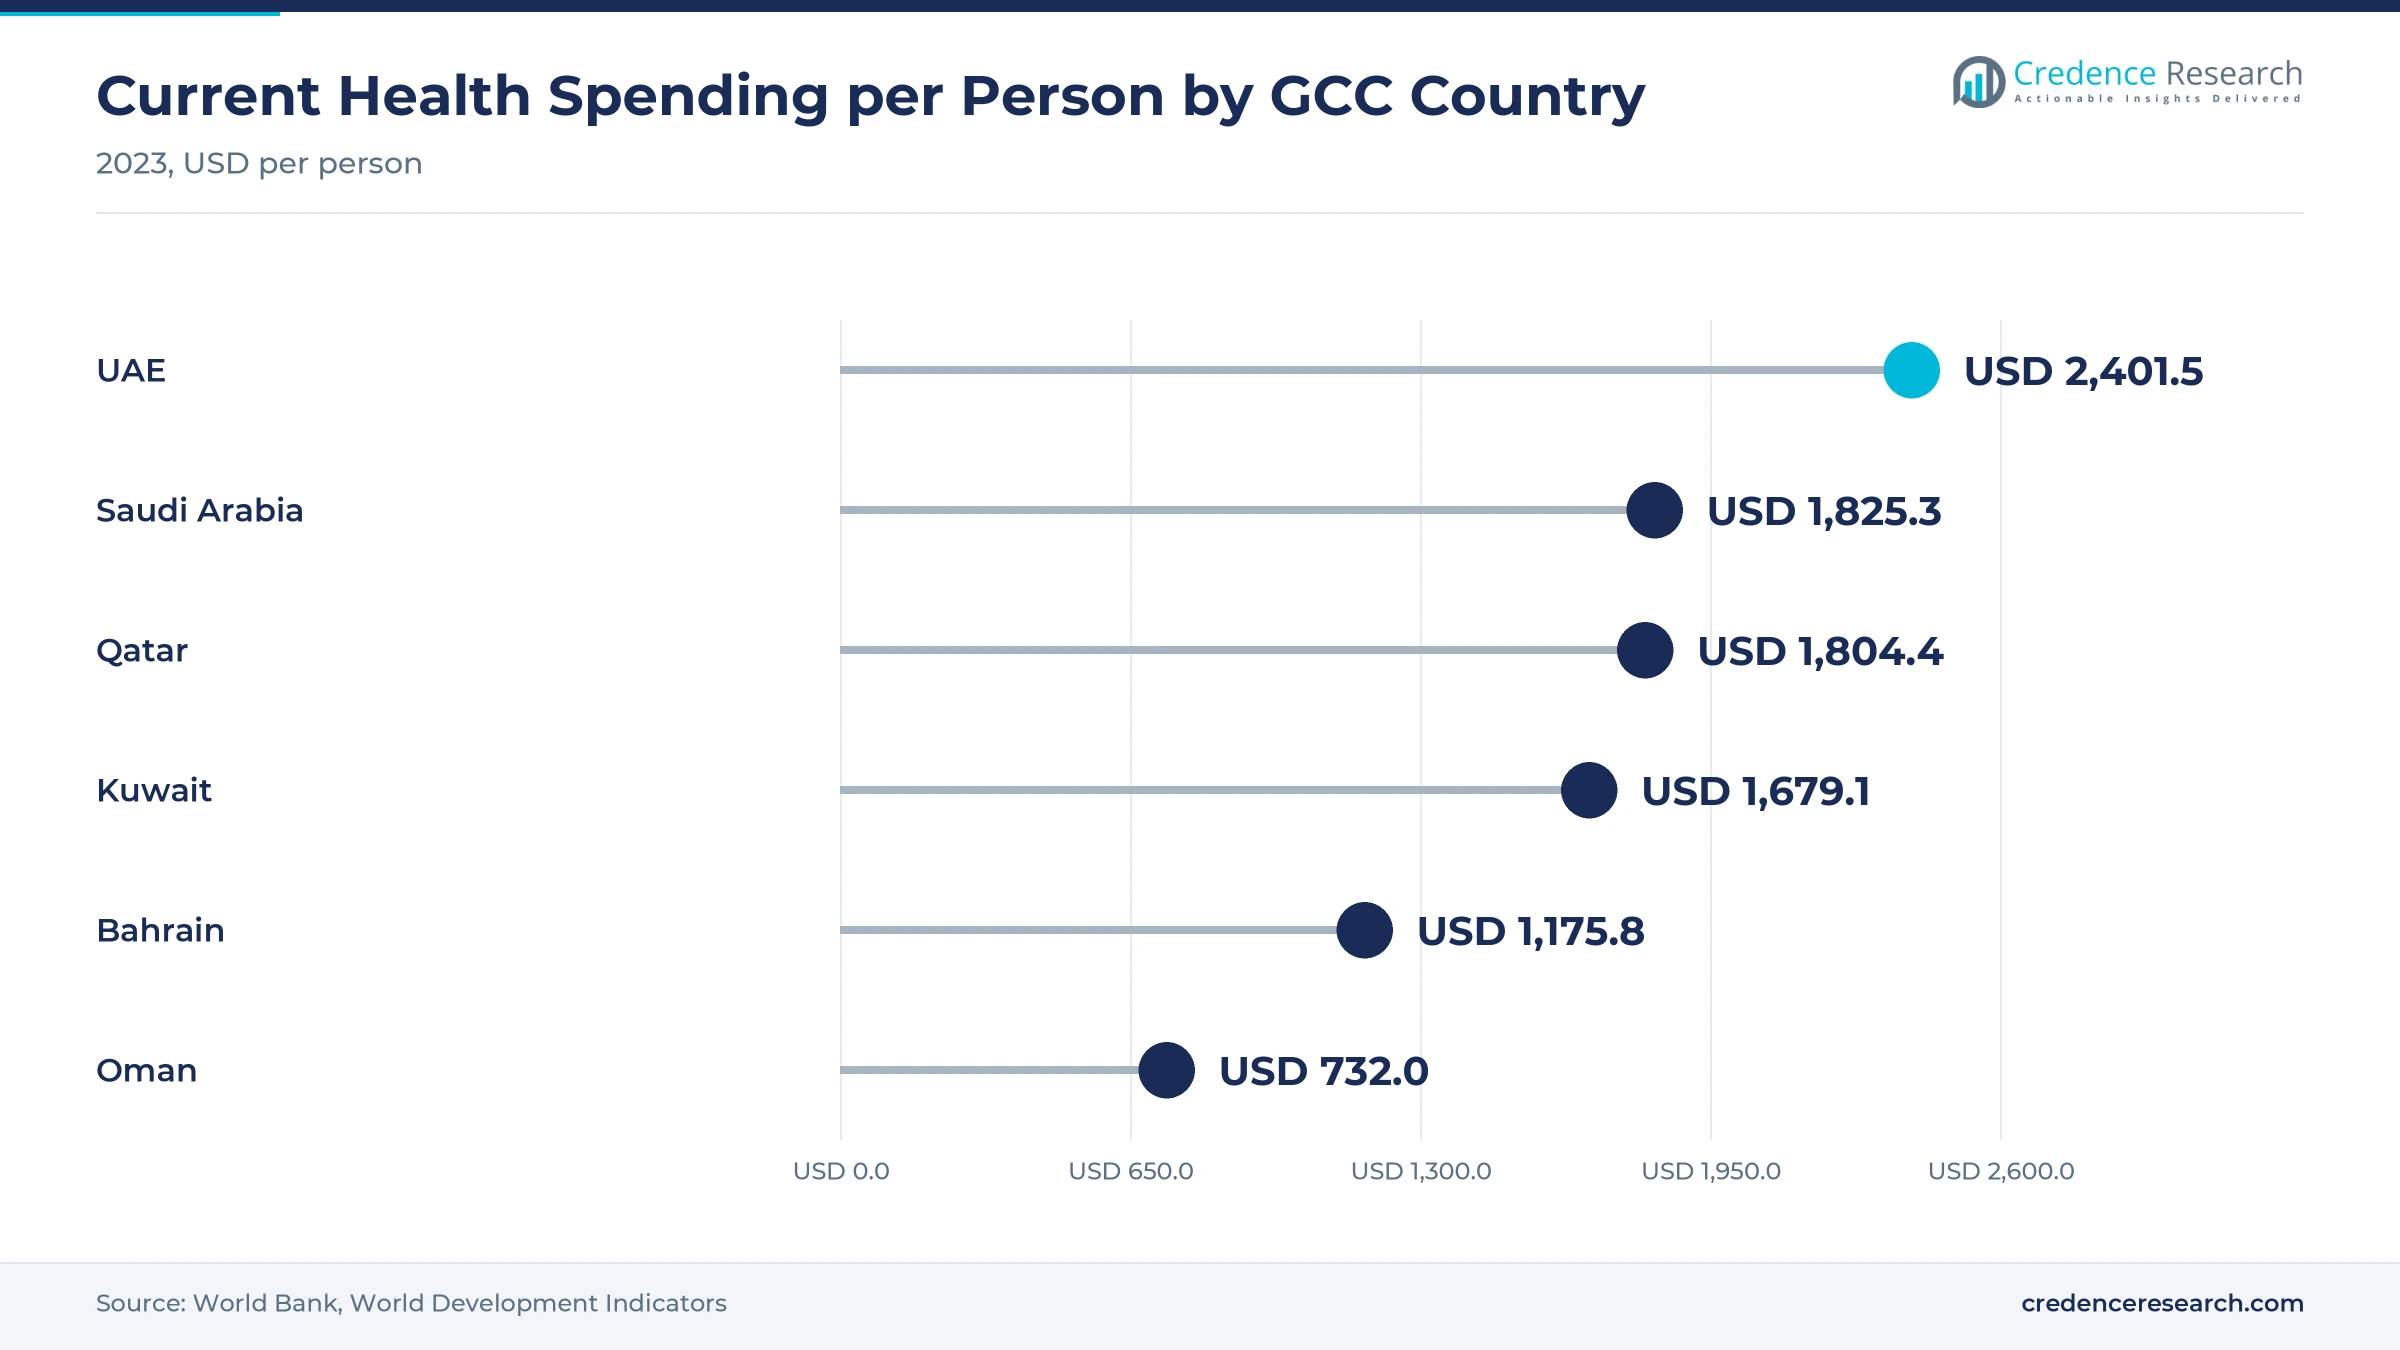
High Gulf health spending supports premium fit-outs, because governments and insured patients can pay for modern imaging and digital restorations. Current health spending reached USD 2,401.5 per person in the United Arab Emirates and USD 1,825.3 in Saudi Arabia in 2023, according to World Bank data. Saudi Arabia's health minister also reported that health coverage reached 94.7% and that the sector's contribution to GDP rose to 5%, in budget statements in December 2025. Dubai, in turn, licensed about 5,800 healthcare facilities in 2025, up from 5,340 in 2024, while private health insurance covers many Saudi residents. As a result, the United Arab Emirates holds 23.9% of 2025 value, the second-largest share.
Saudi events, 3D imaging and pediatric care shape demand
How is the shift toward Saudi-based dental trade events showing?
The shift toward Saudi-based dental trade events shows that suppliers now treat Riyadh as a second regional hub alongside Dubai. Koelnmesse and dmg events announced on April 30, 2026, that IDEM Saudi Arabia would run Sept. 27–29, 2026, at the Riyadh International Convention and Exhibition Center. Saudi regulators also updated guidance on local manufacturing pathways and innovative device designation, according to the March 2026 regulatory presentation. Meanwhile, Saudi Arabia holds the largest dental workforce in the Gulf and keeps adding public and private clinics. As a result, more manufacturers are adding Saudi demonstration, training and service capacity instead of serving the kingdom only from offices in the United Arab Emirates.
Why is the rise of 3D imaging and dental MRI notable?
The rise of 3D imaging is notable, because implant, orthodontic and surgical cases in the Gulf increasingly start with a volumetric scan rather than a flat X-ray. At DS World Dubai in February 2025, Dentsply Sirona showed a dental MRI model, developed with Siemens Healthineers, for the first time in the United Arab Emirates. Straumann Group also promotes iGuide planning for guided surgery in the Middle East, which depends on cone-beam CT scanners and digital impressions. In turn, 3D CBCT and optical scanning gains share each year, while Dental Imaging Systems keep 30.0% of 2025 value, as clinics upgrade panoramic units to combined 2D and 3D systems.
Can pediatric and special-care dentistry open public demand?
Pediatric and special-care dentistry opens a public demand path, because Gulf health ministries are adding dedicated clinics with their own imaging and sterilization lines. Kuwait's health minister cited a 43.5% rate of untreated caries in primary teeth among children aged 1 to 9 in September 2026. Hamad Medical Corporation in Qatar raised treatment clinics to eight at Al Khor and Aisha Bint Hamad Al Attiyah hospitals, with 1,855 visits from January to May 2026. Qatar's health ministry also ran its seventh national oral and dental health campaign in September 2025. As a result, academic and government dental centers keep steady tender demand for chairs, X-ray units and sterilizers.
Is there room for training-led sales to new Saudi dentists?
Training-led sales have room to grow, because Saudization is bringing more Saudi graduates into private clinics that need to learn digital systems. Saudi Arabia required private employers to fill 45% of 20 dental professions with Saudi nationals from July 27, 2025, and raised the target to 55% on Jan. 27, 2026, according to Arab News. Dentists must earn at least SR9,000 a month to count toward the target. Meanwhile, Straumann Group said in January 2026 that it supports its Gulf distributors with training and marketing tools. In turn, Dental Chains and Group Practices grow at 9.18% a year, as chains hire and train new Saudi dentists on standard digital equipment.
Import costs, workforce rules and price pressure weigh
How do import costs and long lead times weigh on clinics?
Import costs and long lead times weigh on clinics, because almost every chair, scanner and imaging unit is shipped from Europe, the United States or Asia. Small independent practices feel this most, since they pay distributor margins, freight and registration costs on each unit. As a result, many delay upgrades or buy refurbished systems when currency or shipping costs rise. Distributors respond with leasing plans, local stock in Dubai and Riyadh, and bundled service contracts that spread the cost over several years.
Why do workforce localization rules affect private practices?
Workforce localization rules affect private practices, because clinics must meet Saudization targets and minimum salaries for Saudi dentists. Smaller clinics with tight margins may postpone equipment purchases while they adjust staffing costs and recruit eligible Saudi dentists. In turn, some owners merge into larger groups or sell to chains that can absorb compliance costs. Suppliers respond by offering training programs and financing that help new Saudi dentists become productive faster on scanners, imaging and chairside systems.
How does price competition in tenders limit premium sales?
Price competition in tenders limits premium sales, because public buyers often award contracts to the lowest compliant bid for chairs, sterilizers and X-ray units across hospital and ministry networks. Lower-cost brands from Asia and Europe compete hard for these volumes. As a result, premium suppliers struggle to win hospital and ministry contracts without discounts. Many respond by stressing service coverage, uptime guarantees, spare parts and training packages in their tender offers.
Why do service and skills gaps slow digital adoption?
Service and skills gaps slow digital adoption, because scanners, milling units and cone-beam systems need trained users and fast technical support. Clinics outside main cities in Oman, Bahrain and Saudi Arabia often wait longer for engineers and spare parts. In turn, some dentists keep using older analog equipment for routine X-rays and impressions. Manufacturers respond with remote diagnostics, regional training centers and certified distributor service teams in each country.
Saudi Arabia leads as the UAE adds private clinic capacity
| Country | Value, 2025 (USD million) | Share, 2025 | CAGR, 2026–2035 |
|---|---|---|---|
| Saudi Arabia | 211.9 | 51.0% | 8.14% |
| United Arab Emirates | 99.3 | 23.9% | 8.04% |
| Kuwait and Qatar | 73.5 | 17.7% | 7.24% |
| Oman and Bahrain | 30.7 | 7.4% | 7.44% |
Why does Saudi Arabia hold the largest share?
Saudi Arabia held a 51.0% share of 2025 value and grows at 8.14% a year, because it has about 35.3 million people and the largest public and private clinic network in the Gulf. Its health ministry runs more than 3,000 dental clinics, and private groups keep opening branches in Riyadh, Jeddah and the Eastern Province. Saudization and the new IDEM Saudi Arabia show in Riyadh also bring more supplier activity into the kingdom.
How does the United Arab Emirates sustain premium demand?
The United Arab Emirates held a 23.9% share of 2025 value and grows at 8.04% a year, because Dubai and Abu Dhabi host many premium private clinics and regional distributor offices. Dubai licensed about 5,800 healthcare facilities in 2025, up more than 8% from the previous year. AEEDC Dubai also makes the country the main showroom for new chairs, scanners and imaging units in the region, which keeps Emirati clinics among the first to adopt new digital systems.
What drives demand in Kuwait and Qatar?
Kuwait and Qatar held a 17.7% share of 2025 value and grow at 7.24% a year, because both governments fund large public dental programs. Kuwait runs a 48-clinic pediatric dental center, while Hamad Medical Corporation expanded dental clinics in Qatar's northern region in 2026. However, smaller populations keep total volumes below Saudi Arabia and the United Arab Emirates. Both countries also spend heavily on health per person, which supports premium imaging purchases.
How do Oman and Bahrain add steady demand?
Oman and Bahrain held a 7.4% share of 2025 value and grow at 7.44% a year, because their smaller clinic networks buy equipment in steady replacement cycles. Health spending per person was USD 732.0 in Oman and USD 1,175.8 in Bahrain in 2023. Private clinics in Muscat and Manama still add digital imaging and scanners, often through distributors based in the United Arab Emirates.
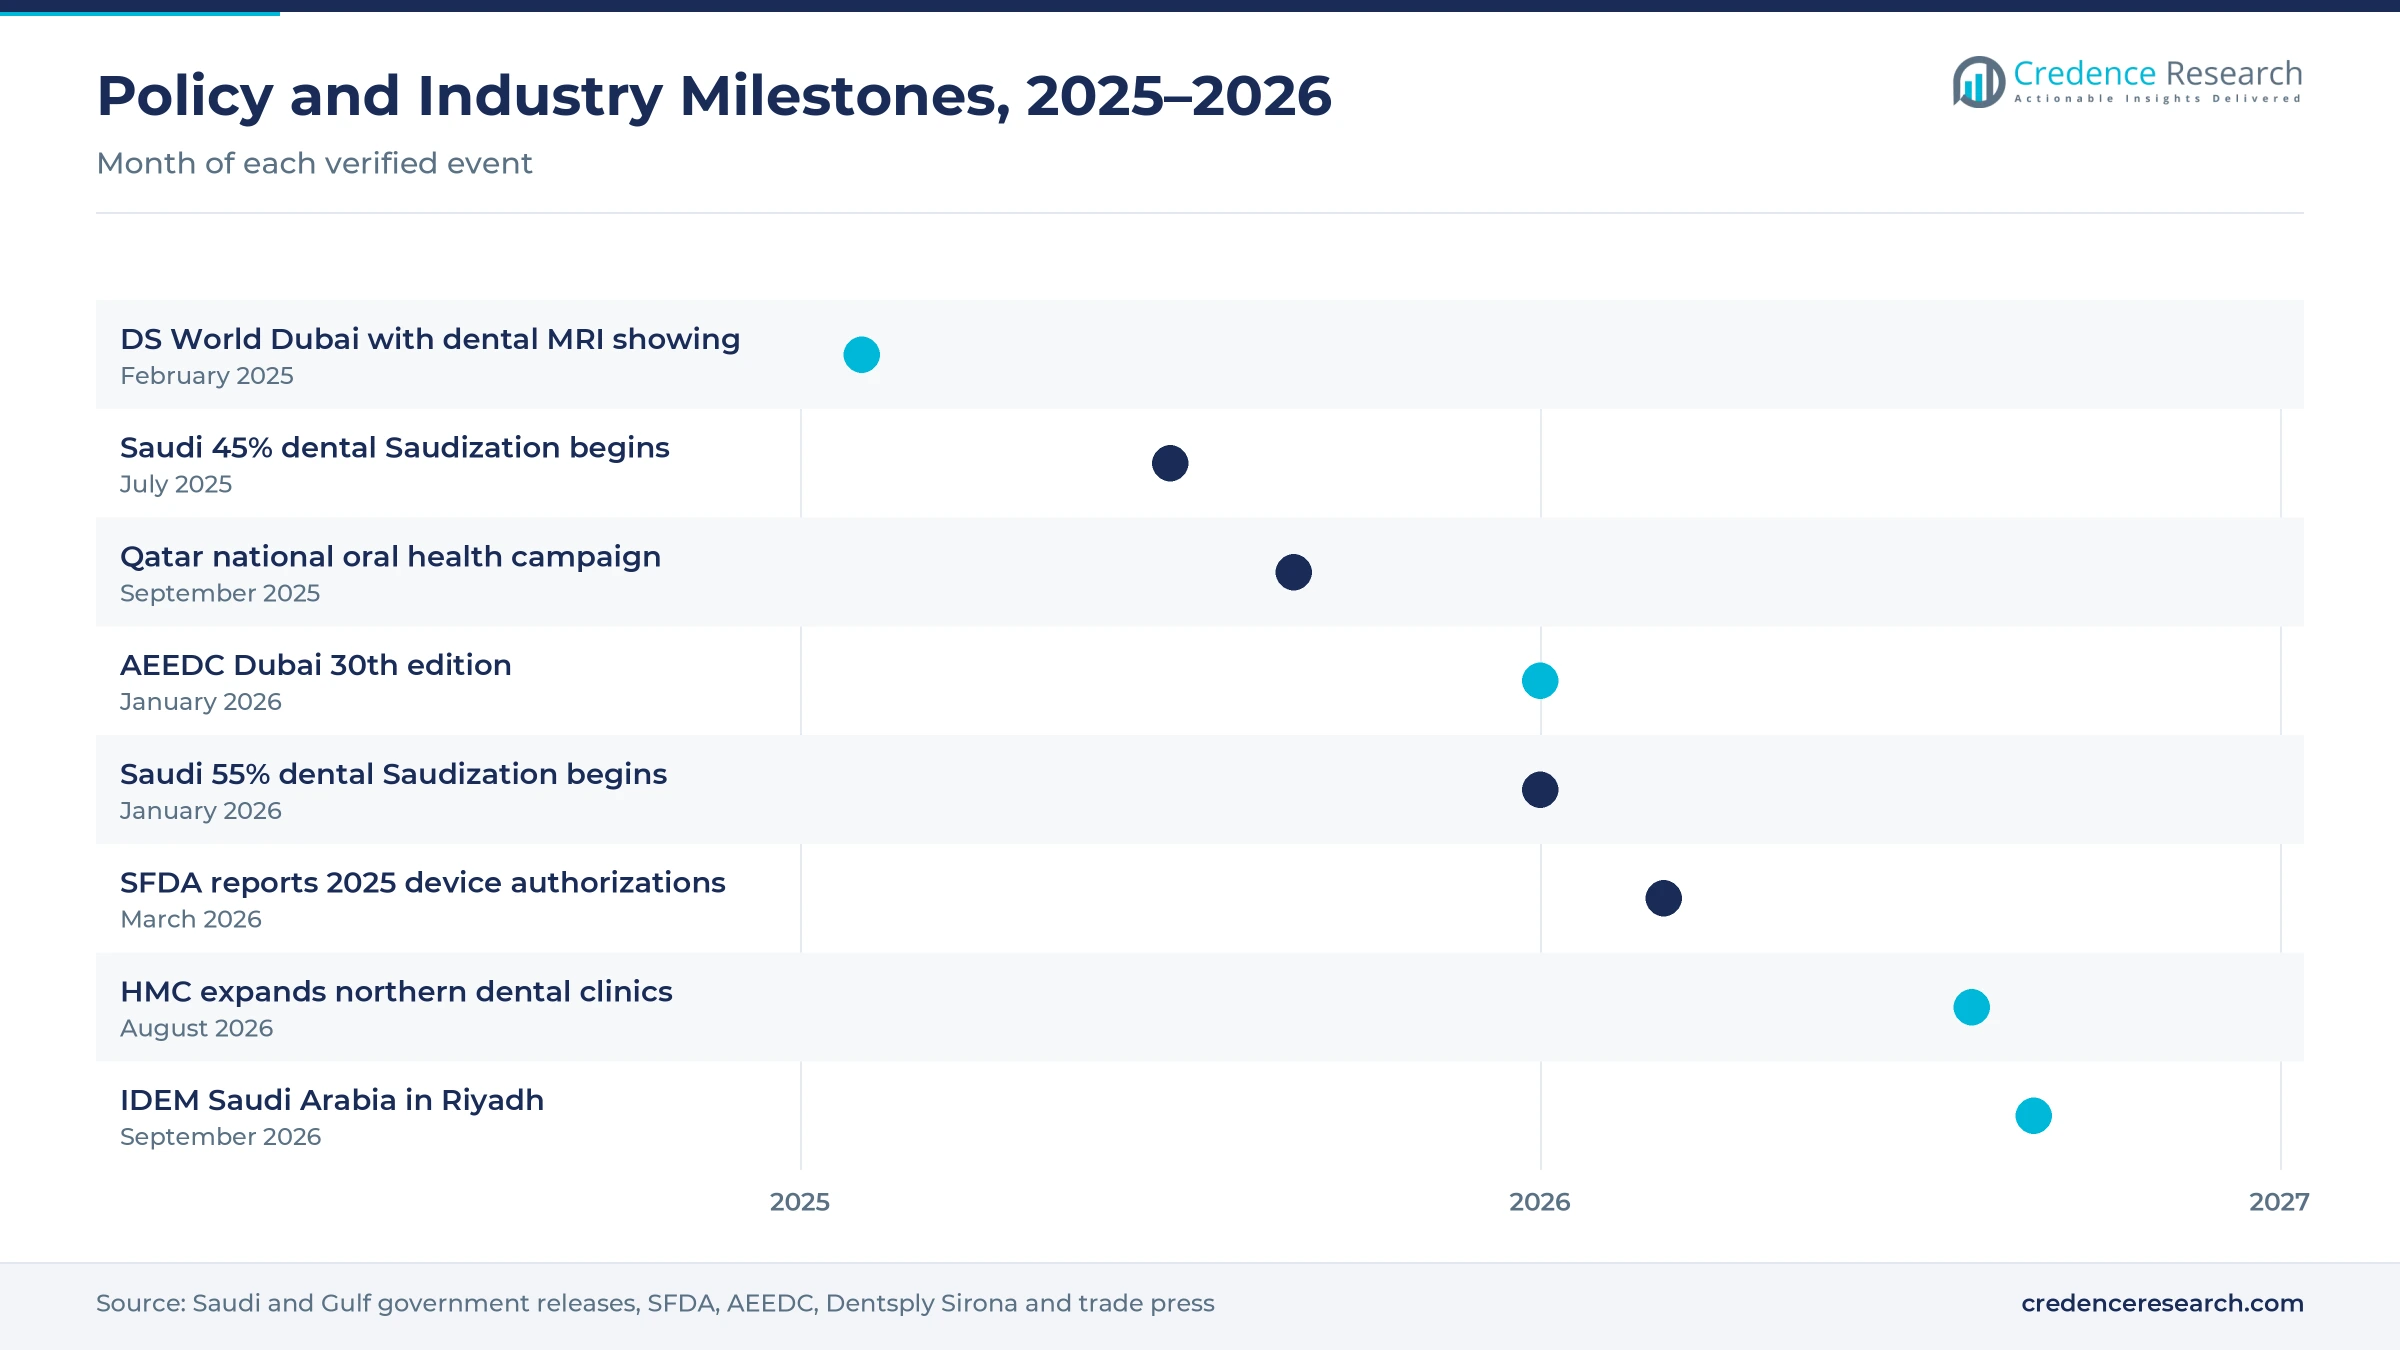
Regulatory, workforce and industry milestones, 2025–2026
| Development | Status and market relevance |
|---|---|
| In February 2025, Dentsply Sirona held DS World Dubai with nearly 1,200 participants and showed a dental MRI model for the first time in the UAE. | Highlights digital and 3D imaging demand in the Gulf |
| In July 2025, Saudi Arabia began requiring 45% Saudization in 20 private-sector dental professions. | Raised to 55% on Jan. 27, 2026 |
| In January 2026, the 30th AEEDC Dubai drew 4,319 exhibiting companies and more than 74,000 participants from 155 countries. | Main regional showroom for dental systems |
| In March 2026, the SFDA reported 14,227 marketing authorization requests processed for 129,752 medical device products in 2025. | Shows the scale of device registration in Saudi Arabia |
| In April 2026, Koelnmesse and dmg events announced IDEM Saudi Arabia for Sept. 27–29, 2026, in Riyadh. | Adds a Saudi venue for equipment launches |
Optical scanning and 3D imaging reshape Gulf practices
- Intraoral optical scanning replaces impression trays with digital models, which feed aligner, crown and implant planning and cut remakes.
- Cone-beam computed tomography gives three-dimensional views of bone and nerves, which supports implant placement, endodontics and orthodontic planning.
- Chairside CAD/CAM milling and printing lets clinics design and make crowns, inlays and surgical guides during one visit, which suits premium practices.
- Software-guided planning links scans, imaging and design files in one platform, which helps chains standardize treatment across branches.
Need a Custom Version of This Report?
Tailor the scope, geography, or segments to your exact requirements.
- Custom geography or segment scope
- Direct access to our analyst team
Global brands compete through Gulf distributor networks
Competition is led by global manufacturers that sell through regional hubs in Dubai and licensed distributors across the six Gulf countries. Dentsply Sirona runs its MENA business from Dubai and holds DS World events there to show scanners, printers and imaging systems. Straumann Group works with Gulf distributors and offers its implant system, guided surgery planning and scanner in the Middle East. Align Technology serves Gulf clinics with iTero scanners and runs direct operations in Oman since 2022. Planmeca reaches Saudi and Emirati clinics through a distribution partnership, while A-dec sells treatment units through a UAE dealer. Rivals compete on image quality, workflow integration, service coverage, training and price. Because government tenders reward low bids while private chains reward integrated digital platforms, suppliers with strong local partners and training programs win the most business.
Companies profiled and their roles in this market
| Company | Type | Role in the market |
|---|---|---|
| Dentsply Sirona | Global dental technology maker | MENA office in Dubai; DS World Dubai in February 2025 |
| Straumann Group | Swiss implant and digital dentistry group | iExcel, iGuide and SIRIOS X3 offered in the Middle East |
| Align Technology | U.S. aligner and scanner maker | iTero scanners; direct operations in Oman since 2022 |
| Planmeca Group | Finnish imaging and treatment unit maker | Partnership with Medica Group in the UAE and Saudi Arabia |
| A-dec | U.S. treatment unit and chair maker | UAE dealer partnership with AKI-Alphamed |
Credence Research view on Gulf dental capital spending
Credence Research's view is that GCC dental capital spending will grow steadily because new clinics, digital replacement and high health budgets all add equipment demand. Imaging remains the largest category, while chairside CAD/CAM and 3D scanning raise the value of each fit-out. Saudi Arabia will add the most new value as its clinic network and Saudi dental workforce expand, while the United Arab Emirates stays the main premium and distribution hub. Suppliers that combine strong distributors, training and fast service should gain share fastest.
How the GCC dental capital spending estimate was built
The report uses 2025 as the base year on a calendar basis, and market values come from the Credence Research model. That model combines dental workforce and clinic counts, health spending statistics, device registration data, workforce policy, trade event data and company announcements on products and partnerships. Segment splits and country growth rates are Credence Research estimates, while country shares follow the client-defined split. Sources used are official statistics, regulator presentations, government news, trade press and company releases, and no interviews or surveys were used.
Digital workflows and new clinics carry growth to 2035
Equipment value is expected to reach USD 890.2 million by 2035, a 7.91% CAGR during 2026–2035, as new clinics, digital replacement and public dental programs lift demand across the Gulf. Growth should stay strong through 2030 while Saudi Arabia expands its private clinic base and chains standardize digital platforms. After that, replacement of first-generation scanners and imaging units will carry more growth. Stable health budgets would support tenders, while tighter clinic margins would slow upgrades. Suppliers with local service and training are expected to gain the most.
Frequently Asked Questions
How big is the GCC dental equipment market?
Which product type leads Gulf demand?
Which country leads the GCC dental equipment market?
How does Saudization affect dental clinics?
How many dentists work in Saudi Arabia?
Which technology is growing fastest?
Who are the leading companies in Gulf dental equipment?
What are the main challenges for suppliers?
Table of Content
Chapter 1 Market Segmentation
- 1.1 Segmentation Framework
- 1.1.1 Product and Service Classification
- 1.1.2 Application and End-Use Classification
- 1.1.3 Technology and Solution Classification
- 1.1.4 Customer and Distribution Channel Classification
- 1.1.5 Geographic Segmentation
- 1.1.6 Market Segment Definitions and Boundaries
- 1.2 By Product Type
- 1.2.1 Dental Imaging Systems
- 1.2.2 Treatment Units and Chairs
- 1.2.3 CAD/CAM and Digital Dentistry Systems
- 1.2.4 Surgical, Sterilization and Support Equipment
- 1.3 By Care Setting
- 1.3.1 Independent Dental Clinics
- 1.3.2 Dental Chains and Group Practices
- 1.3.3 Hospital Dental Departments
- 1.3.4 Academic and Government Dental Centers
- 1.4 By Technology
- 1.4.1 Conventional Analog Equipment
- 1.4.2 2D Digital Imaging
- 1.4.3 3D CBCT and Optical Scanning
- 1.4.4 Chairside CAD/CAM and AI Workflows
- 1.5 By Sales Channel
- 1.5.1 Authorized Dental Distributors
- 1.5.2 Hospital and Government Tenders
- 1.5.3 Direct Manufacturer Sales
- 1.5.4 Dental Chain Framework Agreements
- 1.6 By Country
- 1.6.1 Saudi Arabia
- 1.6.2 United Arab Emirates
- 1.6.3 Kuwait and Qatar
- 1.6.4 Oman and Bahrain
Chapter 2 Introduction
- 2.1 Report Objectives and Scope
- 2.2 Product Definition and Industry Terminology
- 2.3 Market Inclusions and Exclusions
- 2.4 Research Process
- 2.4.1 Primary Research and Expert Interviews
- 2.4.2 Secondary Research and Source Review
- 2.4.3 Top-Down and Bottom-Up Estimation
- 2.4.4 Data Triangulation and Verification
- 2.5 Market Size Measurement Basis
- 2.5.1 2025: USD 415.5 million → 2035: USD 890.2 million
- 2.6 Historical and Forecast Reference Periods
- 2.6.1 Historical Period: 2018-2025
- 2.6.2 Base Year: 2025
- 2.6.3 Forecast Period: 2025-2035
- 2.7 Research Assumptions and Limitations
Chapter 3 Executive Summary
- 3.1 Market Snapshot and Key Findings
- 3.2 Base-Year Market Size, 2025
- 3.3 Forecast Market Size, 2035
- 3.4 Revenue and Volume Growth Outlook
- 3.5 Key Demand and Supply Indicators
- 3.6 Leading Market Segments
- 3.7 Fastest-Growing Market Opportunities
- 3.8 Regional Performance Highlights
- 3.9 Technology and Industry Transformation
- 3.10 Competitive Landscape Summary
- 3.11 Analyst View and Strategic Implications
Chapter 4 GCC Dental Equipment Market Trends and Developments
- 4.1 Historical Industry Development, 2018-2025
- 4.2 Recent Market Trends and Developments
- 4.3 Demand and Customer Behavior Trends
- 4.4 Technology and Product Innovation
- 4.5 Artificial Intelligence, Automation and Digitalization
- 4.6 Local Manufacturing and Supply Chain Realignment
- 4.7 Industry Partnerships, Mergers and Acquisitions
- 4.8 Sustainability and Circular Economy Developments
- 4.9 Government and Private Sector Investment Trends
- 4.10 Emerging Business Models and Commercialization
- 4.11 Industry Developments and Announcements
Chapter 5 GCC Dental Equipment Market Production, Supply and Demand Analysis
- 5.1 Demand Trend and Consumption Analysis, 2018-2025
- 5.2 Demand Forecast, 2025-2035
- 5.3 Production and Output Trend, 2018-2025
- 5.4 Production and Output Forecast, 2025-2035
- 5.5 Installed Capacity and Capacity Utilization
- 5.6 Company-Wise Production Plants and Statistics
- 5.6.1 Installed Production Capacity
- 5.6.2 Actual Production
- 5.6.3 Planned Capacity and Expansion Targets
- 5.7 Supply Chain Structure and Procurement Trends
- 5.8 Supply-Demand Gap and Bottlenecks
- 5.9 Import Dependence and Sourcing Structure
- 5.10 Contract Manufacturing and Outsourcing
- 5.11 Regional Supply and Demand Concentration
Chapter 6 GCC Dental Equipment Market Pricing Analysis
- 6.1 Pricing Structure and Measurement
- 6.2 Historical Pricing Trends, 2018-2025
- 6.3 Pricing Outlook, 2025-2035
- 6.4 Average Selling Price and Unit Economics
- 6.5 Pricing by Product and Market Segment
- 6.6 Geographic Pricing Differences
- 6.7 Key Input, Energy, Labor and Logistics Costs
- 6.8 Contract Pricing and Purchasing Models
- 6.9 Pricing Sensitivity and Competitive Positioning
- 6.10 Price, Margin and Profitability Implications
Chapter 7 GCC Dental Equipment Market Dynamics
- 7.1 Market Growth Drivers
- 7.1.1 Demand-Side Drivers
- 7.1.2 Technology and Innovation Drivers
- 7.1.3 Infrastructure and Investment Drivers
- 7.1.4 Regulatory and Policy Drivers
- 7.2 Market Restraints
- 7.2.1 Cost and Affordability Constraints
- 7.2.2 Technology and Adoption Barriers
- 7.2.3 Supply Chain and Operational Constraints
- 7.3 Market Challenges
- 7.3.1 Competitive Pressure and Margin Erosion
- 7.3.2 Skills, Infrastructure and Implementation Gaps
- 7.4 Emerging Market Opportunities
- 7.5 Market Dynamics Impact and Time-Horizon Assessment
Chapter 8 GCC Dental Equipment Value Chain Analysis
- 8.1 Industry Value Chain Overview
- 8.2 Upstream Suppliers and Critical Inputs
- 8.3 Technology and Component Providers
- 8.4 Manufacturing or Service Delivery
- 8.5 Distribution, Channel Partners and Integrators
- 8.6 Downstream Applications and End Users
- 8.7 Value Addition and Profit Pools
- 8.8 Vertical Integration and Outsourcing
- 8.9 Supplier Concentration and Risk
- 8.10 Supply Chain Localization and Resilience
Chapter 9 GCC Dental Equipment Market Regulations and Policies
- 9.1 Relevant Laws, Standards and Compliance Frameworks
- 9.2 Product, Service, Safety and Quality Requirements
- 9.3 Government Policies, Incentives and Subsidies
- 9.4 Imports, Exports and Trade Barriers
- 9.5 Public Procurement and Local Content Requirements
- 9.6 Environmental and Sustainability Compliance
- 9.7 Upcoming Policy Changes and Market Implications
Chapter 10 GCC Dental Equipment Market Hotspots and Opportunities
- 10.1 Market Opportunity Mapping and Growth Hotspots
- 10.2 High-Growth Applications and Customer Groups
- 10.3 Underserved Markets and White-Space Opportunities
- 10.4 Emerging Technology and Product Opportunities
- 10.5 New Capacity and Investment Hotspots
- 10.6 Market Entry and Expansion Opportunities
- 10.7 Distribution and Partnership Opportunities
- 10.8 Near-Term and Long-Term Commercial Potential
- 10.9 Opportunity Attractiveness and Execution Risks
Chapter 11 GCC Dental Equipment Market Outlook, 2025-2035
- 11.1 Market Size and Analysis
- 11.1.1 Revenue (Market Measurement: 2025: USD 415.5 million → 2035: USD 890.2 million)
- 11.1.2 Market Volume and Quantity Sold
- 11.1.3 Historical Market Size, 2018-2025
- 11.1.4 Base-Year Market Size, 2025
- 11.2 Market Forecast, 2025-2035
- 11.2.1 Revenue Forecast to 2035
- 11.2.2 Volume Forecast to 2035
- 11.2.3 CAGR and Year-on-Year Growth
- 11.2.4 Incremental Revenue Opportunity
- 11.3 Forecast Assumptions and Scenario Analysis
- 11.3.1 Base-Case Forecast
- 11.3.2 Optimistic and Conservative Scenarios
- 11.3.3 Technology, Pricing and Policy Sensitivities
- 11.4 Market Attractiveness and Growth Outlook
Chapter 12 GCC Dental Equipment Market Segmentation and Outlook
- 12.1 Segmentation Summary and Market Shares, 2025
- 12.2 Largest and Fastest-Growing Segments
- 12.3 By Product Type - Market Size and Forecast, 2025-2035
- 12.3.1 Segment Definition and Scope
- 12.3.2 Historical Market Size, 2018-2025
- 12.3.3 Revenue Forecast, 2025-2035
- 12.3.4 Volume Forecast, 2025-2035
- 12.3.5 Base-Year Market Share, 2025
- 12.3.6 Segment CAGR and Growth Drivers
- 12.3.7 Subsegment Market Size and Forecast
- 12.3.7.1 Dental Imaging Systems
- 12.3.7.2 Treatment Units and Chairs
- 12.3.7.3 CAD/CAM and Digital Dentistry Systems
- 12.3.7.4 Surgical, Sterilization and Support Equipment
- 12.3.8 Subsegment Pricing and Adoption Trends
- 12.3.9 Leading Suppliers and Competition
- 12.3.10 Regional Demand and Opportunities
- 12.4 By Care Setting - Market Size and Forecast, 2025-2035
- 12.4.1 Segment Definition and Scope
- 12.4.2 Historical Market Size, 2018-2025
- 12.4.3 Revenue Forecast, 2025-2035
- 12.4.4 Volume Forecast, 2025-2035
- 12.4.5 Base-Year Market Share, 2025
- 12.4.6 Segment CAGR and Growth Drivers
- 12.4.7 Subsegment Market Size and Forecast
- 12.4.7.1 Independent Dental Clinics
- 12.4.7.2 Dental Chains and Group Practices
- 12.4.7.3 Hospital Dental Departments
- 12.4.7.4 Academic and Government Dental Centers
- 12.4.8 Subsegment Pricing and Adoption Trends
- 12.4.9 Leading Suppliers and Competition
- 12.4.10 Regional Demand and Opportunities
- 12.5 By Technology - Market Size and Forecast, 2025-2035
- 12.5.1 Segment Definition and Scope
- 12.5.2 Historical Market Size, 2018-2025
- 12.5.3 Revenue Forecast, 2025-2035
- 12.5.4 Volume Forecast, 2025-2035
- 12.5.5 Base-Year Market Share, 2025
- 12.5.6 Segment CAGR and Growth Drivers
- 12.5.7 Subsegment Market Size and Forecast
- 12.5.7.1 Conventional Analog Equipment
- 12.5.7.2 2D Digital Imaging
- 12.5.7.3 3D CBCT and Optical Scanning
- 12.5.7.4 Chairside CAD/CAM and AI Workflows
- 12.5.8 Subsegment Pricing and Adoption Trends
- 12.5.9 Leading Suppliers and Competition
- 12.5.10 Regional Demand and Opportunities
- 12.6 By Sales Channel - Market Size and Forecast, 2025-2035
- 12.6.1 Segment Definition and Scope
- 12.6.2 Historical Market Size, 2018-2025
- 12.6.3 Revenue Forecast, 2025-2035
- 12.6.4 Volume Forecast, 2025-2035
- 12.6.5 Base-Year Market Share, 2025
- 12.6.6 Segment CAGR and Growth Drivers
- 12.6.7 Subsegment Market Size and Forecast
- 12.6.7.1 Authorized Dental Distributors
- 12.6.7.2 Hospital and Government Tenders
- 12.6.7.3 Direct Manufacturer Sales
- 12.6.7.4 Dental Chain Framework Agreements
- 12.6.8 Subsegment Pricing and Adoption Trends
- 12.6.9 Leading Suppliers and Competition
- 12.6.10 Regional Demand and Opportunities
- 12.7 By Country - Market Size and Forecast, 2025-2035
- 12.7.1 Segment Definition and Scope
- 12.7.2 Historical Market Size, 2018-2025
- 12.7.3 Revenue Forecast, 2025-2035
- 12.7.4 Volume Forecast, 2025-2035
- 12.7.5 Base-Year Market Share, 2025
- 12.7.6 Segment CAGR and Growth Drivers
- 12.7.7 Subsegment Market Size and Forecast
- 12.7.7.1 Saudi Arabia
- 12.7.7.2 United Arab Emirates
- 12.7.7.3 Kuwait and Qatar
- 12.7.7.4 Oman and Bahrain
- 12.7.8 Subsegment Pricing and Adoption Trends
- 12.7.9 Leading Suppliers and Competition
- 12.7.10 Regional Demand and Opportunities
- 12.8 Segment Growth Comparison
- 12.9 Segment Attractiveness and Priority Matrix
Chapter 13 GCC Dental Equipment Geographic Market Outlook, 2025-2035
- 13.1 Regional Market Size and Country-Level Shares, 2025
- 13.2 Country Market Size Comparison, 2025
- 13.3 Country Market Forecasts, 2025-2035
- 13.4 Subregional Industrial and Demand Clusters
- 13.5 Intra-Regional Pricing and Cost Differences
- 13.6 Cross-Border Trade and Supply Networks
- 13.7 Regional Supply and Demand Balances
- 13.8 Country Opportunity Comparison and Prioritization
Note: Every listed country is covered on the structure shown under the first country.
Chapter 14 GCC Dental Equipment Technology, Innovation and Sustainability Outlook
- 14.1 Technology Landscape and Maturity
- 14.2 Product, Process and Service Innovation
- 14.3 AI, Automation and Digital Tools in the Industry
- 14.4 Technology Adoption and Performance Benchmarking
- 14.5 Innovation Pipeline and R&D Investment
- 14.6 Patent and Intellectual Property Trends
- 14.7 Energy Efficiency and Resource Management
- 14.8 Sustainability, Recycling and Circularity
- 14.9 Technology Roadmap, 2025-2035
- 14.10 Risks of Obsolescence and Technology Substitution
Chapter 15 GCC Dental Equipment Market Key Strategic Imperatives
- 15.1 Growth and Market Entry Priorities
- 15.2 High-Return Products and Segments
- 15.3 Pricing, Profitability and Cost Optimization
- 15.4 Technology Investment and Product Differentiation
- 15.5 Supply Chain Localization and Resilience
- 15.6 Distribution and Customer Acquisition
- 15.7 Partnership, Acquisition and Capacity Strategy
- 15.8 Regional Expansion Priorities
- 15.9 Short-, Medium- and Long-Term Actions
Chapter 16 Competition Outlook
- 16.1 Industry Competition Characteristics
- 16.2 Market Structure and Concentration
- 16.3 Market Share and Competitive Positioning, 2025
- 16.4 Company-Wise Revenue and Product Benchmarking
- 16.5 Production and Service Capacity Benchmarking
- 16.6 Technology, Pricing and Differentiation
- 16.7 Regional Footprint and Distribution Strength
- 16.8 Mergers, Acquisitions and Strategic Alliances
- 16.9 New Entrants and Competitive Threats
- 16.10 Porter's Five Forces and Industry Attractiveness
- 16.11 Competitive Outlook, 2025-2035
Chapter 17 Company Profiles
- 17.1 Company Coverage and Selection Criteria
- 17.2 Dentsply Sirona
- 17.2.1 Business Description
- 17.2.2 Company Ownership and Geographic Presence
- 17.2.3 Product and Service Portfolio
- 17.2.4 Manufacturing and Operating Footprint
- 17.2.5 Production Capacity and Expansion Plans
- 17.2.6 Financial Performance and Investment
- 17.2.7 Market Share and Competitive Position
- 17.2.8 Technology and Innovation Capabilities
- 17.2.9 Strategic Alliances or Partnerships
- 17.2.10 Recent Developments
- 17.2.11 Growth Strategy and Outlook
- 17.3 Envista Holdings Corporation
- 17.4 Straumann Group
- 17.5 Planmeca Group
- 17.6 Align Technology
- 17.7 3Shape
- 17.8 Carestream Dental
- 17.9 Ivoclar Group
- 17.10 A-dec
- 17.11 W&H Group
- 17.12 Other Relevant Market Participants
Note: Every listed company is profiled on the structure shown under the first company. The company list is preliminary and may change based on research findings, market developments, data availability and client requirements.
Chapter 18 Disclaimer
- 18.1 Research and Forecast Disclaimer
- 18.2 Data Source and Estimation Limitations
Note: The depth of individual sections depends on data availability for this market. Volume, capacity, trade and other unit-based metrics are included where applicable.

