
Surgery and endoscopy growth widen bleeding control use
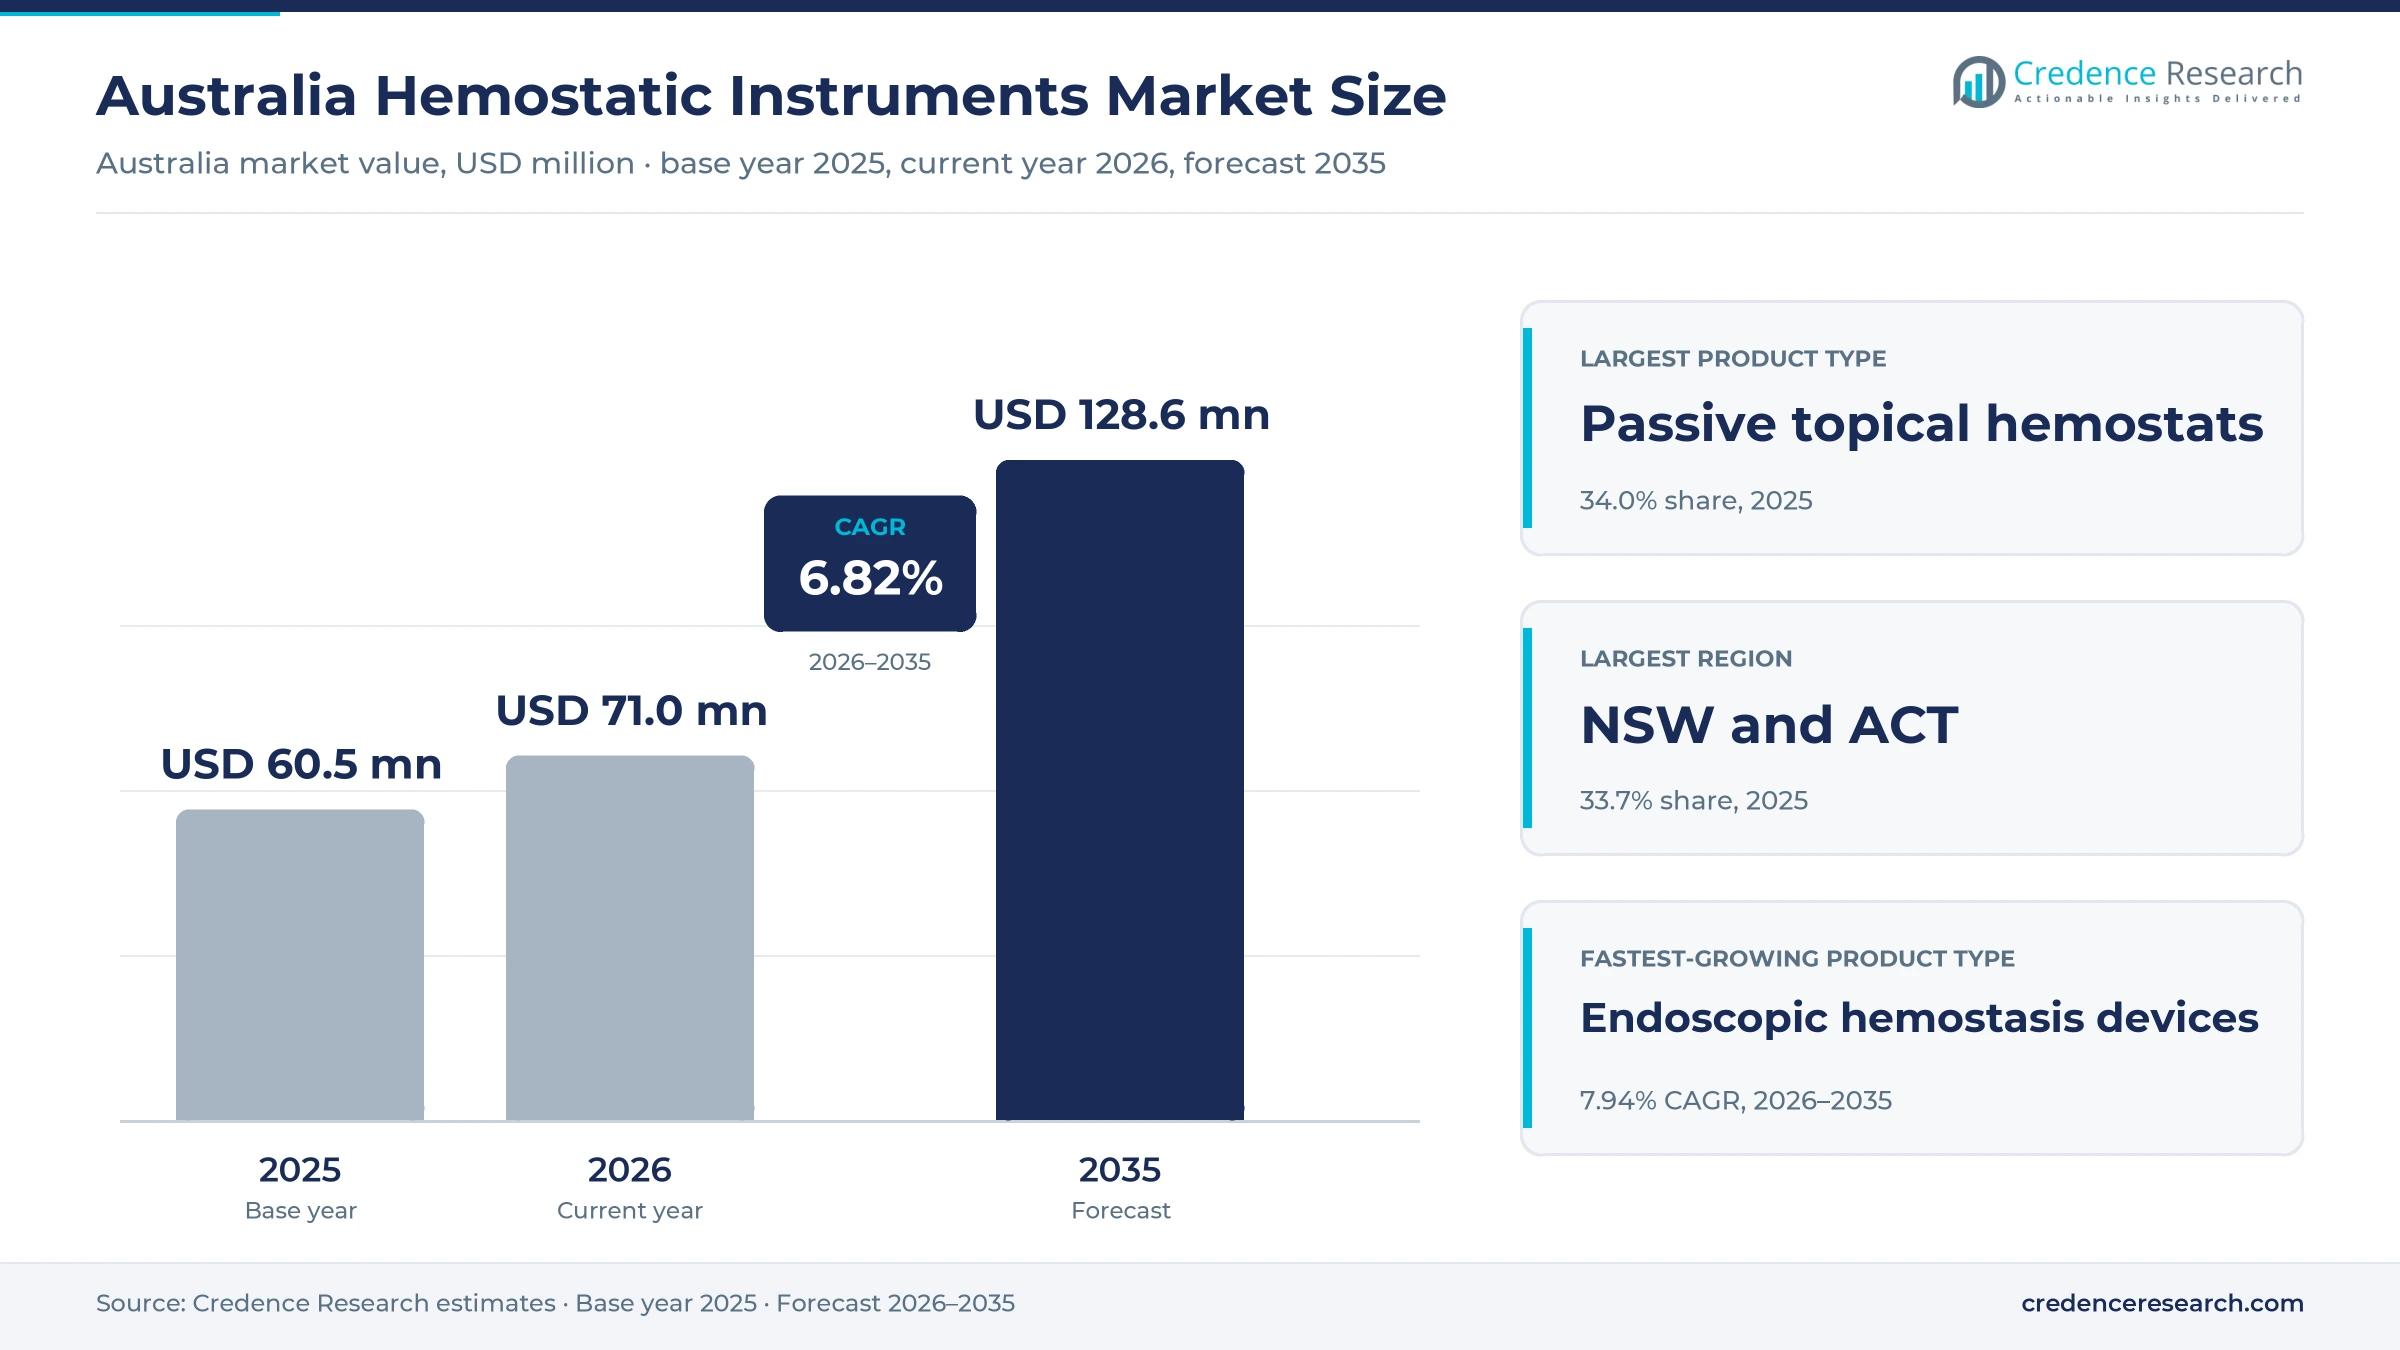
The Australia hemostatic instruments market was valued at USD 60.5 million in 2025 and is projected to increase from USD 71.0 million in 2026 to USD 128.6 million by 2035, registering a CAGR of 6.82% during 2026–2035. Demand comes from public and private hospitals that control bleeding during cardiac, orthopedic, abdominal and general surgery, and from endoscopy units that treat gastrointestinal bleeds with clips, powders and thermal tools. New South Wales and Australian Capital Territory held the largest regional share, 33.7% in 2025, because the zone has the most hospitals and surgeons. Queensland and Northern Territory is the fastest-growing region at 7.23% a year, as population growth adds procedures. In turn, the federal government confirmed in May 2024 that general use items would stay funded on the national device list, which kept private reimbursement in place for many surgical consumables.
Which bleeding control products does the estimate cover?
The estimate measures the value of passive topical hemostats such as gelatin, collagen, cellulose and starch products, active hemostats and fibrin sealants, endoscopic clips, powders and thermal devices, and mechanical clamps, clips and compression instruments used to stop bleeding. It counts purchases by public hospital networks, private hospital groups and independent day and endoscopy providers.
The estimate excludes blood products given by transfusion, systemic drugs that change clotting, and general energy platforms sold mainly for cutting. The value chain runs from global manufacturers through Australian subsidiaries, specialist distributors and wholesalers to hospital theaters and endoscopy suites.
Australia Hemostatic Instruments Market Insights
- The Australia hemostatic instruments market was valued at USD 60.5 million in 2025 and is projected to reach USD 128.6 million by 2035, registering a CAGR of 6.82% during 2026–2035.
- New South Wales and Australian Capital Territory held a 33.7% share of 2025 value, because the zone performs the most surgery.
- Passive topical hemostats led with a 34.0% share of 2025 value, because surgeons use them across most open and minimally invasive operations.
- Public hospitals recorded 791,000 elective surgery admissions in 2024–25, according to national hospital statistics released in December 2025.
- Endoscopic hemostasis devices grow fastest at 7.94% a year during 2026–2035, as colonoscopy and therapeutic endoscopy volumes keep rising.
Topical agents lead while endoscopic devices grow fastest
Why do passive topical hemostats lead value?
Based on product type, the market is categorized into passive topical hemostats, active hemostats and fibrin sealants, endoscopic hemostasis devices and mechanical hemostatic instruments. Passive Topical Hemostats led with a 34.0% share of 2025 value, because gelatin, collagen and plant-based products are used in most operating theaters. Endoscopic Hemostasis Devices grow fastest at 7.94% a year, as endoscopists treat more bleeds with clips and powders.
How do cardiac and gastrointestinal cases split use?
Based on disease area, the market is categorized into gastrointestinal bleeding, cardiovascular conditions, musculoskeletal conditions and abdominal and soft-tissue conditions. Cardiovascular Conditions led with a 30.0% share of 2025 value, because cardiac and vascular surgery uses sealants and patches on large suture lines. Gastrointestinal Bleeding grows fastest at 7.77% a year, as screening programs send more patients for colonoscopy.
Why do public hospital networks buy the most?
Based on end user, the market is categorized into public hospital networks, private hospital groups and independent procedural providers. Public Hospital Networks led with a 48.0% share of 2025 value, because they treat most emergency, trauma and complex cases. Independent Procedural Providers grow fastest at 7.80% a year, as doctor-owned day surgeries and endoscopy centers open across the major cities.
How do manufacturers and distributors reach hospitals?
Based on sales channel, the market is categorized into manufacturer direct sales, specialist distributor sales and medical wholesaler sales. Manufacturer Direct Sales led with 55.0% of 2025 value, because large device makers hold hospital contracts and train surgeons in theater. Specialist Distributor Sales grow fastest at 7.25% a year, as smaller brands and new agents reach private and day hospitals through focused local partners.
| Segment Group | Leading Sub-segment | Share, 2025 | Fastest-growing Sub-segment | CAGR, 2026–2035 |
|---|---|---|---|---|
| By Product Type | Passive Topical Hemostats | 34.0% | Endoscopic Hemostasis Devices | 7.94% |
| By Disease Area | Cardiovascular Conditions | 30.0% | Gastrointestinal Bleeding | 7.77% |
| By End User | Public Hospital Networks | 48.0% | Independent Procedural Providers | 7.80% |
| By Sales Channel | Manufacturer Direct Sales | 55.0% | Specialist Distributor Sales | 7.25% |
Request a Free Sample
Fill in your details and we'll send you a free sample report.
- Sample data tables & charts
- Research methodology
Funded surgery, endoscopy tools and new agents lift demand
How does funded procedural throughput lift product use?
Funded procedural throughput lifts product use, because nearly every operation needs some form of bleeding control. Public hospitals recorded 791,000 elective surgery admissions in 2024–25, with a median wait of 45 days, according to national data reported by Scimex. Private hospitals performed 1,827,599 surgeries in 2023-24 and carry about 70% of all planned surgery in Australia. Insured hospital episodes also reached 1,306,750 in the June 2025 quarter, up 2.2% over 12 months. Emergency departments also handled 9.1 million presentations in 2024–25, which adds trauma and acute bleeding cases. As a result, public hospital networks hold 48.0% of 2025 value, while private groups add steady volume through insured elective cases.
Why does therapeutic endoscopy product breadth widen demand?
Therapeutic endoscopy product breadth widens demand, because clips, powders and thermal tools let endoscopists stop bleeds without surgery. Australians undergo about 1 million colonoscopies each year, according to the Australian Commission on Safety and Quality in Health Care. The national bowel screening program screened about 2.6 million people, and 86,089 participants in 2023 needed further assessment after a positive result. Olympus Australia sponsors a short-term gastrointestinal endoscopic clip on the national register, while Cook Medical markets Hemospray powder for nonvariceal bleeds. In turn, endoscopic hemostasis devices grow at 7.94% a year, the fastest product rate, as hospitals add endoscopy devices and accessories.
How does advanced agent portfolio development change buying?
Advanced agent portfolio development changes buying, because manufacturers now offer patches, powders and sealants that work faster and store more easily. Baxter launched a room-temperature version of Hemopatch across Australia and New Zealand in the 2025-26 summer, with a shelf life of up to 36 months, according to a Jan. 21, 2026, release. The national register lists Hemopatch as a collagen agent sponsored by Baxter Healthcare. BD markets Arista AH plant-based powder in Australia with a five-year shelf life, citing a randomized trial of 288 patients. As a result, active products and fibrin sealants gain ground in cardiac, liver and urological surgery.
Why do insurance coverage and an aging population support use?
Insurance coverage and an aging population support use, because older patients need more cardiac, joint and abdominal operations. People aged 65 and over made up 18.1% of the Australian population in 2025, according to the World Bank. Some 12,531,009 people, or 45.4% of the population, held private hospital cover at June 30, 2025, according to the Australian Prudential Regulation Authority. Insurer benefits for medical devices reached AUD 622.08 million in that quarter, up 12.4%, with cardiac devices the largest group at 17.8%. In turn, cardiovascular conditions hold 30.0% of 2025 value, because cardiac and vascular operations use the most sealants and patches per case.
Day surgery, ready-to-use formats and access gaps shape use
How is the shift to day surgery changing purchases?
The shift to day surgery is changing purchases, because more short procedures now take place outside large hospitals. Australia had 637 private hospitals including day surgeries in July 2025, and doctor-owned day surgeries have been the main type of new opening since 2020, according to the private hospitals association. Same-day cases made up 74.1% of private hospital admissions in 2023-24, or 3,812,478 admissions. About 80 private hospitals have also closed since 2020, which moves cases toward the remaining sites and newer day centers. As a result, independent procedural providers grow at 7.80% a year, the fastest end-user rate, and favor compact, ready-to-use products that need little storage space.
Why is the rise of ready-to-use formats notable?
The rise of ready-to-use formats is notable, because theater teams want products that need no mixing, thawing or refrigeration. Baxter removed the need for cold storage with its room-temperature Hemopatch, which it launched in New Zealand in September 2025 before the wider regional rollout. BD sells Arista AH in 1 g, 3 g and 5 g powder sizes with long applicators for laparoscopic use. Cook Medical states that Hemospray contains no human or animal proteins and sprays from a carbon dioxide cartridge. In turn, flowable hemostats and dry powders gain use in minimally invasive procedures, where surgeons must reach bleeding sites through small ports and need products that are ready the moment they are opened.
Can closing colonoscopy access gaps open new demand?
Closing colonoscopy access gaps can open new demand, because many regional and lower-income Australians receive fewer procedures than city residents. Colonoscopy rates were about four times higher in major cities, at 2,550 per 100,000 people, than in remote areas, at 633, in 2023-24. Rates in the most affluent areas were also nearly double those in the most disadvantaged areas, at 3,067 against 1,675 per 100,000. Bowel screening participation reached only 41.7% for invitations issued in 2022 and 2023. Australians undergo about 1 million colonoscopies a year, so even small gains in regional access add many procedures. As a result, gastrointestinal bleeding grows fastest at 7.77% a year as access widens.
Is there room to grow as device funding rules settle?
Suppliers have room to grow as device funding rules settle, because private hospitals and insurers now know how surgical consumables will be paid. The federal government announced on May 1, 2024, that 475 general use items, including surgical glues, would stay on the national device list, according to the Department of Health. It then consulted on general use item growth from Aug. 9 to Sept. 20, 2024. Sponsors could apply to list new items with a listed comparator from the November 2024 list. In turn, makers of patches, sealants and electrosurgical devices can plan launches with more certainty, because private hospitals know which items insurers will fund.
Benefit cuts, closures and evidence demands test suppliers
How do benefit cuts pressure product prices?
Benefit cuts pressure product prices, because the federal government cut general use item benefits by 60% of the gap to public prices on July 1, 2022, and by a further 40% on March 1, 2023. As a result, private hospitals now negotiate harder on consumable prices. Suppliers respond with value bundles, clinical training and evidence on time saved in theater, which helps them defend premium products in tenders and keep their place on hospital formularies.
Why do private hospital closures shift buying patterns?
Private hospital closures shift buying patterns, because about 80 private hospitals have closed since 2020 while new openings are mostly small day surgeries. In turn, suppliers lose some large overnight accounts and must serve many smaller sites with different product needs. Companies respond with smaller pack sizes, distributor partners and remote ordering, which keeps service costs under control across scattered customers. Day surgeries also tend to stock fewer brands, which raises the stakes of every tender.
How do evidence demands slow new product uptake?
Evidence demands slow new product uptake, because hospital product committees ask for clinical data and cost comparisons before adding a new agent to theater stock. As a result, newer powders and patches can take months to win formulary approval. Suppliers respond with local surgeon trials, published outcome data and training sessions, which help clinicians compare products on time to bleeding control and cost per case. This evidence work adds real cost for smaller suppliers and new brands.
Why do long waits and staffing limits cap volumes?
Long waits and staffing limits cap volumes, because public hospitals can only run as many theater and endoscopy lists as their staff allow. Some 6.0% of public elective surgery patients waited more than a year in 2024–25. In turn, product use grows more slowly than clinical need. States respond with surgery blitzes and outsourcing to private hospitals, which moves some volume to private and day surgery sites and spreads product demand.
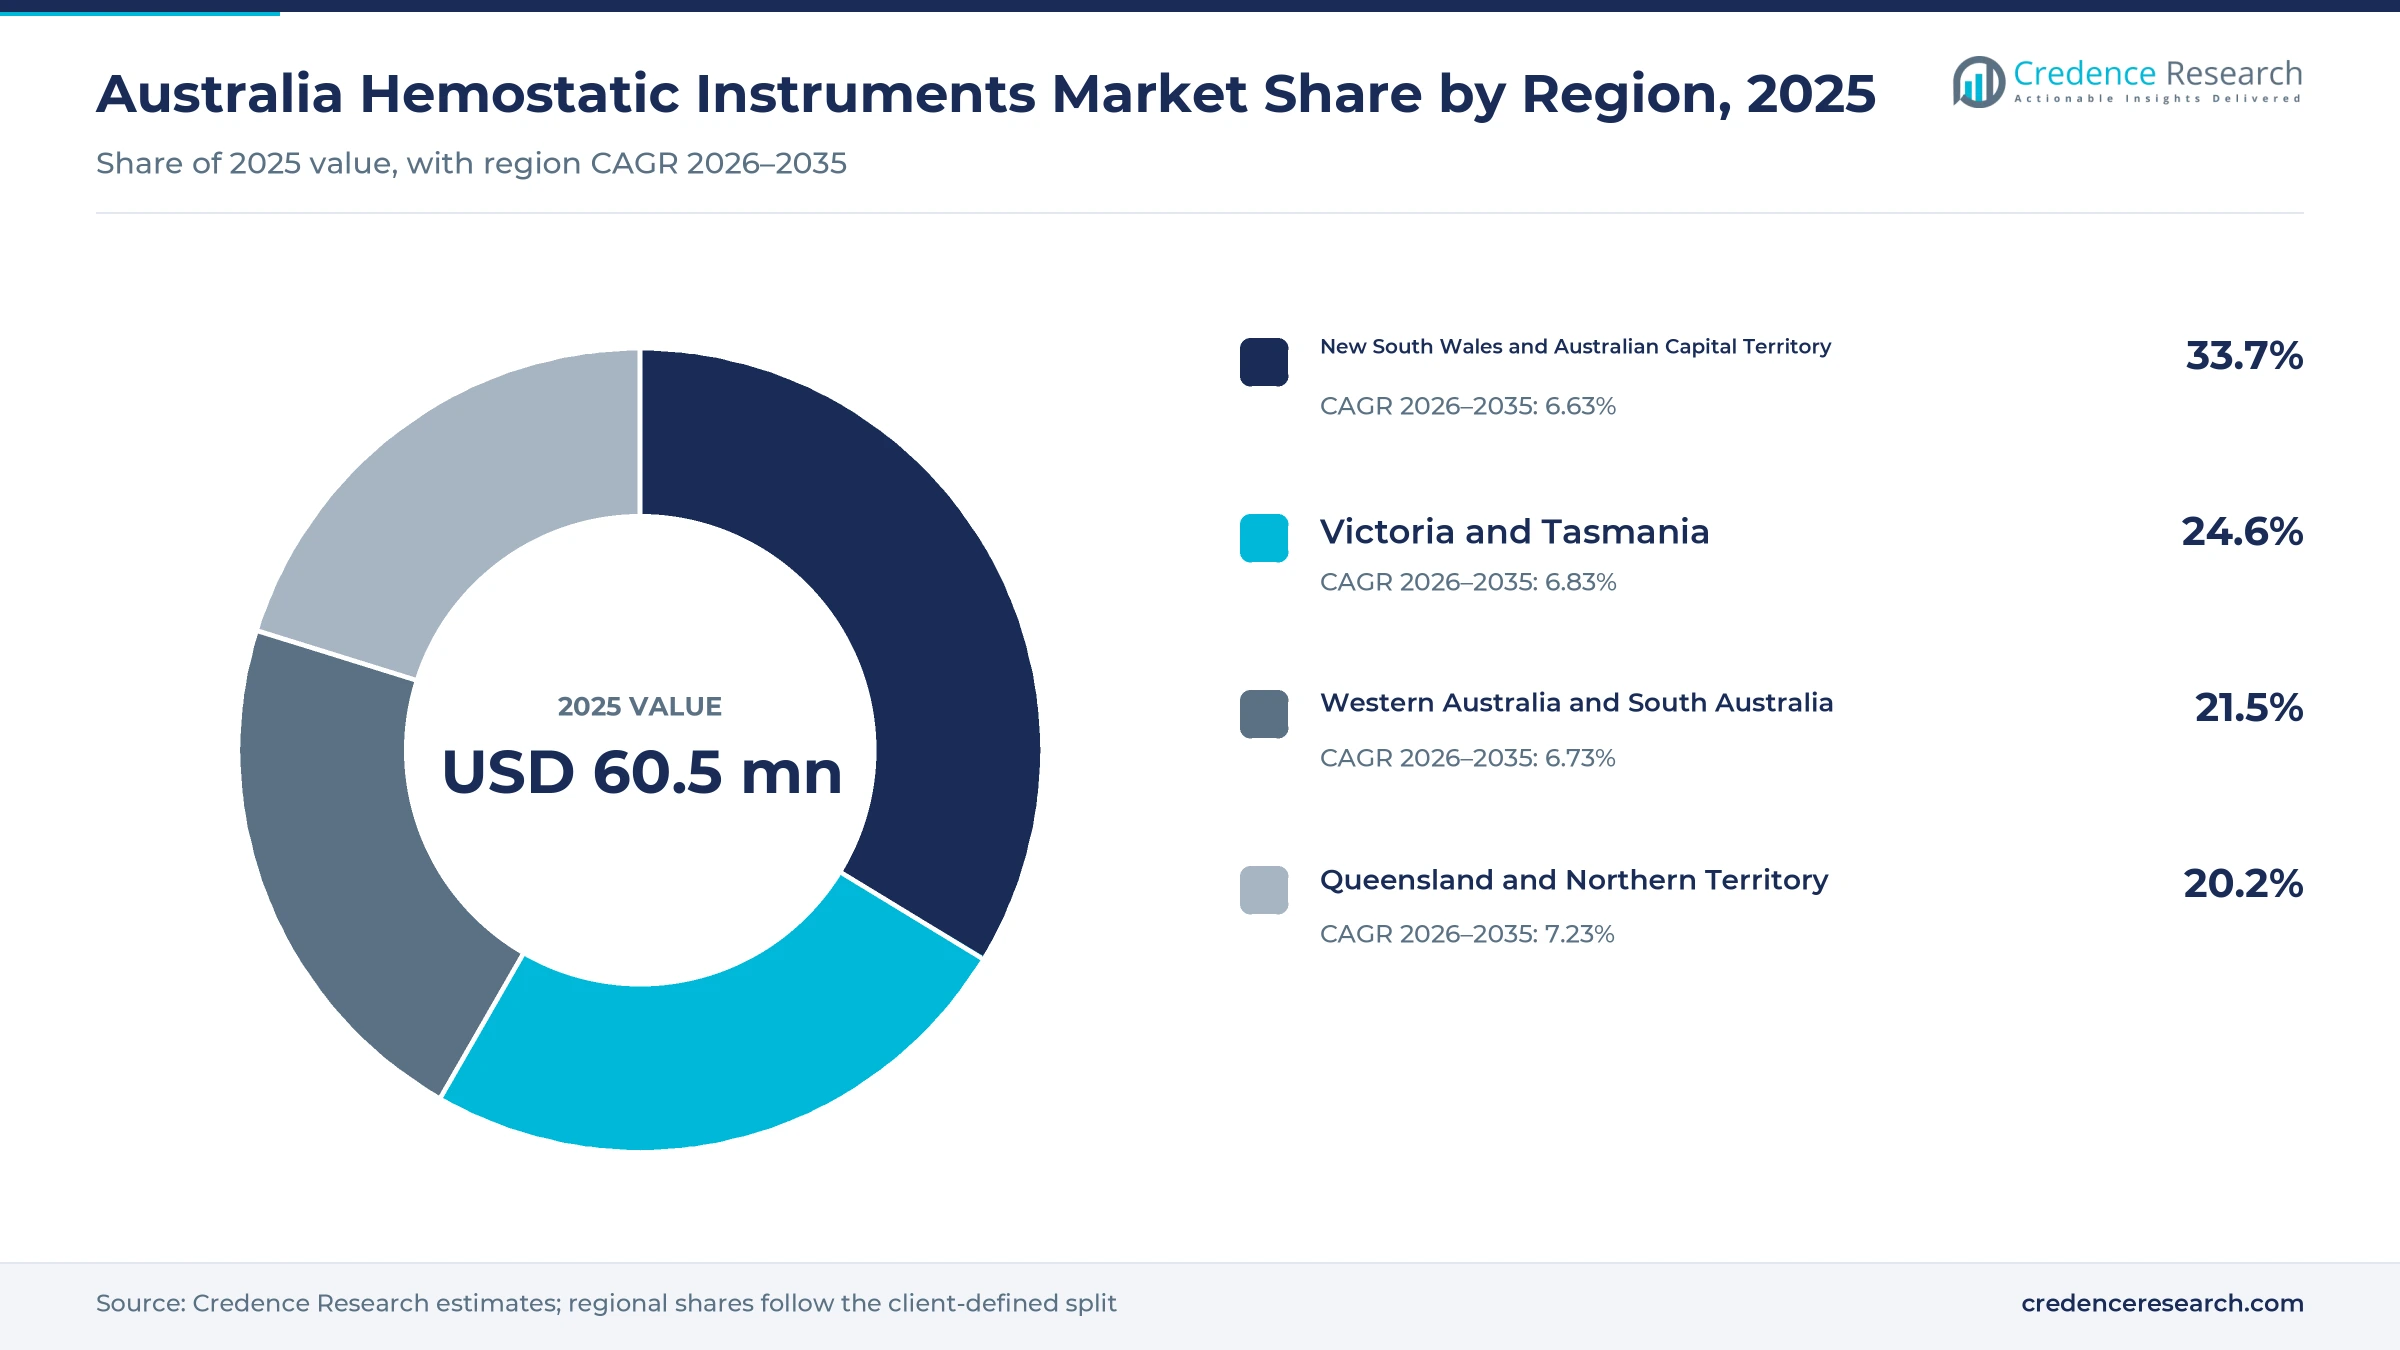
New South Wales leads as Queensland grows fastest
| Region | Value, 2025 (USD million) | Share, 2025 | CAGR, 2026–2035 |
|---|---|---|---|
| New South Wales and Australian Capital Territory | 20.4 | 33.7% | 6.63% |
| Victoria and Tasmania | 14.9 | 24.6% | 6.83% |
| Western Australia and South Australia | 13.0 | 21.5% | 6.73% |
| Queensland and Northern Territory | 12.2 | 20.2% | 7.23% |
Why do new South Wales and the ACT hold the top share?
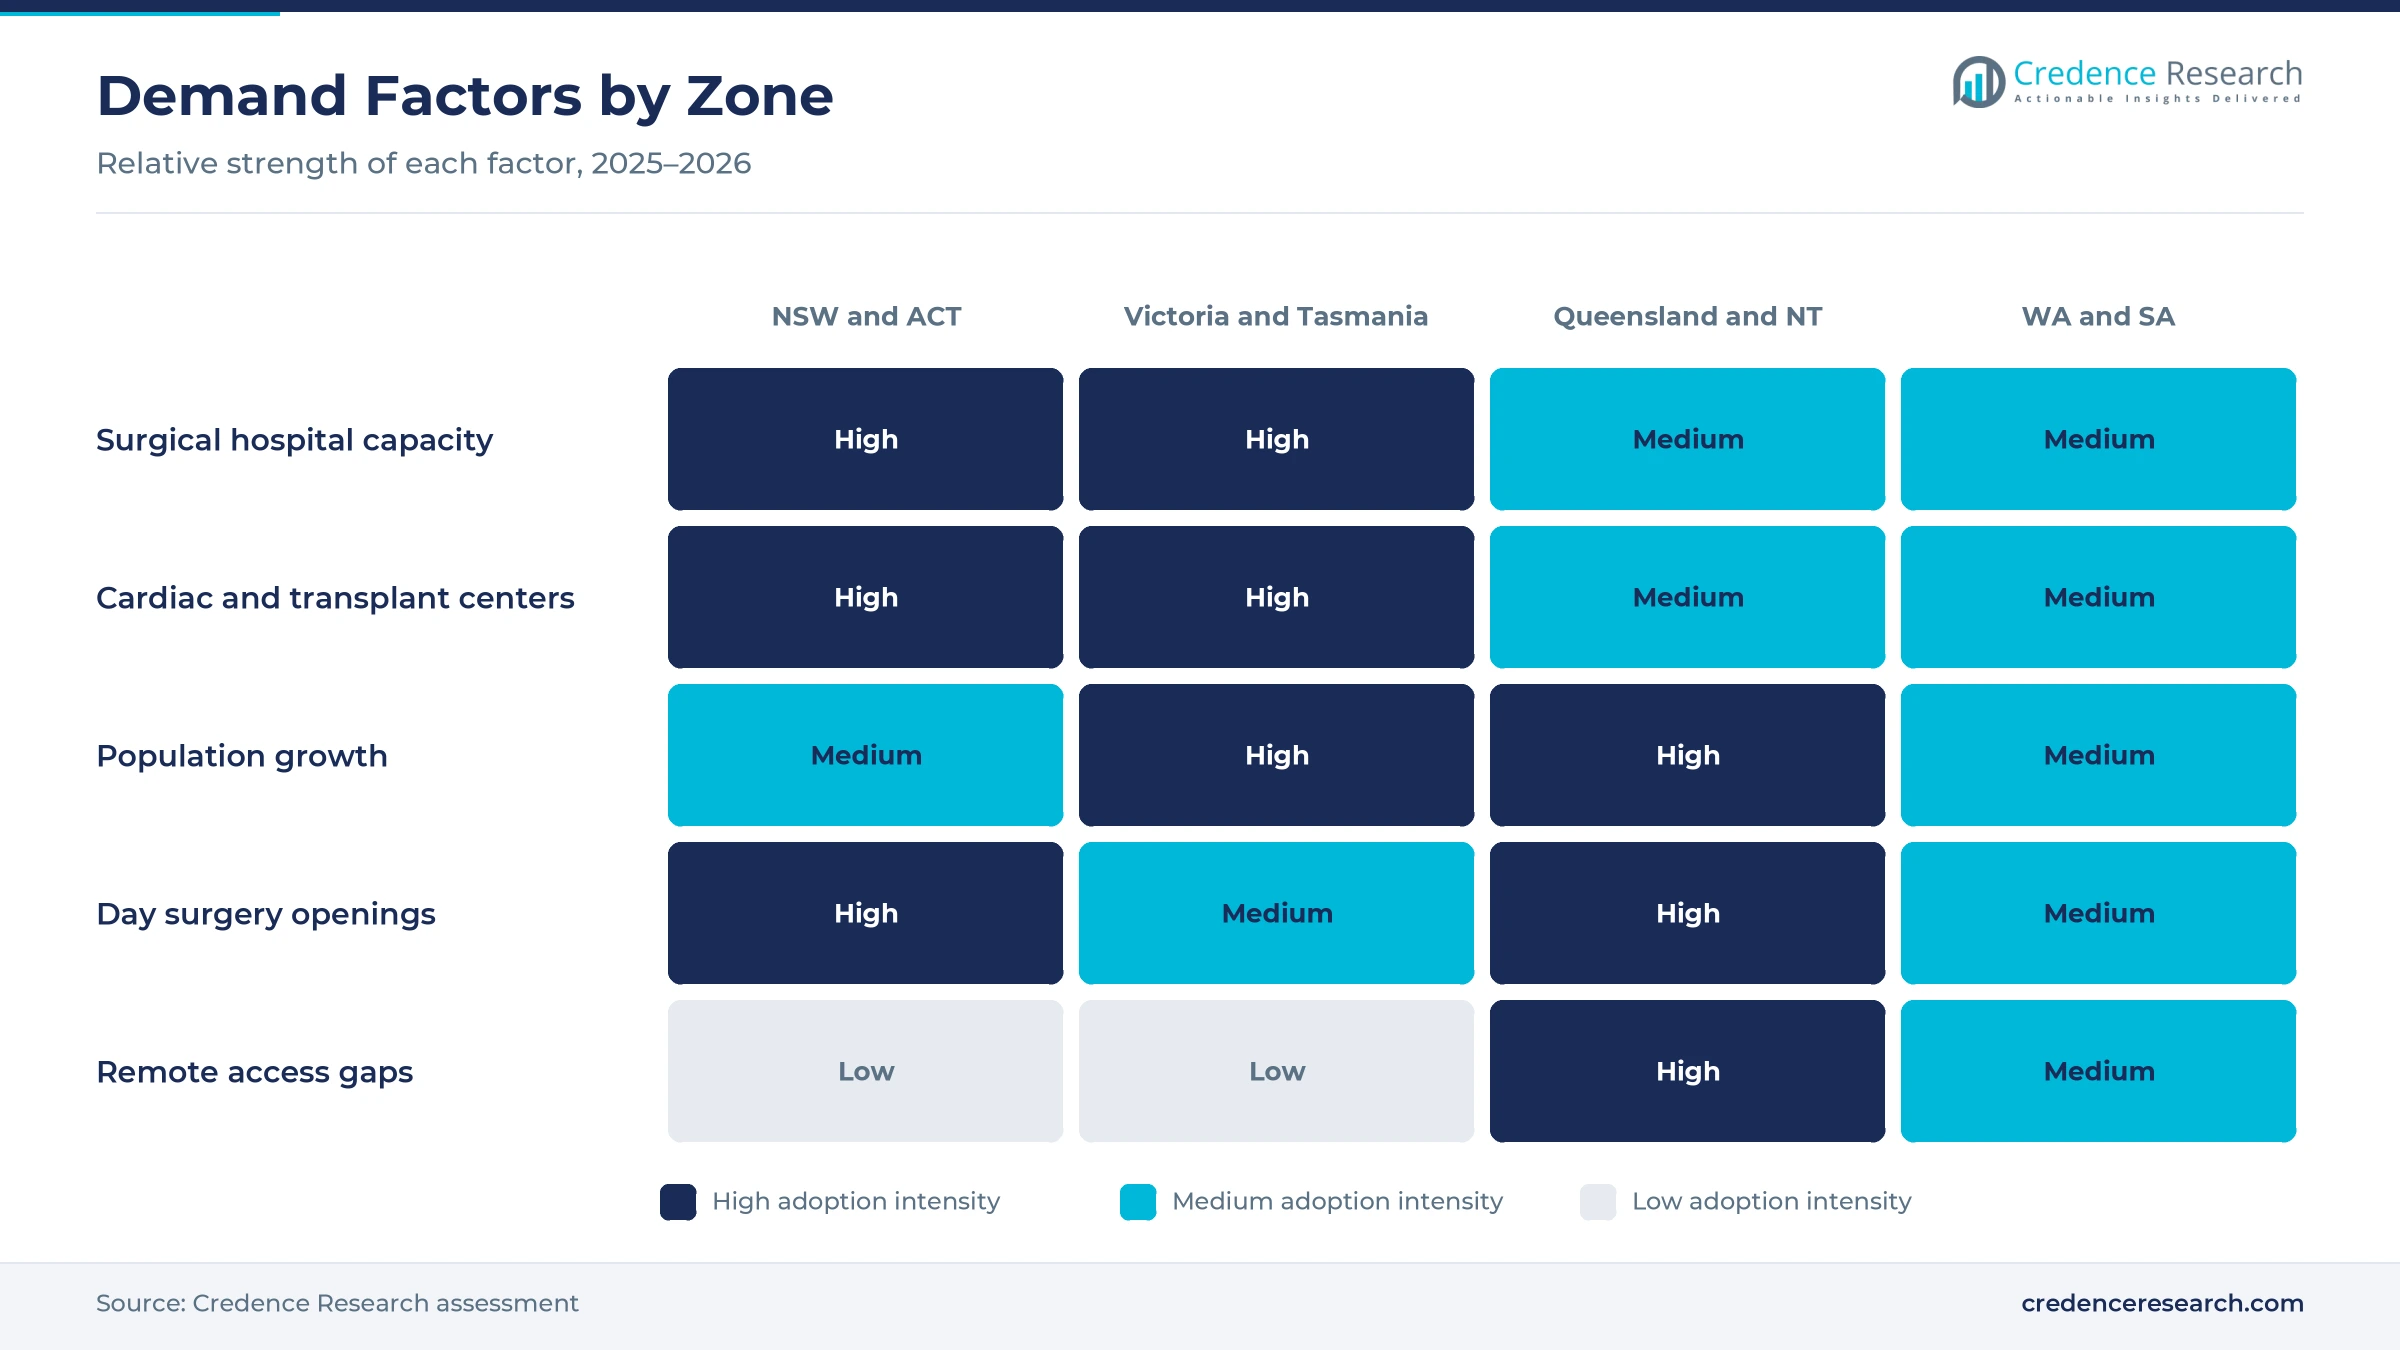
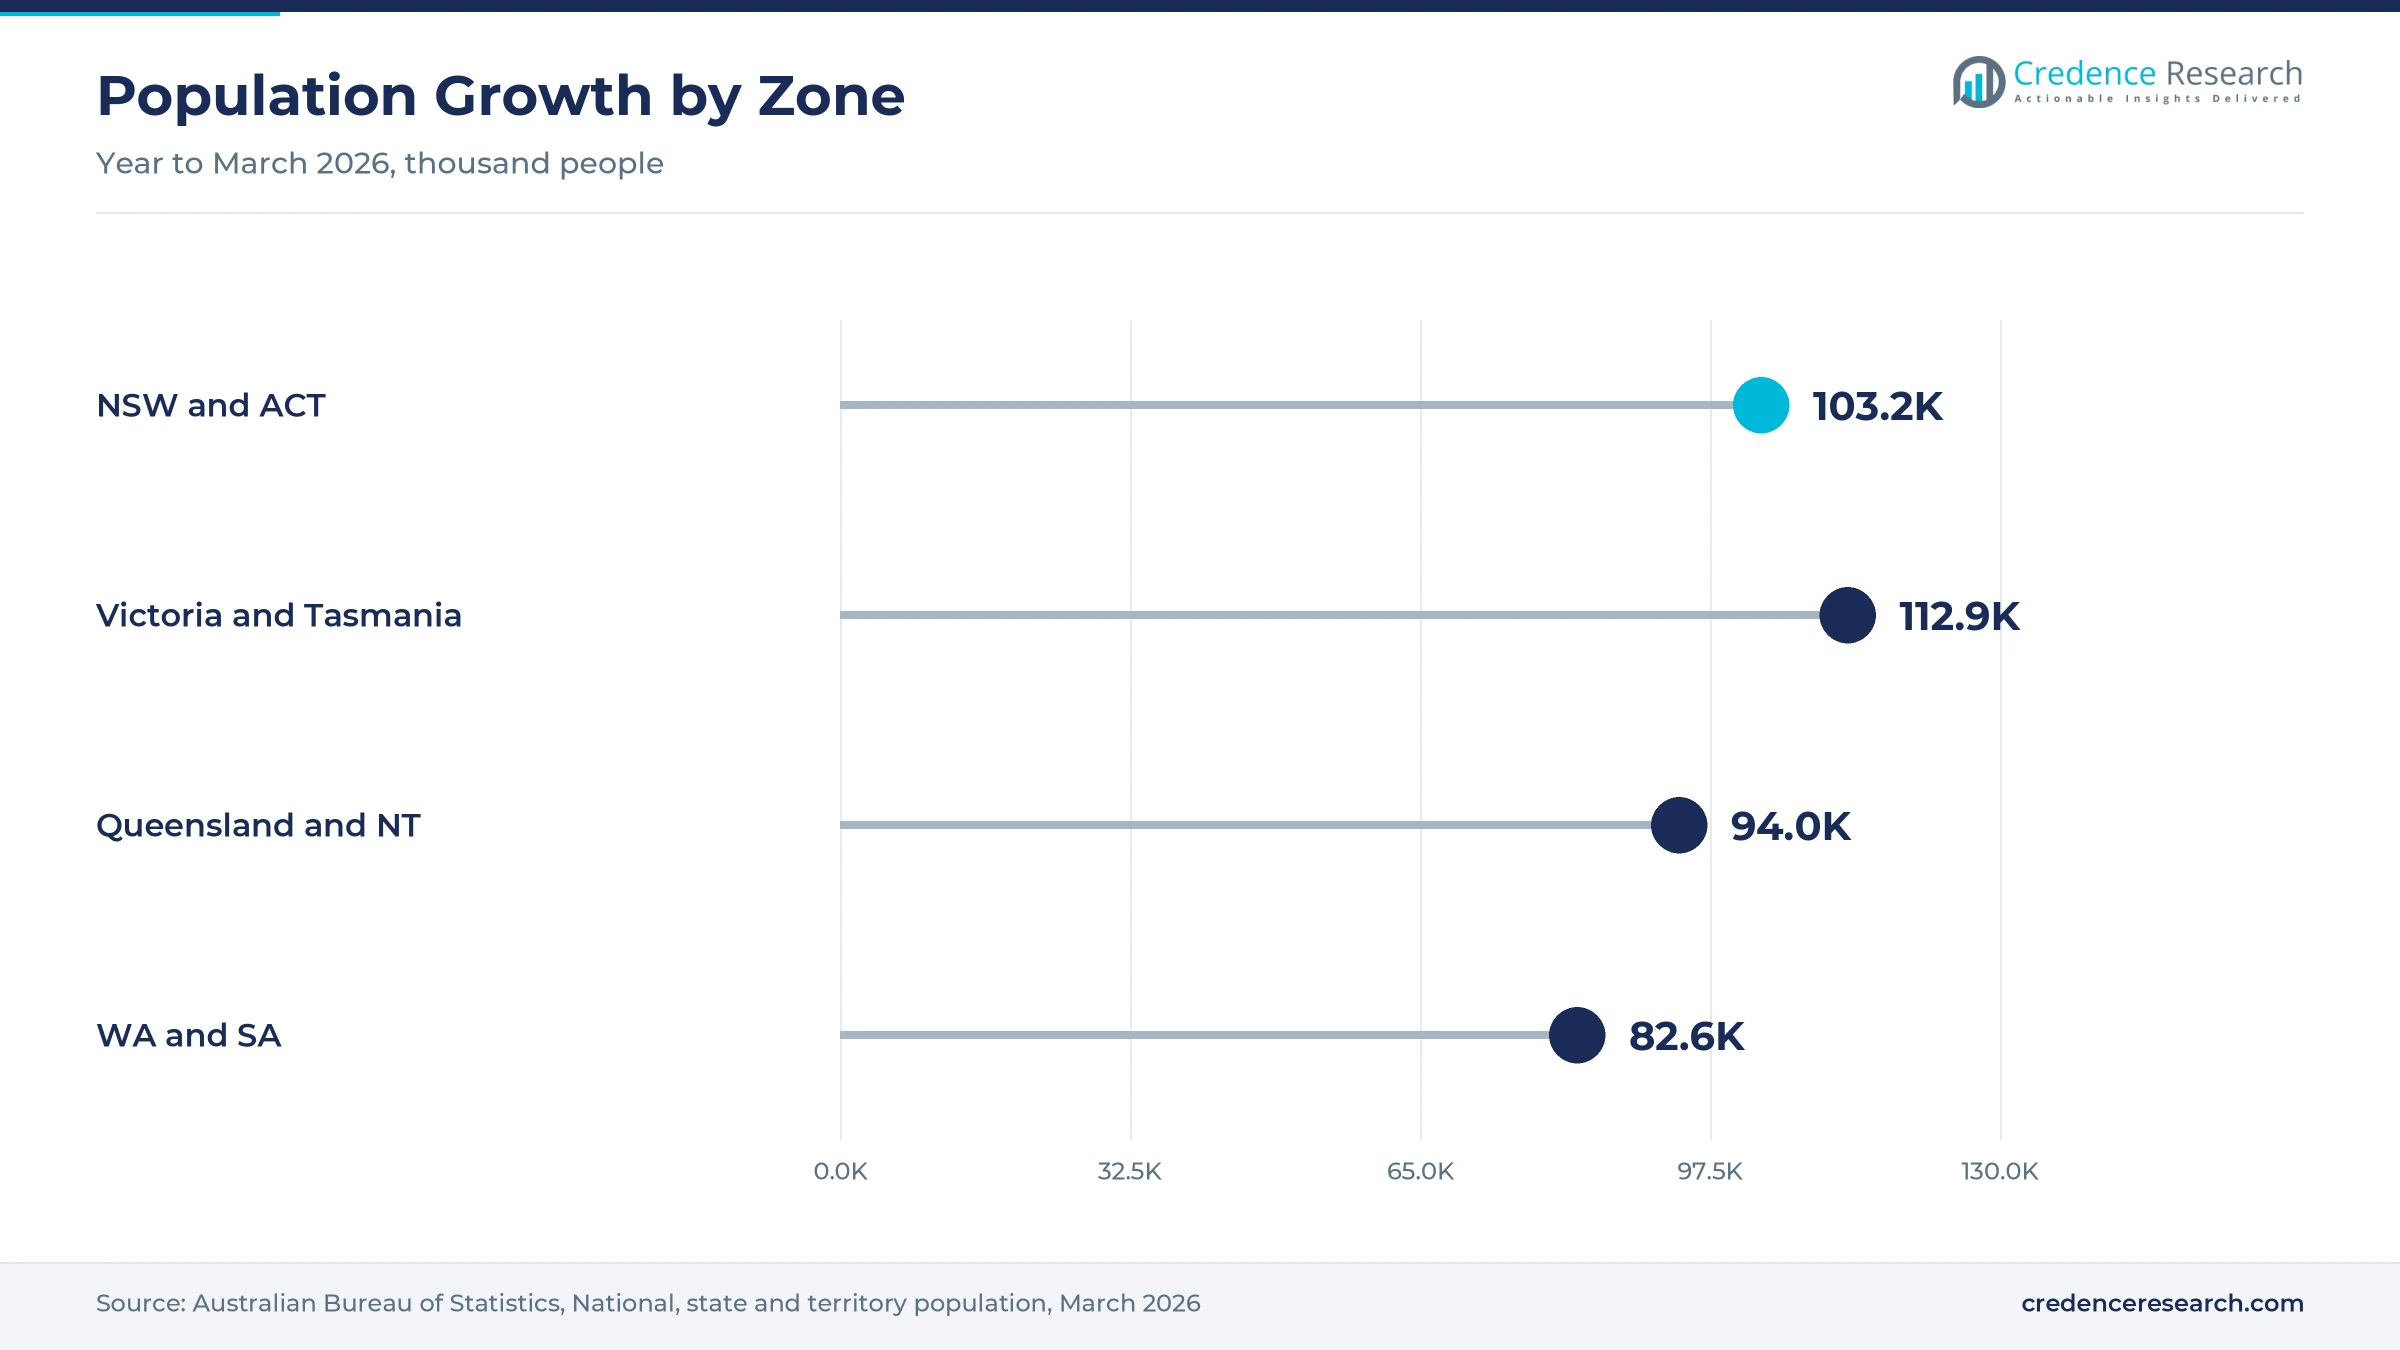
New South Wales and Australian Capital Territory held a 33.7% share of 2025 value and grow at 6.63% a year, because the zone has the largest population and the most surgical hospitals. Its population grew by about 103,000 people in the year to March 2026. Sydney also hosts major cardiac, transplant and trauma centers that use sealants and patches heavily. As a result, the zone leads both theater and endoscopy demand.
How do Victoria and Tasmania support demand?
Victoria and Tasmania held a 24.6% share of 2025 value and grow at 6.83% a year, because Melbourne has a dense network of public and private hospitals. The zone added about 113,000 people in the year to March 2026, the largest increase of any zone. In turn, private hospitals in Victoria handled 36% of state admissions in 2023-24, which keeps insured surgery volumes high.
Why are Queensland and the Northern Territory growing fastest?
Queensland and Northern Territory held a 20.2% share of 2025 value and grow fastest at 7.23% a year, because Queensland gains residents through both interstate and overseas migration. The zone added about 94,000 people in the year to March 2026. Private hospitals also handled 42% of Queensland admissions in 2023-24. As a result, new day surgeries and endoscopy centers in south-east Queensland lift demand.
What shapes demand in Western Australia and South Australia?
Western Australia and South Australia held a 21.5% share of 2025 value and grow at 6.73% a year, because Perth and Adelaide hold most of the zone's surgical capacity. Western Australia had the fastest population growth rate of any state in the year to March 2026. Private hospitals handled 44.2% of Western Australian admissions in 2023-24.
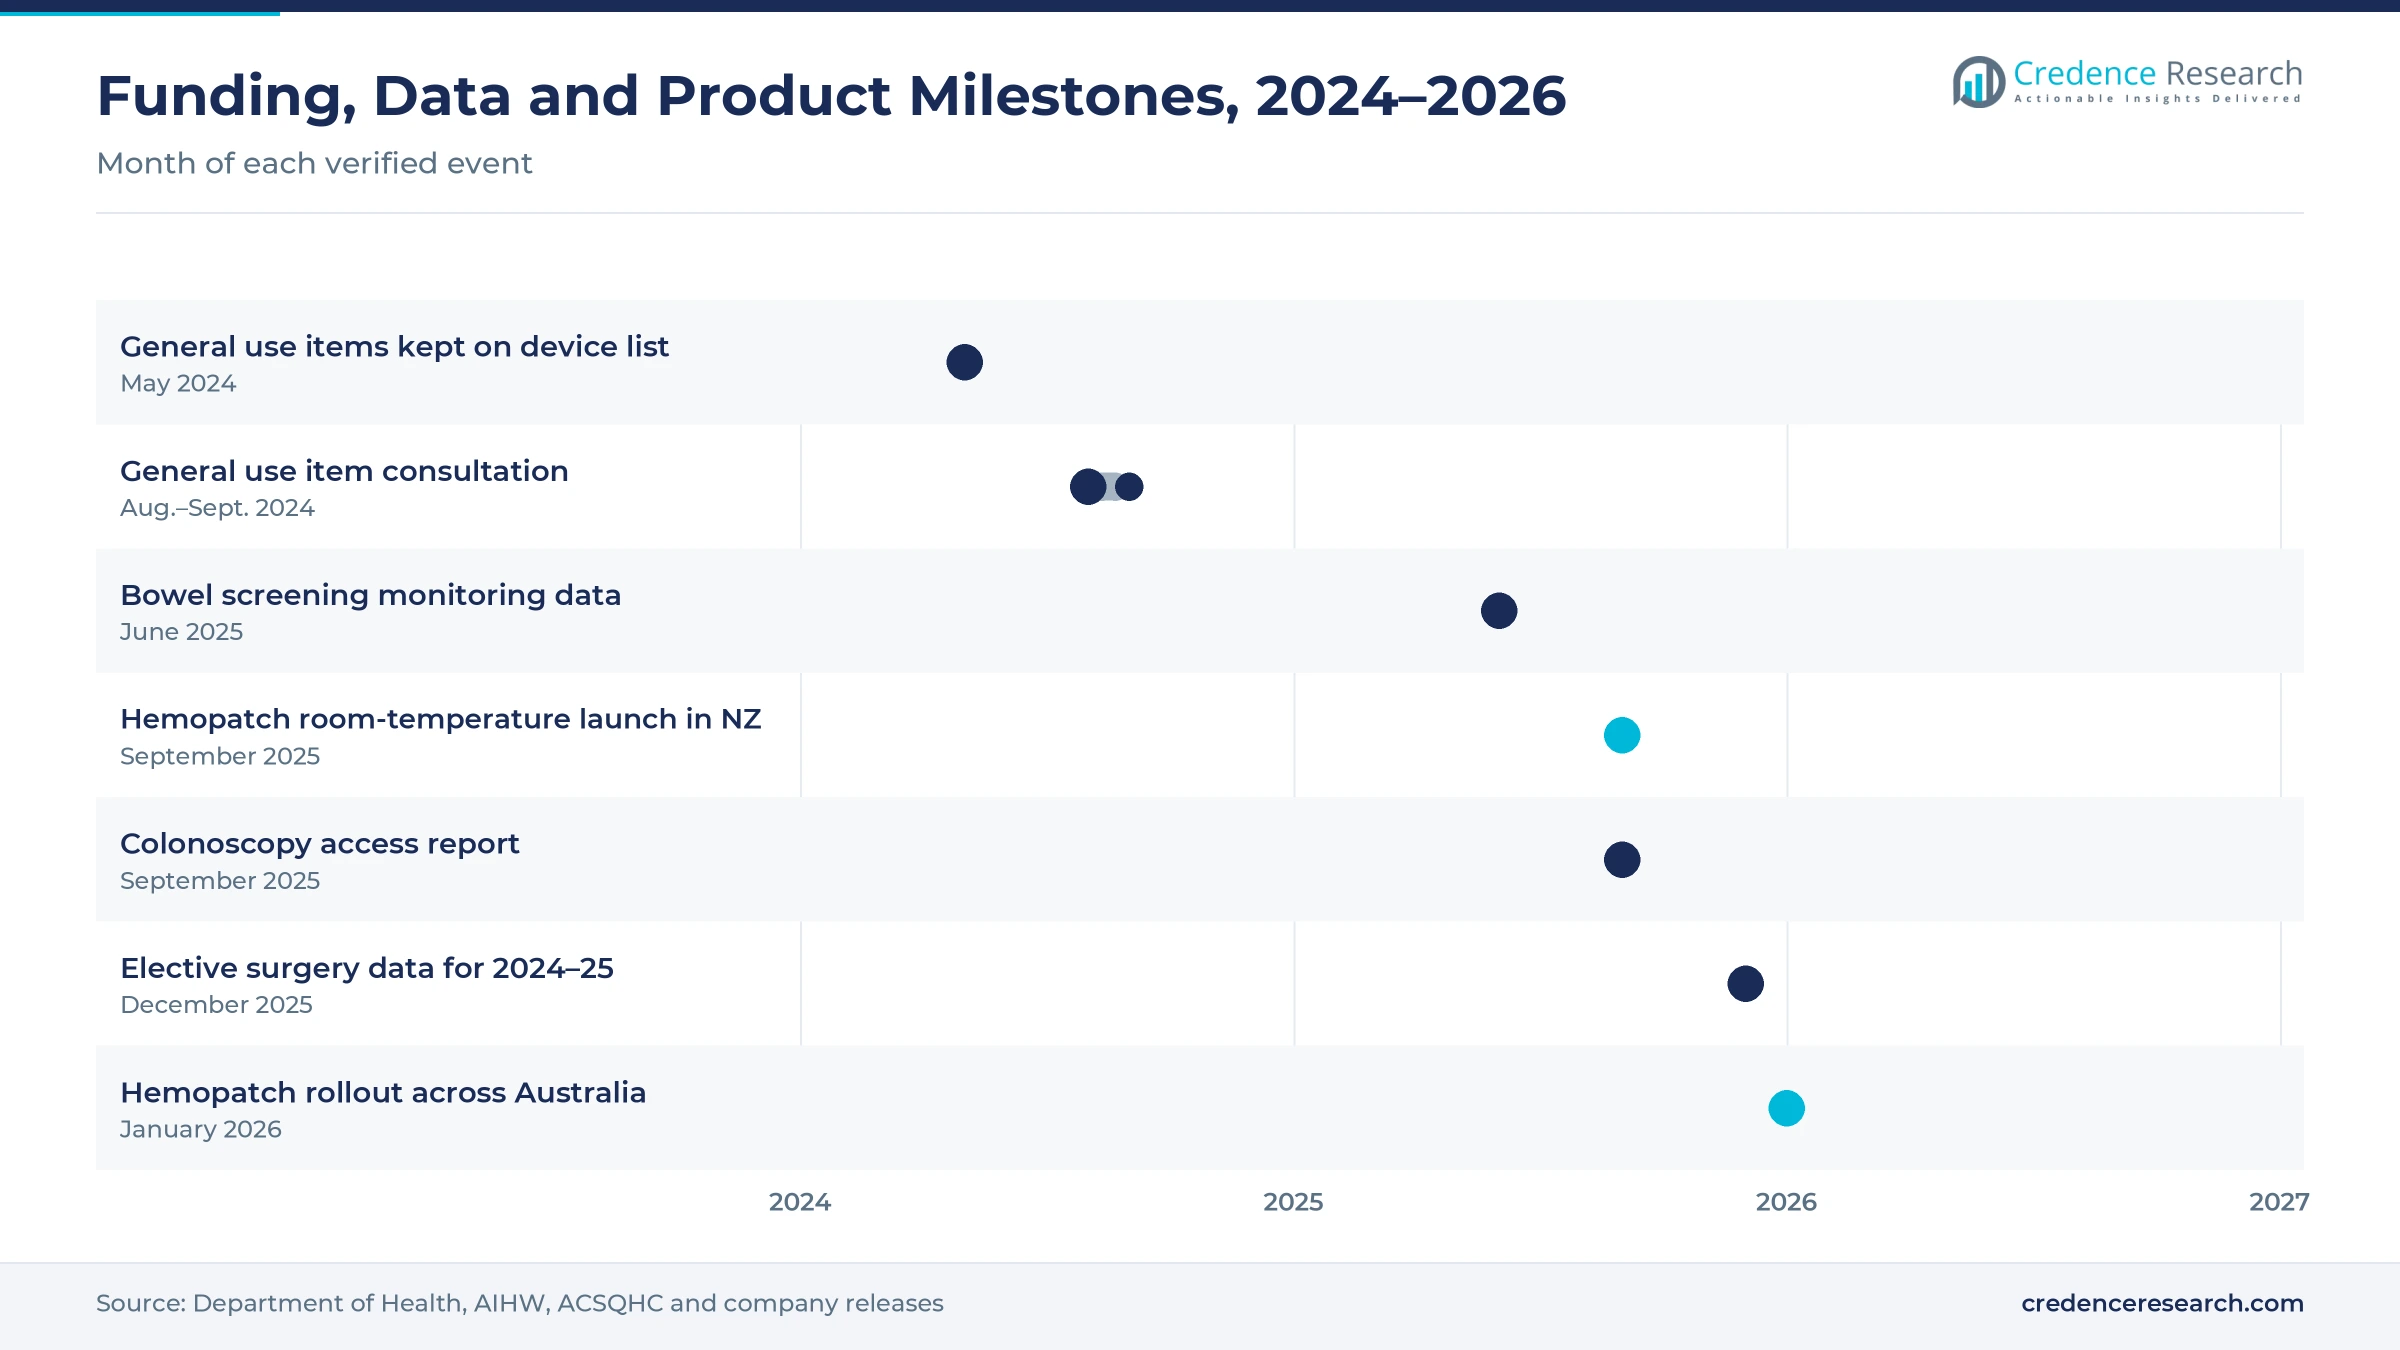
Funding, screening data and launches, 2024–2026
| Development | Status and market relevance |
|---|---|
| In May 2024, the federal government confirmed that 475 general use items would stay funded on the national device list. | Keeps private benefits for surgical consumables |
| In June 2025, national screening data showed 86,089 participants in 2023 needed further assessment after a positive bowel test. | Adds patients for diagnostic and therapeutic colonoscopy |
| In September 2025, Baxter launched room-temperature Hemopatch in New Zealand, with clinical sessions led by a Perth cardiothoracic surgeon. | Prepared the wider regional rollout |
| In December 2025, national hospital data showed 791,000 public elective surgery admissions in 2024–25. | Median wait of 45 days |
| In January 2026, Baxter reported that room-temperature Hemopatch had launched across Australia and New Zealand. | Shelf life of up to 36 months without refrigeration |
Powders, patches and endoscopic clips change care
- Plant-based and collagen agents absorb blood and form a matrix at the bleeding site, which suits oozing from wide surfaces in open and laparoscopic surgery. Room-temperature patches and powders with long shelf lives also simplify theater stock.
- Endoscopic clips and powders close or cover bleeding vessels in the gut during colonoscopy or gastroscopy, which helps patients avoid surgery. Mineral powders can treat larger bleeding areas that clips cannot reach easily.
- Mechanical and thermal instruments clamp, compress or seal vessels directly, which gives surgeons control over larger bleeds during cardiac, vascular and abdominal operations.
Need a Custom Version of This Report?
Tailor the scope, geography, or segments to your exact requirements.
- Custom geography or segment scope
- Direct access to our analyst team
Global device makers compete through direct hospital sales
Competition is led by global device makers that sell directly to hospitals through Australian subsidiaries. Baxter launched a room-temperature version of Hemopatch across Australia and New Zealand and lists the product on the national register. BD markets Arista AH plant-based powder to Australian and New Zealand surgeons, while Johnson & Johnson MedTech offers its oxidized regenerated cellulose Surgicel Powder to Australian clinicians. Olympus Australia sponsors a gastrointestinal endoscopic clip, while Cook Medical, which has its Australian headquarters in Brisbane, markets Hemospray powder for gut bleeds. Rivals compete on speed to bleeding control, ease of use, shelf life, clinical evidence and price. Because hospital committees decide which agents stay in theater stock, suppliers with strong clinical training teams win more contracts. Specialist distributors and wholesalers also help smaller brands reach day surgeries and regional hospitals that large sales teams visit less often.
Which companies supply Australian hospitals?
| Company | Type | Role in the market |
|---|---|---|
| Cook Medical | Global device maker | Australian headquarters in Brisbane; markets Hemospray for gut bleeds |
| Olympus Corporation | Global endoscopy maker | Olympus Australia sponsors a gastrointestinal endoscopic clip |
| Baxter | Global device maker | Launched room-temperature Hemopatch across Australia and New Zealand |
| BD | Global device maker | Markets Arista AH plant-based powder to local surgeons |
| Johnson & Johnson MedTech | Global device maker | Offers Surgicel Powder to Australian clinicians |
Credence Research view on surgical bleeding control demand
Credence Research's view is that Australian demand for bleeding control products will grow steadily because surgery and endoscopy volumes keep rising with an older population. Passive topical agents remain the largest value pool, while endoscopic devices add the fastest growth as screening and therapeutic colonoscopy expand. Settled funding rules for surgical consumables should support new launches in private hospitals. Suppliers that combine strong clinical evidence, easy storage and training should gain share fastest, while benefit cuts will keep prices under pressure.
How the national bleeding control estimate was built
The report uses 2025 as the base year on a calendar basis, and market values come from the Credence Research model. That model combines hospital activity statistics, private health insurance data, population statistics, national device funding publications, screening program reports and company product announcements. Segment splits and zone growth rates are Credence Research estimates, while zone shares follow the client-defined split. Sources used are official statistics, government releases, industry association data and company releases, and no interviews or surveys were used.
Endoscopy and day surgery carry growth to 2035
Product value is expected to reach USD 128.6 million by 2035, a 6.82% CAGR during 2026–2035, as hospitals perform more surgery and endoscopy for an older population. Growth should be strongest through 2030 while day surgeries and endoscopy centers open. After that, replacement of older agents with faster patches and powders will carry more value. Stronger public surgery funding would lift volumes, while deeper benefit cuts would slow price growth. Suppliers with strong evidence and training are expected to gain the most.
Frequently Asked Questions
How big is the Australia hemostatic instruments market?
Which product type leads Australian value?
Which region leads the Australian market?
How many elective surgeries do Australian public hospitals perform?
How many colonoscopies are performed in Australia?
Which disease area is growing fastest?
Who are the leading companies in the Australian market?
What are the main challenges for suppliers?
Table of Content
Chapter 1 Market Segmentation
- 1.1 Segmentation Framework
- 1.1.1 Product and Service Classification
- 1.1.2 Application and End-Use Classification
- 1.1.3 Technology and Solution Classification
- 1.1.4 Customer and Distribution Channel Classification
- 1.1.5 Geographic Segmentation
- 1.1.6 Market Segment Definitions and Boundaries
- 1.2 By Product Type
- 1.2.1 Passive Topical Hemostats
- 1.2.2 Active Hemostats and Fibrin Sealants
- 1.2.3 Endoscopic Hemostasis Devices
- 1.2.4 Mechanical Hemostatic Instruments
- 1.3 By Disease Area
- 1.3.1 Gastrointestinal Bleeding
- 1.3.2 Cardiovascular Conditions
- 1.3.3 Musculoskeletal Conditions
- 1.3.4 Abdominal and Soft-Tissue Conditions
- 1.4 By End User
- 1.4.1 Public Hospital Networks
- 1.4.2 Private Hospital Groups
- 1.4.3 Independent Procedural Providers
- 1.5 By Sales Channel
- 1.5.1 Manufacturer Direct Sales
- 1.5.2 Specialist Distributor Sales
- 1.5.3 Medical Wholesaler Sales
Chapter 2 Introduction
- 2.1 Report Objectives and Scope
- 2.2 Product Definition and Industry Terminology
- 2.3 Market Inclusions and Exclusions
- 2.4 Research Process
- 2.4.1 Primary Research and Expert Interviews
- 2.4.2 Secondary Research and Source Review
- 2.4.3 Top-Down and Bottom-Up Estimation
- 2.4.4 Data Triangulation and Verification
- 2.5 Market Size Measurement Basis
- 2.5.1 2025: USD 60.5 million → 2035: USD 128.6 million
- 2.6 Historical and Forecast Reference Periods
- 2.6.1 Historical Period: 2018-2025
- 2.6.2 Base Year: 2025
- 2.6.3 Forecast Period: 2025-2035
- 2.7 Research Assumptions and Limitations
Chapter 3 Executive Summary
- 3.1 Market Snapshot and Key Findings
- 3.2 Base-Year Market Size, 2025
- 3.3 Forecast Market Size, 2035
- 3.4 Revenue and Volume Growth Outlook
- 3.5 Key Demand and Supply Indicators
- 3.6 Leading Market Segments
- 3.7 Fastest-Growing Market Opportunities
- 3.8 Regional Performance Highlights
- 3.9 Technology and Industry Transformation
- 3.10 Competitive Landscape Summary
- 3.11 Analyst View and Strategic Implications
Chapter 4 Australia Hemostatic Instruments Market Trends and Developments
- 4.1 Historical Industry Development, 2018-2025
- 4.2 Recent Market Trends and Developments
- 4.3 Demand and Customer Behavior Trends
- 4.4 Technology and Product Innovation
- 4.5 Artificial Intelligence, Automation and Digitalization
- 4.6 Local Manufacturing and Supply Chain Realignment
- 4.7 Industry Partnerships, Mergers and Acquisitions
- 4.8 Sustainability and Circular Economy Developments
- 4.9 Government and Private Sector Investment Trends
- 4.10 Emerging Business Models and Commercialization
- 4.11 Industry Developments and Announcements
Chapter 5 Australia Hemostatic Instruments Market Production, Supply and Demand Analysis
- 5.1 Demand Trend and Consumption Analysis, 2018-2025
- 5.2 Demand Forecast, 2025-2035
- 5.3 Production and Output Trend, 2018-2025
- 5.4 Production and Output Forecast, 2025-2035
- 5.5 Installed Capacity and Capacity Utilization
- 5.6 Company-Wise Production Plants and Statistics
- 5.6.1 Installed Production Capacity
- 5.6.2 Actual Production
- 5.6.3 Planned Capacity and Expansion Targets
- 5.7 Supply Chain Structure and Procurement Trends
- 5.8 Supply-Demand Gap and Bottlenecks
- 5.9 Import Dependence and Sourcing Structure
- 5.10 Contract Manufacturing and Outsourcing
- 5.11 Regional Supply and Demand Concentration
Chapter 6 Australia Hemostatic Instruments Market Pricing Analysis
- 6.1 Pricing Structure and Measurement
- 6.2 Historical Pricing Trends, 2018-2025
- 6.3 Pricing Outlook, 2025-2035
- 6.4 Average Selling Price and Unit Economics
- 6.5 Pricing by Product and Market Segment
- 6.6 Geographic Pricing Differences
- 6.7 Key Input, Energy, Labor and Logistics Costs
- 6.8 Contract Pricing and Purchasing Models
- 6.9 Pricing Sensitivity and Competitive Positioning
- 6.10 Price, Margin and Profitability Implications
Chapter 7 Australia Hemostatic Instruments Market Dynamics
- 7.1 Market Growth Drivers
- 7.1.1 Demand-Side Drivers
- 7.1.2 Technology and Innovation Drivers
- 7.1.3 Infrastructure and Investment Drivers
- 7.1.4 Regulatory and Policy Drivers
- 7.2 Market Restraints
- 7.2.1 Cost and Affordability Constraints
- 7.2.2 Technology and Adoption Barriers
- 7.2.3 Supply Chain and Operational Constraints
- 7.3 Market Challenges
- 7.3.1 Competitive Pressure and Margin Erosion
- 7.3.2 Skills, Infrastructure and Implementation Gaps
- 7.4 Emerging Market Opportunities
- 7.5 Market Dynamics Impact and Time-Horizon Assessment
Chapter 8 Australia Hemostatic Instruments Value Chain Analysis
- 8.1 Industry Value Chain Overview
- 8.2 Upstream Suppliers and Critical Inputs
- 8.3 Technology and Component Providers
- 8.4 Manufacturing or Service Delivery
- 8.5 Distribution, Channel Partners and Integrators
- 8.6 Downstream Applications and End Users
- 8.7 Value Addition and Profit Pools
- 8.8 Vertical Integration and Outsourcing
- 8.9 Supplier Concentration and Risk
- 8.10 Supply Chain Localization and Resilience
Chapter 9 Australia Hemostatic Instruments Market Regulations and Policies
- 9.1 Relevant Laws, Standards and Compliance Frameworks
- 9.2 Product, Service, Safety and Quality Requirements
- 9.3 Government Policies, Incentives and Subsidies
- 9.4 Imports, Exports and Trade Barriers
- 9.5 Public Procurement and Local Content Requirements
- 9.6 Environmental and Sustainability Compliance
- 9.7 Upcoming Policy Changes and Market Implications
Chapter 10 Australia Hemostatic Instruments Market Hotspots and Opportunities
- 10.1 Market Opportunity Mapping and Growth Hotspots
- 10.2 High-Growth Applications and Customer Groups
- 10.3 Underserved Markets and White-Space Opportunities
- 10.4 Emerging Technology and Product Opportunities
- 10.5 New Capacity and Investment Hotspots
- 10.6 Market Entry and Expansion Opportunities
- 10.7 Distribution and Partnership Opportunities
- 10.8 Near-Term and Long-Term Commercial Potential
- 10.9 Opportunity Attractiveness and Execution Risks
Chapter 11 Australia Hemostatic Instruments Market Outlook, 2025-2035
- 11.1 Market Size and Analysis
- 11.1.1 Revenue (Market Measurement: 2025: USD 60.5 million → 2035: USD 128.6 million)
- 11.1.2 Market Volume and Quantity Sold
- 11.1.3 Historical Market Size, 2018-2025
- 11.1.4 Base-Year Market Size, 2025
- 11.2 Market Forecast, 2025-2035
- 11.2.1 Revenue Forecast to 2035
- 11.2.2 Volume Forecast to 2035
- 11.2.3 CAGR and Year-on-Year Growth
- 11.2.4 Incremental Revenue Opportunity
- 11.3 Forecast Assumptions and Scenario Analysis
- 11.3.1 Base-Case Forecast
- 11.3.2 Optimistic and Conservative Scenarios
- 11.3.3 Technology, Pricing and Policy Sensitivities
- 11.4 Market Attractiveness and Growth Outlook
Chapter 12 Australia Hemostatic Instruments Market Segmentation and Outlook
- 12.1 Segmentation Summary and Market Shares, 2025
- 12.2 Largest and Fastest-Growing Segments
- 12.3 By Product Type - Market Size and Forecast, 2025-2035
- 12.3.1 Segment Definition and Scope
- 12.3.2 Historical Market Size, 2018-2025
- 12.3.3 Revenue Forecast, 2025-2035
- 12.3.4 Volume Forecast, 2025-2035
- 12.3.5 Base-Year Market Share, 2025
- 12.3.6 Segment CAGR and Growth Drivers
- 12.3.7 Subsegment Market Size and Forecast
- 12.3.7.1 Passive Topical Hemostats
- 12.3.7.2 Active Hemostats and Fibrin Sealants
- 12.3.7.3 Endoscopic Hemostasis Devices
- 12.3.7.4 Mechanical Hemostatic Instruments
- 12.3.8 Subsegment Pricing and Adoption Trends
- 12.3.9 Leading Suppliers and Competition
- 12.3.10 Regional Demand and Opportunities
- 12.4 By Disease Area - Market Size and Forecast, 2025-2035
- 12.4.1 Segment Definition and Scope
- 12.4.2 Historical Market Size, 2018-2025
- 12.4.3 Revenue Forecast, 2025-2035
- 12.4.4 Volume Forecast, 2025-2035
- 12.4.5 Base-Year Market Share, 2025
- 12.4.6 Segment CAGR and Growth Drivers
- 12.4.7 Subsegment Market Size and Forecast
- 12.4.7.1 Gastrointestinal Bleeding
- 12.4.7.2 Cardiovascular Conditions
- 12.4.7.3 Musculoskeletal Conditions
- 12.4.7.4 Abdominal and Soft-Tissue Conditions
- 12.4.8 Subsegment Pricing and Adoption Trends
- 12.4.9 Leading Suppliers and Competition
- 12.4.10 Regional Demand and Opportunities
- 12.5 By End User - Market Size and Forecast, 2025-2035
- 12.5.1 Segment Definition and Scope
- 12.5.2 Historical Market Size, 2018-2025
- 12.5.3 Revenue Forecast, 2025-2035
- 12.5.4 Volume Forecast, 2025-2035
- 12.5.5 Base-Year Market Share, 2025
- 12.5.6 Segment CAGR and Growth Drivers
- 12.5.7 Subsegment Market Size and Forecast
- 12.5.7.1 Public Hospital Networks
- 12.5.7.2 Private Hospital Groups
- 12.5.7.3 Independent Procedural Providers
- 12.5.8 Subsegment Pricing and Adoption Trends
- 12.5.9 Leading Suppliers and Competition
- 12.5.10 Regional Demand and Opportunities
- 12.6 By Sales Channel - Market Size and Forecast, 2025-2035
- 12.6.1 Segment Definition and Scope
- 12.6.2 Historical Market Size, 2018-2025
- 12.6.3 Revenue Forecast, 2025-2035
- 12.6.4 Volume Forecast, 2025-2035
- 12.6.5 Base-Year Market Share, 2025
- 12.6.6 Segment CAGR and Growth Drivers
- 12.6.7 Subsegment Market Size and Forecast
- 12.6.7.1 Manufacturer Direct Sales
- 12.6.7.2 Specialist Distributor Sales
- 12.6.7.3 Medical Wholesaler Sales
- 12.6.8 Subsegment Pricing and Adoption Trends
- 12.6.9 Leading Suppliers and Competition
- 12.6.10 Regional Demand and Opportunities
- 12.7 Segment Growth Comparison
- 12.8 Segment Attractiveness and Priority Matrix
Chapter 13 Australia Hemostatic Instruments End-Use and Application Market Outlook
- 13.1 End-Use Industry and Customer Demand Structure
- 13.2 Leading Applications and Customer Groups
- 13.3 End-Use Market Size, Share and Forecast
- 13.4 Major End-Use Industry Deep Dives
- 13.4.1 Customer Requirements and Use Cases
- 13.4.2 Demand and Replacement Cycles
- 13.4.3 Technical and Regulatory Considerations
- 13.4.4 Purchasing and Procurement Models
- 13.4.5 Leading Vendors and Distribution Channels
- 13.4.6 Forecast and Commercial Opportunities
- 13.5 Emerging Applications and Cross-Segment Demand
- 13.6 End-Use Industry Investment Priorities
Chapter 14 Australia Hemostatic Instruments Geographic Market Outlook, 2025-2035
- 14.1 Domestic Market Distribution and Demand Clusters
- 14.2 State- or Province-Wise Market Size and Forecast, 2025-2035
- 14.3 City and Metropolitan Market Outlook
- 14.4 Industrial, Manufacturing and Commercial Clusters
- 14.5 Geographic Concentration of Key End Users
- 14.6 Local Pricing and Purchasing Differences
- 14.7 Domestic Production Facilities and Capacity Map
- 14.8 Local Infrastructure and Project Pipeline
- 14.9 State-Level Policy and Incentive Differences
- 14.10 Subnational Investment Hotspots and Opportunities
- 14.11 Distribution and Logistics Networks
- 14.12 Domestic Competitive Footprint
Chapter 15 Australia Hemostatic Instruments Technology, Innovation and Sustainability Outlook
- 15.1 Technology Landscape and Maturity
- 15.2 Product, Process and Service Innovation
- 15.3 AI, Automation and Digital Tools in the Industry
- 15.4 Technology Adoption and Performance Benchmarking
- 15.5 Innovation Pipeline and R&D Investment
- 15.6 Patent and Intellectual Property Trends
- 15.7 Energy Efficiency and Resource Management
- 15.8 Sustainability, Recycling and Circularity
- 15.9 Technology Roadmap, 2025-2035
- 15.10 Risks of Obsolescence and Technology Substitution
Chapter 16 Australia Hemostatic Instruments Market Key Strategic Imperatives
- 16.1 Growth and Market Entry Priorities
- 16.2 High-Return Products and Segments
- 16.3 Pricing, Profitability and Cost Optimization
- 16.4 Technology Investment and Product Differentiation
- 16.5 Supply Chain Localization and Resilience
- 16.6 Distribution and Customer Acquisition
- 16.7 Partnership, Acquisition and Capacity Strategy
- 16.8 Regional Expansion Priorities
- 16.9 Short-, Medium- and Long-Term Actions
Chapter 17 Competition Outlook
- 17.1 Industry Competition Characteristics
- 17.2 Market Structure and Concentration
- 17.3 Market Share and Competitive Positioning, 2025
- 17.4 Company-Wise Revenue and Product Benchmarking
- 17.5 Production and Service Capacity Benchmarking
- 17.6 Technology, Pricing and Differentiation
- 17.7 Regional Footprint and Distribution Strength
- 17.8 Mergers, Acquisitions and Strategic Alliances
- 17.9 New Entrants and Competitive Threats
- 17.10 Porter's Five Forces and Industry Attractiveness
- 17.11 Competitive Outlook, 2025-2035
Chapter 18 Company Profiles
- 18.1 Company Coverage and Selection Criteria
- 18.2 Cook Medical
- 18.2.1 Business Description
- 18.2.2 Company Ownership and Geographic Presence
- 18.2.3 Product and Service Portfolio
- 18.2.4 Manufacturing and Operating Footprint
- 18.2.5 Production Capacity and Expansion Plans
- 18.2.6 Financial Performance and Investment
- 18.2.7 Market Share and Competitive Position
- 18.2.8 Technology and Innovation Capabilities
- 18.2.9 Strategic Alliances or Partnerships
- 18.2.10 Recent Developments
- 18.2.11 Growth Strategy and Outlook
- 18.3 Olympus Corporation
- 18.4 Baxter
- 18.5 BD
- 18.6 Johnson & Johnson MedTech
- 18.7 Other Relevant Market Participants
Note: Every listed company is profiled on the structure shown under the first company. The company list is preliminary and may change based on research findings, market developments, data availability and client requirements.
Chapter 19 Disclaimer
- 19.1 Research and Forecast Disclaimer
- 19.2 Data Source and Estimation Limitations
Note: The depth of individual sections depends on data availability for this market. Volume, capacity, trade and other unit-based metrics are included where applicable.

