
Working mothers and lactation care shape expression demand
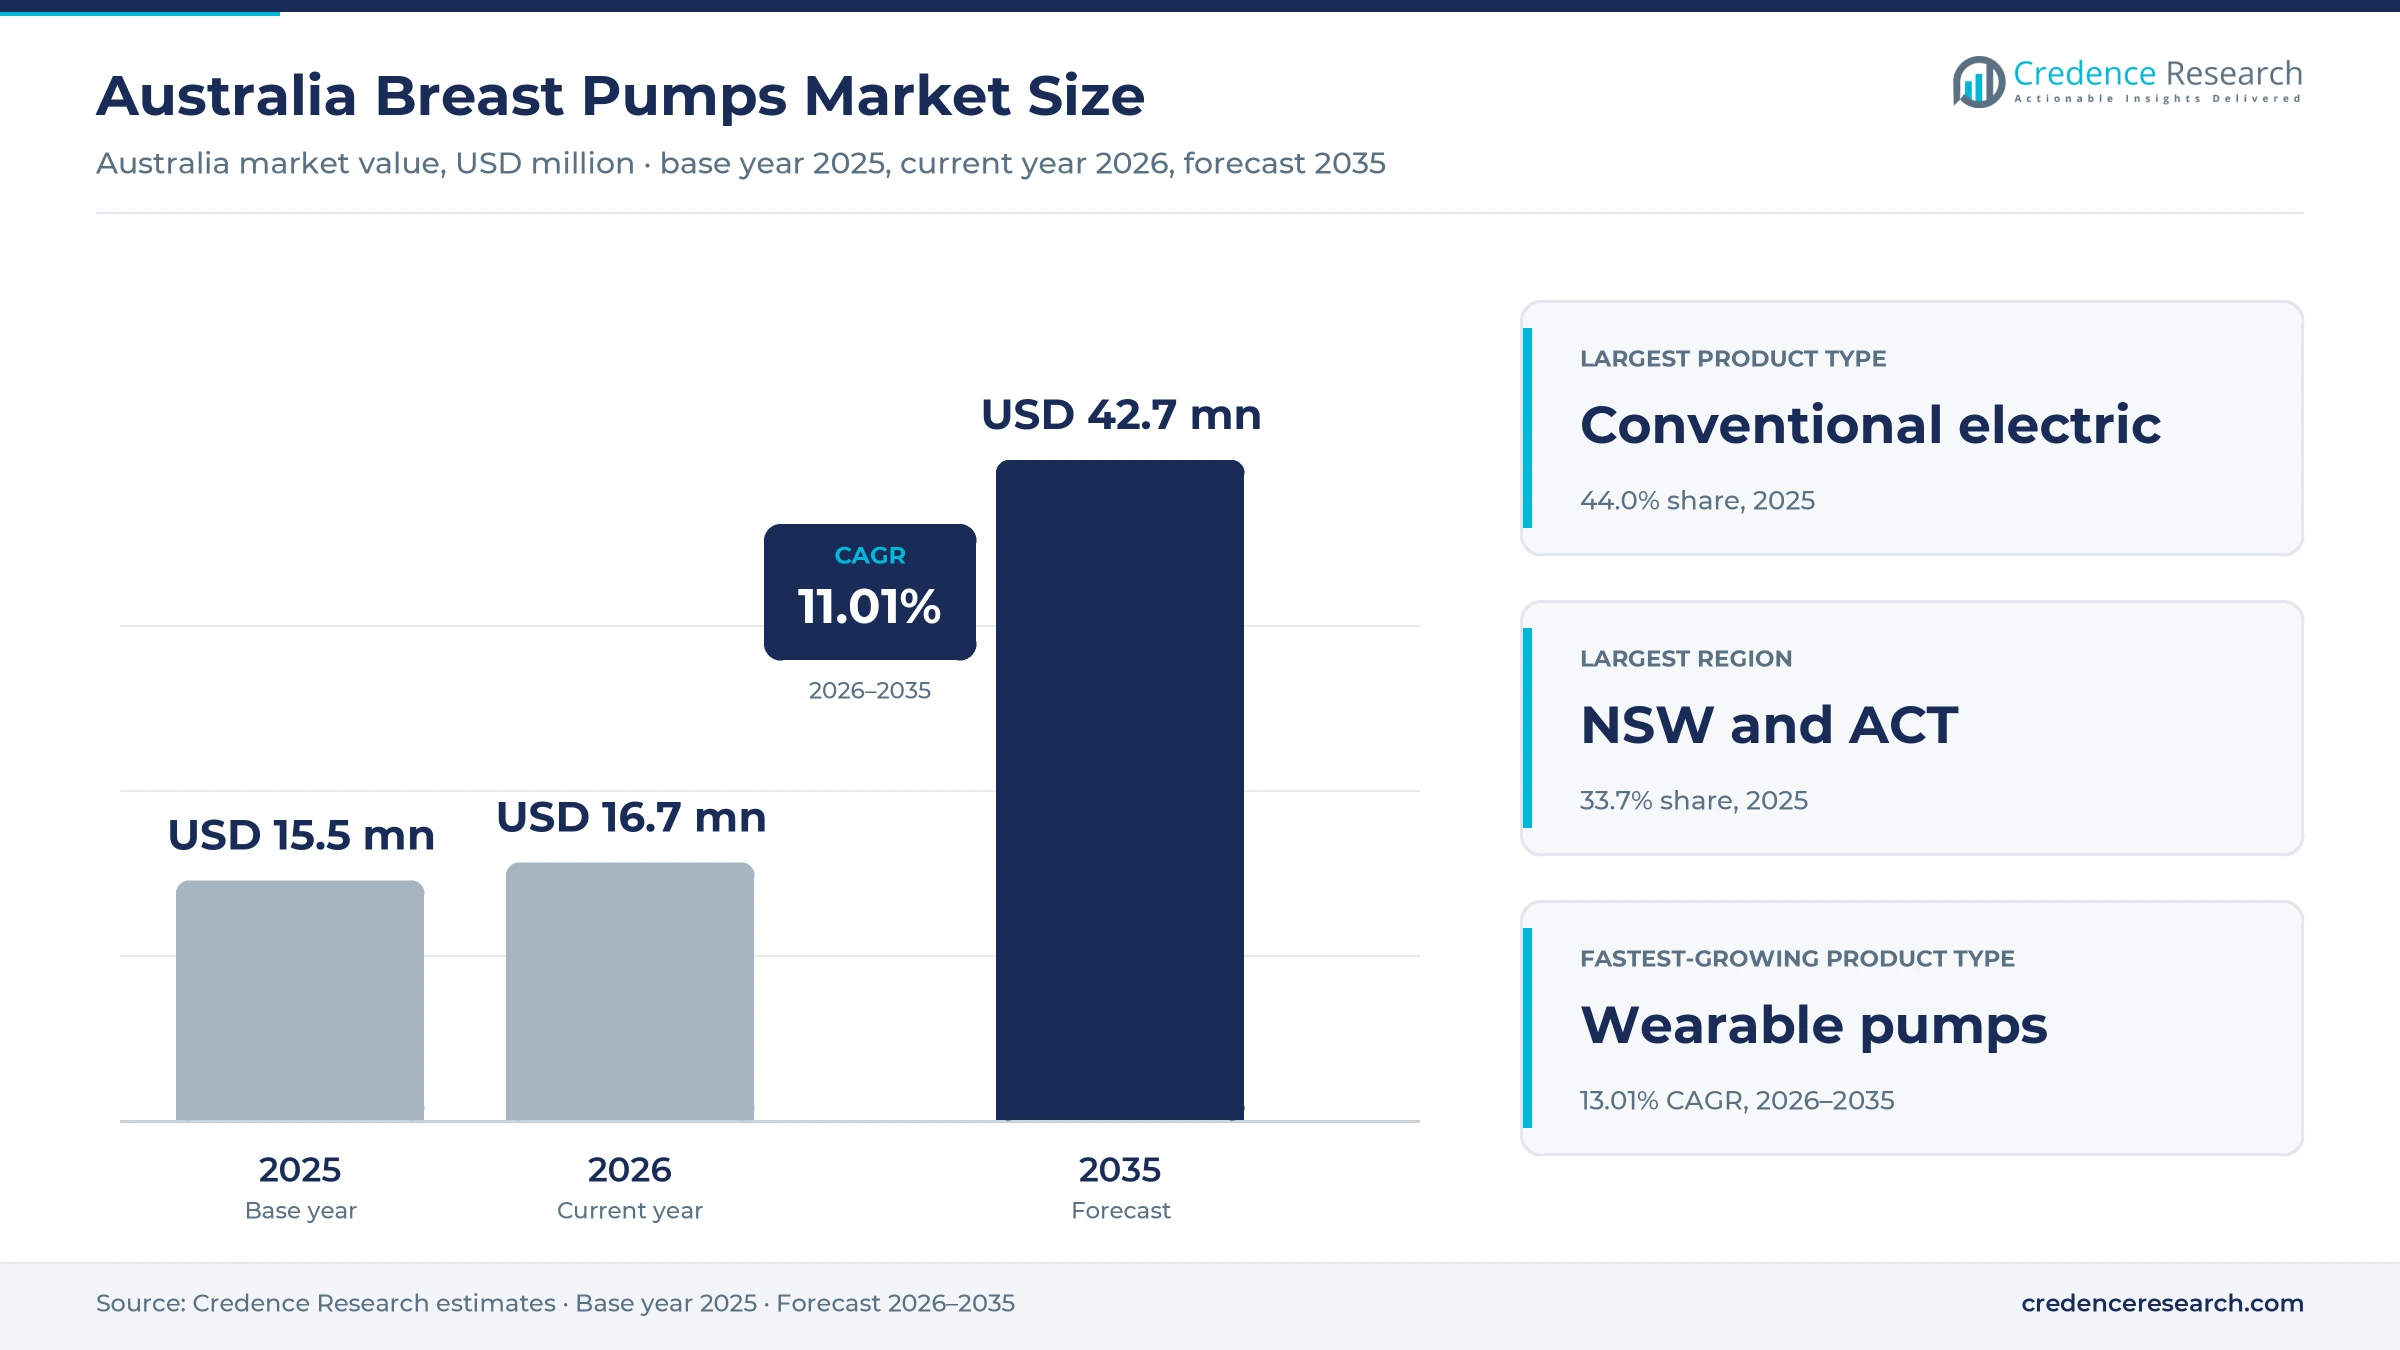
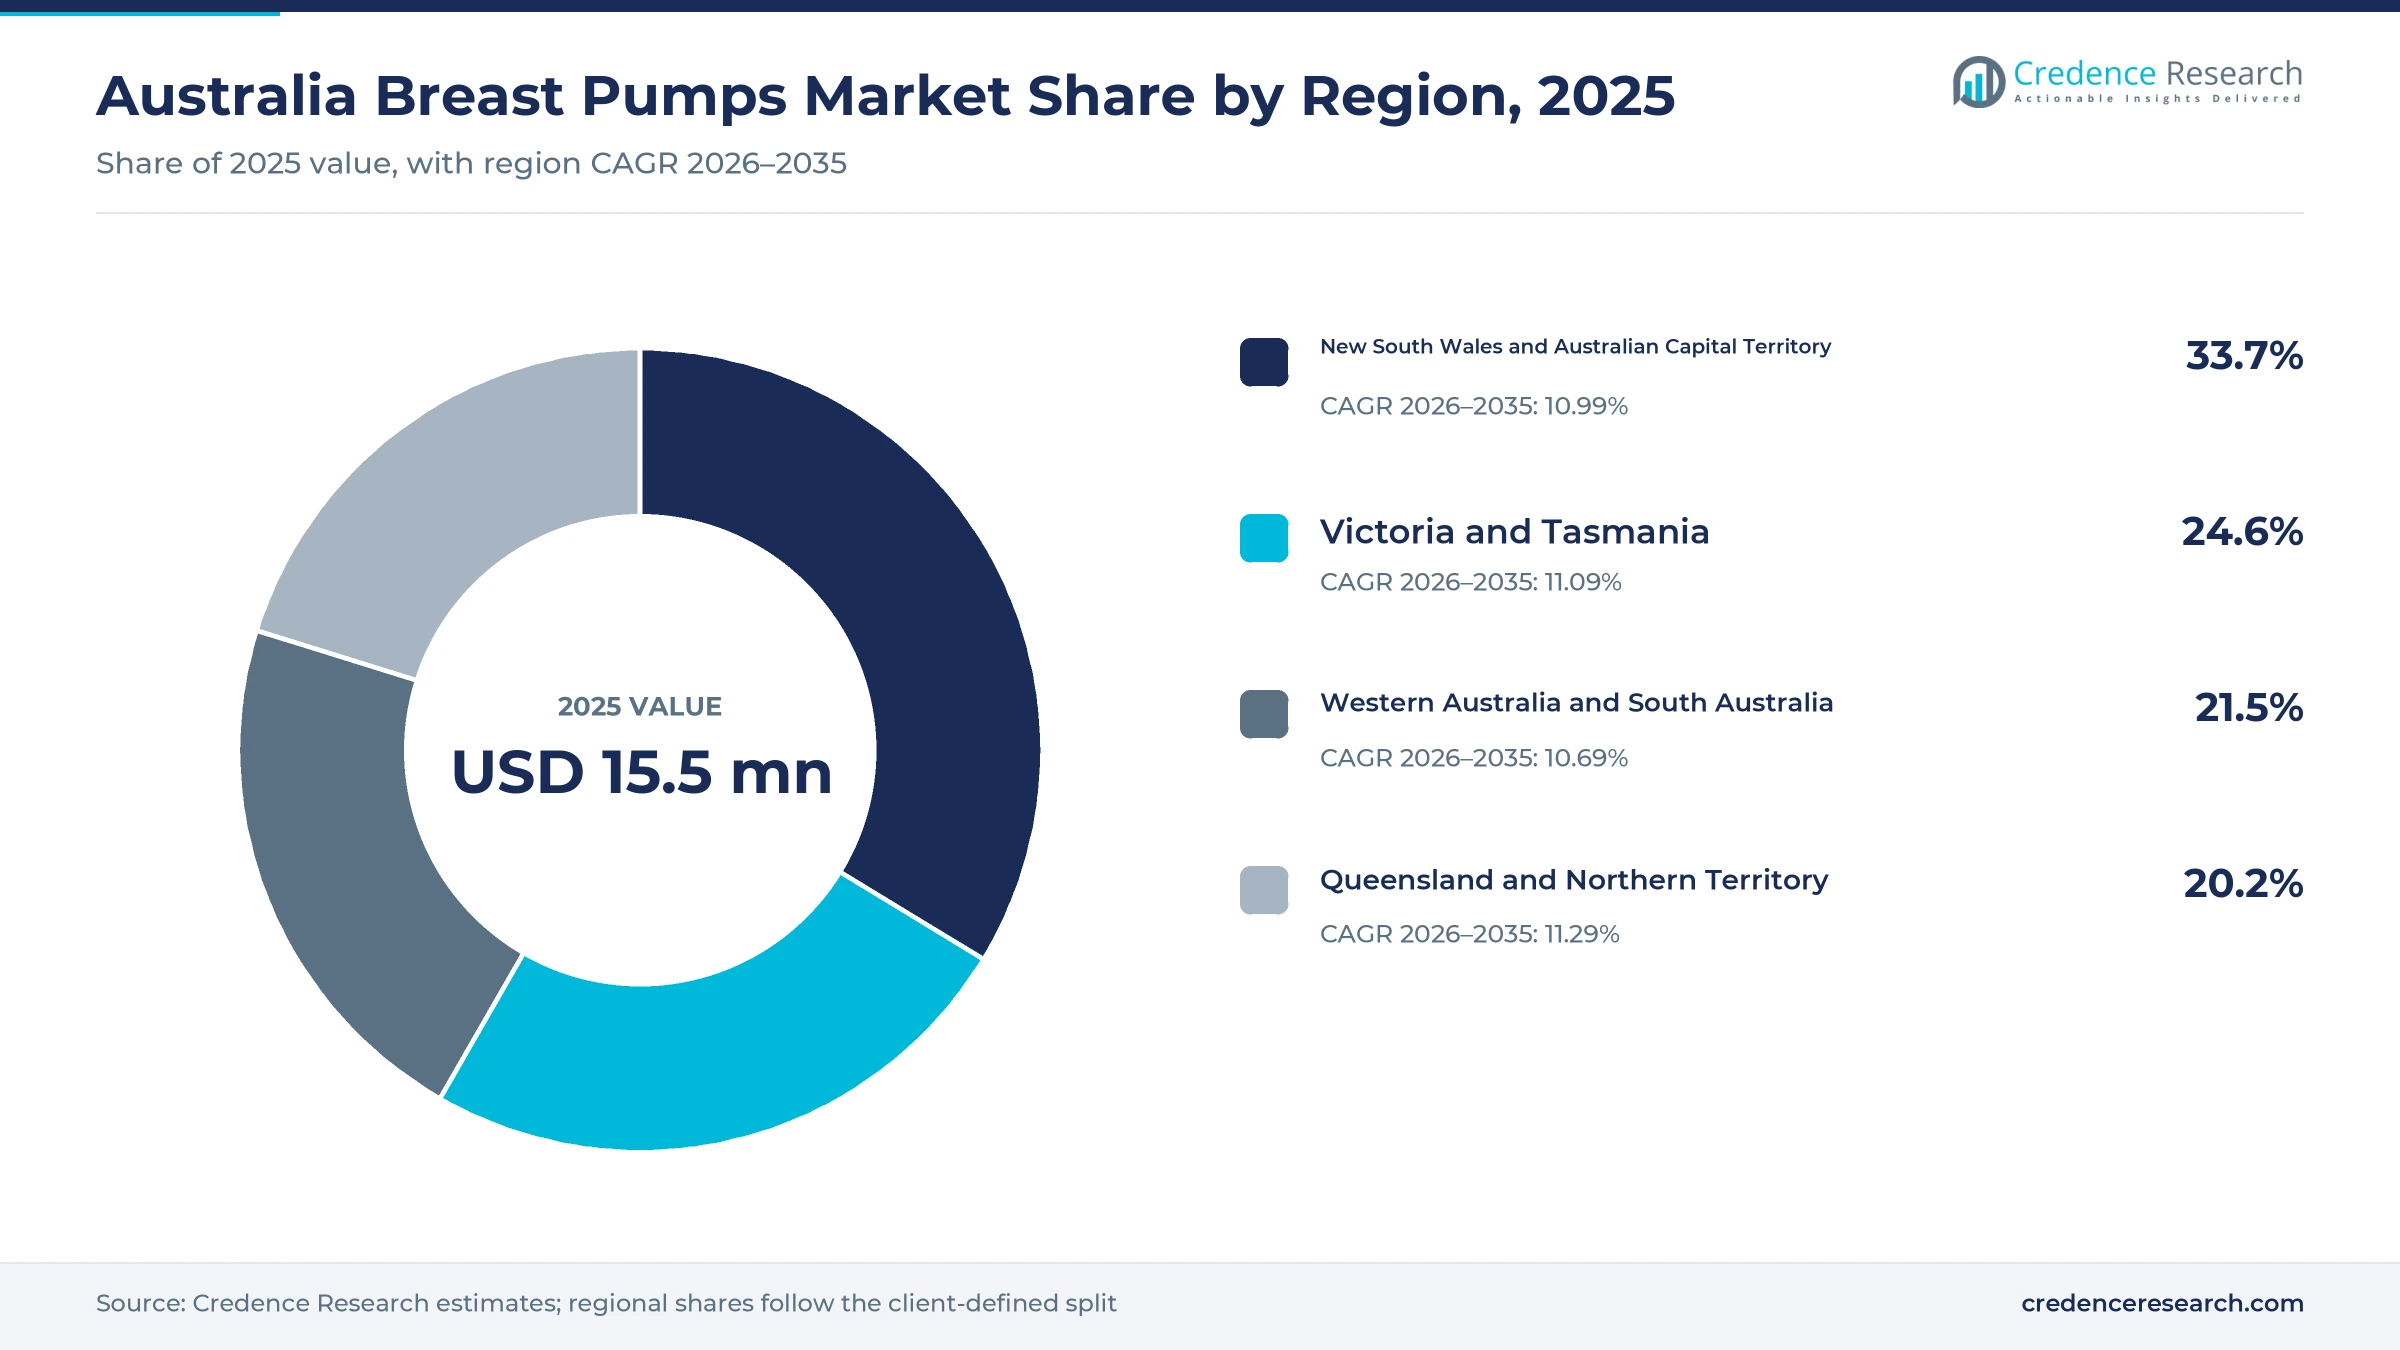
The Australia breast pumps market was valued at USD 15.5 million in 2025 and is projected to increase from USD 16.7 million in 2026 to USD 42.7 million by 2035, registering a CAGR of 11.01% during 2026–2035. Demand comes from mothers who express milk at home and at work, from hospitals and lactation services that support preterm and unwell babies, and from rental fleets that lend hospital-grade units. New South Wales and the Australian Capital Territory held the largest regional share, 33.7% in 2025, because the zone records the most births. Queensland and the Northern Territory form the fastest-growing zone at 11.29% a year. In turn, the national paid parental leave scheme reached 26 weeks on July 1, 2026, while wearable in-bra designs from global brands are widening choice for working mothers.
Which expression devices and services does the estimate cover?
The estimate measures the value of conventional electric, wearable, manual and institutional expression devices sold or rented to households, hospitals, community care services and rental fleet operators in Australia. It covers single and double units, hospital-grade multi-user systems and the rental income earned from them.
The estimate excludes bottles, milk storage bags, nursing bras and other feeding accessories sold on their own. The value chain runs from device makers in Europe, Asia and North America through national distributors to pharmacies, online stores, baby stores, hospitals and hire services in every state and territory.
Australia Breast Pumps Market Insights
- The Australia breast pumps market was valued at USD 15.5 million in 2025 and is projected to reach USD 42.7 million by 2035, registering a CAGR of 11.01% during 2026–2035.
- New South Wales and the Australian Capital Territory held a 33.7% share of 2025 value, because the zone records the most confinements.
- Conventional electric pumps led with a 44.0% share of 2025 value, because most mothers who express regularly choose a double electric unit.
- Australia recorded 292,318 registered births in 2024, up 1.9% from 2023, which keeps a steady base of new buyers each year.
- Paid parental leave reached 26 weeks on July 1, 2026, which shapes when mothers return to work and start expressing.
Electric models lead while wearable designs grow fastest
Why do conventional electric units lead device demand?
Based on product type, the market is categorized into conventional electric pumps, wearable pumps, manual pumps and institutional pump systems. Conventional Electric Pumps led with a 44.0% share of 2025 value, because mothers who express several times a day want strong double pumping. Wearable Pumps grow fastest at 13.01% a year, as quieter in-bra cups let mothers express at work and on the move.
How do home and workplace use split expression demand?
Based on application, the market is categorized into routine home expression, workplace expression, clinical lactation support and travel expression. Routine Home Expression led with a 52.0% share of 2025 value, because most expressing happens in the early months at home. Workplace Expression grows fastest at 11.83% a year, as more mothers keep breastfeeding after they return to paid work.
Why do household purchasers dominate buying?
Based on customer type, the market is categorized into household purchasers, hospital buyers, community care buyers and rental fleet operators. Household Purchasers led with a 71.0% share of 2025 value, because most mothers buy a personal unit for daily use. Household Purchasers grow fastest at 11.16% a year, as more families buy their own wearable and electric models instead of hiring.
How do pharmacies and online stores reach mothers?
Based on distribution channel, the market is categorized into pharmacy and mass retail, e-commerce, specialty baby stores and clinical and rental networks. Pharmacy and Mass Retail led with 38.0% of 2025 value, because pharmacists give fitting advice at the point of sale. E-Commerce grows fastest at 12.22% a year, as mothers compare wearable models and reviews online.
| Segment Group | Leading Sub-segment | Share, 2025 | Fastest-growing Sub-segment | CAGR, 2026–2035 |
|---|---|---|---|---|
| By Product Type | Conventional Electric Pumps | 44.0% | Wearable Pumps | 13.01% |
| By Application | Routine Home Expression | 52.0% | Workplace Expression | 11.83% |
| By Customer Type | Household Purchasers | 71.0% | Household Purchasers | 11.16% |
| By Distribution Channel | Pharmacy and Mass Retail | 38.0% | E-Commerce | 12.22% |
Request a Free Sample
Fill in your details and we'll send you a free sample report.
- Sample data tables & charts
- Research methodology
Return to work, wearables and clinical care lift sales
How does the return to paid work lift portable device use?
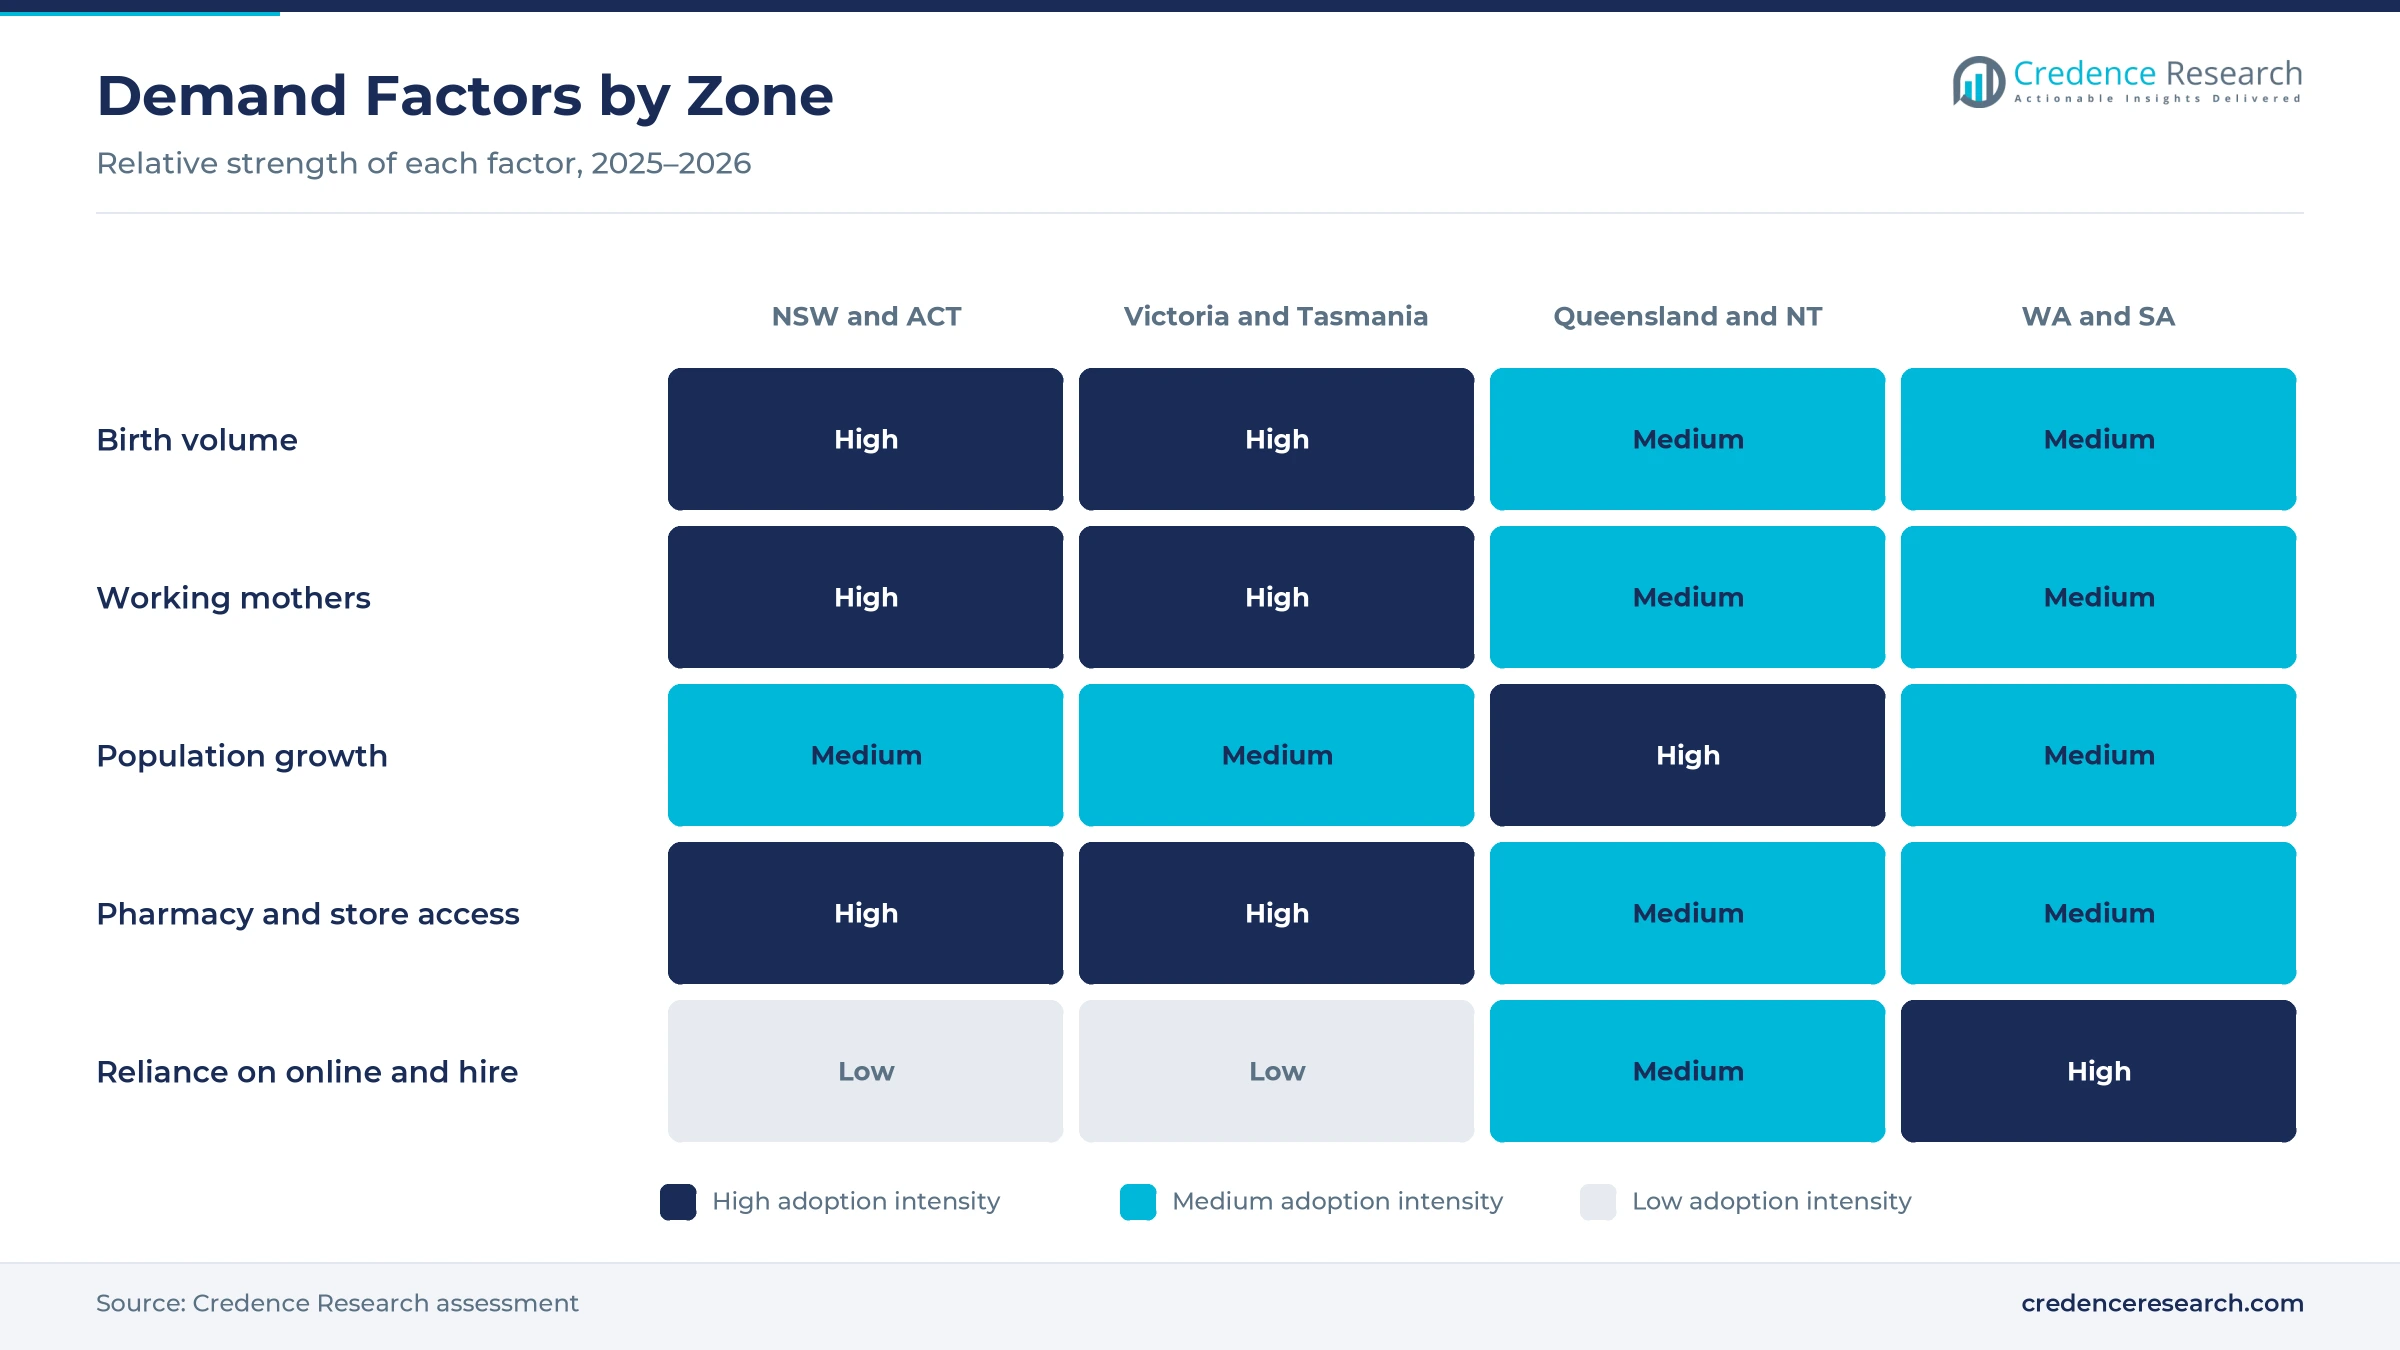
The return to paid work lifts demand for portable devices, because mothers who keep breastfeeding after leave must express during the working day. Female workforce participation reached a record 63.5% in July 2025, according to national labor force data. The government also expanded paid parental leave to 26 weeks from July 1, 2026, at a rate of AUD 1,004.70 a week, according to the Department of Social Services. Australian law also protects the right to express and store milk at work under the Sex Discrimination Act 1984 and the Fair Work Act 2009. As a result, workplace expression grows at 11.83% a year, the fastest application rate, as mothers buy compact double units for office and shift work.
Why does wearable product innovation raise average spend?
Wearable product innovation raises average spend, because in-bra cups cost more than basic electric units and appeal to mothers who want to move while expressing. Medela scheduled its Motion InBra wearable pump for Australia in late 2025, with cups weighing 250 grams each and running at 45 decibels or less. The model also comes in single and double versions, which lets the brand cover two price points with one design. Willow acquired the Elvie brand in April 2025 after Elvie entered administration, which keeps a second premium wearable line in circulation. In turn, wearable pumps grow at 13.01% a year, the fastest product rate, as mothers trade up from plug-in models.
How do clinical and community support networks sustain demand?
Clinical and community support networks sustain demand, because hospitals, lactation consultants and volunteer groups lend hospital-grade units and teach mothers to express. The Australian Breastfeeding Association hires the Medela Symphony hospital-grade pump for AUD 50 a week, or AUD 25 for members, with a AUD 100 deposit. Preterm births made up 8.4% of births in 2023, and caesarean births reached 41%, which often delays direct feeding and makes early pumping necessary. The national breastfeeding strategy also aims to widen access to education, support and clinical care services. As a result, clinical and rental networks keep a steady share of device value across all four zones.
Why does high breastfeeding uptake create a wide user base?
High breastfeeding uptake creates a wide user base, because most mothers start breastfeeding and many express to extend it. Some 90.6% of children aged 0 to three years had ever received breast milk, while 37.5% were exclusively breastfed to six months, according to the Australian Bureau of Statistics. The World Health Organization recommends exclusive breastfeeding for the first six months and continued breastfeeding up to two years or beyond. Australia also recorded 292,318 registered births in 2024, up 1.9% from 2023. In turn, routine home expression keeps a 52.0% share of 2025 value, as mothers use pumps to build milk supply and reduce reliance on infant formula.
Quieter designs and longer paid leave reshape buying
How is the shift to quieter plug-and-play designs changing choice?
The shift to quieter plug-and-play designs is changing product choice, because mothers want devices that work without apps or complex setup. Medela describes its Motion InBra as plug-and-play with no pairing or app needed and three parts to clean. The same model includes 24-millimeter shields with inserts that fit more than 95% of nipple sizes, which addresses a common reason for poor results. The company also states that its 105-degree shield design increases milk expression by 11.8% compared with traditional shields. As a result, brands now compete on noise, weight, fit and cleaning time as much as on suction strength, which favors brands that publish clear sizing and cleaning guides.
Why is the rise of older first-time mothers notable?
The rise of older first-time mothers is notable, because older parents often have higher incomes and buy premium devices and accessories. The median age of mothers reached 32.1 years in 2024, according to national birth statistics. Mothers aged 35 and over made up 28% of mothers in 2023, up from 23% in 2010, while mothers under 25 fell from 18% to 11%. The total fertility rate also fell to 1.481 babies per woman in 2024, from 1.795 in 2014. In turn, families have fewer children but spend more on each one, which supports premium and specialist price tiers in pharmacies, baby stores and online.
Can longer paid leave and super on leave open a new purchase window?
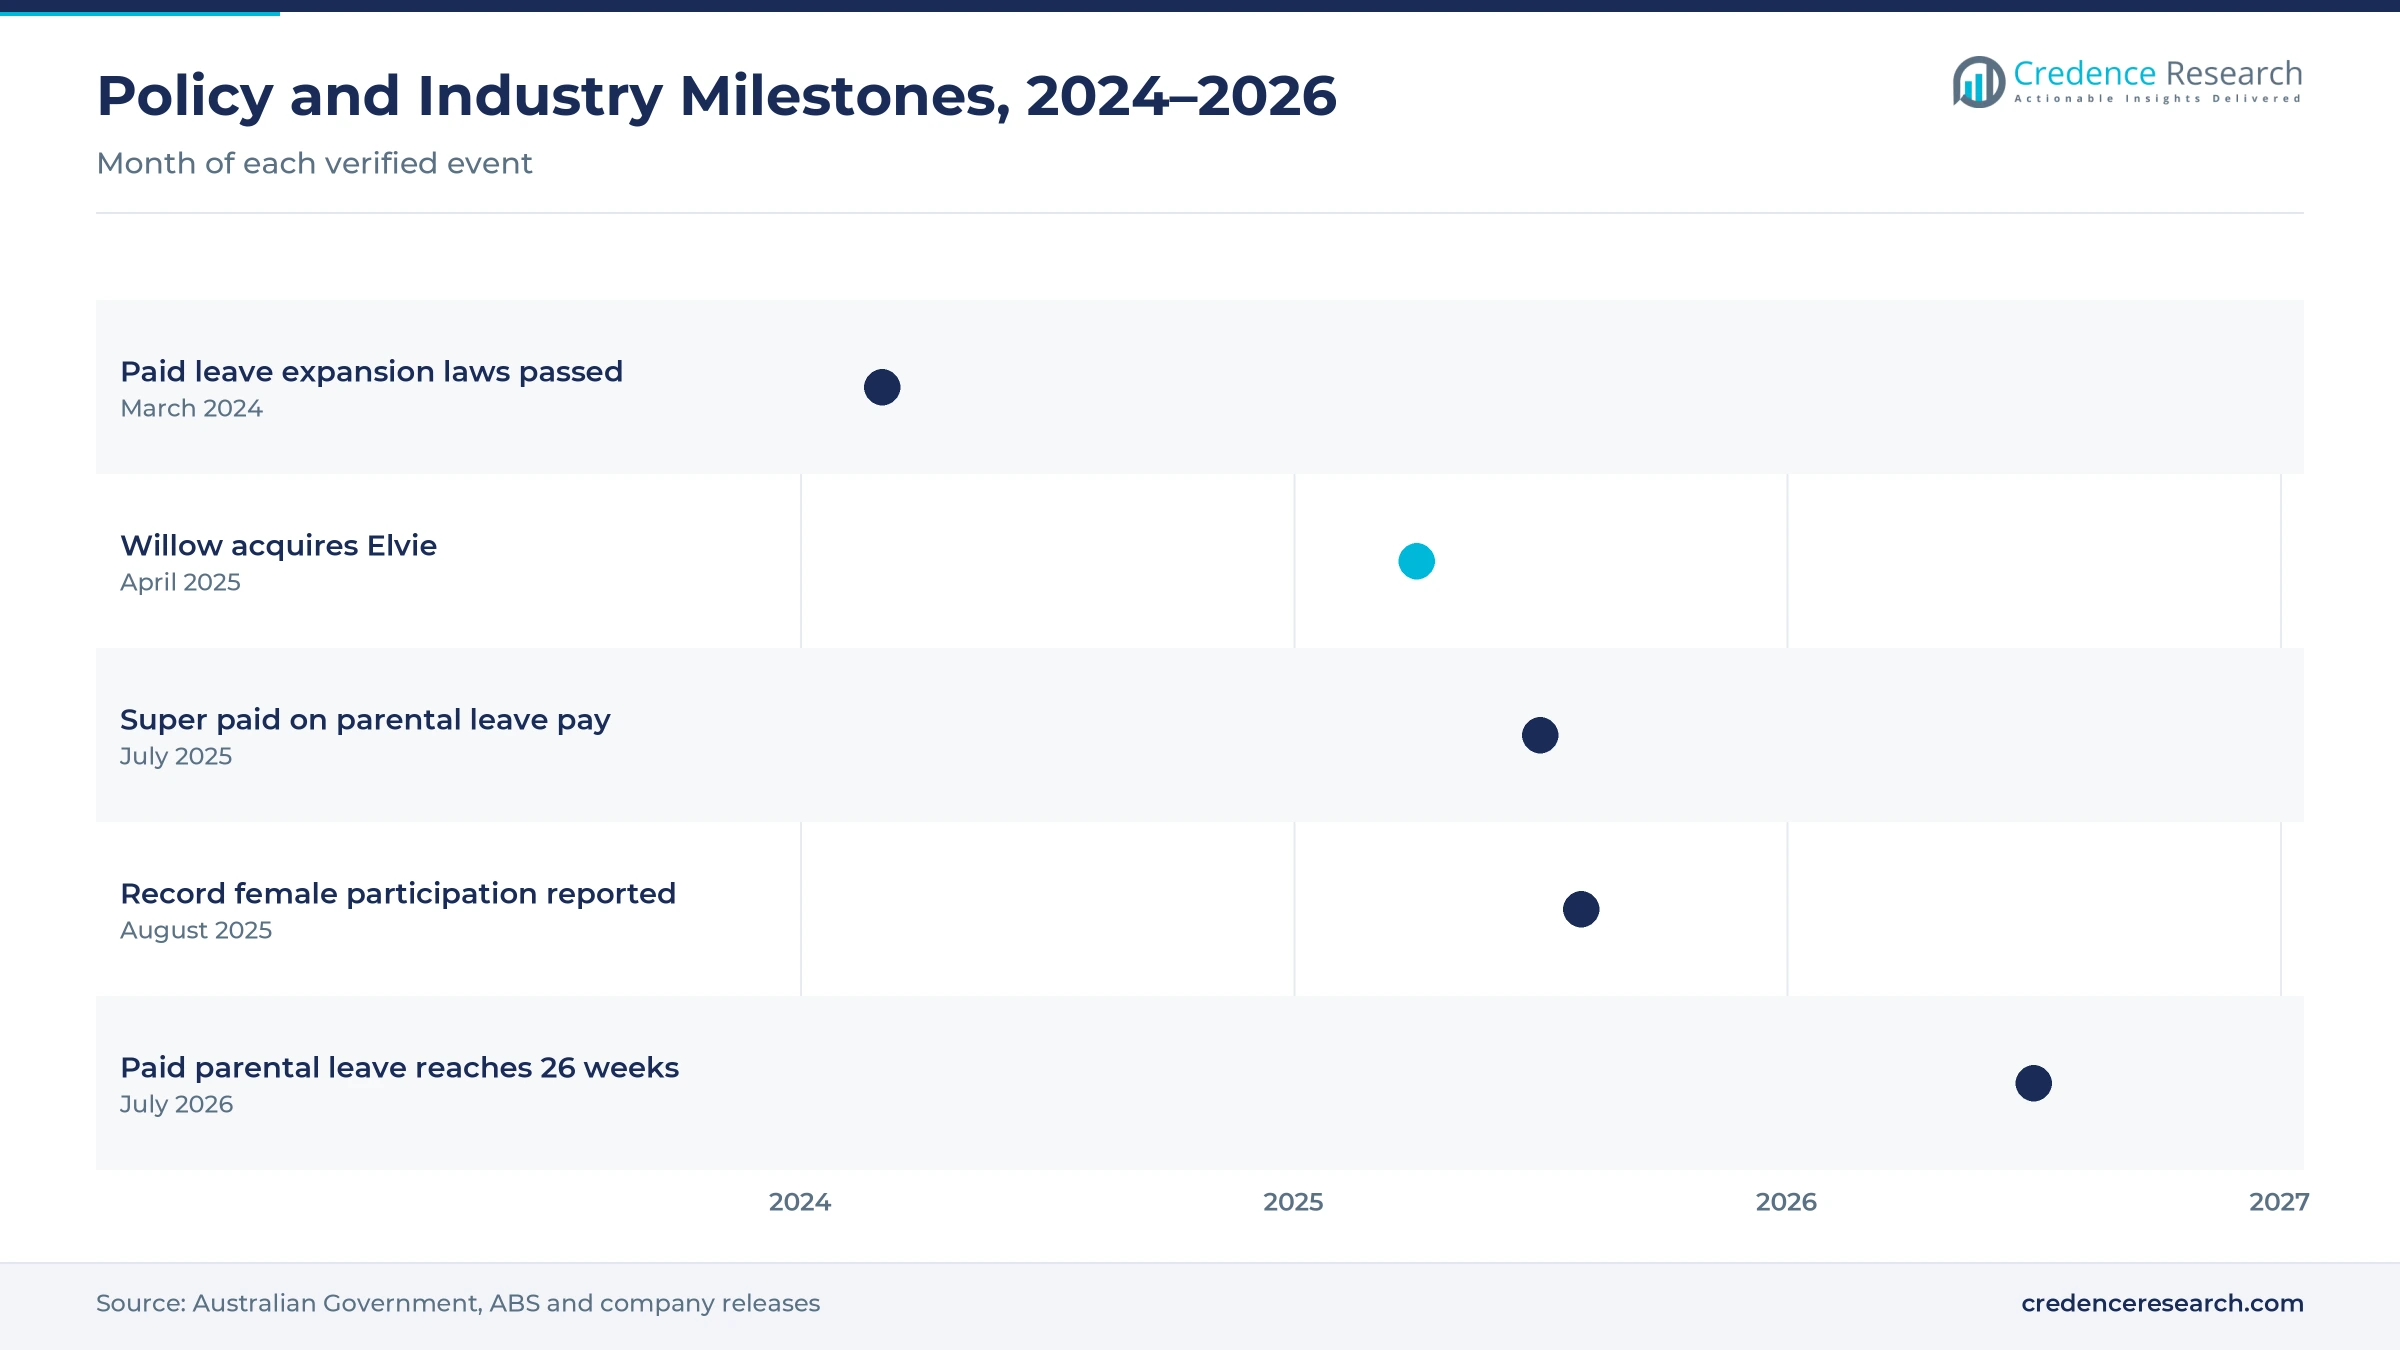
Longer paid leave and superannuation on leave open a new purchase window, because mothers plan their return to work over a longer period. Laws passed in March 2024 added two weeks of paid parental leave each year until the scheme reached 26 weeks in July 2026. Superannuation has also been paid on parental leave pay since July 1, 2025, and families taking the full entitlement now receive almost AUD 30,000. Parents of more than 460,000 children have already benefited from the expansion. As a result, brands that market workplace-ready kits near the end of leave can win sales across all four zones of the country.
Is there room to grow e-commerce sales of expression devices?
E-commerce sales have room to grow, because mothers research wearable and electric models online and compare prices across stores. Online health retailers such as Healthylife list 27 Haakaa products, including silicone manual pumps, milk storage bags and other nursing accessories. However, Spectra Baby Australia, the distributor for Australia, New Zealand and the Pacific, does not sell to online-only stores, which keeps part of the premium range in pharmacies and baby stores. E-commerce already held a large share of 2025 value and grows at 12.22% a year, the fastest channel rate. In turn, brands that combine online sales with fitting advice and returns support can gain share.
Low fertility, device rules and fit issues test suppliers
How does a falling fertility rate cap unit volumes?
A falling fertility rate caps unit volumes, because fewer births per woman shrink the pool of new buyers over time. The total fertility rate fell to 1.481 babies per woman in 2024, the lowest level in the national series. As a result, suppliers cannot rely on rising births to lift sales. Many respond by selling higher-value wearable models, replacement parts and accessories to each mother instead.
Why do device rules raise the cost of new launches?
Device rules raise the cost of new launches, because powered pumps must be listed on the national register of therapeutic goods before sale. The Medela Pump In Style, for example, is listed as a Class IIa powered suction unit. In turn, smaller brands face added paperwork and testing before launch. Many respond by working through local sponsors and distributors that already manage listings for several products.
How do fit and comfort problems limit repeat use?
Fit and comfort problems limit repeat use, because poorly sized shields can cause pain and low milk output. Mothers who struggle with fit often stop expressing early or return the device. As a result, retailers face higher returns and weaker word of mouth. Many suppliers respond with multiple shield sizes, fitting guides and pharmacy staff training that help mothers choose the right size at purchase.
Why does price sensitivity slow premium uptake?
Price sensitivity slows premium uptake, because many families face high living costs in the months after birth. Low-cost wearable imports sold online compete directly with established brands on price alone. In turn, premium brands find it harder to justify higher prices to first-time buyers. Many respond with entry and midrange models, bundle offers and hire options that let mothers test a device before buying.
New South Wales leads as Queensland grows fastest
| Region | Value, 2025 (USD million) | Share, 2025 | CAGR, 2026–2035 |
|---|---|---|---|
| New South Wales and Australian Capital Territory | 5.2 | 33.7% | 10.99% |
| Victoria and Tasmania | 3.8 | 24.6% | 11.09% |
| Western Australia and South Australia | 3.3 | 21.5% | 10.69% |
| Queensland and Northern Territory | 3.1 | 20.2% | 11.29% |
Why do new South Wales and the ACT hold the top share?
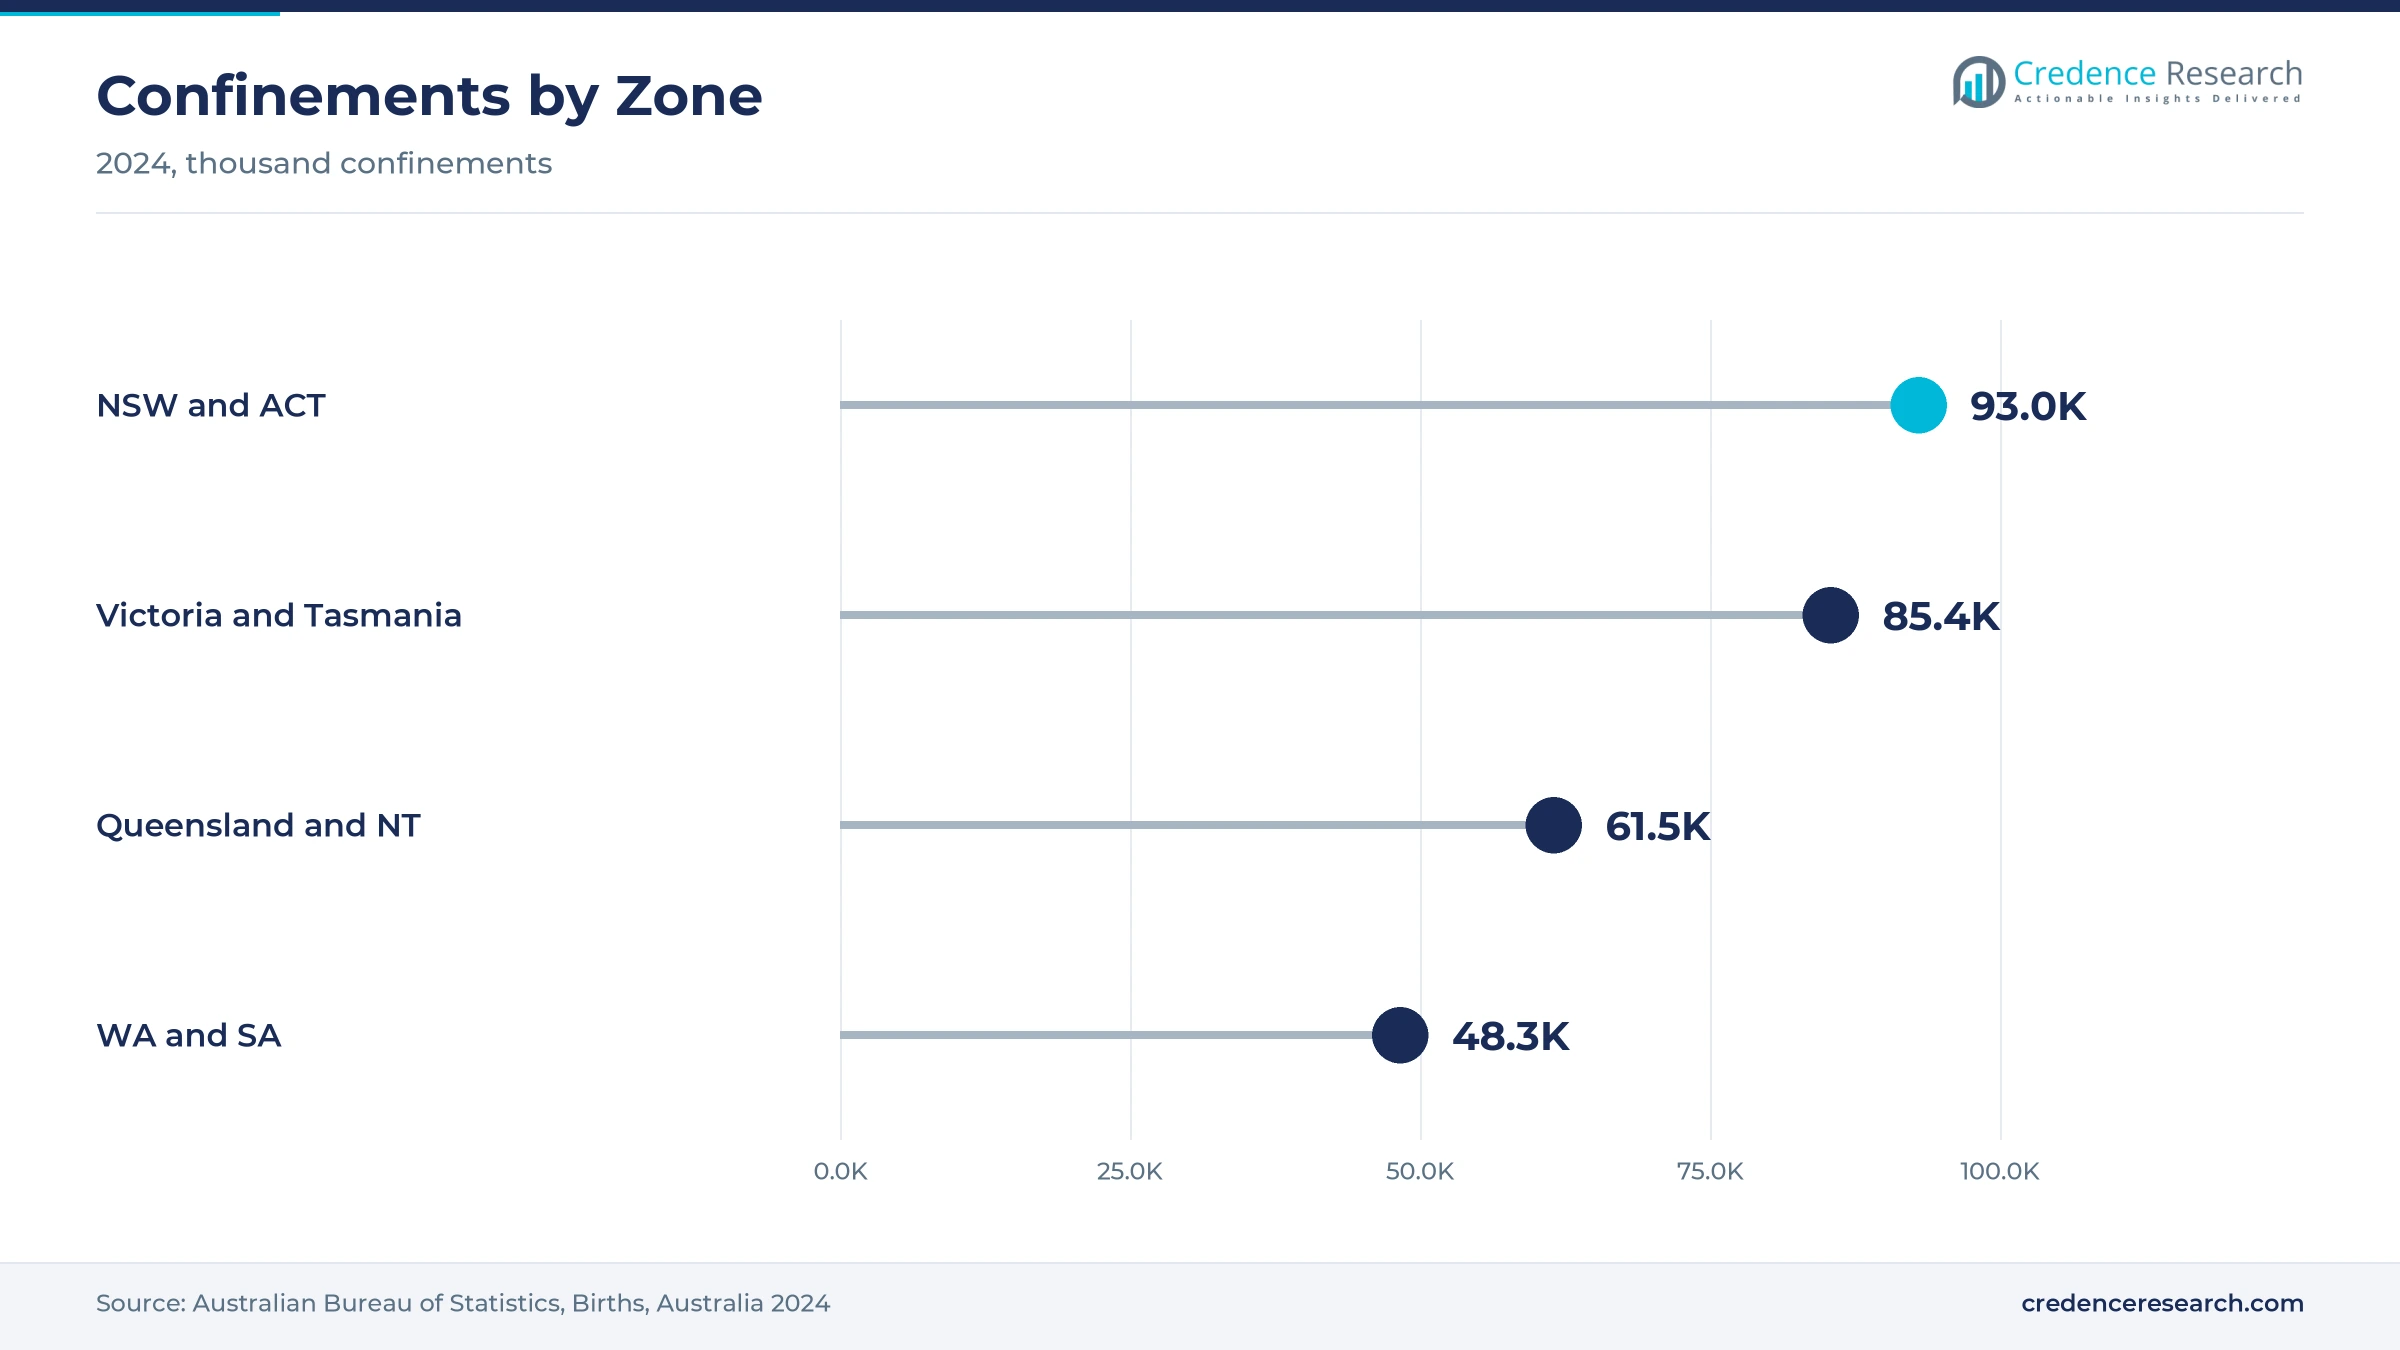
New South Wales and the Australian Capital Territory held a 33.7% share of 2025 value and grow at 10.99% a year, because the zone records the most births. The two jurisdictions together recorded about 92,990 confinements in 2024. Sydney and Canberra also have dense pharmacy networks and large public hospitals with lactation services, which keeps both retail and clinical demand for breast pumps high. Canberra parents also have the highest median ages in the country, at 32.8 years for mothers, which supports spending on premium electric and wearable models.
How do Victoria and Tasmania support device demand?
Victoria and Tasmania held a 24.6% share of 2025 value and grow at 11.09% a year, because Melbourne has a large population of working mothers. The two states together recorded about 85,400 confinements in 2024. Victorian mothers also have one of the highest median ages at 32.7 years, which supports spending on premium electric and wearable models. However, Tasmania has a younger median age for mothers at 31.1 years and fewer specialist stores, so more families there buy breast pumps online or hire them.
Why are Queensland and the Northern Territory growing fastest?
Queensland and the Northern Territory held a 20.2% share of 2025 value and grow fastest at 11.29% a year, because population growth is strong in south-east Queensland. The zone recorded about 61,500 confinements in 2024, and the Northern Territory recorded the largest proportional rise in births outside Victoria, at 6.2%. As a result, new suburbs around Brisbane and the Gold Coast add pharmacies and baby stores each year. Long distances in the north also make online sales and postal hire services important for mothers outside the main cities.
What shapes demand in Western Australia and South Australia?
Western Australia and South Australia held a 21.5% share of 2025 value and grow at 10.69% a year, because both states have large capital cities but long distances to regional towns. The two states together recorded about 48,260 confinements in 2024. As a result, online sales and hire services matter more for mothers outside Perth and Adelaide.
Launches, ownership changes and leave reforms, 2024–2026
| Development | Status and market relevance |
|---|---|
| In March 2024, the government passed laws to add two weeks of paid parental leave each year until it reached 26 weeks. | Set the path to six months of paid leave by July 2026 |
| In April 2025, Willow acquired the Elvie brand after Elvie entered administration. | Kept a second premium wearable line in circulation |
| In July 2025, superannuation started being paid on government parental leave pay at the 12% guarantee rate. | Covers children born or adopted on or after July 1, 2025 |
| In August 2025, national data showed female workforce participation at a record 63.5% for July 2025. | Confirms a larger pool of mothers returning to work |
| In July 2026, paid parental leave reached 26 weeks at a rate of AUD 1,004.70 a week. | Families taking the full entitlement receive almost AUD 30,000 |
Two-phase suction and in-bra cups change expression
- Two-phase expression starts with fast light suction to trigger let-down and then switches to slower deeper cycles, which mimics a feeding baby and suits most electric models.
- In-bra wearable cups hold the motor and milk container inside nursing bras, which lets mothers express while working, driving or caring for other children.
- Hospital-grade multi-user systems use closed collection kits so one mains-powered unit can serve many mothers, which suits hospitals and hire services.
Need a Custom Version of This Report?
Tailor the scope, geography, or segments to your exact requirements.
- Custom geography or segment scope
- Direct access to our analyst team
Global device brands and local distributors compete
Competition in breast pumps is split between global device brands with national distributors and value brands that sell mainly online. Medela runs a local subsidiary, lists its powered pumps on the national register and supplies the Symphony units that the Australian Breastfeeding Association hires to mothers. Spectra Baby Australia distributes Spectra pumps across Australia, New Zealand and the Pacific through physical stores and care providers. Haakaa, a New Zealand family-owned business, sells silicone manual pumps through online health retailers. Elvie continues under Willow ownership after its April 2025 acquisition. Philips Avent, Ameda, Ardo Medical, Tommee Tippee, Momcozy and Anker Innovations also compete for buyers. Rivals compete on suction comfort, noise, weight, shield fit, battery life, hire options and price. Because many mothers seek advice before buying, brands with pharmacy training and lactation partnerships win more first purchases.
Which companies supply expression devices in Australia?
| Company | Type | Role in the market |
|---|---|---|
| Medela | Global device maker | Local subsidiary; Symphony units hired through community networks |
| Spectra Baby Australia | National distributor | Distributes Spectra pumps across Australia, New Zealand and the Pacific |
| Haakaa | Regional brand | New Zealand family-owned maker of silicone manual pumps |
| Elvie | Wearable device brand | Acquired by Willow in April 2025 after administration |
Credence Research view on expression device demand
Credence Research's view is that Australian demand for expression devices will grow quickly because more mothers keep breastfeeding after they return to paid work. Conventional electric units remain the core of the market, while wearable cups add the fastest growth as quieter and lighter designs reach pharmacies and online stores. Longer paid leave spreads purchases over a longer planning period. Suppliers that combine good fit, strong advice and hire options should gain share fastest, while low-cost online brands will keep pressure on entry-tier prices.
How the national expression device estimate was built
The report uses 2025 as the base year on a calendar basis, and market values come from the Credence Research model. That model combines national birth and breastfeeding statistics, labor force data, paid parental leave policy, device register listings and company announcements on new products. Segment splits and zone growth rates are Credence Research estimates, while zone shares follow the client-defined split. Sources used are official statistics, government releases, community organization pages and company releases, and no interviews or surveys were used.
Wearable designs and workplace use carry growth to 2035
Device value is expected to reach USD 42.7 million by 2035, an 11.01% CAGR during 2026–2035, as working mothers, wearable designs and clinical support lift demand. Growth should stay strong through 2030 while wearable models move into mainstream pharmacy and online ranges. After that, replacement cycles, accessories and hire services will carry more of the value. A further fall in births would cap unit volumes, while stronger workplace support would lift use. Brands with good fit and advice are expected to gain the most.
Frequently Asked Questions
How big is the Australia breast pumps market?
Which product type leads Australian expression device demand?
Which zone leads the Australian market?
How common is breastfeeding in Australia?
How does paid parental leave affect device demand?
Which application is growing fastest?
Who are the leading companies in the Australian market?
What are the main challenges for suppliers?
Table of Content
Chapter 1 Market Segmentation
- 1.1 Segmentation Framework
- 1.1.1 Product and Service Classification
- 1.1.2 Application and End-Use Classification
- 1.1.3 Technology and Solution Classification
- 1.1.4 Customer and Distribution Channel Classification
- 1.1.5 Geographic Segmentation
- 1.1.6 Market Segment Definitions and Boundaries
- 1.2 By Product Type
- 1.2.1 Conventional Electric Pumps
- 1.2.2 Wearable Pumps
- 1.2.3 Manual Pumps
- 1.2.4 Institutional Pump Systems
- 1.3 By Application
- 1.3.1 Routine Home Expression
- 1.3.2 Workplace Expression
- 1.3.3 Clinical Lactation Support
- 1.3.4 Travel Expression
- 1.4 By Customer Type
- 1.4.1 Household Purchasers
- 1.4.2 Hospital Buyers
- 1.4.3 Community Care Buyers
- 1.4.4 Rental Fleet Operators
Chapter 2 Introduction
- 2.1 Report Objectives and Scope
- 2.2 Product Definition and Industry Terminology
- 2.3 Market Inclusions and Exclusions
- 2.4 Research Process
- 2.4.1 Primary Research and Expert Interviews
- 2.4.2 Secondary Research and Source Review
- 2.4.3 Top-Down and Bottom-Up Estimation
- 2.4.4 Data Triangulation and Verification
- 2.5 Market Size Measurement Basis
- 2.5.1 2025: USD 15.5 million → 2035: USD 42.7 million
- 2.6 Historical and Forecast Reference Periods
- 2.6.1 Historical Period: 2018-2025
- 2.6.2 Base Year: 2025
- 2.6.3 Forecast Period: 2025-2035
- 2.7 Research Assumptions and Limitations
Chapter 3 Executive Summary
- 3.1 Market Snapshot and Key Findings
- 3.2 Base-Year Market Size, 2025
- 3.3 Forecast Market Size, 2035
- 3.4 Revenue and Volume Growth Outlook
- 3.5 Key Demand and Supply Indicators
- 3.6 Leading Market Segments
- 3.7 Fastest-Growing Market Opportunities
- 3.8 Regional Performance Highlights
- 3.9 Technology and Industry Transformation
- 3.10 Competitive Landscape Summary
- 3.11 Analyst View and Strategic Implications
Chapter 4 Australia Breast Pumps Market Trends and Developments
- 4.1 Historical Industry Development, 2018-2025
- 4.2 Recent Market Trends and Developments
- 4.3 Demand and Customer Behavior Trends
- 4.4 Technology and Product Innovation
- 4.5 Artificial Intelligence, Automation and Digitalization
- 4.6 Local Manufacturing and Supply Chain Realignment
- 4.7 Industry Partnerships, Mergers and Acquisitions
- 4.8 Sustainability and Circular Economy Developments
- 4.9 Government and Private Sector Investment Trends
- 4.10 Emerging Business Models and Commercialization
- 4.11 Industry Developments and Announcements
Chapter 5 Australia Breast Pumps Market Production, Supply and Demand Analysis
- 5.1 Demand Trend and Consumption Analysis, 2018-2025
- 5.2 Demand Forecast, 2025-2035
- 5.3 Production and Output Trend, 2018-2025
- 5.4 Production and Output Forecast, 2025-2035
- 5.5 Installed Capacity and Capacity Utilization
- 5.6 Company-Wise Production Plants and Statistics
- 5.6.1 Installed Production Capacity
- 5.6.2 Actual Production
- 5.6.3 Planned Capacity and Expansion Targets
- 5.7 Supply Chain Structure and Procurement Trends
- 5.8 Supply-Demand Gap and Bottlenecks
- 5.9 Import Dependence and Sourcing Structure
- 5.10 Contract Manufacturing and Outsourcing
- 5.11 Regional Supply and Demand Concentration
Chapter 6 Australia Breast Pumps Market Pricing Analysis
- 6.1 Pricing Structure and Measurement
- 6.2 Historical Pricing Trends, 2018-2025
- 6.3 Pricing Outlook, 2025-2035
- 6.4 Average Selling Price and Unit Economics
- 6.5 Pricing by Product and Market Segment
- 6.6 Geographic Pricing Differences
- 6.7 Key Input, Energy, Labor and Logistics Costs
- 6.8 Contract Pricing and Purchasing Models
- 6.9 Pricing Sensitivity and Competitive Positioning
- 6.10 Price, Margin and Profitability Implications
Chapter 7 Australia Breast Pumps Market Dynamics
- 7.1 Market Growth Drivers
- 7.1.1 Demand-Side Drivers
- 7.1.2 Technology and Innovation Drivers
- 7.1.3 Infrastructure and Investment Drivers
- 7.1.4 Regulatory and Policy Drivers
- 7.2 Market Restraints
- 7.2.1 Cost and Affordability Constraints
- 7.2.2 Technology and Adoption Barriers
- 7.2.3 Supply Chain and Operational Constraints
- 7.3 Market Challenges
- 7.3.1 Competitive Pressure and Margin Erosion
- 7.3.2 Skills, Infrastructure and Implementation Gaps
- 7.4 Emerging Market Opportunities
- 7.5 Market Dynamics Impact and Time-Horizon Assessment
Chapter 8 Australia Breast Pumps Value Chain Analysis
- 8.1 Industry Value Chain Overview
- 8.2 Upstream Suppliers and Critical Inputs
- 8.3 Technology and Component Providers
- 8.4 Manufacturing or Service Delivery
- 8.5 Distribution, Channel Partners and Integrators
- 8.6 Downstream Applications and End Users
- 8.7 Value Addition and Profit Pools
- 8.8 Vertical Integration and Outsourcing
- 8.9 Supplier Concentration and Risk
- 8.10 Supply Chain Localization and Resilience
Chapter 9 Australia Breast Pumps Market Regulations and Policies
- 9.1 Relevant Laws, Standards and Compliance Frameworks
- 9.2 Product, Service, Safety and Quality Requirements
- 9.3 Government Policies, Incentives and Subsidies
- 9.4 Imports, Exports and Trade Barriers
- 9.5 Public Procurement and Local Content Requirements
- 9.6 Environmental and Sustainability Compliance
- 9.7 Upcoming Policy Changes and Market Implications
Chapter 10 Australia Breast Pumps Market Hotspots and Opportunities
- 10.1 Market Opportunity Mapping and Growth Hotspots
- 10.2 High-Growth Applications and Customer Groups
- 10.3 Underserved Markets and White-Space Opportunities
- 10.4 Emerging Technology and Product Opportunities
- 10.5 New Capacity and Investment Hotspots
- 10.6 Market Entry and Expansion Opportunities
- 10.7 Distribution and Partnership Opportunities
- 10.8 Near-Term and Long-Term Commercial Potential
- 10.9 Opportunity Attractiveness and Execution Risks
Chapter 11 Australia Breast Pumps Market Outlook, 2025-2035
- 11.1 Market Size and Analysis
- 11.1.1 Revenue (Market Measurement: 2025: USD 15.5 million → 2035: USD 42.7 million)
- 11.1.2 Market Volume and Quantity Sold
- 11.1.3 Historical Market Size, 2018-2025
- 11.1.4 Base-Year Market Size, 2025
- 11.2 Market Forecast, 2025-2035
- 11.2.1 Revenue Forecast to 2035
- 11.2.2 Volume Forecast to 2035
- 11.2.3 CAGR and Year-on-Year Growth
- 11.2.4 Incremental Revenue Opportunity
- 11.3 Forecast Assumptions and Scenario Analysis
- 11.3.1 Base-Case Forecast
- 11.3.2 Optimistic and Conservative Scenarios
- 11.3.3 Technology, Pricing and Policy Sensitivities
- 11.4 Market Attractiveness and Growth Outlook
Chapter 12 Australia Breast Pumps Market Segmentation and Outlook
- 12.1 Segmentation Summary and Market Shares, 2025
- 12.2 Largest and Fastest-Growing Segments
- 12.3 By Product Type - Market Size and Forecast, 2025-2035
- 12.3.1 Segment Definition and Scope
- 12.3.2 Historical Market Size, 2018-2025
- 12.3.3 Revenue Forecast, 2025-2035
- 12.3.4 Volume Forecast, 2025-2035
- 12.3.5 Base-Year Market Share, 2025
- 12.3.6 Segment CAGR and Growth Drivers
- 12.3.7 Subsegment Market Size and Forecast
- 12.3.7.1 Conventional Electric Pumps
- 12.3.7.2 Wearable Pumps
- 12.3.7.3 Manual Pumps
- 12.3.7.4 Institutional Pump Systems
- 12.3.8 Subsegment Pricing and Adoption Trends
- 12.3.9 Leading Suppliers and Competition
- 12.3.10 Regional Demand and Opportunities
- 12.4 By Application - Market Size and Forecast, 2025-2035
- 12.4.1 Segment Definition and Scope
- 12.4.2 Historical Market Size, 2018-2025
- 12.4.3 Revenue Forecast, 2025-2035
- 12.4.4 Volume Forecast, 2025-2035
- 12.4.5 Base-Year Market Share, 2025
- 12.4.6 Segment CAGR and Growth Drivers
- 12.4.7 Subsegment Market Size and Forecast
- 12.4.7.1 Routine Home Expression
- 12.4.7.2 Workplace Expression
- 12.4.7.3 Clinical Lactation Support
- 12.4.7.4 Travel Expression
- 12.4.8 Subsegment Pricing and Adoption Trends
- 12.4.9 Leading Suppliers and Competition
- 12.4.10 Regional Demand and Opportunities
- 12.5 By Customer Type - Market Size and Forecast, 2025-2035
- 12.5.1 Segment Definition and Scope
- 12.5.2 Historical Market Size, 2018-2025
- 12.5.3 Revenue Forecast, 2025-2035
- 12.5.4 Volume Forecast, 2025-2035
- 12.5.5 Base-Year Market Share, 2025
- 12.5.6 Segment CAGR and Growth Drivers
- 12.5.7 Subsegment Market Size and Forecast
- 12.5.7.1 Household Purchasers
- 12.5.7.2 Hospital Buyers
- 12.5.7.3 Community Care Buyers
- 12.5.7.4 Rental Fleet Operators
- 12.5.8 Subsegment Pricing and Adoption Trends
- 12.5.9 Leading Suppliers and Competition
- 12.5.10 Regional Demand and Opportunities
- 12.6 Segment Growth Comparison
- 12.7 Segment Attractiveness and Priority Matrix
Chapter 13 Australia Breast Pumps End-Use and Application Market Outlook
- 13.1 End-Use Industry and Customer Demand Structure
- 13.2 Leading Applications and Customer Groups
- 13.3 End-Use Market Size, Share and Forecast
- 13.4 Major End-Use Industry Deep Dives
- 13.4.1 Customer Requirements and Use Cases
- 13.4.2 Demand and Replacement Cycles
- 13.4.3 Technical and Regulatory Considerations
- 13.4.4 Purchasing and Procurement Models
- 13.4.5 Leading Vendors and Distribution Channels
- 13.4.6 Forecast and Commercial Opportunities
- 13.5 Emerging Applications and Cross-Segment Demand
- 13.6 End-Use Industry Investment Priorities
Chapter 14 Australia Breast Pumps Geographic Market Outlook, 2025-2035
- 14.1 Domestic Market Distribution and Demand Clusters
- 14.2 State- or Province-Wise Market Size and Forecast, 2025-2035
- 14.3 City and Metropolitan Market Outlook
- 14.4 Industrial, Manufacturing and Commercial Clusters
- 14.5 Geographic Concentration of Key End Users
- 14.6 Local Pricing and Purchasing Differences
- 14.7 Domestic Production Facilities and Capacity Map
- 14.8 Local Infrastructure and Project Pipeline
- 14.9 State-Level Policy and Incentive Differences
- 14.10 Subnational Investment Hotspots and Opportunities
- 14.11 Distribution and Logistics Networks
- 14.12 Domestic Competitive Footprint
Chapter 15 Australia Breast Pumps Technology, Innovation and Sustainability Outlook
- 15.1 Technology Landscape and Maturity
- 15.2 Product, Process and Service Innovation
- 15.3 AI, Automation and Digital Tools in the Industry
- 15.4 Technology Adoption and Performance Benchmarking
- 15.5 Innovation Pipeline and R&D Investment
- 15.6 Patent and Intellectual Property Trends
- 15.7 Energy Efficiency and Resource Management
- 15.8 Sustainability, Recycling and Circularity
- 15.9 Technology Roadmap, 2025-2035
- 15.10 Risks of Obsolescence and Technology Substitution
Chapter 16 Australia Breast Pumps Market Key Strategic Imperatives
- 16.1 Growth and Market Entry Priorities
- 16.2 High-Return Products and Segments
- 16.3 Pricing, Profitability and Cost Optimization
- 16.4 Technology Investment and Product Differentiation
- 16.5 Supply Chain Localization and Resilience
- 16.6 Distribution and Customer Acquisition
- 16.7 Partnership, Acquisition and Capacity Strategy
- 16.8 Regional Expansion Priorities
- 16.9 Short-, Medium- and Long-Term Actions
Chapter 17 Competition Outlook
- 17.1 Industry Competition Characteristics
- 17.2 Market Structure and Concentration
- 17.3 Market Share and Competitive Positioning, 2025
- 17.4 Company-Wise Revenue and Product Benchmarking
- 17.5 Production and Service Capacity Benchmarking
- 17.6 Technology, Pricing and Differentiation
- 17.7 Regional Footprint and Distribution Strength
- 17.8 Mergers, Acquisitions and Strategic Alliances
- 17.9 New Entrants and Competitive Threats
- 17.10 Porter's Five Forces and Industry Attractiveness
- 17.11 Competitive Outlook, 2025-2035
Chapter 18 Company Profiles
- 18.1 Company Coverage and Selection Criteria
- 18.2 Medela
- 18.2.1 Business Description
- 18.2.2 Company Ownership and Geographic Presence
- 18.2.3 Product and Service Portfolio
- 18.2.4 Manufacturing and Operating Footprint
- 18.2.5 Production Capacity and Expansion Plans
- 18.2.6 Financial Performance and Investment
- 18.2.7 Market Share and Competitive Position
- 18.2.8 Technology and Innovation Capabilities
- 18.2.9 Strategic Alliances or Partnerships
- 18.2.10 Recent Developments
- 18.2.11 Growth Strategy and Outlook
- 18.3 Spectra Baby Australia
- 18.4 Haakaa
- 18.5 Philips Avent
- 18.6 Ameda
- 18.7 Ardo Medical
- 18.8 Tommee Tippee
- 18.9 Elvie
- 18.10 Momcozy
- 18.11 Anker Innovations
- 18.12 Other Relevant Market Participants
Note: Every listed company is profiled on the structure shown under the first company. The company list is preliminary and may change based on research findings, market developments, data availability and client requirements.
Chapter 19 Disclaimer
- 19.1 Research and Forecast Disclaimer
- 19.2 Data Source and Estimation Limitations
Note: The depth of individual sections depends on data availability for this market. Volume, capacity, trade and other unit-based metrics are included where applicable.

