Market Overview
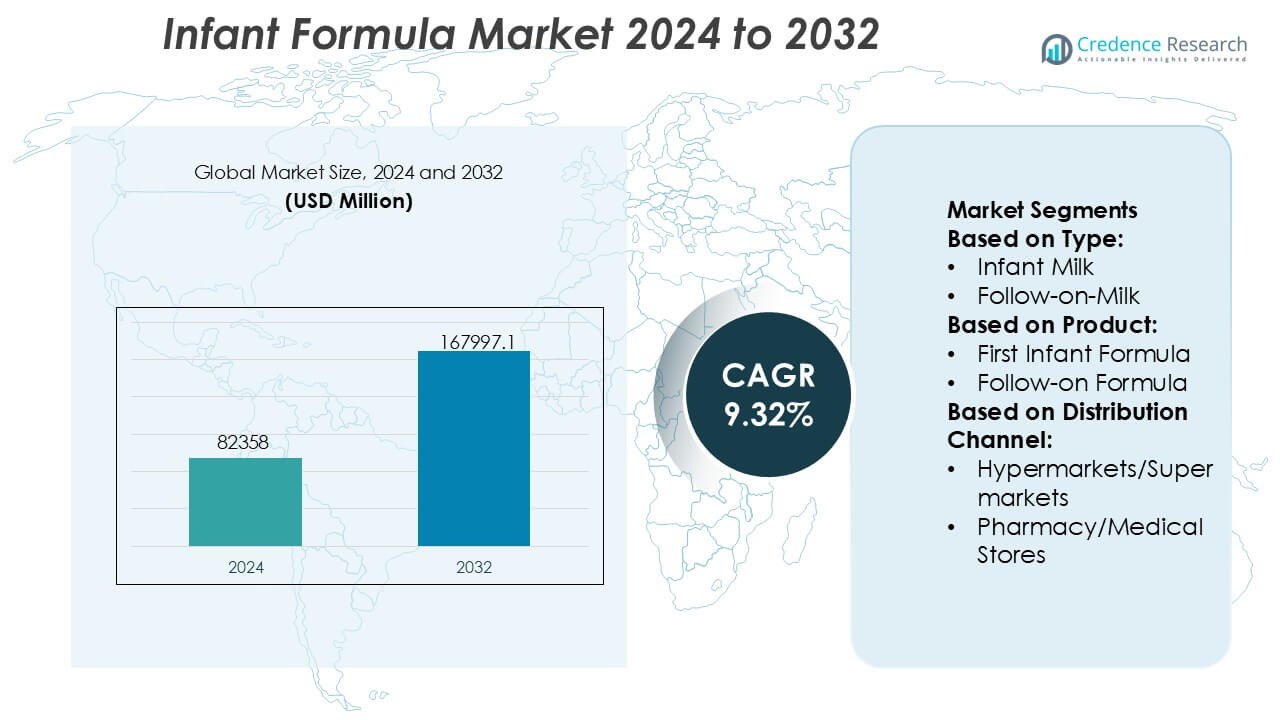
Infant Formula Market size was valued USD 82358 million in 2024 and is anticipated to reach USD 167997.1 million by 2032, at a CAGR of 9.32% during the forecast period.
| REPORT ATTRIBUTE |
DETAILS |
| Historical Period |
2020-2023 |
| Base Year |
2024 |
| Forecast Period |
2025-2032 |
| Infant Formula Market Size 2024 |
USD 82358 Million |
| Infant Formula Market , CAGR |
9.32% |
| Infant Formula Market Size 2032 |
USD 167997.1 Million |
The infant formula market is led by a group of globally established nutrition and food companies that compete through strong research capabilities, diversified product portfolios, and extensive regulatory expertise. These players emphasize clinically supported formulations, specialty nutrition, and premium offerings to strengthen brand trust and capture evolving consumer demand. Strategic priorities include continuous product innovation, expansion of manufacturing capacity, and reinforcement of omnichannel distribution networks to improve market reach and supply reliability. Regionally, Asia-Pacific emerges as the leading market with an exact 41% market share, supported by high birth rates, rapid urbanization, and rising disposable incomes across major economies. Strong growth in organized retail, expanding e-commerce adoption, and increasing awareness of infant nutrition further reinforce the region’s dominant position in the global competitive landscape.
Access crucial information at unmatched prices!
Request your sample report today & start making informed decisions powered by Credence Research Inc.!
Download Sample
Market Insights
- The Infant Formula Market size was valued at USD 82,358 million in 2024 and is projected to reach USD 167,997.1 million by 2032, expanding at a CAGR of 9.32% during the forecast period, reflecting strong long-term demand fundamentals.
- Market growth is driven by rising urbanization, increasing female workforce participation, and growing awareness of scientifically formulated infant nutrition, with infant formula remaining the dominant product segment due to its essential role in early-life feeding.
- Ongoing trends include premiumization, clean-label formulations, and increasing adoption of specialty and condition-specific formulas, while manufacturers focus on clinical validation, ingredient innovation, and advanced packaging formats.
- The competitive landscape remains intense, shaped by global nutrition leaders investing in R&D, capacity expansion, and omnichannel distribution to strengthen brand trust and maintain differentiation amid rising private-label competition.
- Regionally, Asia-Pacific leads with an exact 41% market share, supported by high birth rates, rapid urbanization, and expanding e-commerce and organized retail, while North America and Europe sustain demand through premium and specialty segments.
Market Segmentation Analysis:
By Type
Within the Infant Formula Market by type, Infant Milk emerges as the dominant sub-segment, accounting for an exact 46% market share. Its leadership reflects consistent demand for nutritionally complete milk-based solutions designed to support early-stage growth and immunity. Infant milk benefits from strong pediatric recommendations, standardized nutritional profiles, and widespread parental trust in established formulations. Rising urbanization, higher maternal employment rates, and increasing awareness of balanced infant nutrition further reinforce adoption. Meanwhile, follow-on milk and other types serve age-specific needs but remain secondary due to narrower consumption windows and targeted usage patterns.
- For instance, Arla Foods amba, through its Arla Ingredients division, formulates infant milk solutions using Lacprodan® whey protein systems engineered to deliver a protein concentration aligned with infant requirements and fortified to meet EU-mandated DHA levels of 20 mg per 100 kcal, supported by production at ISO 22000-certified nutrition facilities operating dedicated infant-grade spray-drying lines.
By Product
By product, Infant Formula holds the dominant position with an exact 58% market share, supported by its broad applicability from birth through early childhood stages. Within this category, first infant formula drives volumes due to its role as a primary breast milk substitute. Growth is fueled by advances in nutrient fortification, inclusion of DHA, ARA, and probiotics, and increasing acceptance among working parents. Specialty baby formulas and baby food products expand steadily, driven by allergy management and convenience, but infant formula maintains leadership due to daily consumption frequency and strong clinical alignment.
- For instance, Abbott’s Similac® brand formulas, specifically product lines like Similac 360 Total Care, integrate 2’-fucosyllactose (2′-FL) human milk oligosaccharide (HMO) at concentrations used in clinical studies, typically around 0.2 g per liter.
By Distribution Channel
Across distribution channels, Hypermarkets and Supermarkets dominate with an exact 41% market share, reflecting their extensive product assortments, competitive pricing, and high consumer footfall. These outlets enable parents to compare brands, formulations, and pack sizes in a single location, strengthening purchase confidence. Organized retail expansion in urban and semi-urban areas further accelerates channel growth. Pharmacies and specialty stores remain important for medically oriented and premium products, yet hypermarkets retain leadership due to accessibility, promotional strategies, and established trust for routine infant nutrition purchases.
Key Growth Drivers
Rising Birth Rates in Emerging Economies and Urban Lifestyles
Growth in the infant formula market accelerates with expanding birth cohorts in emerging economies and rapid urbanization that reshapes family structures. Dual-income households, increased female workforce participation, and limited breastfeeding duration drive reliance on convenient, nutritionally standardized alternatives. Urban consumers favor products that ensure consistency, safety, and easy preparation, supporting higher adoption of infant and follow-on formulas. Healthcare access improvements and wider pediatric outreach further reinforce trust in regulated formula products, strengthening demand across metropolitan and semi-urban populations.
- For instance, Bellamy’s Organic produces its infant formula using certified organic milk sourced from Australian farms that are audited to meet the stringent NASAA Organic Standard 3.6.1. The company operates manufacturing facilities designed to meet global food safety standards, including compliance with ISO 22000 food safety management systems.
Increasing Awareness of Infant Nutrition and Fortification
Parents and caregivers show heightened awareness of early-life nutrition and its long-term impact on cognitive and physical development. This awareness drives preference for scientifically formulated products enriched with DHA, ARA, prebiotics, probiotics, nucleotides, and essential micronutrients. Pediatric recommendations and hospital-based sampling programs reinforce credibility and accelerate trial rates. Manufacturers respond by strengthening clinical validation and transparent labeling, which elevates consumer confidence and expands demand for premium and specialized infant formula offerings.
- For instance, Royal FrieslandCampina N.V., through its Friso® infant nutrition portfolio, incorporates essential nutrients like DHA, ARA, and prebiotics, including 2’-fucosyllactose. The company applies its proprietary LockNutri® process, which uses controlled, mild heat treatment during a single manufacturing process to help preserve the native structure of milk proteins, making them easier to digest.
Expansion of Organized Retail and Digital Distribution
The rapid expansion of organized retail formats and e-commerce platforms significantly improves product availability and accessibility. Supermarkets, pharmacies, and specialty baby stores offer broad assortments and professional guidance, while digital channels provide subscription models, doorstep delivery, and detailed product education. These channels enhance brand visibility and price transparency, enabling manufacturers to reach wider consumer segments efficiently. Improved cold-chain logistics and regulatory-compliant online sales further support sustained growth in both developed and developing markets.
Key Trends & Opportunities
Growth of Specialty and Condition-Specific Formulas
Demand rises for specialty formulas addressing lactose intolerance, cow milk protein allergy, reflux, and premature infant nutrition. Healthcare professionals increasingly recommend hydrolyzed, amino acid-based, and anti-reflux formulations, expanding their clinical relevance. This trend creates opportunities for manufacturers to invest in R&D, clinical trials, and differentiated product pipelines. Brands that align formulations with medical nutrition protocols and collaborate closely with pediatric networks gain stronger positioning in high-value, low-volume segments.
- For instance, Yili Group’s Pro-Kido® and Jinlingguan® infant formula lines incorporate advanced nutrients such as DHA, lutein, and prebiotics, including 2’-fucosyllactose (2′-FL). These formulations are developed through extensive clinical research and data collection led by Yili’s National Dairy Technology Innovation Center.
Premiumization and Clean-Label Positioning
Consumers increasingly seek premium infant formulas that emphasize clean-label ingredients, organic sourcing, and minimal processing. Interest grows in non-GMO inputs, reduced sugar profiles, and the exclusion of artificial additives. This trend supports higher-margin products and encourages innovation in ingredient traceability and sustainable sourcing. Companies that communicate quality assurance, ethical sourcing, and environmental responsibility effectively capture loyalty among health-conscious and affluent parents.
- For instance, Reckitt Benckiser Group plc, through its Mead Johnson Nutrition business, formulates Enfamil NeuroPro® using non-GMO milk ingredients, fortifies with DHA at 17 mg per 100 kcal and 2’-fucosyllactose at 0.2 g per liter.
Innovation in Packaging and Convenience Formats
Packaging innovation emerges as a key opportunity, with demand for single-serve sachets, ready-to-feed liquids, and hygienic dispensing systems. These formats improve convenience, portability, and dosing accuracy, particularly for travel and hospital use. Advanced packaging also enhances shelf life and contamination control. Manufacturers leveraging user-centric design and smart packaging features strengthen differentiation and improve overall consumer experience.
Key Challenges
Stringent Regulations and Compliance Complexity
The infant formula market operates under strict regulatory frameworks governing formulation, labeling, marketing, and distribution. Compliance requirements vary widely across regions, increasing operational complexity and time-to-market. Frequent updates to nutritional standards and advertising restrictions demand continuous monitoring and reformulation efforts. Smaller manufacturers face higher compliance costs, while established players must balance innovation speed with rigorous quality and documentation controls to maintain market access.
Intense Competition and Price Sensitivity
High competition among multinational and regional brands exerts pressure on pricing and margins, particularly in mass-market segments. Consumers often compare products closely on price and perceived nutritional parity, limiting differentiation. Private labels and local brands intensify competition in price-sensitive markets. To sustain profitability, companies must invest in brand equity, clinical credibility, and value-added features while managing costs across sourcing, manufacturing, and distribution.
Regional Analysis
North America
North America accounts for an exact 24% market share, driven by high awareness of infant nutrition, strong purchasing power, and advanced healthcare infrastructure. Parents demonstrate a strong preference for premium, organic, and specialty formulas addressing allergies, lactose intolerance, and digestive sensitivities. Pediatric recommendations and hospital-based distribution channels reinforce trust in branded products. E-commerce and subscription-based delivery models continue to gain traction, supporting repeat purchases. Product innovation focuses on clean-label positioning, functional ingredients, and convenient packaging formats, enabling manufacturers to maintain stable demand in a mature but innovation-driven market.
Asia-Pacific
Asia-Pacific dominates the global infant formula market with an exact 41% market share, supported by high birth rates, rapid urbanization, and rising disposable incomes across China, India, Southeast Asia, and parts of Oceania. Growing middle-class populations increasingly prioritize scientifically formulated infant nutrition, particularly in urban centers. Strong penetration of follow-on and growing-up formulas reflects extended usage beyond infancy. Government nutrition programs, expanding organized retail, and rapid growth of e-commerce platforms further strengthen accessibility. Domestic manufacturers and multinational brands continue to invest in localized formulations aligned with regional dietary preferences and regulatory standards.
Europe
Europe holds an exact 21% market share, supported by stringent quality regulations, high safety standards, and strong consumer trust in clinically validated infant nutrition. Countries such as Germany, France, and the UK drive demand for premium and organic formulas, while Southern and Eastern Europe show steady uptake of standard infant and follow-on products. Regulatory oversight shapes formulation consistency and labeling transparency, reinforcing brand credibility. Pharmacy and specialty retail channels remain dominant, complemented by growing online sales. Sustainability, traceability, and ethical sourcing increasingly influence purchasing decisions across the region.
Latin America
Latin America represents an exact 9% market share, supported by improving healthcare access, rising urban populations, and gradual increases in disposable income. Brazil and Mexico lead regional demand, with growing acceptance of infant and follow-on formulas among working parents. While breastfeeding remains culturally significant, lifestyle changes and urban employment patterns drive supplemental formula usage. Distribution expansion through supermarkets and pharmacies improves availability, while digital channels remain in early growth stages. Manufacturers focus on affordable product portfolios and localized pricing strategies to address cost sensitivity and broaden market penetration.
Middle East & Africa
The Middle East & Africa region accounts for an exact 5% market share, reflecting developing healthcare systems and uneven income distribution across countries. Demand concentrates in Gulf Cooperation Council nations and urban African markets, where rising expatriate populations and working mothers support formula adoption. Premium and imported brands perform well in high-income markets, while basic infant formulas dominate price-sensitive regions. Expansion of modern retail infrastructure and government-led maternal health initiatives gradually improve accessibility. Long-term growth depends on improving affordability, regulatory harmonization, and nutrition awareness programs.
Market Segmentations:
By Type:
- Infant Milk
- Follow-on-Milk
By Product:
- First Infant Formula
- Follow-on Formula
By Distribution Channel:
- Hypermarkets/Supermarkets
- Pharmacy/Medical Stores
By Geography
- North America
- Europe
- Germany
- France
- U.K.
- Italy
- Spain
- Rest of Europe
- Asia Pacific
- China
- Japan
- India
- South Korea
- South-east Asia
- Rest of Asia Pacific
- Latin America
- Brazil
- Argentina
- Rest of Latin America
- Middle East & Africa
- GCC Countries
- South Africa
- Rest of the Middle East and Africa
Competitive Landscape
The infant formula market players such as Arla Foods amba, Abbott, Bellamy’s Organic, Royal FrieslandCampina N.V., Perrigo Company plc, Yili Group, Reckitt Benckiser Group plc, Nestlé S.A., Danone SA, and The Kraft Heinz Company. The infant formula market exhibits a competitive landscape defined by strong emphasis on product safety, scientific formulation, and regulatory compliance. Companies compete through continuous investment in nutrition research, clinical validation, and ingredient innovation to differentiate standard and specialty offerings. Premiumization remains a key strategy, with increased focus on clean-label ingredients, organic formulations, and condition-specific nutrition. Firms also strengthen their positions through expanded manufacturing footprints, localized sourcing, and supply chain optimization to ensure consistent quality and availability. Omnichannel distribution, including pharmacies, modern retail, and e-commerce platforms, plays a critical role in market reach. Sustainability initiatives, transparent labeling, and compliance with evolving international standards further shape competition and long-term market positioning.
Shape Your Report to Specific Countries or Regions & Enjoy 30% Off!
Key Player Analysis
- Arla Foods amba
- Abbott
- Bellamy’s Organic
- Royal FrieslandCampina N.V.
- Perrigo Company plc
- Yili Group
- Reckitt Benckiser Group plc
- Nestlé S.A.
- Danone SA
- The Kraft Heinz Company
Recent Developments
- In April 2025, Bobbie launched its Bobbie Organic Whole Milk Infant Formula, the first USDA Organic whole milk formula made in the U.S., following three years of development, offering a breast milk-like recipe with premium milk fat, MFGM, DHA, and no palm or soy oil, focusing on brain/gut health and easy digestion, and quickly earning accolades for quality and innovation in organic infant nutrition.
- In February 2025, Iceland, in partnership with the charity Feed, launched new shelf labels for infant formula, clarifying that all first infant formulas are nutritionally equivalent, regardless of brand or price, as part of their campaign to combat rising costs and misinformation, helping parents make informed choices and highlighting the financial pressure on families.
- In January 2025, the U.S. FDA announced its Long-Term National Strategy to Increase the Resiliency of the U.S. Infant Formula Market to build on lessons from the shortage by focusing on supply chain transparency, better information sharing, preventing contamination, and encouraging more manufacturers to enter the U.S. market, ensuring a safe, consistent supply for vulnerable infants.
Report Coverage
The research report offers an in-depth analysis based on Type, Product, Distribution Channel, and Geography. It details leading market players, providing an overview of their business, product offerings, investments, revenue streams, and key applications. Additionally, the report includes insights into the competitive environment, SWOT analysis, current market trends, as well as the primary drivers and constraints. Furthermore, it discusses various factors that have driven market expansion in recent years. The report also explores market dynamics, regulatory scenarios, and technological advancements that are shaping the industry. It assesses the impact of external factors and global economic changes on market growth. Lastly, it provides strategic recommendations for new entrants and established companies to navigate the complexities of the market.
Future Outlook
- Demand for infant formula will rise steadily with increasing urbanization and higher participation of women in the workforce.
- Specialty and condition-specific formulas will gain wider adoption due to growing diagnosis of infant allergies and digestive sensitivities.
- Clean-label, organic, and minimally processed formulations will attract stronger preference among health-conscious parents.
- Scientific validation and clinical nutrition research will play a larger role in product differentiation and brand trust.
- E-commerce and direct-to-consumer channels will expand, improving accessibility and repeat purchase behavior.
- Packaging innovation will focus on convenience, hygiene, and portion control to support modern lifestyles.
- Emerging economies will contribute significantly to volume growth due to rising birth rates and improving healthcare access.
- Regulatory scrutiny will intensify, driving higher standards in formulation, labeling, and quality assurance.
- Sustainability practices in sourcing, manufacturing, and packaging will influence long-term competitive positioning.
- Strategic partnerships and localized production will strengthen supply resilience and regional market penetration.


