
Mental health and diabetes needs push care onto software
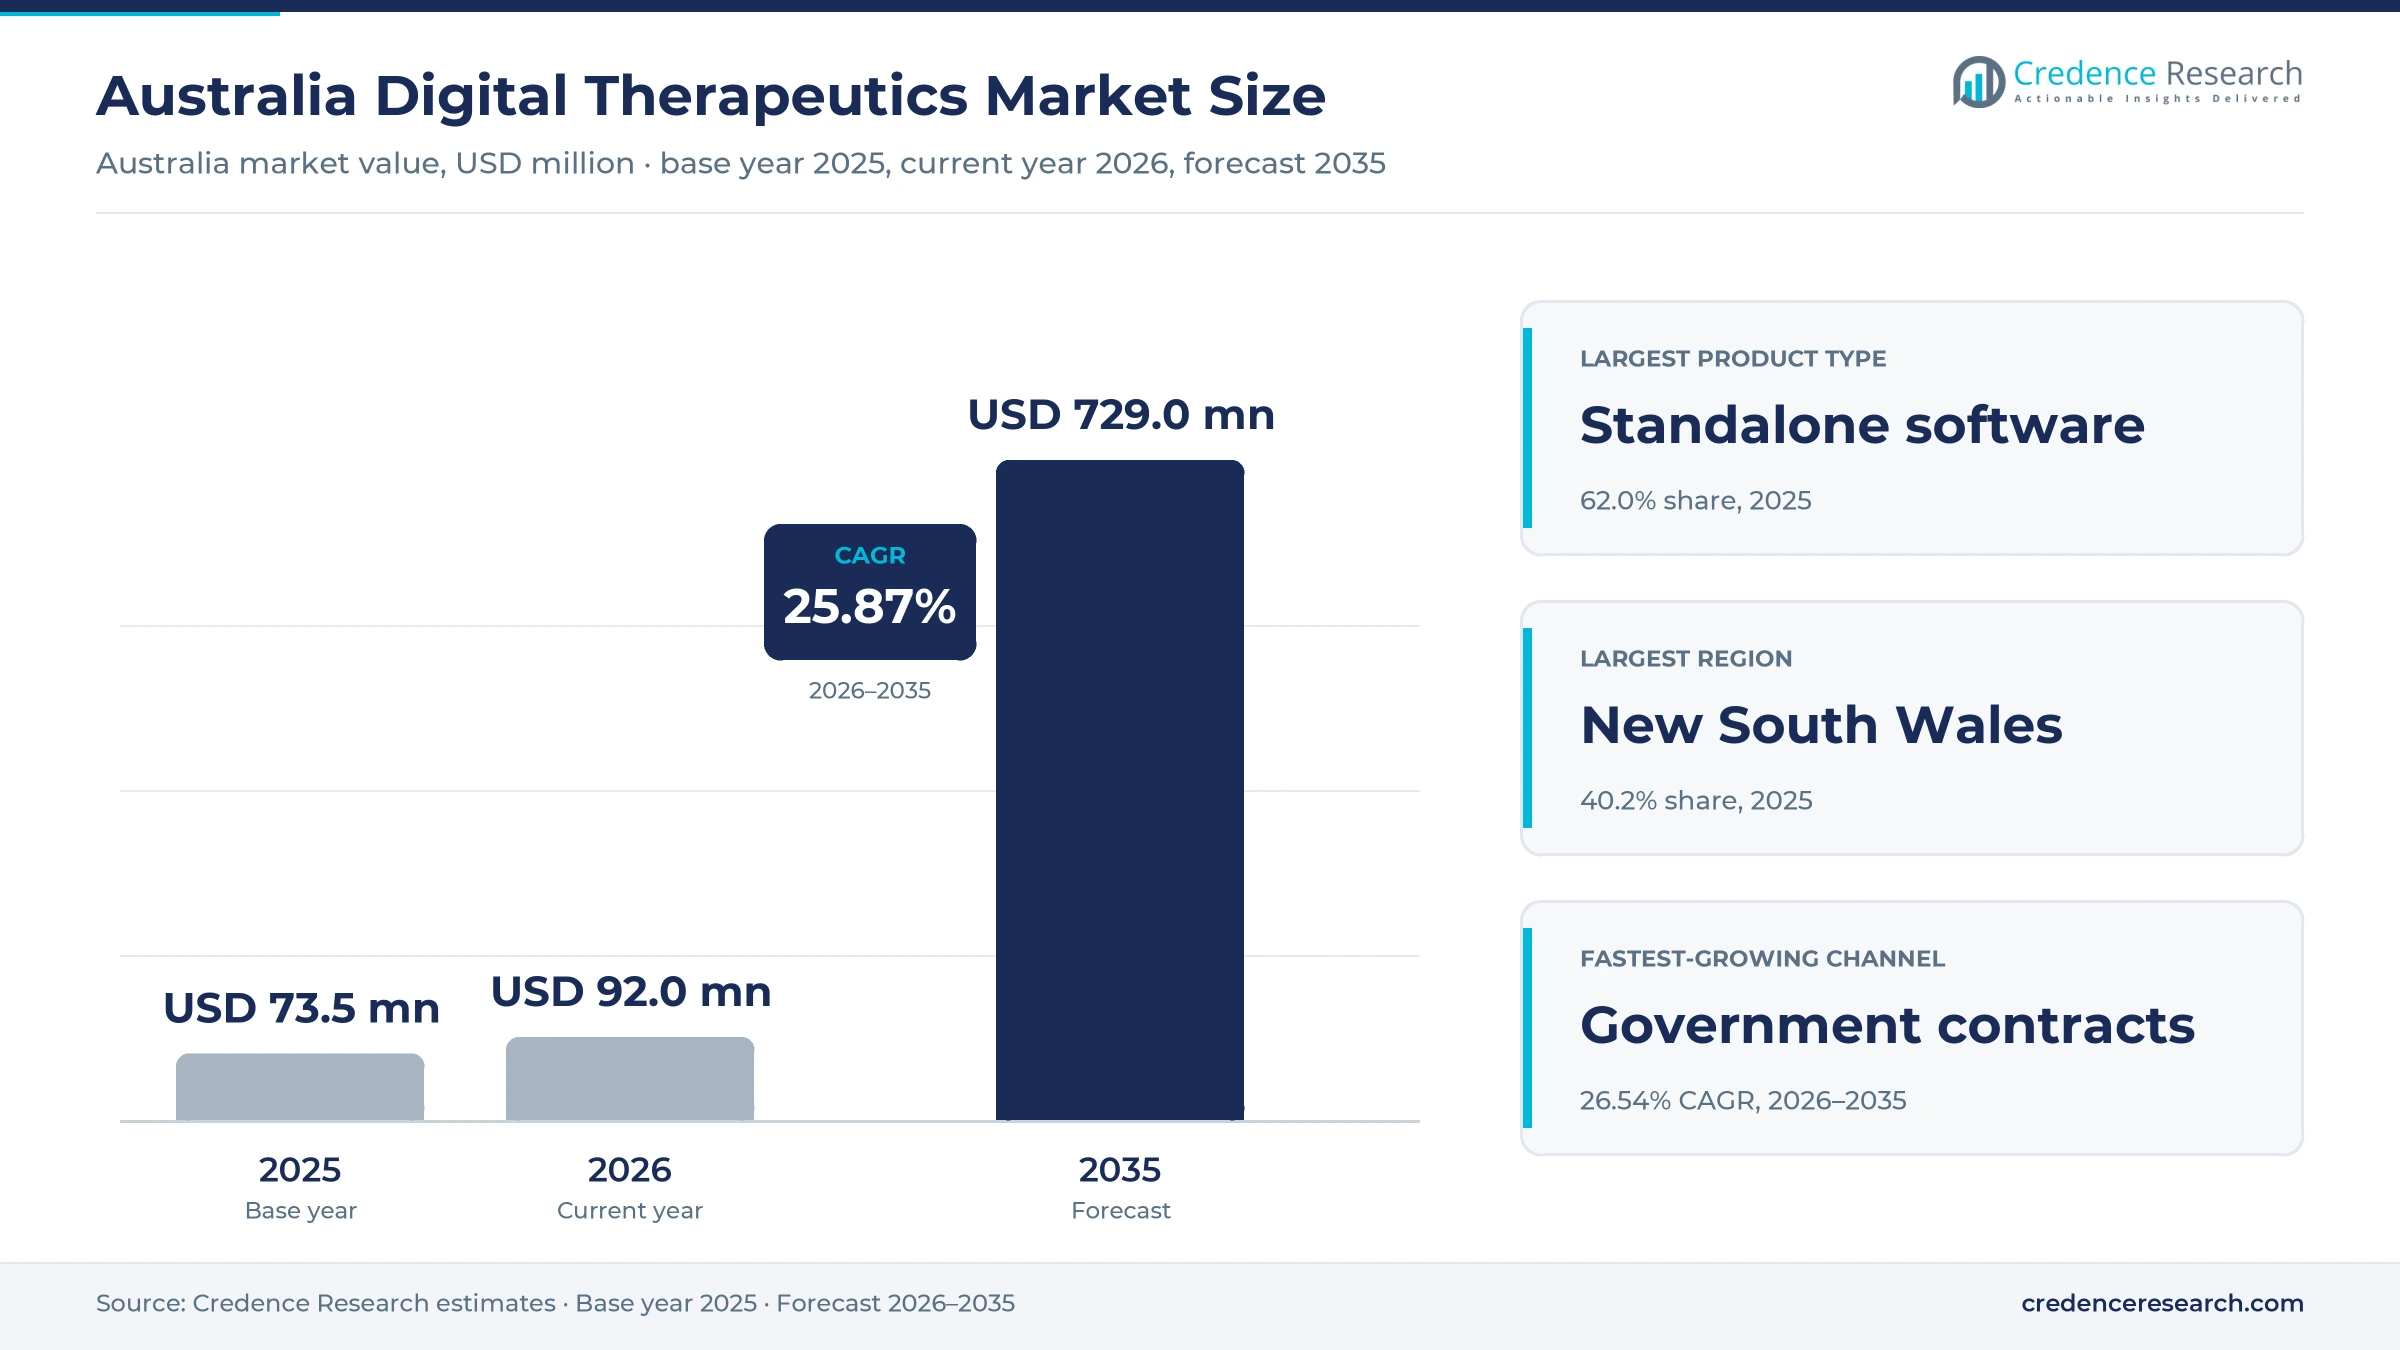
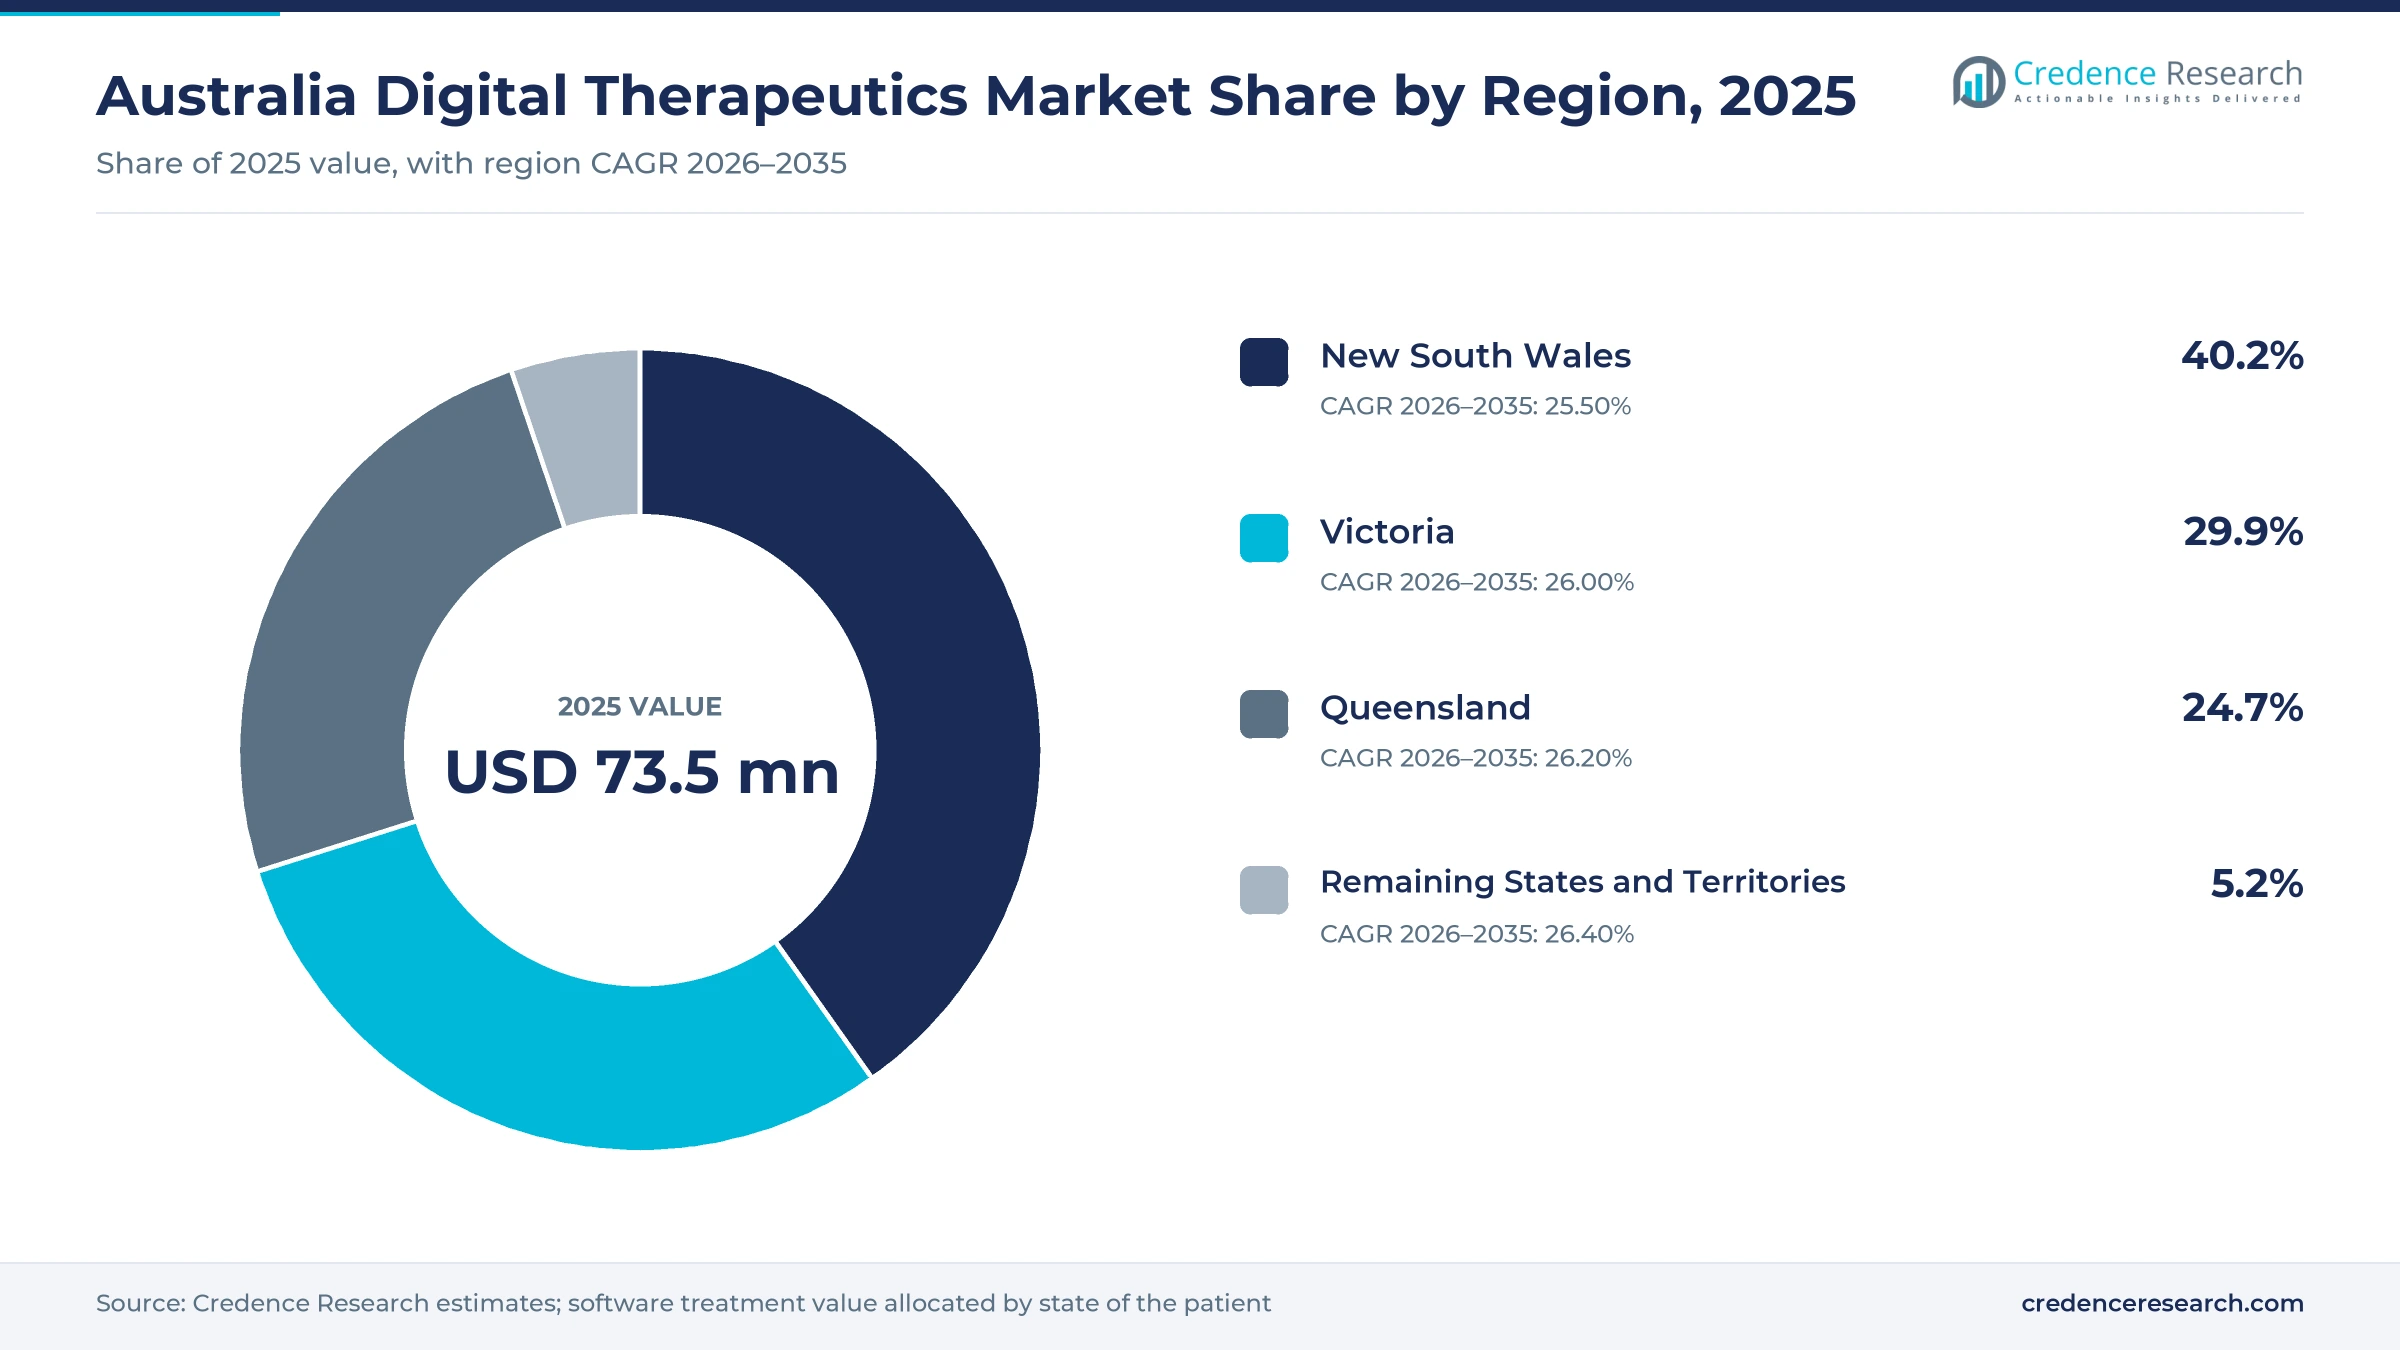
The Australia digital therapeutics market was valued at USD 73.5 million in 2025 and is projected to increase from USD 92.0 million in 2026 to USD 729.0 million by 2035, registering a CAGR of 25.87% during 2026–2035. Demand comes from people with anxiety, depression, diabetes, sleep disorders and alcohol problems who want treatment between clinic visits, employers and insurers that fund programs for staff and members, and government services that use software to widen access. New South Wales held the largest regional share, 40.2% in 2025, because Sydney concentrates health insurers, employer buyers and digital health developers. The remaining states and territories form the fastest-growing region at 26.40% a year, as remote patients rely more on care delivered by phone and app. In turn, a free national digital mental health service began on Jan. 1, 2026, which brings low-intensity software-based therapy into the public system.
Which software-based treatments does the estimate cover?
The estimate measures the value of evidence-based software programs that treat, manage or prevent a medical condition for patients in Australia. It covers standalone apps and web programs, software paired with devices such as sleep therapy machines or glucose sensors and software linked to a medicine. Values include fees paid by employers, health insurers, government services and consumers who subscribe directly.
The estimate excludes general wellness apps without a clinical purpose, telehealth consultations that use only video, electronic health records and the hardware value of connected devices. The value chain runs from developers and clinical researchers through regulators, insurers, employers, public health services and clinicians to patients who use the programs at home, in clinics and in hospitals.
Australia Digital Therapeutics Market Insights
- The Australia digital therapeutics market was valued at USD 73.5 million in 2025 and is projected to reach USD 729.0 million by 2035, registering a CAGR of 25.87% during 2026–2035.
- New South Wales held a 40.2% share of 2025 value, because Sydney concentrates health insurers, large employers and digital health developers.
- Standalone therapeutic software led with a 62.0% share of 2025 value, because most mental health and lifestyle programs run on phones without extra devices.
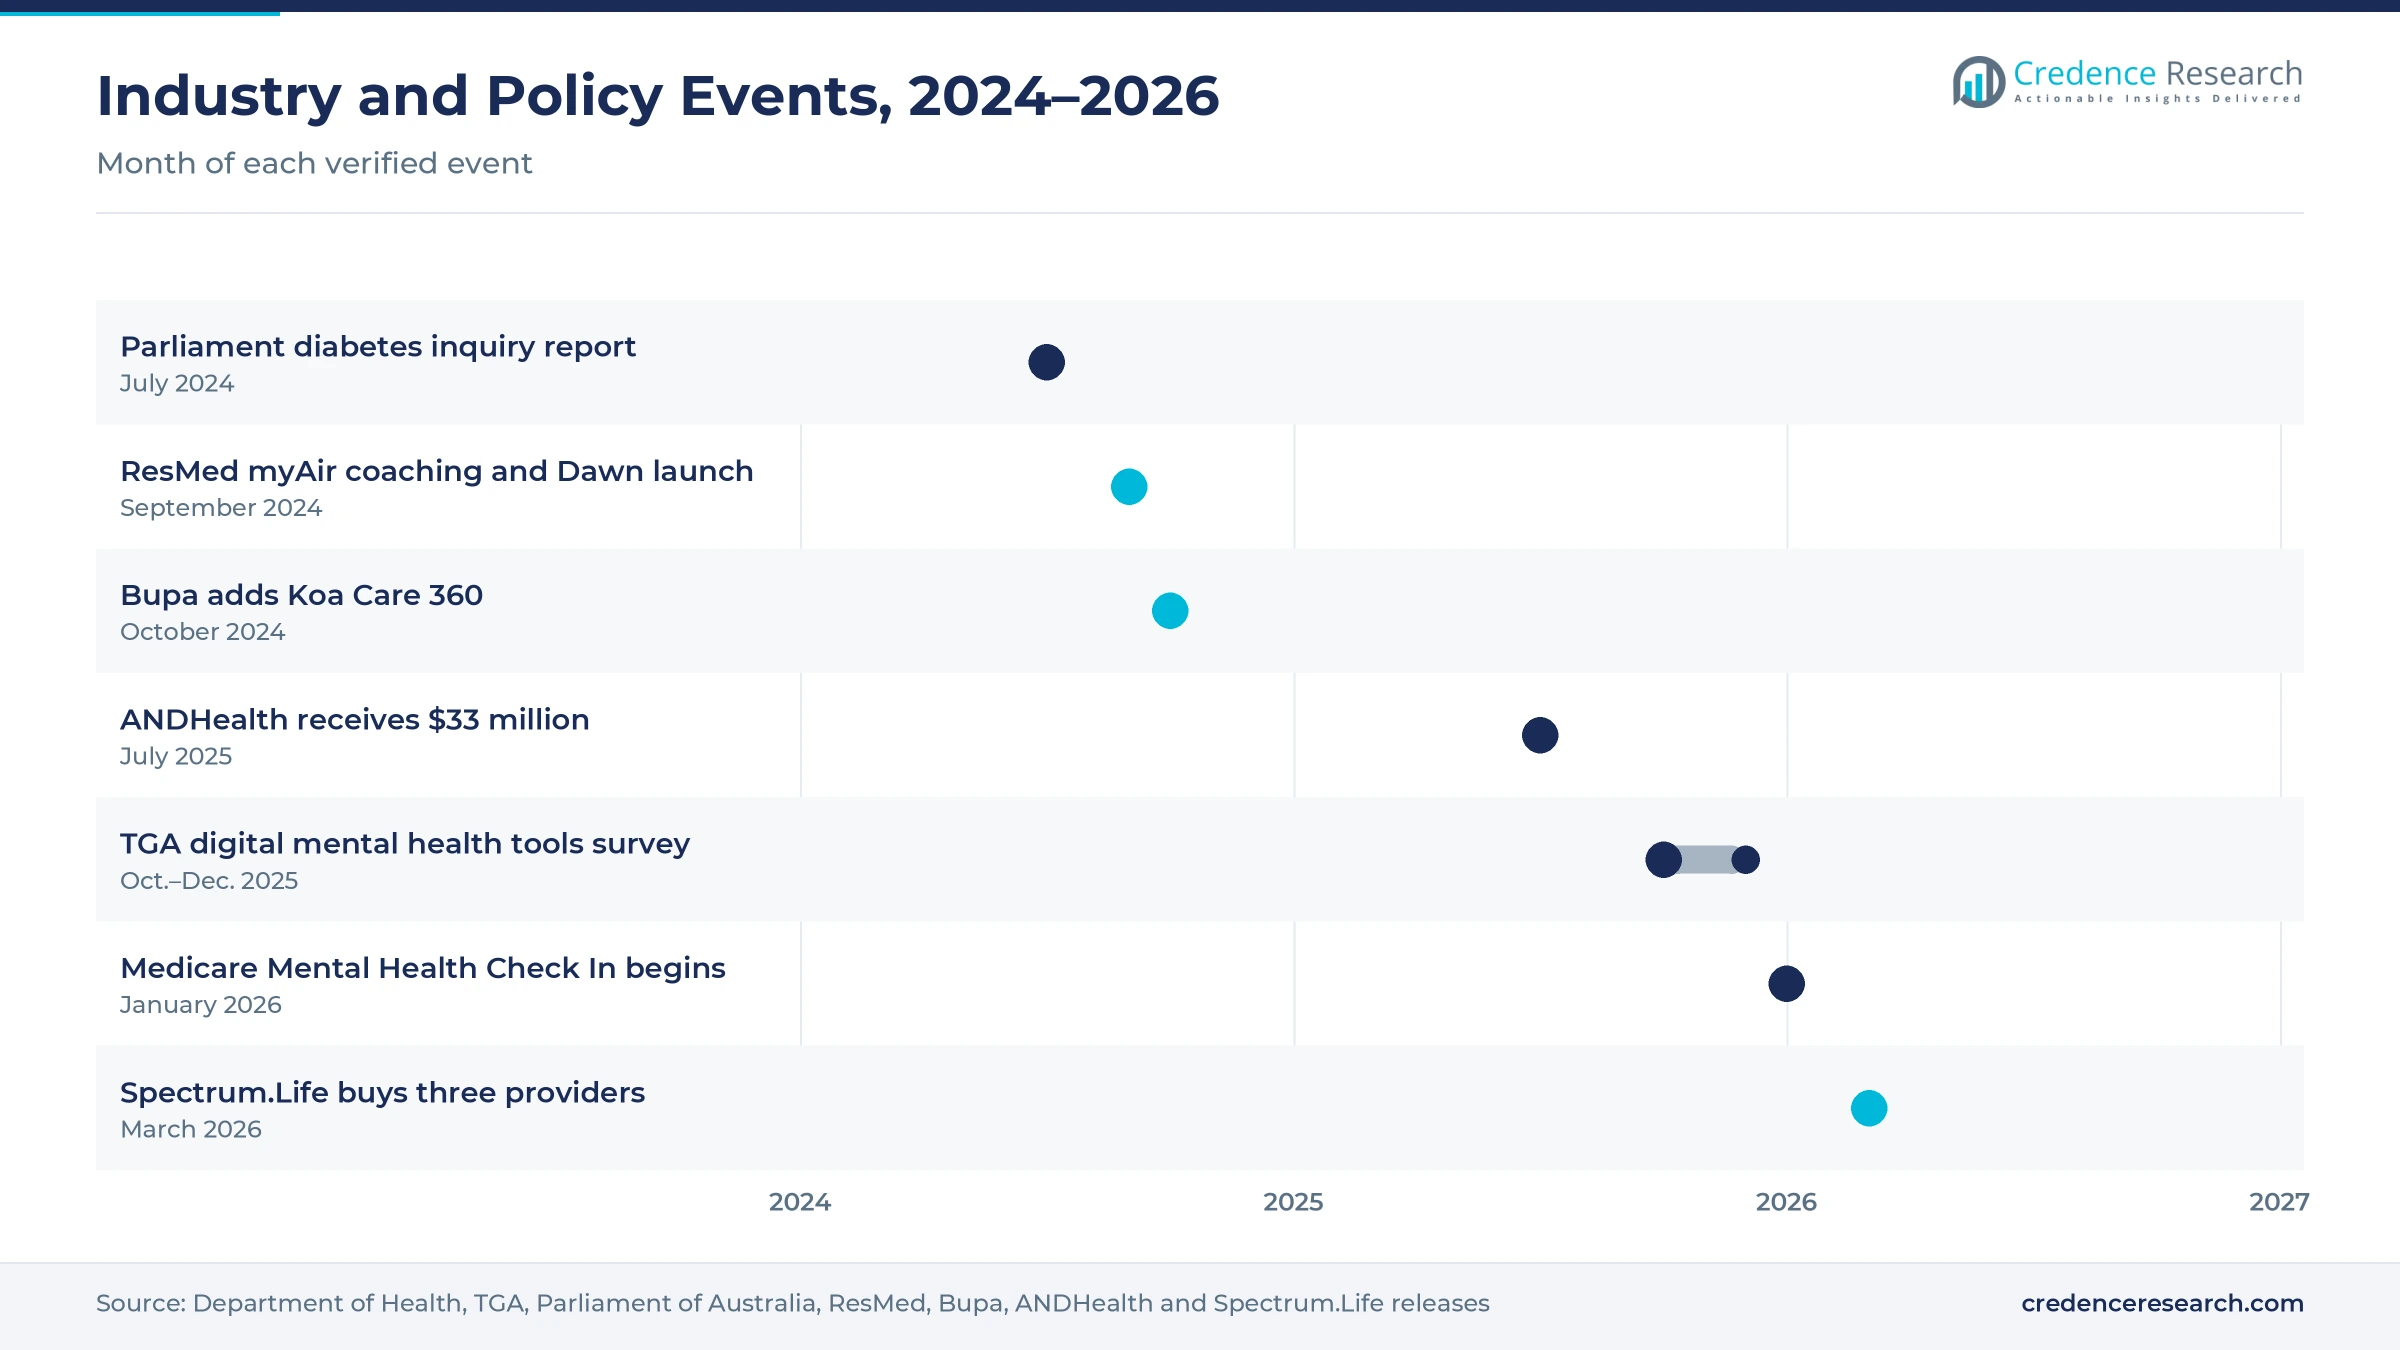
- The Australian Government committed $588.5 million over eight years from 2024-25 for Medicare Mental Health Check In, a free digital service that began on Jan. 1, 2026.
- ANDHealth received $33 million from the Medical Research Future Fund in July 2025 to support digital health companies, including developers of digital therapeutics.
Standalone software leads while medicine-linked tools rise
Why does standalone software lead product demand?
Based on product type, the market is categorized into standalone therapeutic software, device-linked therapeutic software and medicine-linked therapeutic software. Standalone Therapeutic Software led with a 62.0% share of 2025 value, because most mental health, sleep and lifestyle programs run on phones without extra hardware. Medicine-Linked Therapeutic Software grows fastest at 27.07% a year, as drug makers add companion programs that help patients take treatment correctly.
Which conditions account for most software treatment value?
Based on disease area, the market is categorized into mental health and behavioural health, diabetes and weight management, sleep and respiratory health, substance use disorders and cardiovascular and additional conditions. Mental Health and Behavioural Health led with a 38.0% share of 2025 value, because anxiety and depression are common and suit app-based therapy. Diabetes and Weight Management grows fastest at 26.47% a year, as glucose sensors and coaching apps spread.
Why is home-based care the main setting for software treatment?
Based on care setting, the market is categorized into home-based care, outpatient care and hospital-based care. Home-Based Care led with a 64.0% share of 2025 value, because patients use most programs on their own phones between clinic visits. Home-Based Care grows fastest at 26.16% a year, as free public services and insurer programs reach patients without a referral or a clinic appointment.
How do payers split spending on software treatment?
Based on channel, the market is categorized into employer and insurer contracts, direct consumer subscriptions and government service contracts. Employer and Insurer Contracts led with a 42.0% share of 2025 value, because health insurers and employers buy programs for large member and staff groups. Government Service Contracts grow fastest at 26.54% a year, as the federal government funds free digital mental health and alcohol programs.
| Segment Group | Leading Sub-segment | Share, 2025 | Fastest-growing Sub-segment | CAGR, 2026–2035 |
|---|---|---|---|---|
| By Product Type | Standalone Therapeutic Software | 62.0% | Medicine-Linked Therapeutic Software | 27.07% |
| By Disease Area | Mental Health and Behavioural Health | 38.0% | Diabetes and Weight Management | 26.47% |
| By Care Setting | Home-Based Care | 64.0% | Home-Based Care | 26.16% |
| By Channel | Employer and Insurer Contracts | 42.0% | Government Service Contracts | 26.54% |
Request a Free Sample
Fill in your details and we'll send you a free sample report.
- Sample data tables & charts
- Research methodology
Chronic illness, referrals and funding lift software care
How does chronic-condition demand lift software treatment?
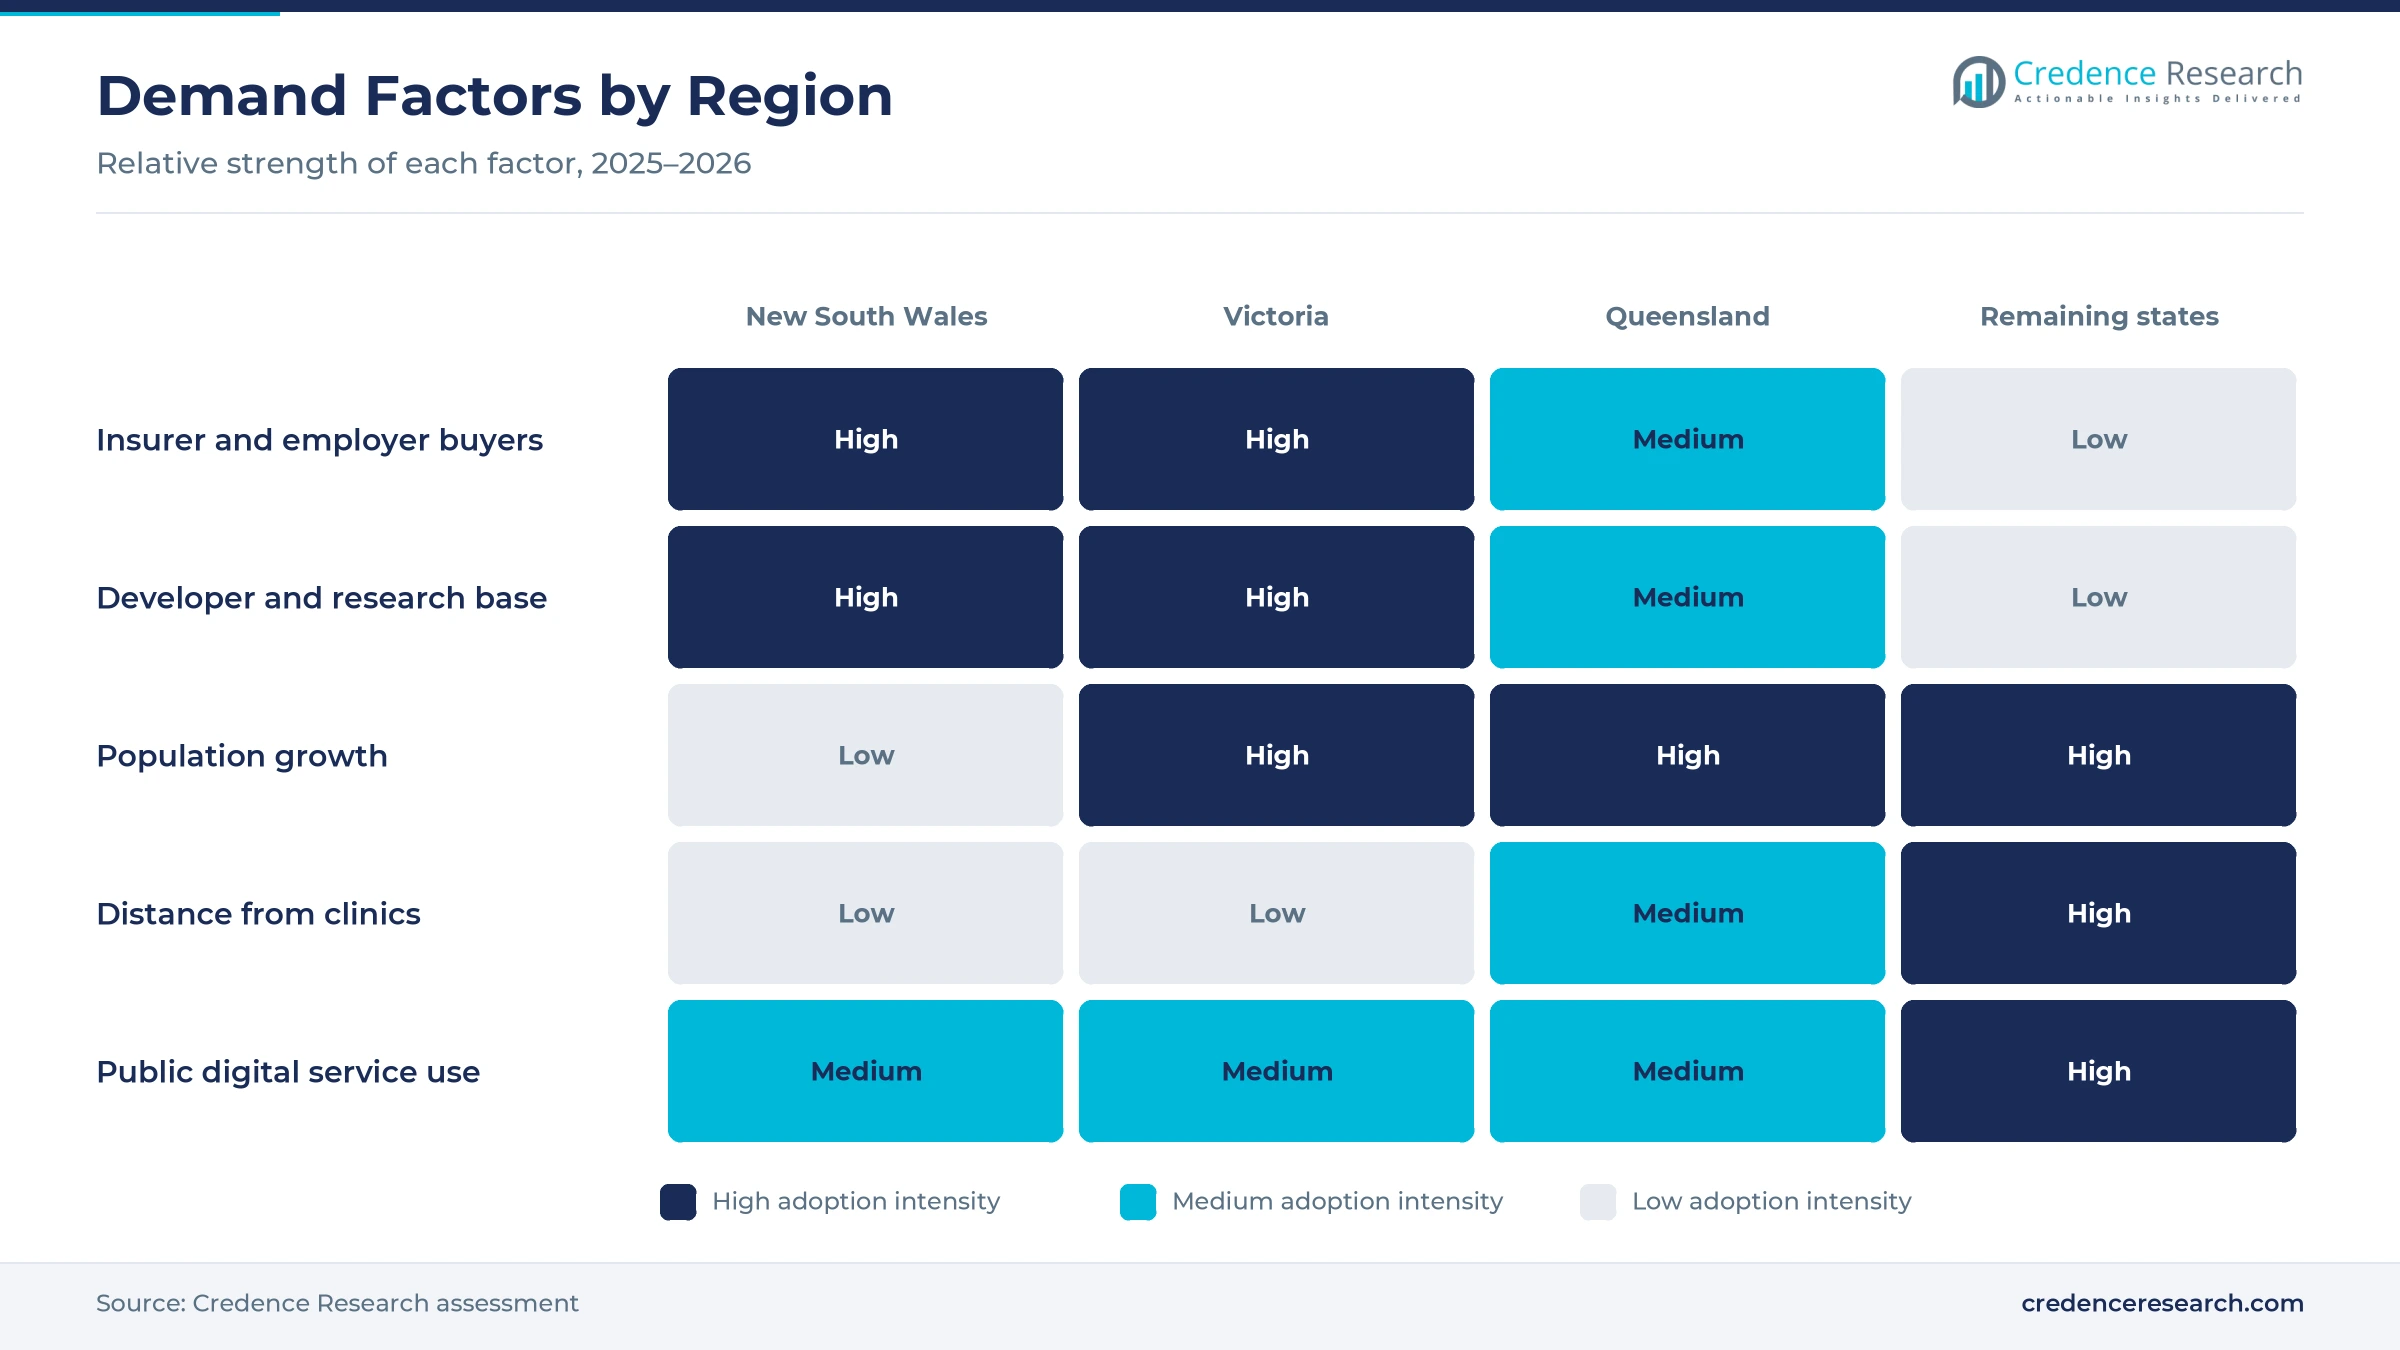
Chronic-condition demand lifts software treatment, because many patients need ongoing support that clinic visits alone cannot provide. About 42.9% of people aged 16-85 had experienced a mental disorder at some time in their life, and 21.5% had a 12-month disorder, according to the Australian Bureau of Statistics. Anxiety was the most common group at 17.2%, while 38.8% of people aged 16-24 had a 12-month disorder. Diabetes also affected 7.4% of adults aged 20-79 in 2024, according to World Bank data. As a result, mental health and behavioural health programs hold a 38.0% share of 2025 value, the largest disease share.
Why do enterprise distribution and referrals widen access?
Enterprise distribution and clinical referrals widen access, because employers, insurers and clinicians can place programs in front of large groups at low cost. Bupa Australia added the Koa Care 360 mental health platform to its corporate health insurance policies in October 2024, with support in eight languages. HCF promotes the Daybreak alcohol program from Hello Sunday Morning, which is fully subsidized by the federal health department. In addition, Spectrum.Life bought three Australian workplace mental health providers in March 2026 and plans 100 new jobs. In turn, employer and insurer contracts hold a 42.0% share of 2025 value, the largest channel share.
How does commercialization capacity support new developers?
Commercialization capacity supports new developers, because clinical trials, regulatory work and payer deals cost more than most startups can fund alone. ANDHealth received $33 million from the Medical Research Future Fund in July 2025, with a focus on remote monitoring, digital therapeutics and patient engagement tools. The program supports clinical trials, regulatory pathways, business models, reimbursement strategies and capital raising for companies that address unmet clinical needs. Melbourne-based Mindset Health, founded in 2019, reports helping more than 350,000 people across four therapeutic areas. As a result, medicine-linked therapeutic software grows at 27.07% a year, the fastest product rate, as local developers mature.
Why does public funding for digital care raise uptake?
Public funding for digital care raises uptake, because free services remove the price barrier for patients with mild symptoms. The Australian Government committed $588.5 million over eight years from 2024-25, plus $113.4 million a year ongoing, for Medicare Mental Health Check In, according to the health minister. St Vincent's Health Australia delivers the service, which began on Jan. 1, 2026, and is expected to help more than 150,000 people a year by 2029. The service is open to anyone over 16 without a referral or a diagnosis, which lowers the barrier for first-time patients. In turn, government service contracts grow at 26.54% a year, the fastest channel rate.
Public services, insurers and new rules reshape supply
How is the shift to low-intensity digital therapy changing care?
The shift to low-intensity digital therapy is changing care, because public services now offer guided programs before patients reach a psychologist. Medicare Mental Health Check In uses low-intensity cognitive behavioral therapy, with guided support by trained professionals by phone or video from March 30, 2026, and self-paced online tools from May 30, 2026. The service was designed with input from more than 90 mental health organizations. Lifeline also lists MoodMission, an app based on cognitive behavioral therapy, in its support toolkit. As a result, home-based care grows at 26.16% a year, the fastest setting rate, as more mental health software reaches patients directly.
Why is the rise of tighter software regulation notable?
The rise of tighter software regulation is notable, because clear rules help developers decide when a program needs medical device approval. The Therapeutic Goods Administration surveyed digital mental health tools from Oct. 7 to Dec. 1, 2025, as part of a review of rules for software-based medical devices. Guidance published in February 2026 describes digital therapeutics as software that delivers medical interventions and treats them as regulated devices, while general wellness apps are likely to fall outside the rules. Software medical devices are also one of 12 compliance and enforcement priorities for 2026-27. In turn, developers with trial evidence gain an edge as AI tools in mental health care face closer review.
Can diabetes and weight programs open a new growth path?
Diabetes and weight programs offer a growth path, because many patients need daily support with diet, activity and glucose control. About 1.5 million Australians, or about 5% of the population, are known to live with a form of diabetes, according to a parliamentary committee report tabled on July 4, 2024. The committee made 23 recommendations to strengthen the national response to diabetes and obesity and to reduce the burden of chronic disease on the health care system. Insurers and employers already fund coaching programs for members with chronic conditions. As a result, diabetes and weight management grows at 26.47% a year, the fastest disease rate, as diabetes management apps add coaching.
Is there room to grow sleep and device-linked programs?
Sleep and device-linked programs have room to grow, because connected therapy machines already collect nightly data that software can turn into coaching. ResMed added smartwatch access, sleep staging and personalized coaching to its myAir app on Sept. 30, 2024, and it launched Dawn, a generative AI sleep health assistant. ResMed also sells its travel range through its Australian online shop, which keeps it close to local CPAP patients. Mindset Health published a randomized trial comparing its gut-directed hypnotherapy program with an active control for irritable bowel syndrome in February 2025. In turn, device-linked therapeutic software gains ground as sleep apnea devices link to coaching apps.
Evidence, engagement and payment gaps slow software care
Why does limited clinical evidence slow adoption?
Limited clinical evidence slows adoption, because doctors and insurers want trial results before they recommend or fund a program. Many apps in app stores have never been tested in a controlled study with Australian patients. As a result, buyers struggle to tell clinical programs apart from general wellness apps. Developers respond with randomized trials, published outcome data and partnerships with universities and hospitals that can run studies.
How does low engagement reduce treatment results?
Low engagement reduces treatment results, because many patients stop using an app after the first few weeks of a program. Lower use then weakens the clinical benefit that payers expect to see in outcome reports. In turn, employers and insurers question renewals when active use falls. Developers respond with coaching calls, reminders, clinician dashboards and stepped-care pathways that move patients to more support when needed.
Why do payment gaps limit scale?
Payment gaps limit scale, because Medicare does not pay for most therapeutic apps the way it pays for medicines or consultations. Developers therefore rely on employer, insurer and government contracts that can end after short pilots. However, free public services can also reduce demand for paid consumer subscriptions. Developers respond by selling to large payers, joining public service tenders and linking programs to medicines and devices.
How do privacy and data rules raise costs?
Privacy and data rules raise costs, because therapeutic apps handle sensitive mental health and medical information every day. Developers must protect data, explain how it is used and meet rules for software medical devices. As a result, smaller developers spend more on security, legal advice and regulatory work before launch. Developers respond with local data hosting, security certification and shared regulatory support from commercialization programs.
New South Wales leads while smaller states grow fastest
| Region | Value, 2025 (USD million) | Share, 2025 | CAGR, 2026–2035 |
|---|---|---|---|
| New South Wales | 29.5 | 40.2% | 25.50% |
| Victoria | 22.0 | 29.9% | 26.00% |
| Queensland | 18.2 | 24.7% | 26.20% |
| Remaining States and Territories | 3.8 | 5.2% | 26.40% |
Why does new South Wales hold the largest share?
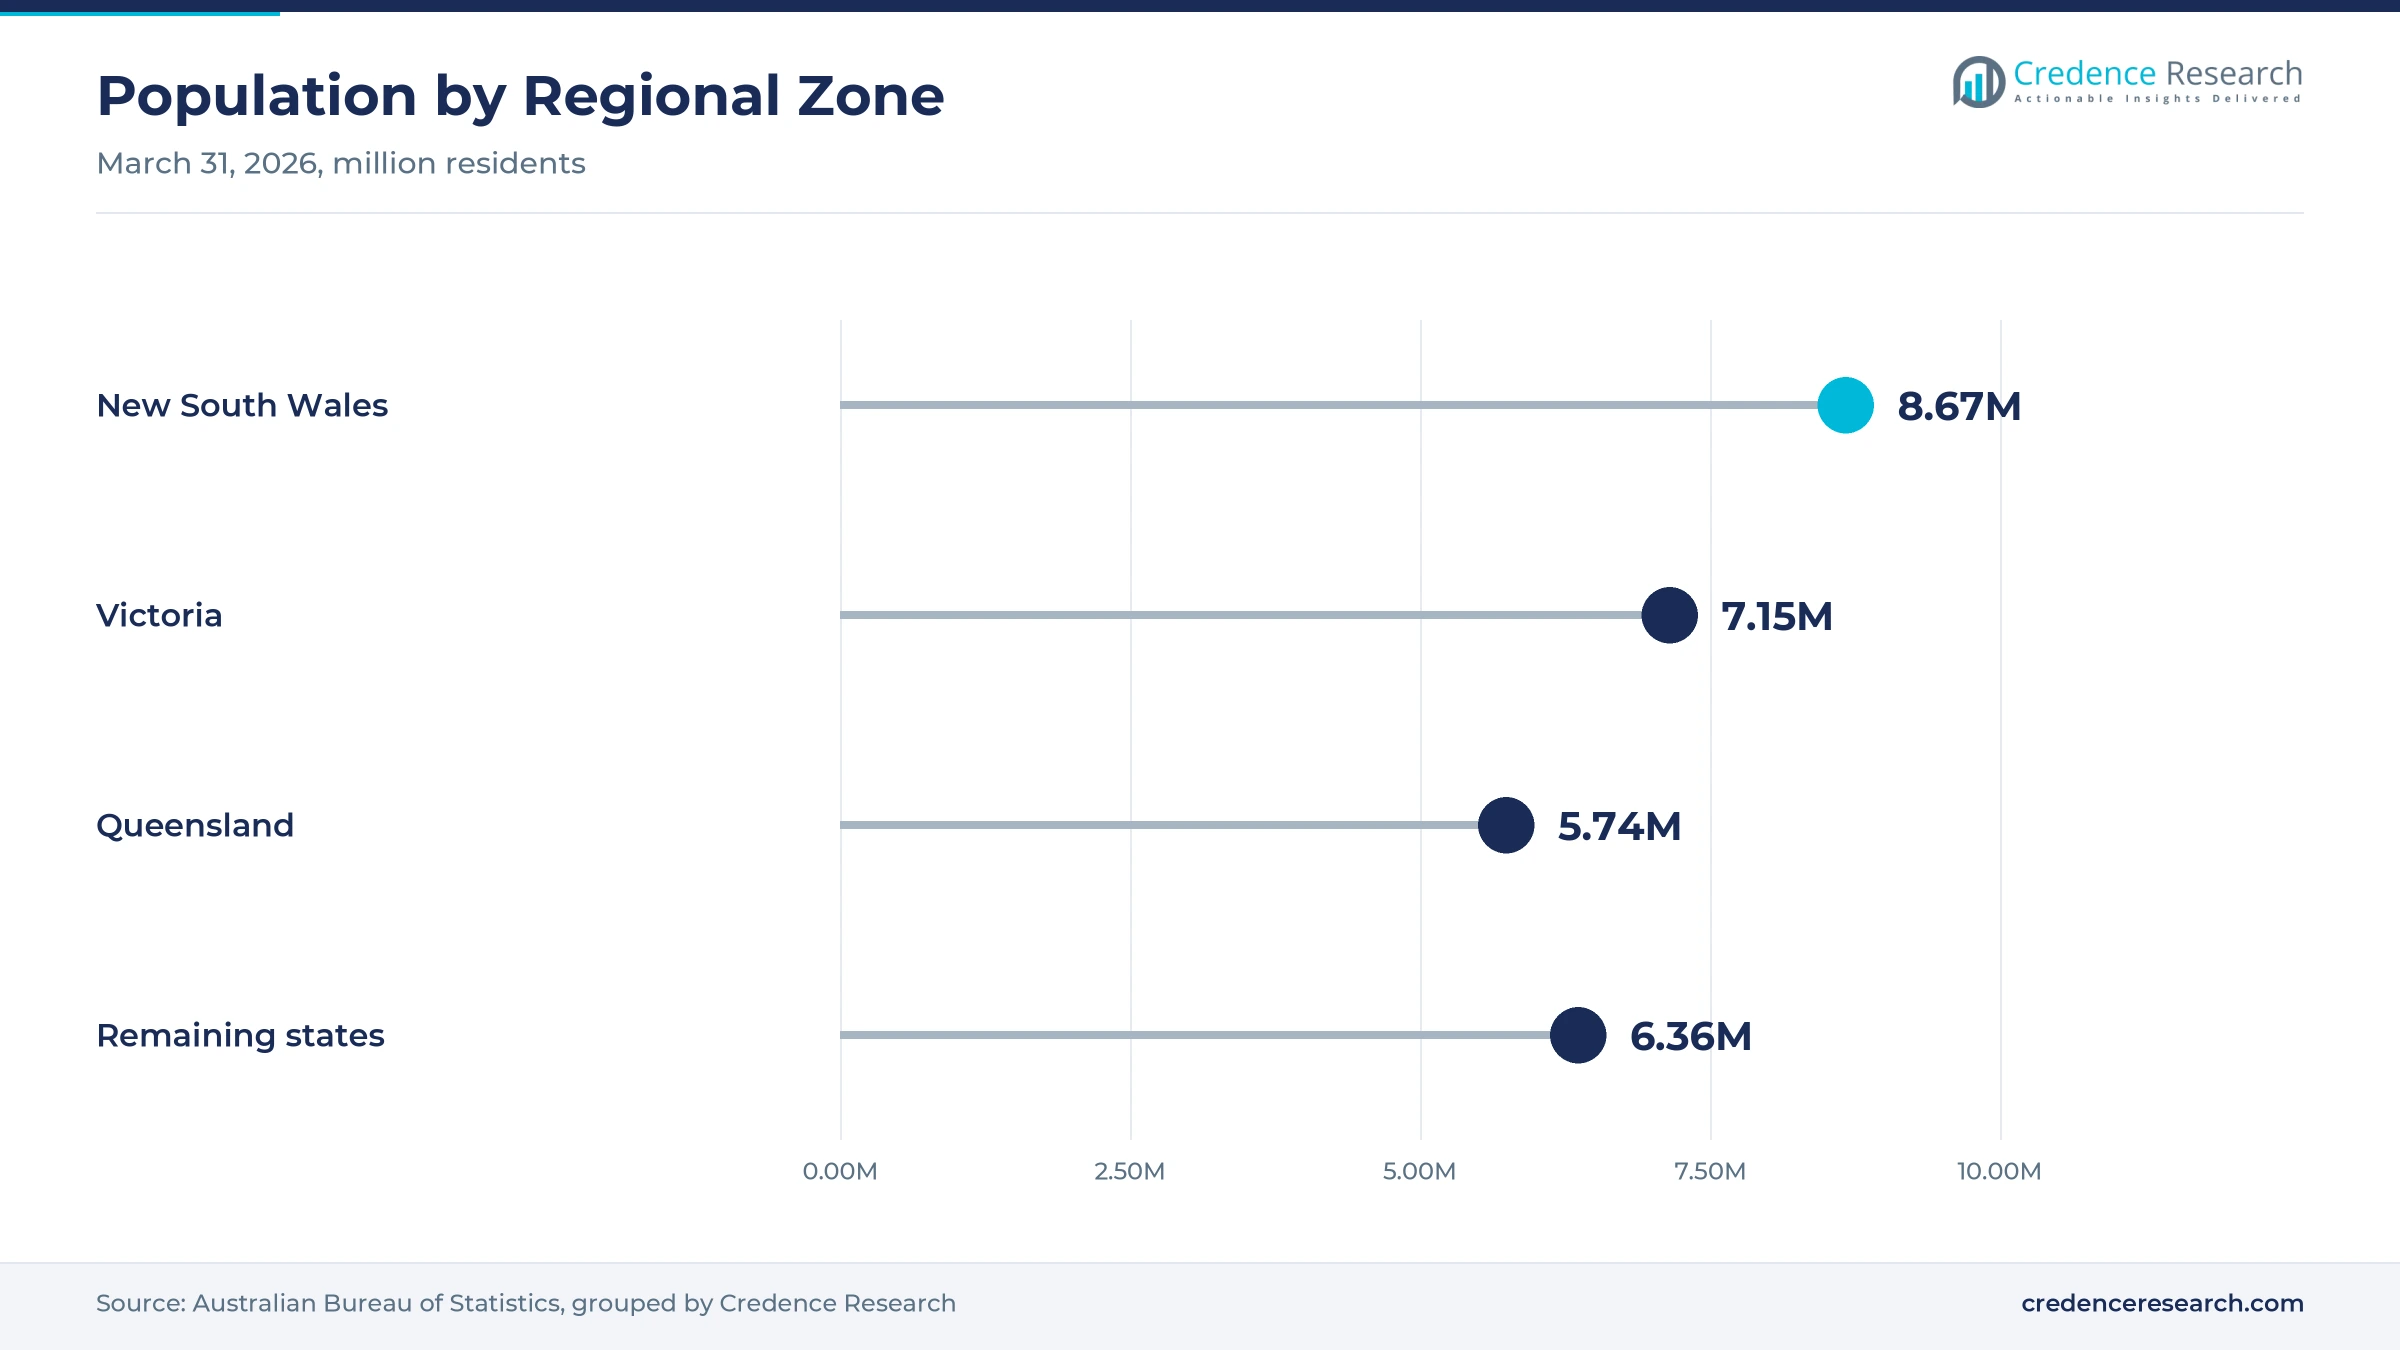
New South Wales held a 40.2% share of 2025 value and grows at 25.50% a year, because Sydney concentrates health insurers, large employers and digital health developers. The state had about 8.67 million residents at March 31, 2026, the largest population of any state. ResMed, a sleep therapy device and software company, also runs its Australian online shop for connected therapy customers. However, growth is slower than in other zones because the state population grew only 1.1% over the year.
How does Victoria support software treatment demand?
Victoria held a 29.9% share of 2025 value and grows at 26.00% a year, because Melbourne hosts several digital health developers and research groups. The state had about 7.15 million residents at March 31, 2026, after adding about 109,500 people in a year. Melbourne-based Mindset Health and the ANDHealth commercialization program both add local development capacity. In turn, Victorian employers and insurers have close access to new mental health and lifestyle programs.
Why does Queensland grow faster than the larger states?
Queensland held a 24.7% share of 2025 value and grows at 26.20% a year, because steady migration from other states keeps adding working families who use employer and insurer programs. The state had about 5.74 million residents at March 31, 2026, after adding about 90,100 people in a year. As a result, demand for app-based mental health, diabetes and sleep programs rises in growing southeast Queensland suburbs and regional cities.
What drives demand in the remaining states and territories?
The remaining states and territories held a 5.2% share of 2025 value and grow fastest at 26.40% a year, because patients in remote areas rely more on care delivered by phone and app. The free national mental health service, open without a referral, also reaches patients who live far from clinics.
Launches, deals and regulatory reviews from 2024 to 2026
| Development | Status and market relevance |
|---|---|
| In September 2024, ResMed added smartwatch access, sleep staging and coaching to its myAir app. | Also launched the Dawn generative AI sleep assistant |
| In October 2024, Bupa Australia added the Koa Care 360 platform to corporate health policies. | Mental health support offered in eight languages |
| In July 2025, ANDHealth received $33 million from the Medical Research Future Fund. | Supports digital therapeutics and remote monitoring developers |
| In October 2025, the Therapeutic Goods Administration opened a survey of digital mental health tools. | Part of a review of software medical device rules |
| In January 2026, Medicare Mental Health Check In began with St Vincent's Health Australia. | Expected to help more than 150,000 people a year by 2029 |
Coaching, sensors and AI tools reshape software treatment
- Guided cognitive behavioral programs combine online lessons with phone or video coaching, which lets services treat mild symptoms at scale.
- Connected device apps turn data from sleep therapy machines and glucose sensors into daily coaching, which helps patients stay on treatment.
- Generative AI assistants answer patient questions at any hour, which reduces support costs and keeps patients engaged.
- Stepped-care triage tools score symptoms and move patients to more intensive care when needed, which helps payers manage risk.
Need a Custom Version of This Report?
Tailor the scope, geography, or segments to your exact requirements.
- Custom geography or segment scope
- Direct access to our analyst team
Developers compete on clinical evidence and payer reach
Competition is led by sleep device makers with connected apps, local mental health developers, not-for-profit program providers and global consumer health platforms. ResMed added coaching and an AI sleep assistant to its myAir app in September 2024. Melbourne-based Mindset Health reports helping more than 350,000 people with hypnotherapy programs. Smiling Mind offers a free app accessed by more than 9 million people worldwide, while Hello Sunday Morning runs the subsidized Daybreak alcohol program. Uprise offers a workplace mental fitness program with phone coaching, and MoodMission offers an app based on cognitive behavioral therapy. Headspace, Noom, SilverCloud Health and DarioHealth also compete for employer and consumer demand. Rivals compete on trial evidence, engagement, payer contracts and links to clinicians.
Companies profiled and their roles in this market
| Company | Type | Role in the market |
|---|---|---|
| ResMed | Device and software company | Added coaching and the Dawn assistant to myAir in September 2024 |
| Mindset Health | Therapeutic app developer | Reports helping more than 350,000 people across four areas |
| Smiling Mind | Not-for-profit app provider | Free app accessed by more than 9 million people |
| Hello Sunday Morning | Not-for-profit program provider | Runs the federally subsidized Daybreak alcohol app |
| Uprise | Workplace mental health provider | Offers a digital program with phone coaching |
| MoodMission | Mental health app developer | App based on cognitive behavioral therapy |
Credence Research view on Australian software treatment
Credence Research's view is that Australian software treatment will grow quickly from a small base because public services, insurers and employers are moving mild and chronic care onto phones. Mental health programs remain the core of the market, while diabetes, sleep and medicine-linked programs gain share. Public funding and clearer device rules support growth, although weak evidence, low engagement and payment gaps still slow wider use. Developers with trial results, payer contracts and links to clinicians should gain share fastest.
How the Australian software treatment estimate was built
The report uses 2025 as the base year on a calendar basis, and market values come from the Credence Research model. That model combines official mental health and population statistics, World Bank diabetes data, government funding announcements, regulator releases and company announcements on launches, partnerships and acquisitions. Segment splits and regional growth rates are Credence Research estimates, while regional shares follow the client-defined split. Sources used are public reports, official statistics, trade press, government releases and company releases, and no interviews or surveys were used.
Public funding and payer contracts carry growth to 2035
Software treatment value is expected to reach USD 729.0 million by 2035, a 25.87% CAGR during 2026–2035, as chronic-condition demand, payer contracts and public funding keep uptake rising. Growth should be fastest while the national digital mental health service expands through 2029. After that, diabetes, sleep and medicine-linked programs will carry more growth as device and drug makers add software. A Medicare payment pathway would lift uptake sharply, while weak trial results would slow payer contracts. Developers with strong evidence are expected to gain the most.
Frequently Asked Questions
How big is the Australia digital therapeutics market?
Which product type leads Australian software treatment value?
Which region leads the Australia digital therapeutics market?
How common are mental disorders in Australia?
What is Medicare Mental Health Check In?
Which channel is growing fastest?
Who are the leading digital therapeutics companies in Australia?
What are the main challenges for software treatment developers?
Table of Content
Chapter 1 Market Segmentation
- 1.1 Segmentation Framework
- 1.1.1 Product and Service Classification
- 1.1.2 Application and End-Use Classification
- 1.1.3 Technology and Solution Classification
- 1.1.4 Customer and Distribution Channel Classification
- 1.1.5 Geographic Segmentation
- 1.1.6 Market Segment Definitions and Boundaries
- 1.2 By Product Type
- 1.2.1 Standalone Therapeutic Software
- 1.2.2 Device-Linked Therapeutic Software
- 1.2.3 Medicine-Linked Therapeutic Software
- 1.3 By Disease Area
- 1.3.1 Mental Health and Behavioural Health
- 1.3.2 Diabetes and Weight Management
- 1.3.3 Sleep and Respiratory Health
- 1.3.4 Substance Use Disorders
- 1.3.5 Cardiovascular and Additional Conditions
- 1.4 By Care Setting
- 1.4.1 Home-Based Care
- 1.4.2 Outpatient Care
- 1.4.3 Hospital-Based Care
- 1.5 By Channel
- 1.5.1 Employer and Insurer Contracts
- 1.5.2 Direct Consumer Subscriptions
- 1.5.3 Government Service Contracts
Chapter 2 Introduction
- 2.1 Report Objectives and Scope
- 2.2 Product Definition and Industry Terminology
- 2.3 Market Inclusions and Exclusions
- 2.4 Research Process
- 2.4.1 Primary Research and Expert Interviews
- 2.4.2 Secondary Research and Source Review
- 2.4.3 Top-Down and Bottom-Up Estimation
- 2.4.4 Data Triangulation and Verification
- 2.5 Market Size Measurement Basis
- 2.5.1 2025: USD 73.5 million → 2035: USD 729.0 million
- 2.6 Historical and Forecast Reference Periods
- 2.6.1 Historical Period: 2018-2025
- 2.6.2 Base Year: 2025
- 2.6.3 Forecast Period: 2025-2035
- 2.7 Research Assumptions and Limitations
Chapter 3 Executive Summary
- 3.1 Market Snapshot and Key Findings
- 3.2 Base-Year Market Size, 2025
- 3.3 Forecast Market Size, 2035
- 3.4 Revenue and Volume Growth Outlook
- 3.5 Key Demand and Supply Indicators
- 3.6 Leading Market Segments
- 3.7 Fastest-Growing Market Opportunities
- 3.8 Regional Performance Highlights
- 3.9 Technology and Industry Transformation
- 3.10 Competitive Landscape Summary
- 3.11 Analyst View and Strategic Implications
Chapter 4 Australia Digital Therapeutics Market Trends and Developments
- 4.1 Historical Industry Development, 2018-2025
- 4.2 Recent Market Trends and Developments
- 4.3 Demand and Customer Behavior Trends
- 4.4 Technology and Product Innovation
- 4.5 Artificial Intelligence, Automation and Digitalization
- 4.6 Local Manufacturing and Supply Chain Realignment
- 4.7 Industry Partnerships, Mergers and Acquisitions
- 4.8 Sustainability and Circular Economy Developments
- 4.9 Government and Private Sector Investment Trends
- 4.10 Emerging Business Models and Commercialization
- 4.11 Industry Developments and Announcements
Chapter 5 Australia Digital Therapeutics Market Production, Supply and Demand Analysis
- 5.1 Demand Trend and Consumption Analysis, 2018-2025
- 5.2 Demand Forecast, 2025-2035
- 5.3 Production and Output Trend, 2018-2025
- 5.4 Production and Output Forecast, 2025-2035
- 5.5 Installed Capacity and Capacity Utilization
- 5.6 Company-Wise Production Plants and Statistics
- 5.6.1 Installed Production Capacity
- 5.6.2 Actual Production
- 5.6.3 Planned Capacity and Expansion Targets
- 5.7 Supply Chain Structure and Procurement Trends
- 5.8 Supply-Demand Gap and Bottlenecks
- 5.9 Import Dependence and Sourcing Structure
- 5.10 Contract Manufacturing and Outsourcing
- 5.11 Regional Supply and Demand Concentration
Chapter 6 Australia Digital Therapeutics Market Pricing Analysis
- 6.1 Pricing Structure and Measurement
- 6.2 Historical Pricing Trends, 2018-2025
- 6.3 Pricing Outlook, 2025-2035
- 6.4 Average Selling Price and Unit Economics
- 6.5 Pricing by Product and Market Segment
- 6.6 Geographic Pricing Differences
- 6.7 Key Input, Energy, Labor and Logistics Costs
- 6.8 Contract Pricing and Purchasing Models
- 6.9 Pricing Sensitivity and Competitive Positioning
- 6.10 Price, Margin and Profitability Implications
Chapter 7 Australia Digital Therapeutics Market Dynamics
- 7.1 Market Growth Drivers
- 7.1.1 Demand-Side Drivers
- 7.1.2 Technology and Innovation Drivers
- 7.1.3 Infrastructure and Investment Drivers
- 7.1.4 Regulatory and Policy Drivers
- 7.2 Market Restraints
- 7.2.1 Cost and Affordability Constraints
- 7.2.2 Technology and Adoption Barriers
- 7.2.3 Supply Chain and Operational Constraints
- 7.3 Market Challenges
- 7.3.1 Competitive Pressure and Margin Erosion
- 7.3.2 Skills, Infrastructure and Implementation Gaps
- 7.4 Emerging Market Opportunities
- 7.5 Market Dynamics Impact and Time-Horizon Assessment
Chapter 8 Australia Digital Therapeutics Value Chain Analysis
- 8.1 Industry Value Chain Overview
- 8.2 Upstream Suppliers and Critical Inputs
- 8.3 Technology and Component Providers
- 8.4 Manufacturing or Service Delivery
- 8.5 Distribution, Channel Partners and Integrators
- 8.6 Downstream Applications and End Users
- 8.7 Value Addition and Profit Pools
- 8.8 Vertical Integration and Outsourcing
- 8.9 Supplier Concentration and Risk
- 8.10 Supply Chain Localization and Resilience
Chapter 9 Australia Digital Therapeutics Market Regulations and Policies
- 9.1 Relevant Laws, Standards and Compliance Frameworks
- 9.2 Product, Service, Safety and Quality Requirements
- 9.3 Government Policies, Incentives and Subsidies
- 9.4 Imports, Exports and Trade Barriers
- 9.5 Public Procurement and Local Content Requirements
- 9.6 Environmental and Sustainability Compliance
- 9.7 Upcoming Policy Changes and Market Implications
Chapter 10 Australia Digital Therapeutics Market Hotspots and Opportunities
- 10.1 Market Opportunity Mapping and Growth Hotspots
- 10.2 High-Growth Applications and Customer Groups
- 10.3 Underserved Markets and White-Space Opportunities
- 10.4 Emerging Technology and Product Opportunities
- 10.5 New Capacity and Investment Hotspots
- 10.6 Market Entry and Expansion Opportunities
- 10.7 Distribution and Partnership Opportunities
- 10.8 Near-Term and Long-Term Commercial Potential
- 10.9 Opportunity Attractiveness and Execution Risks
Chapter 11 Australia Digital Therapeutics Market Outlook, 2025-2035
- 11.1 Market Size and Analysis
- 11.1.1 Revenue (Market Measurement: 2025: USD 73.5 million → 2035: USD 729.0 million)
- 11.1.2 Market Volume and Quantity Sold
- 11.1.3 Historical Market Size, 2018-2025
- 11.1.4 Base-Year Market Size, 2025
- 11.2 Market Forecast, 2025-2035
- 11.2.1 Revenue Forecast to 2035
- 11.2.2 Volume Forecast to 2035
- 11.2.3 CAGR and Year-on-Year Growth
- 11.2.4 Incremental Revenue Opportunity
- 11.3 Forecast Assumptions and Scenario Analysis
- 11.3.1 Base-Case Forecast
- 11.3.2 Optimistic and Conservative Scenarios
- 11.3.3 Technology, Pricing and Policy Sensitivities
- 11.4 Market Attractiveness and Growth Outlook
Chapter 12 Australia Digital Therapeutics Market Segmentation and Outlook
- 12.1 Segmentation Summary and Market Shares, 2025
- 12.2 Largest and Fastest-Growing Segments
- 12.3 By Product Type - Market Size and Forecast, 2025-2035
- 12.3.1 Segment Definition and Scope
- 12.3.2 Historical Market Size, 2018-2025
- 12.3.3 Revenue Forecast, 2025-2035
- 12.3.4 Volume Forecast, 2025-2035
- 12.3.5 Base-Year Market Share, 2025
- 12.3.6 Segment CAGR and Growth Drivers
- 12.3.7 Subsegment Market Size and Forecast
- 12.3.7.1 Standalone Therapeutic Software
- 12.3.7.2 Device-Linked Therapeutic Software
- 12.3.7.3 Medicine-Linked Therapeutic Software
- 12.3.8 Subsegment Pricing and Adoption Trends
- 12.3.9 Leading Suppliers and Competition
- 12.3.10 Regional Demand and Opportunities
- 12.4 By Disease Area - Market Size and Forecast, 2025-2035
- 12.4.1 Segment Definition and Scope
- 12.4.2 Historical Market Size, 2018-2025
- 12.4.3 Revenue Forecast, 2025-2035
- 12.4.4 Volume Forecast, 2025-2035
- 12.4.5 Base-Year Market Share, 2025
- 12.4.6 Segment CAGR and Growth Drivers
- 12.4.7 Subsegment Market Size and Forecast
- 12.4.7.1 Mental Health and Behavioural Health
- 12.4.7.2 Diabetes and Weight Management
- 12.4.7.3 Sleep and Respiratory Health
- 12.4.7.4 Substance Use Disorders
- 12.4.7.5 Cardiovascular and Additional Conditions
- 12.4.8 Subsegment Pricing and Adoption Trends
- 12.4.9 Leading Suppliers and Competition
- 12.4.10 Regional Demand and Opportunities
- 12.5 By Care Setting - Market Size and Forecast, 2025-2035
- 12.5.1 Segment Definition and Scope
- 12.5.2 Historical Market Size, 2018-2025
- 12.5.3 Revenue Forecast, 2025-2035
- 12.5.4 Volume Forecast, 2025-2035
- 12.5.5 Base-Year Market Share, 2025
- 12.5.6 Segment CAGR and Growth Drivers
- 12.5.7 Subsegment Market Size and Forecast
- 12.5.7.1 Home-Based Care
- 12.5.7.2 Outpatient Care
- 12.5.7.3 Hospital-Based Care
- 12.5.8 Subsegment Pricing and Adoption Trends
- 12.5.9 Leading Suppliers and Competition
- 12.5.10 Regional Demand and Opportunities
- 12.6 By Channel - Market Size and Forecast, 2025-2035
- 12.6.1 Segment Definition and Scope
- 12.6.2 Historical Market Size, 2018-2025
- 12.6.3 Revenue Forecast, 2025-2035
- 12.6.4 Volume Forecast, 2025-2035
- 12.6.5 Base-Year Market Share, 2025
- 12.6.6 Segment CAGR and Growth Drivers
- 12.6.7 Subsegment Market Size and Forecast
- 12.6.7.1 Employer and Insurer Contracts
- 12.6.7.2 Direct Consumer Subscriptions
- 12.6.7.3 Government Service Contracts
- 12.6.8 Subsegment Pricing and Adoption Trends
- 12.6.9 Leading Suppliers and Competition
- 12.6.10 Regional Demand and Opportunities
- 12.7 Segment Growth Comparison
- 12.8 Segment Attractiveness and Priority Matrix
Chapter 13 Australia Digital Therapeutics Geographic Market Outlook, 2025-2035
- 13.1 Domestic Market Distribution and Demand Clusters
- 13.2 State- or Province-Wise Market Size and Forecast, 2025-2035
- 13.3 City and Metropolitan Market Outlook
- 13.4 Industrial, Manufacturing and Commercial Clusters
- 13.5 Geographic Concentration of Key End Users
- 13.6 Local Pricing and Purchasing Differences
- 13.7 Domestic Production Facilities and Capacity Map
- 13.8 Local Infrastructure and Project Pipeline
- 13.9 State-Level Policy and Incentive Differences
- 13.10 Subnational Investment Hotspots and Opportunities
- 13.11 Distribution and Logistics Networks
- 13.12 Domestic Competitive Footprint
Chapter 14 Australia Digital Therapeutics Technology, Innovation and Sustainability Outlook
- 14.1 Technology Landscape and Maturity
- 14.2 Product, Process and Service Innovation
- 14.3 AI, Automation and Digital Tools in the Industry
- 14.4 Technology Adoption and Performance Benchmarking
- 14.5 Innovation Pipeline and R&D Investment
- 14.6 Patent and Intellectual Property Trends
- 14.7 Energy Efficiency and Resource Management
- 14.8 Sustainability, Recycling and Circularity
- 14.9 Technology Roadmap, 2025-2035
- 14.10 Risks of Obsolescence and Technology Substitution
Chapter 15 Australia Digital Therapeutics Market Key Strategic Imperatives
- 15.1 Growth and Market Entry Priorities
- 15.2 High-Return Products and Segments
- 15.3 Pricing, Profitability and Cost Optimization
- 15.4 Technology Investment and Product Differentiation
- 15.5 Supply Chain Localization and Resilience
- 15.6 Distribution and Customer Acquisition
- 15.7 Partnership, Acquisition and Capacity Strategy
- 15.8 Regional Expansion Priorities
- 15.9 Short-, Medium- and Long-Term Actions
Chapter 16 Competition Outlook
- 16.1 Industry Competition Characteristics
- 16.2 Market Structure and Concentration
- 16.3 Market Share and Competitive Positioning, 2025
- 16.4 Company-Wise Revenue and Product Benchmarking
- 16.5 Production and Service Capacity Benchmarking
- 16.6 Technology, Pricing and Differentiation
- 16.7 Regional Footprint and Distribution Strength
- 16.8 Mergers, Acquisitions and Strategic Alliances
- 16.9 New Entrants and Competitive Threats
- 16.10 Porter's Five Forces and Industry Attractiveness
- 16.11 Competitive Outlook, 2025-2035
Chapter 17 Company Profiles
- 17.1 Company Coverage and Selection Criteria
- 17.2 ResMed
- 17.2.1 Business Description
- 17.2.2 Company Ownership and Geographic Presence
- 17.2.3 Product and Service Portfolio
- 17.2.4 Manufacturing and Operating Footprint
- 17.2.5 Production Capacity and Expansion Plans
- 17.2.6 Financial Performance and Investment
- 17.2.7 Market Share and Competitive Position
- 17.2.8 Technology and Innovation Capabilities
- 17.2.9 Strategic Alliances or Partnerships
- 17.2.10 Recent Developments
- 17.2.11 Growth Strategy and Outlook
- 17.3 Headspace
- 17.4 Noom
- 17.5 Mindset Health
- 17.6 SilverCloud Health
- 17.7 DarioHealth
- 17.8 Uprise
- 17.9 MoodMission
- 17.10 Smiling Mind
- 17.11 Hello Sunday Morning
- 17.12 Other Relevant Market Participants
Note: Every listed company is profiled on the structure shown under the first company. The company list is preliminary and may change based on research findings, market developments, data availability and client requirements.
Chapter 18 Disclaimer
- 18.1 Research and Forecast Disclaimer
- 18.2 Data Source and Estimation Limitations
Note: The depth of individual sections depends on data availability for this market. Volume, capacity, trade and other unit-based metrics are included where applicable.

