
Joint replacement and spine care anchor implant demand
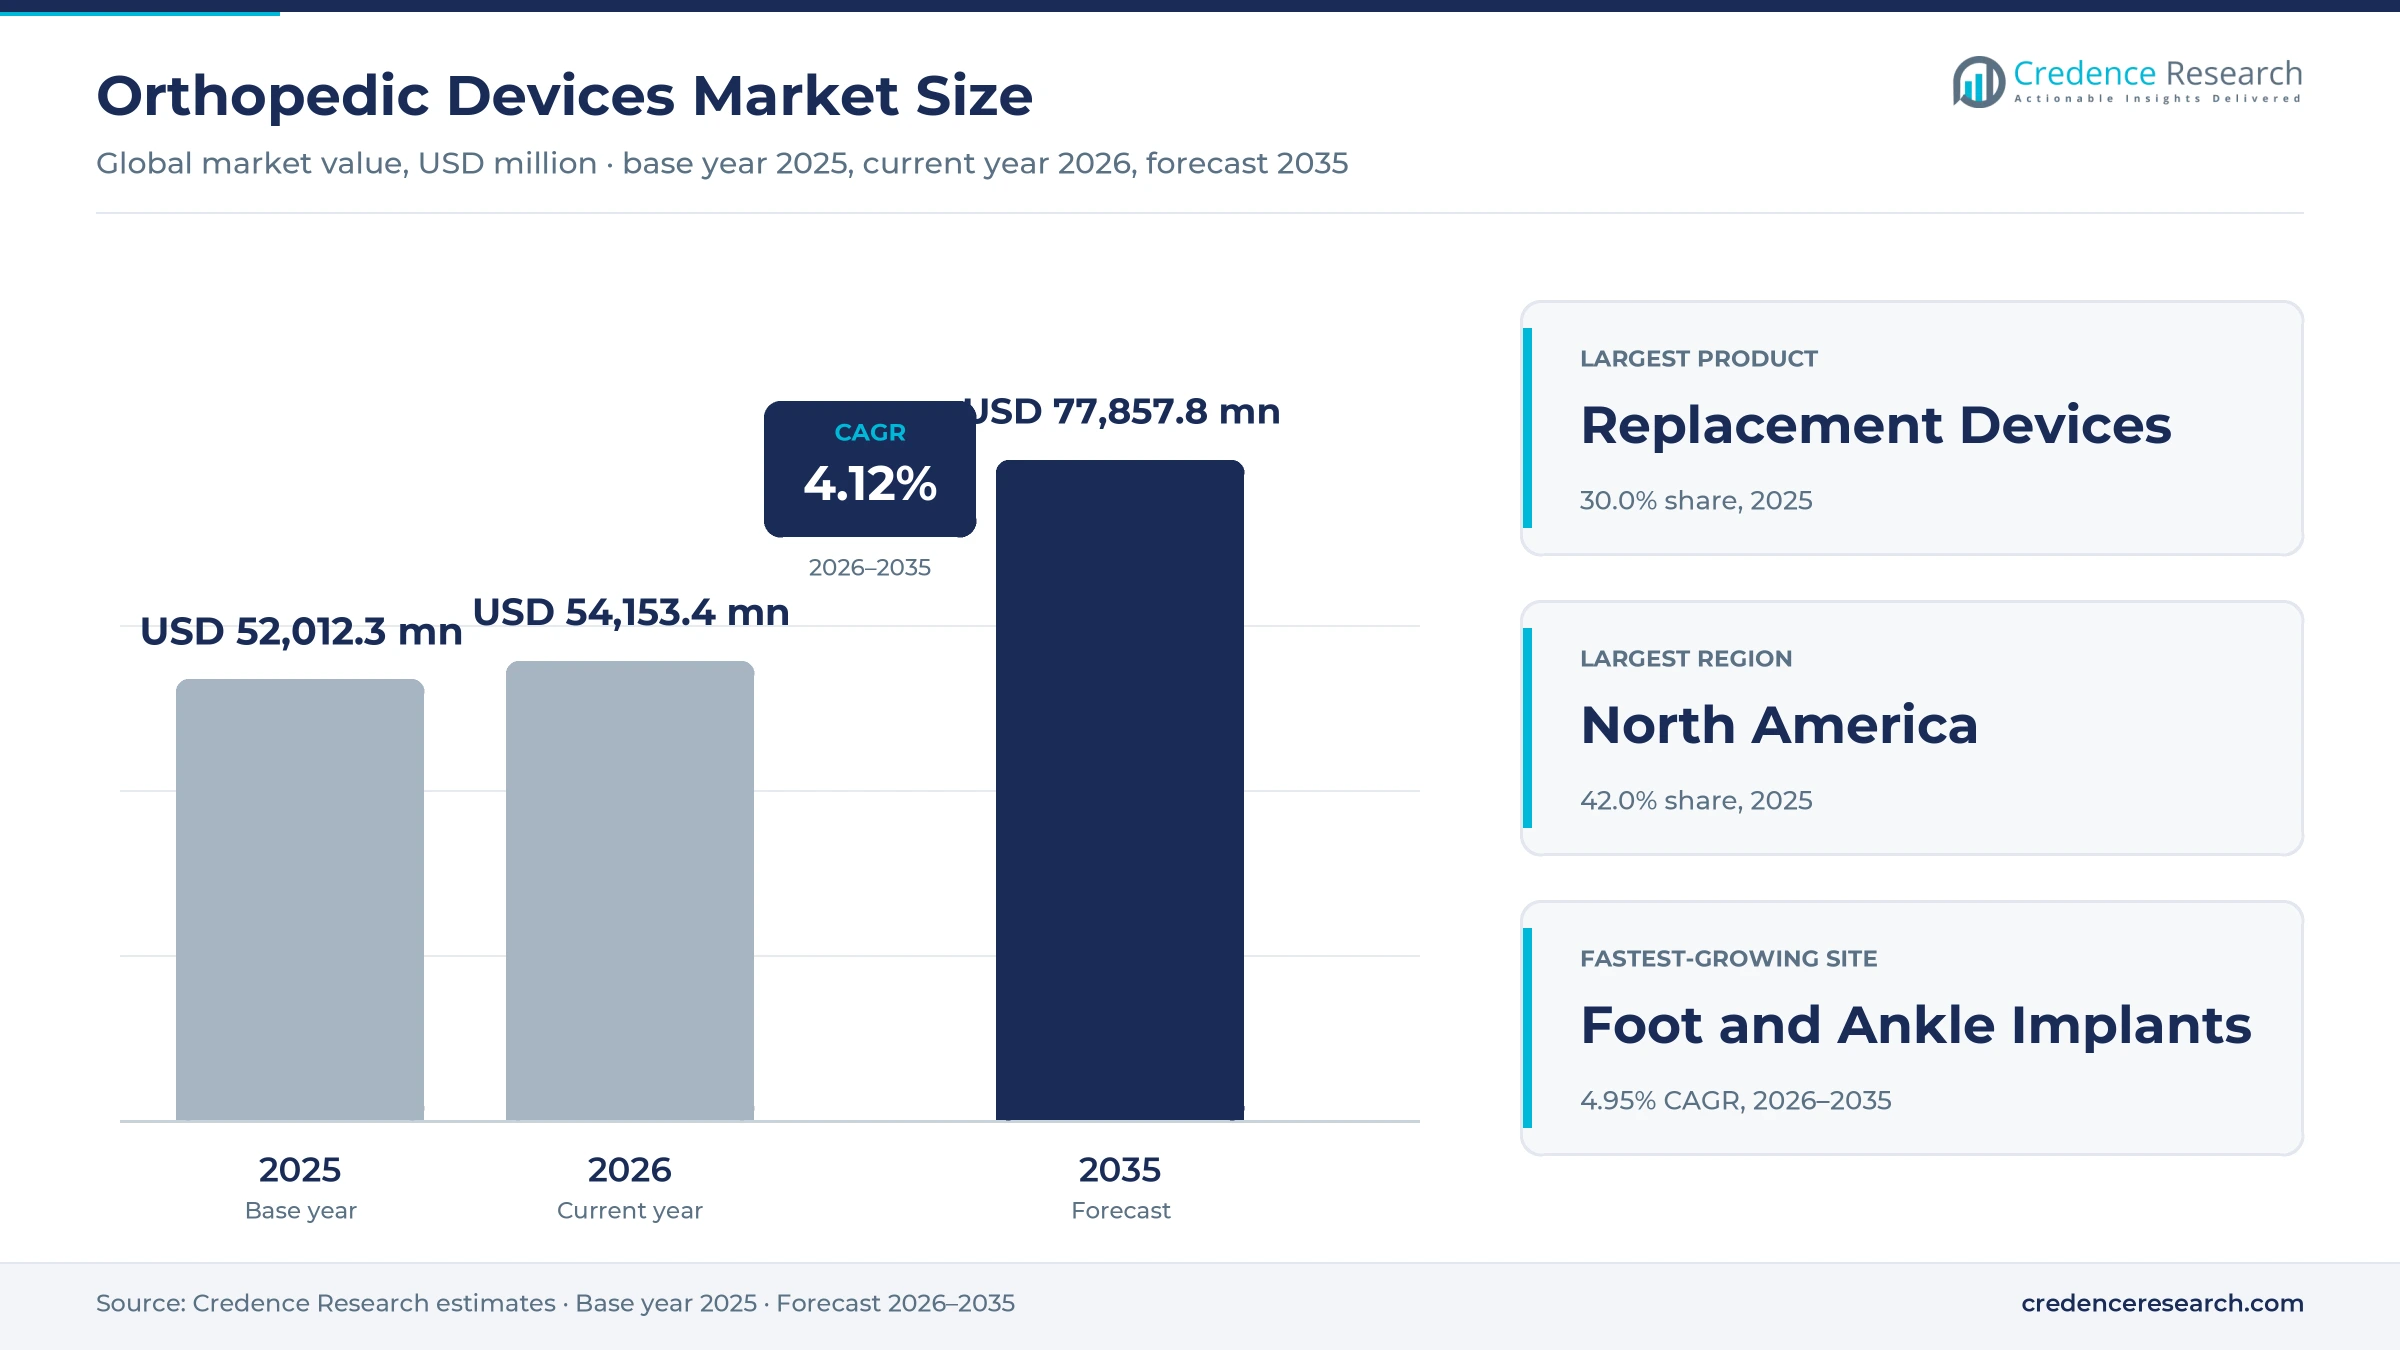
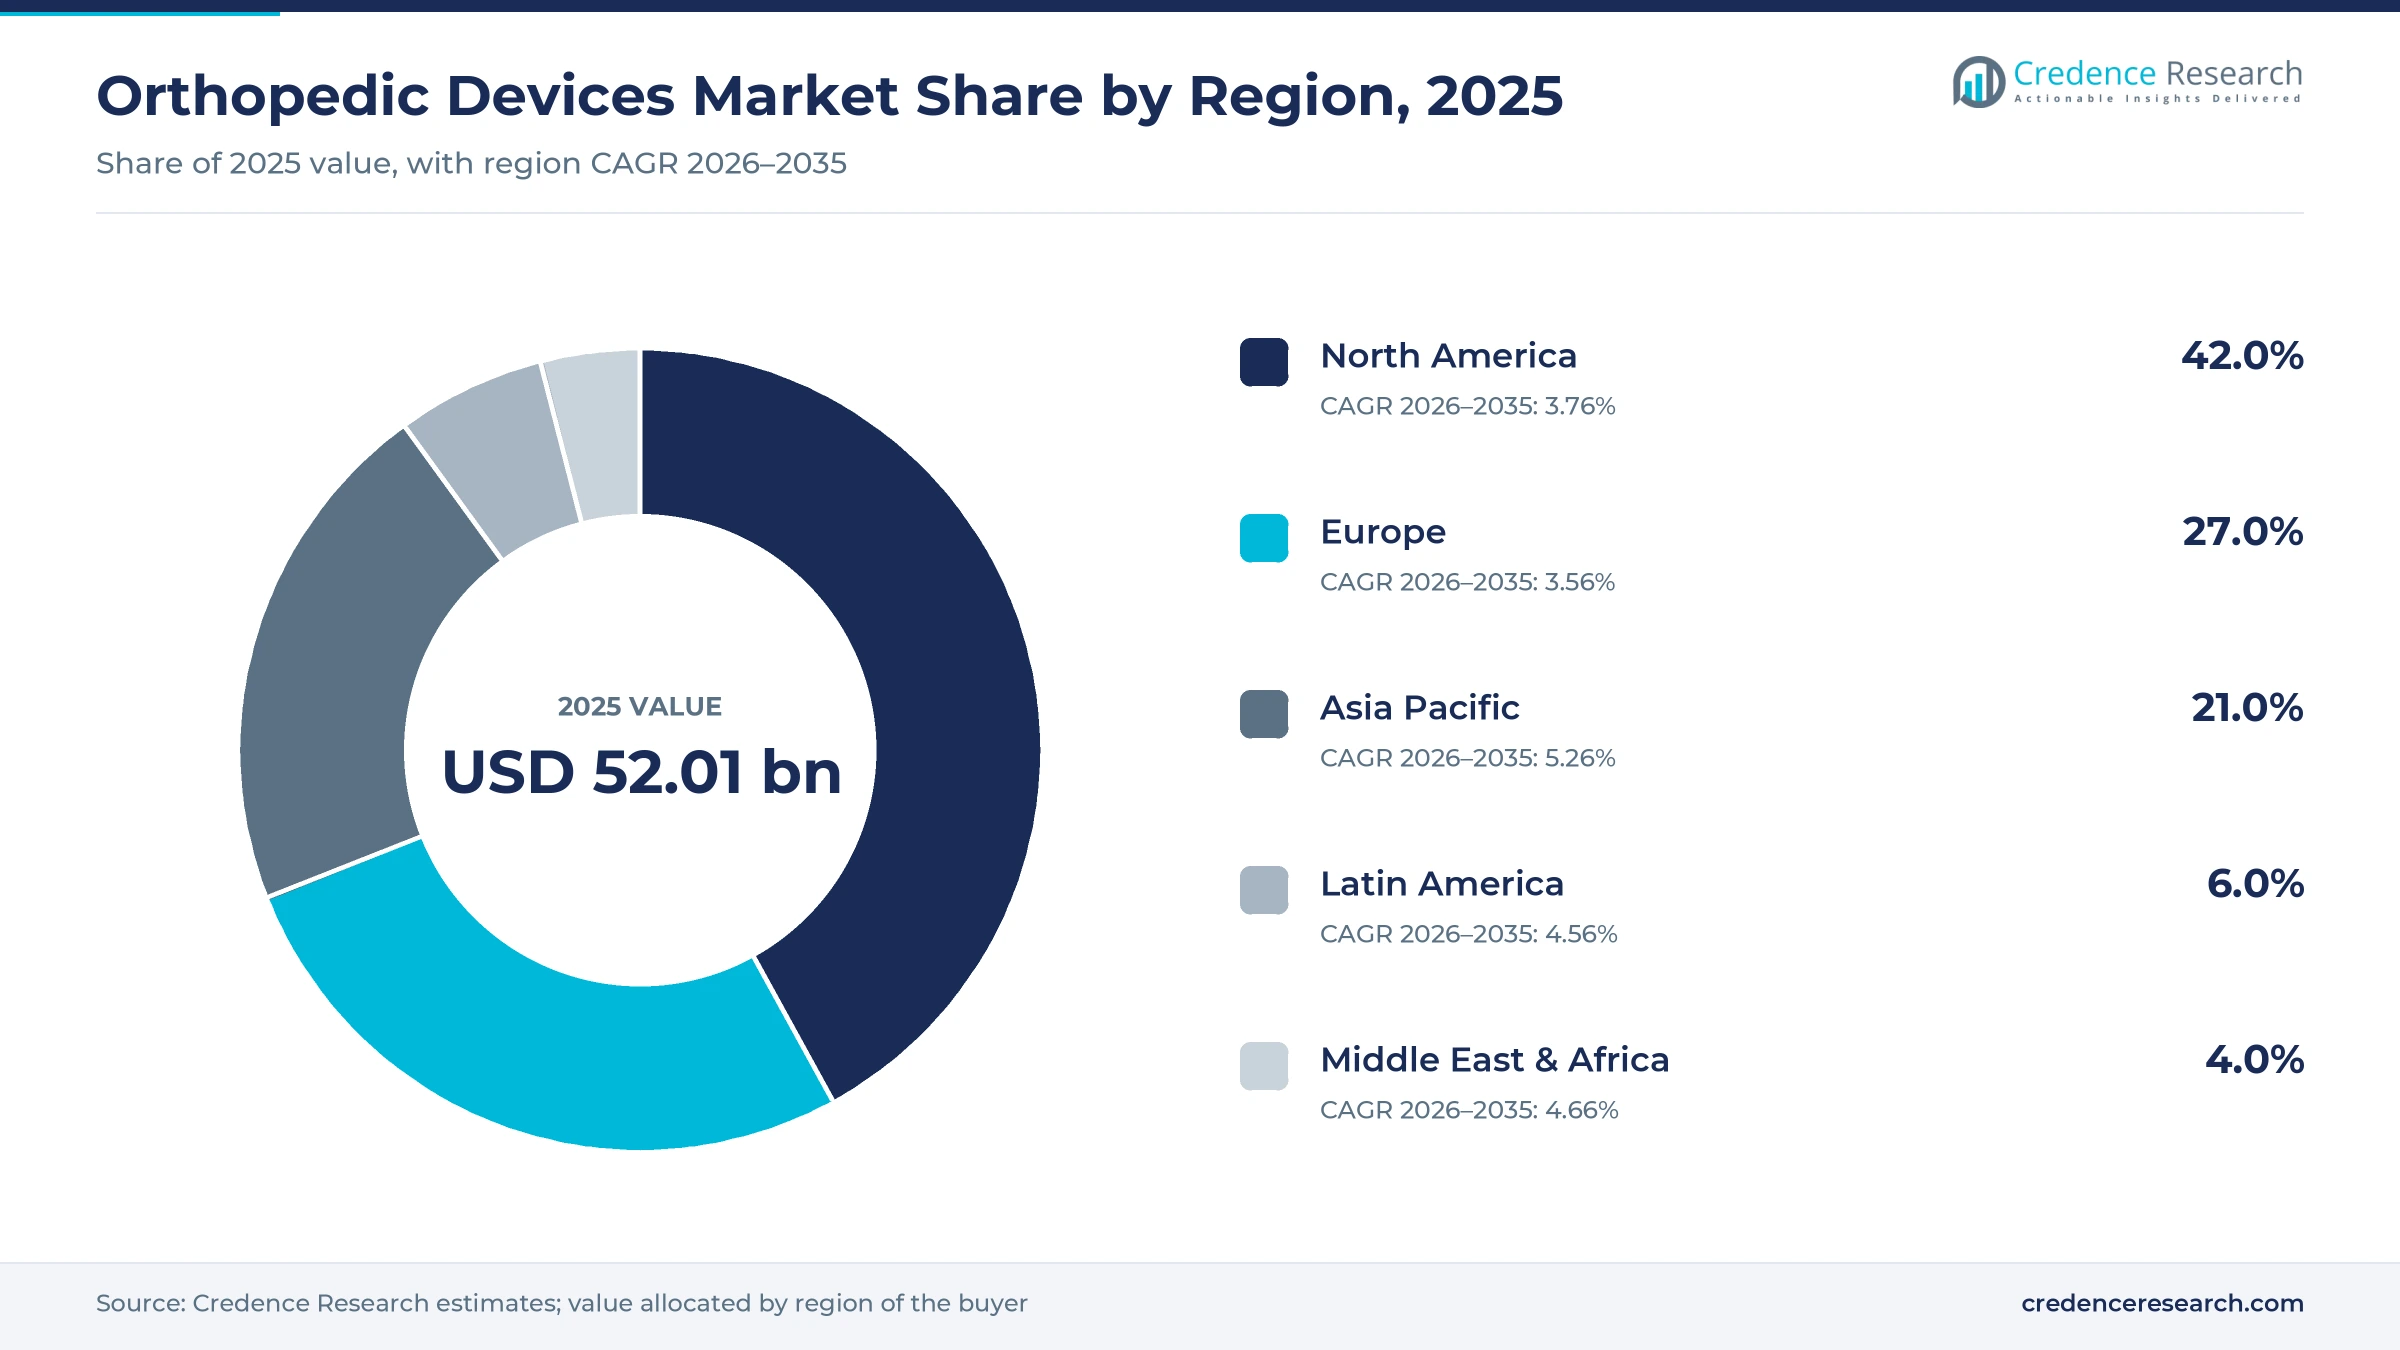
The global orthopedic devices market was valued at USD 52.01 billion in 2025 and is projected to increase from USD 54.15 billion in 2026 to USD 77.86 billion by 2035, registering a CAGR of 4.12% during 2026–2035. Demand comes from aging populations, a rising burden of osteoarthritis and back pain, sports and trauma injuries and the spread of joint replacement in emerging economies. North America held the largest regional share, 42.0% in 2025, because U.S. hospitals and surgery centers perform high volumes of knee, hip and spine procedures with premium implants. Asia Pacific is the fastest-growing region at 5.26% a year, as China, India and Southeast Asia expand surgical capacity. The payment picture changed in January 2026, when a mandatory U.S. hospital payment model began holding hospitals accountable for full episodes of joint replacement, hip fracture and spinal fusion care. As a result, hospitals now weigh implant cost and recovery outcomes together.
Which musculoskeletal products does this analysis cover?
The analysis counts joint replacement implants, fixation plates, screws and nails, spinal implants and instruments, arthroscopy instruments, orthobiologics, bone graft substitutes, external prosthetics and braces and supports. Values are based on manufacturer selling prices, including instruments and enabling technology sold with implants.
Physical therapy services, surgeon fees and general hospital equipment sit outside the scope of this analysis. The value chain runs from material, coating and machining suppliers through implant makers and distributors to hospitals, ambulatory surgery centers, specialist clinics and home care providers.
Orthopedic Devices Market Insights
- The orthopedic devices market grows from USD 52.01 billion in 2025 to USD 77.86 billion by 2035, a 4.12% CAGR as joint and spine procedures rise worldwide.
- North America held 42.0% of global musculoskeletal implant value in 2025, supported by high procedure volumes in U.S. hospitals and surgery centers.
- Replacement devices led products with 30.0% of 2025 value, while orthobiologics grow fastest at 4.91% a year through 2035.
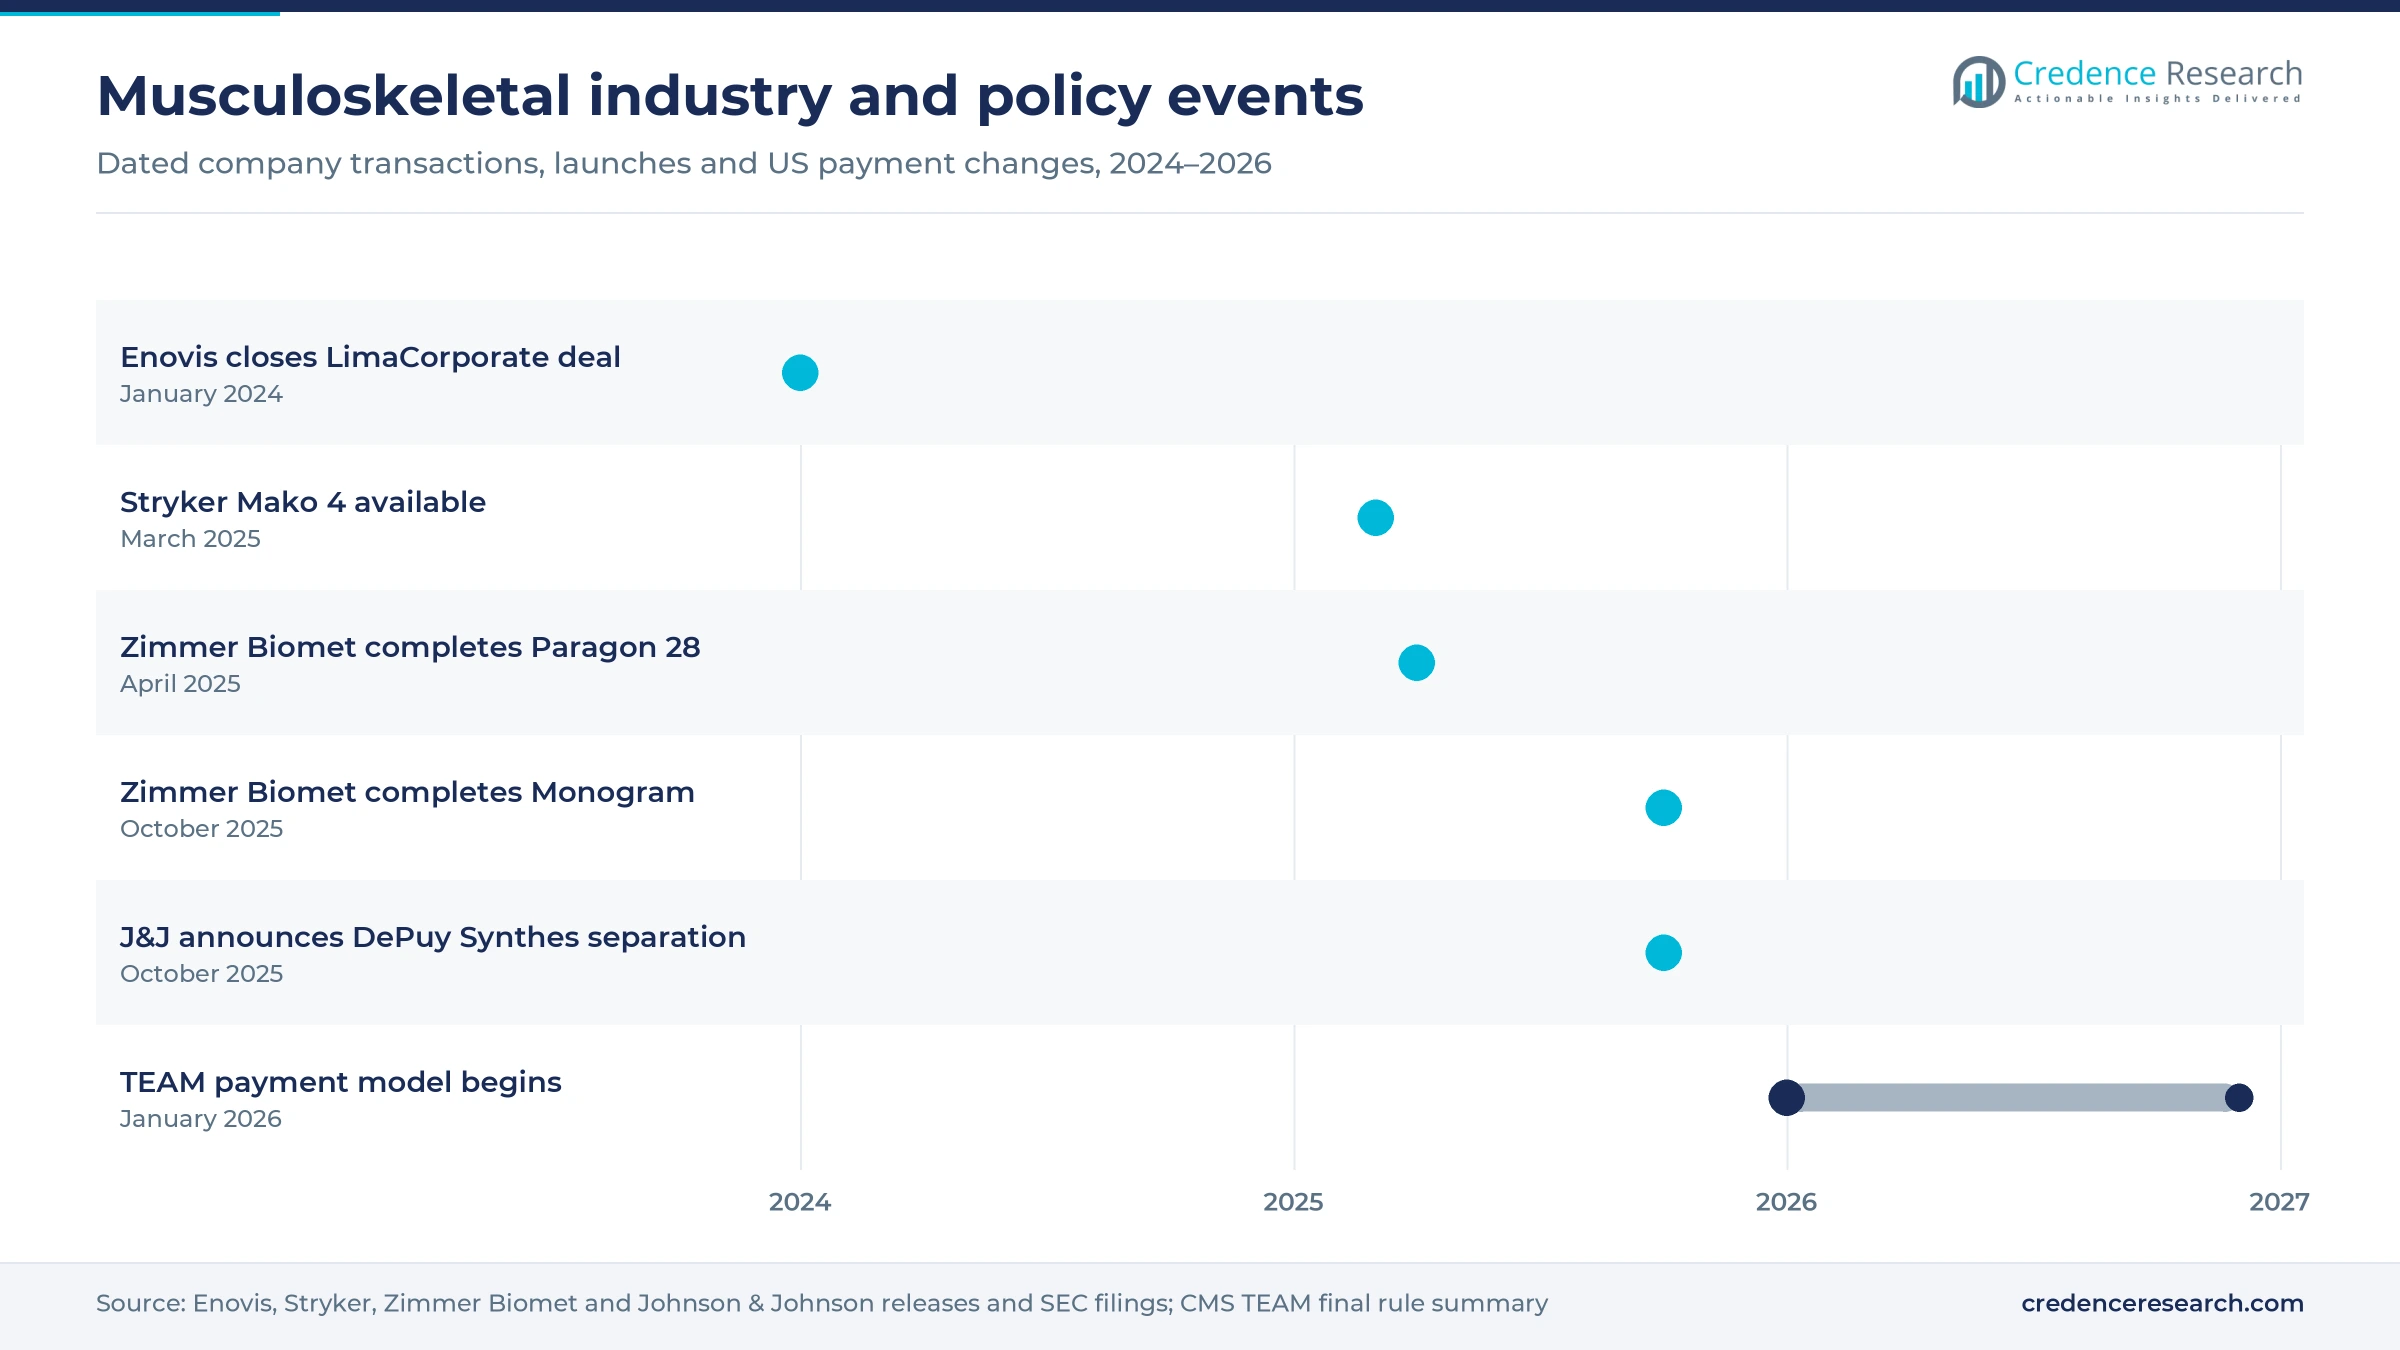
- In April 2025, Zimmer Biomet completed its acquisition of Paragon 28, adding a company focused exclusively on foot and ankle care.
- In October 2025, Johnson & Johnson announced its intent to separate its orthopaedics business into a standalone company named DePuy Synthes.
Joint replacement leads as orthobiologics grow fastest
Why do replacement implants lead product spending?
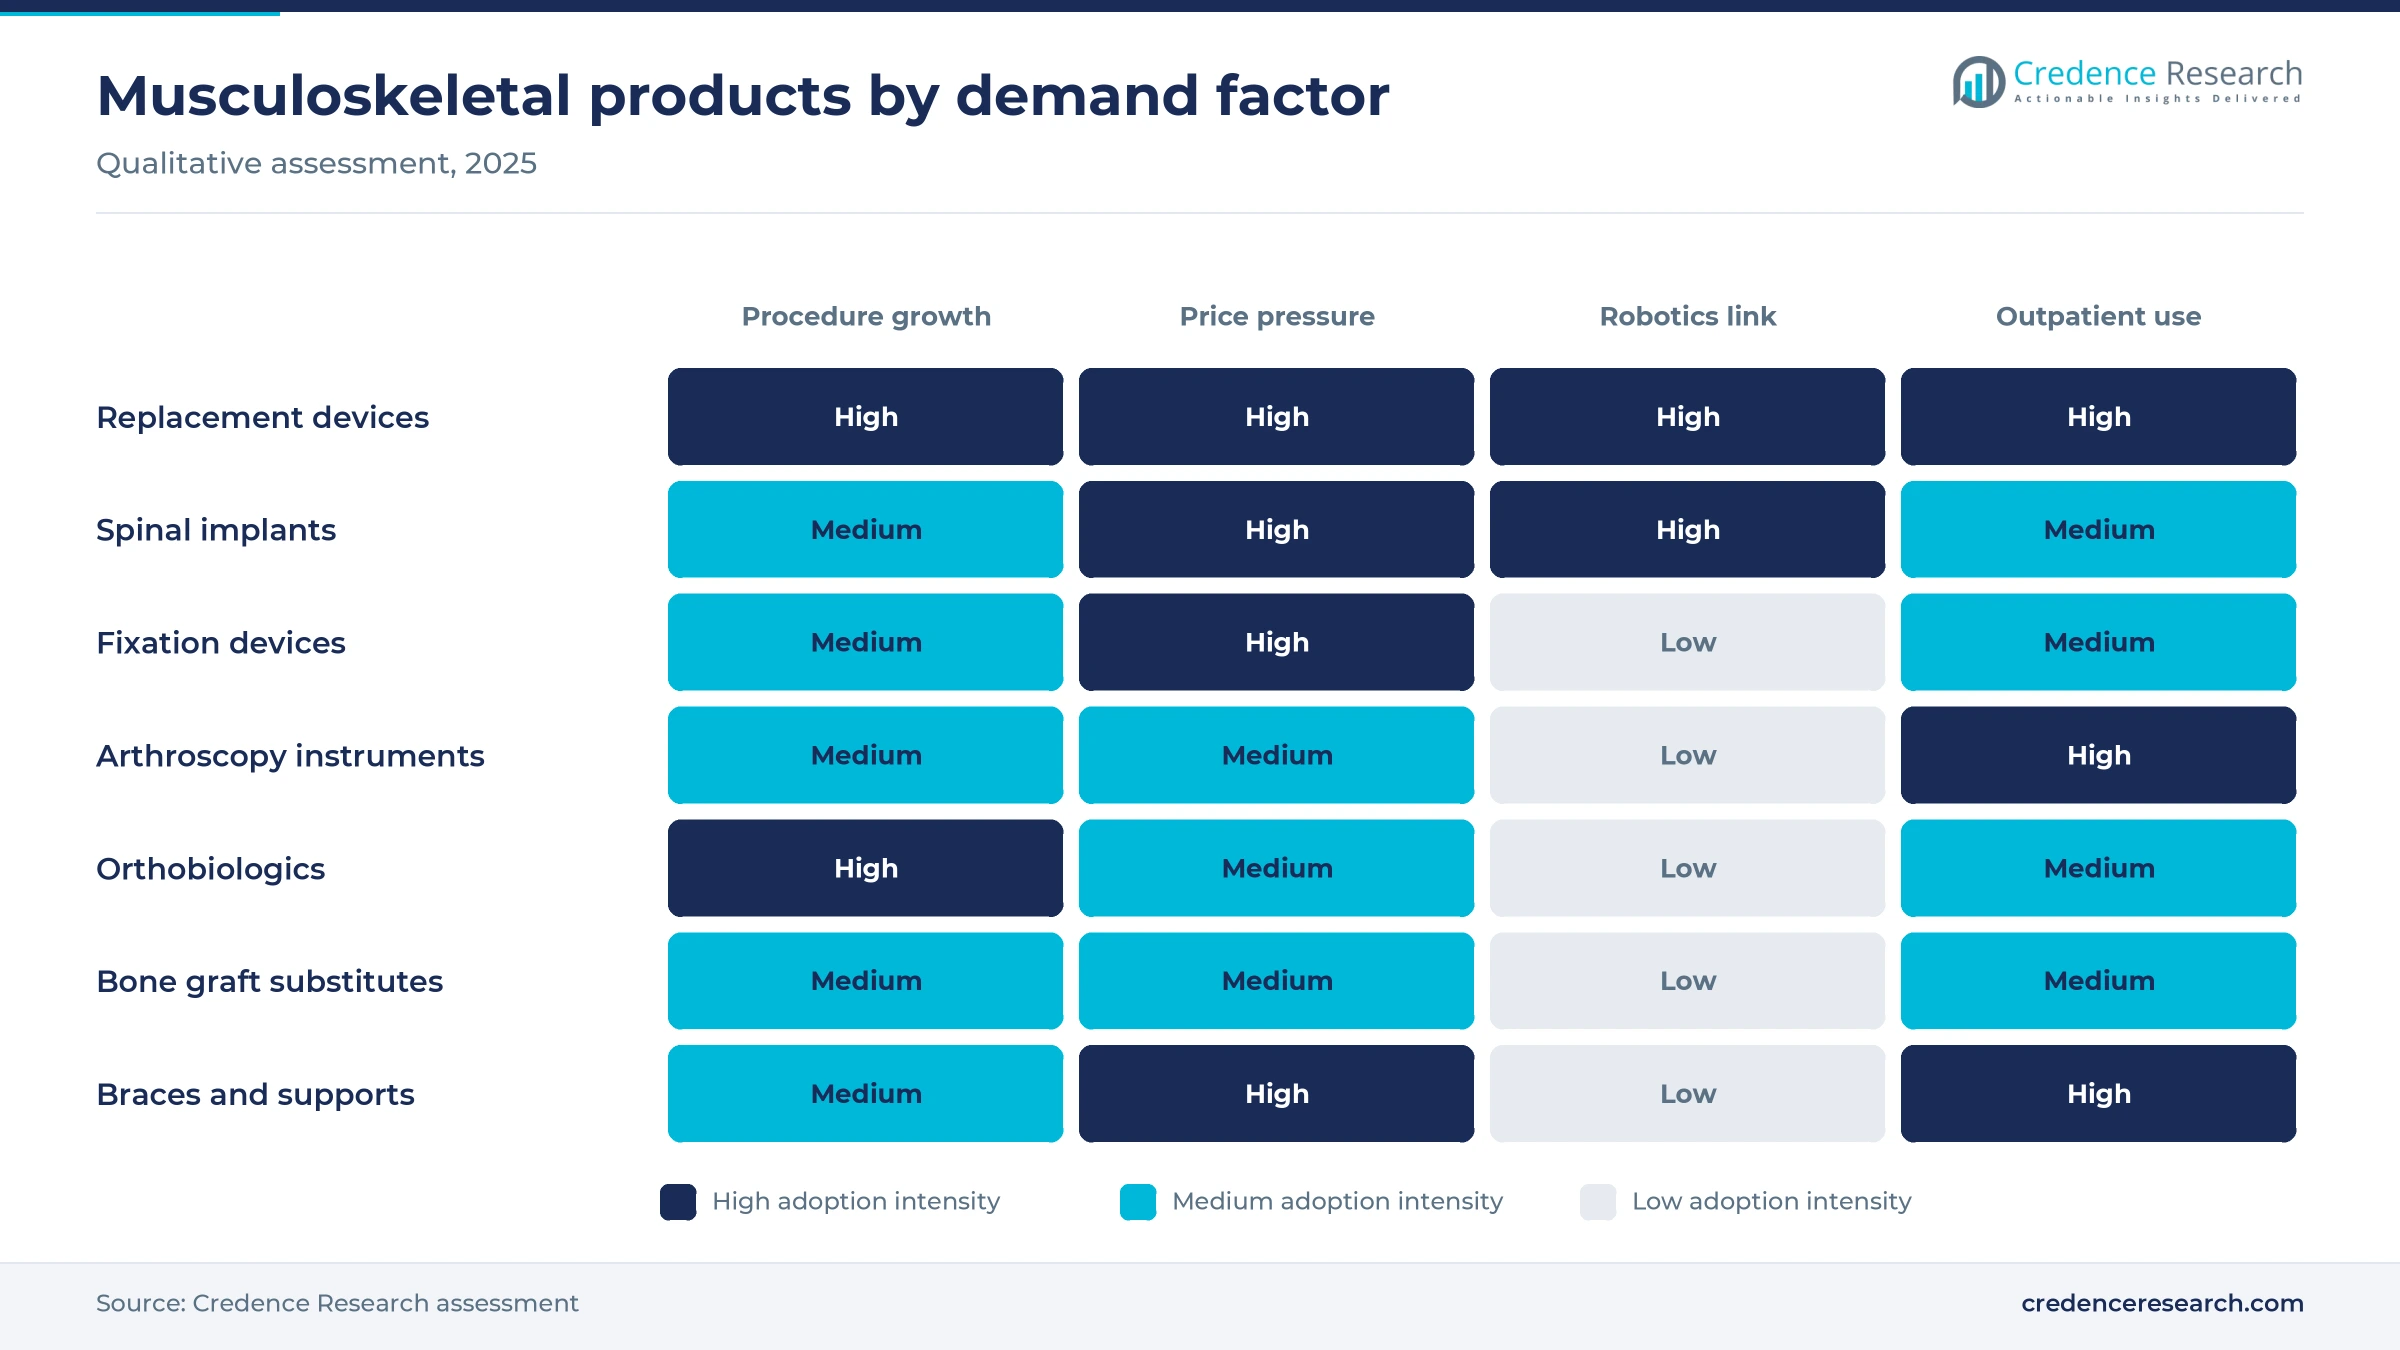
Based on product, the market is categorized into replacement devices, spinal implants and surgical devices, fixation devices, braces and support products, arthroscopy instruments, orthobiologics, bone graft substitutes and prosthetics. Orthopedic Replacement Devices led with a 30.0% share of 2025 value, because hip and knee procedures use high-value implant systems. Orthobiologics grow fastest at 4.91% a year, as surgeons use biologic materials to support fusion and healing, often alongside bone graft substitutes.
Why do foot and ankle implants grow fastest?
Based on site, the market is categorized into knee and thigh, shoulder, hip, hand and wrist, foot and ankle, spine, arm and elbow, craniomaxillofacial and other sites. Knee and Thigh Implants led with a 27.0% share of 2025 value, because knee replacement is the most common joint operation in many countries. Foot and Ankle Implants grow fastest at 4.95% a year, as specialist companies bring dedicated implants and instruments to this area.
Why are ambulatory care centers gaining surgical volume?
Based on end user, the market is categorized into hospitals, ambulatory care centers, orthopedic centers, specialized clinics, home care settings and others. Hospitals led with a 55.0% share of 2025 value, because trauma, revision and complex spine cases need inpatient care. Ambulatory Care Centers grow fastest at 5.18% a year, as payers and surgeons move routine joint replacement to same-day settings.
| Segment Group | Leading Sub-segment | Share, 2025 | Fastest-growing Sub-segment | CAGR, 2026–2035 |
|---|---|---|---|---|
| By Product | Orthopedic Replacement Devices | 30.0% | Orthobiologics | 4.91% |
| By Site | Knee and Thigh Implants | 27.0% | Foot and Ankle Implants | 4.95% |
| By End User | Hospitals | 55.0% | Ambulatory Care Centers | 5.18% |
Request a Free Sample
Fill in your details and we'll send you a free sample report.
- Sample data tables & charts
- Research methodology
Aging, arthritis and back pain lift surgical volumes
How does the rising burden of osteoarthritis sustain demand?
The rising burden of osteoarthritis sustains demand, because damaged knees and hips often end in joint replacement. The World Health Organization says about 528 million people were living with osteoarthritis in 2019, an increase of 113% since 1990. About 70% of people with the condition are older than 55, and about 60% are women. WHO also notes that joint replacement surgery is most commonly performed at the hip and knee. As a result, replacement devices held 30.0% of 2025 value, the largest product share. In turn, earlier diagnosis and better access to surgery keep adding patients in middle-income countries, where joint replacement is still far less common than in high-income markets.
Why does population aging raise surgical volumes?
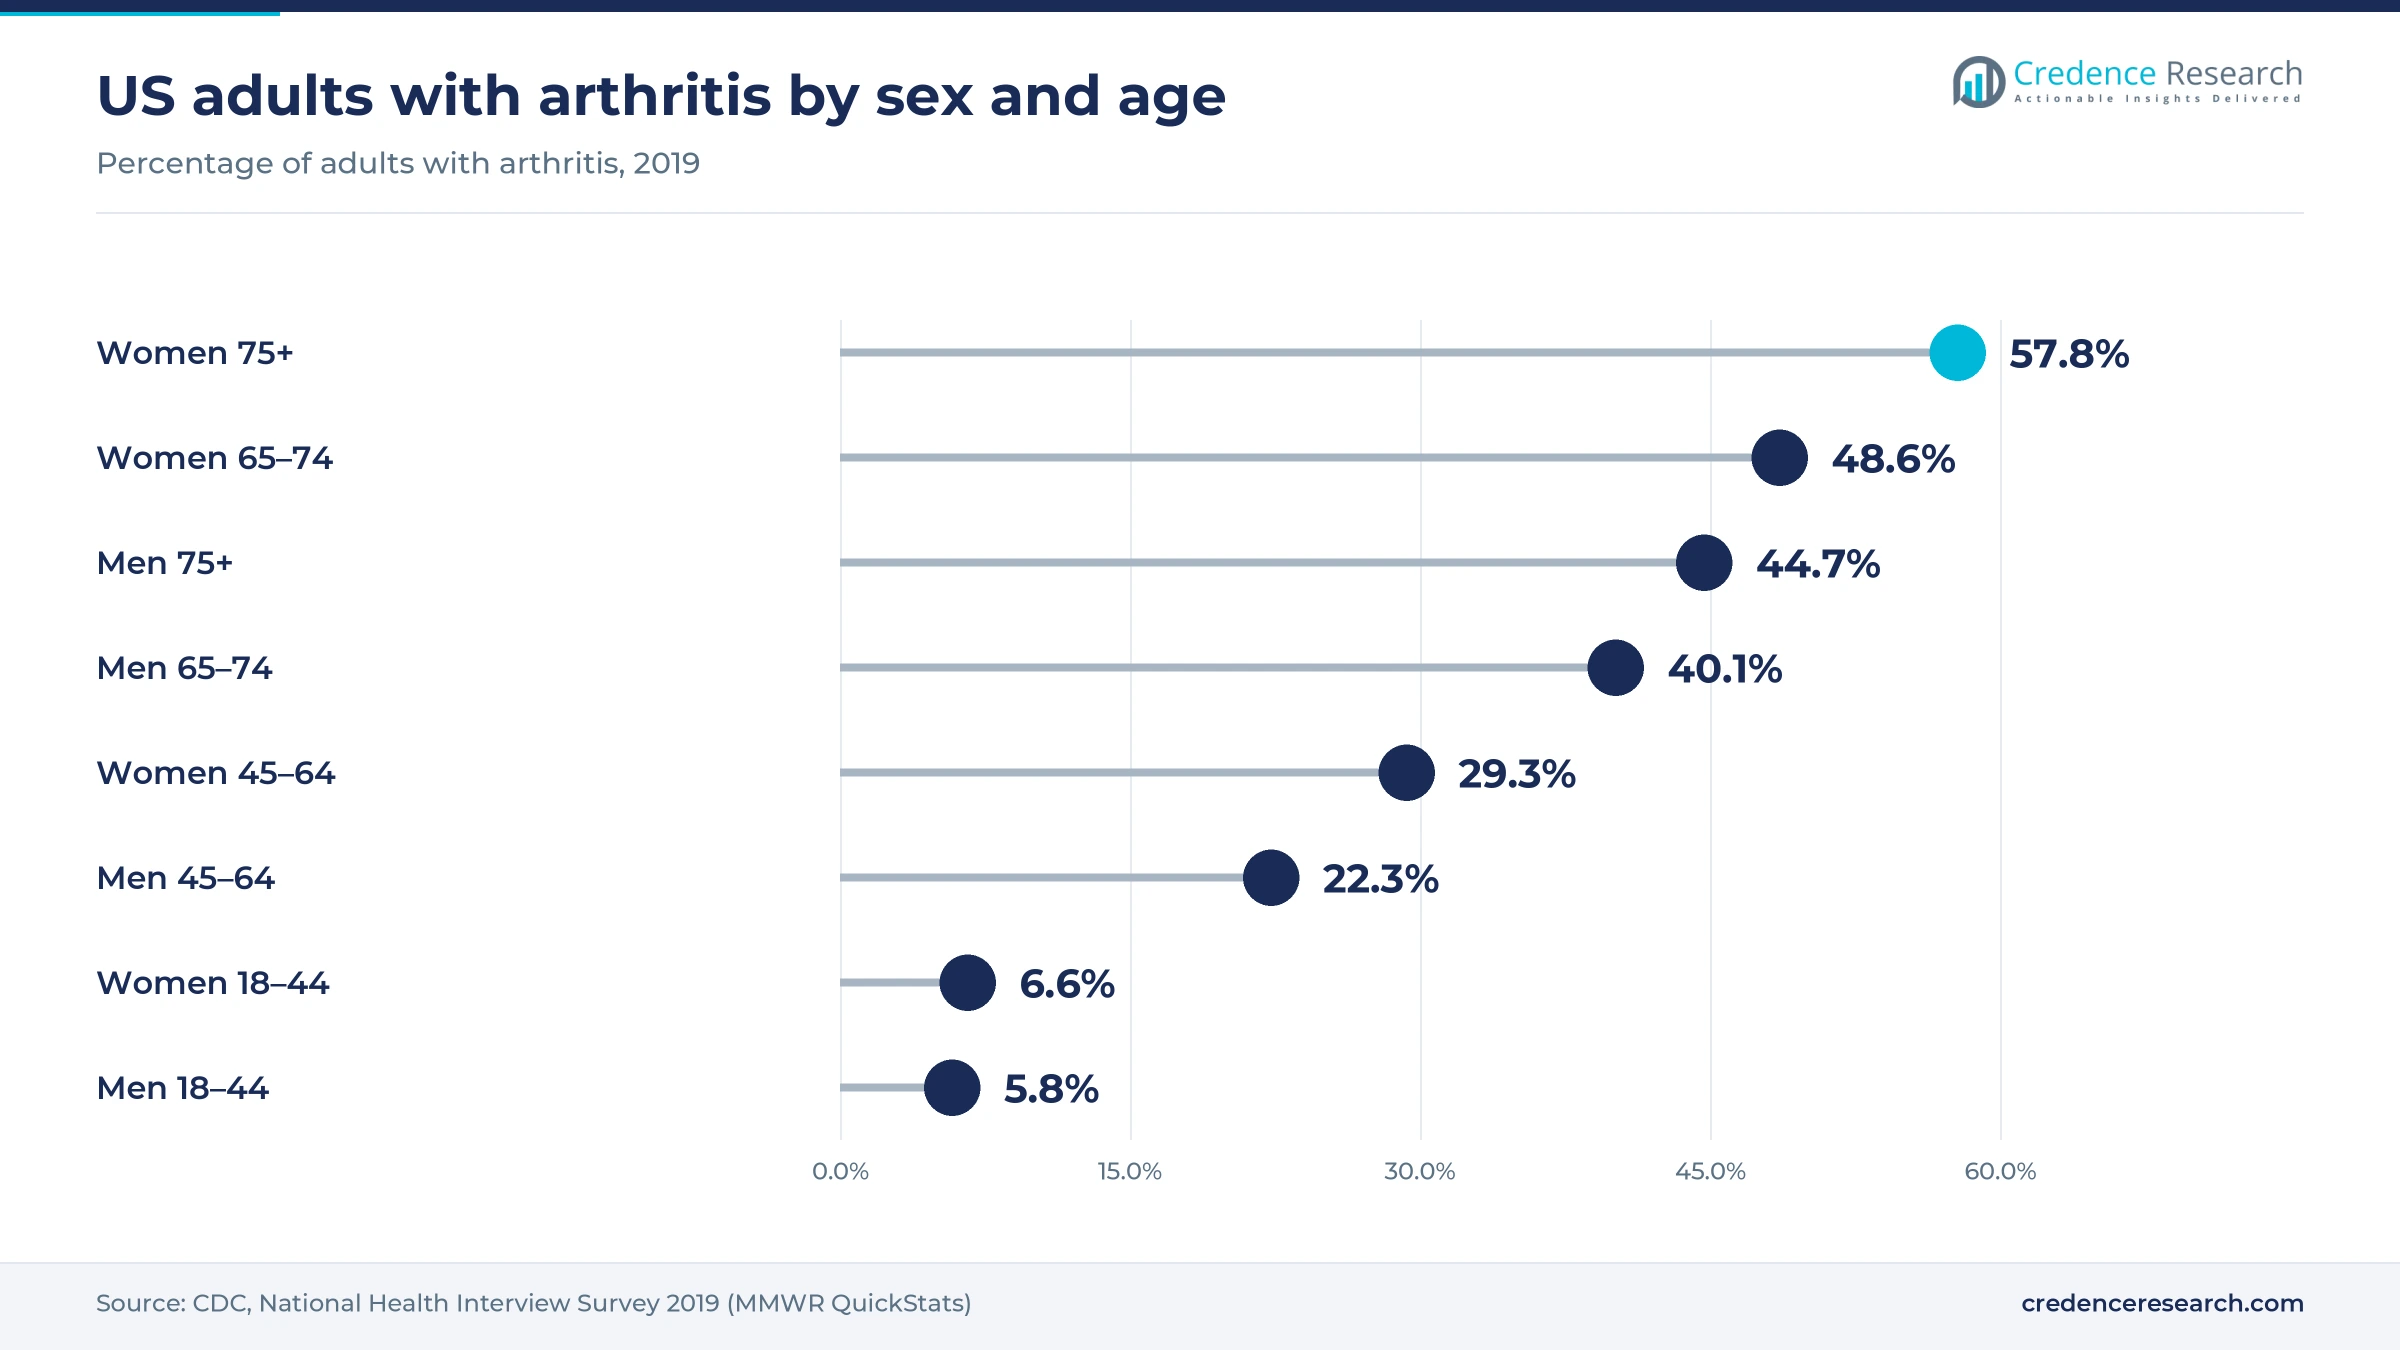
Population aging raises surgical volumes, because bone and joint disease becomes more common with each decade of life. WHO projects that by 2030, 1 in 6 people worldwide will be aged 60 or over, and the number aged 80 or older will triple between 2020 and 2050 to 426 million. Older patients also face more fragility fractures, which need plates, nails and screws. In the United States, national survey data for 2019 show that 57.8% of women aged 75 or older had arthritis, compared with 6.6% of women aged 18 to 44. As a result, demand rises fastest in the oldest age groups, where joint replacement and fracture repair are most common.
How does back pain drive spinal implant demand?
Back pain drives spinal implant demand, because degenerative spine disease is a leading cause of disability. WHO estimates that low back pain affected 619 million people in 2020, and cases could reach 843 million by 2050. Most patients receive conservative care, but those with instability, deformity or nerve compression may need fusion surgery with spinal implants. Spine accounts for a large share of site value, behind knee and hip work. In turn, new navigation and robotic tools are making complex spine surgery more predictable, which supports wider adoption. In March 2025, Stryker said it had completed its first Mako Spine cases, which shows how robotic guidance is moving from joints into spine work.
Why do robotic systems raise spending per procedure?
Robotic systems raise spending per procedure, because hospitals buy capital equipment and linked implant systems together. In March 2025, Stryker said more than 1.5 million Mako procedures had been performed in 45 countries, and it made its fourth-generation Mako 4 system commercially available. Mako 4 covers total hip, total knee, partial knee and spine applications, and Stryker completed first Mako Spine cases in October 2024. In October 2025, Zimmer Biomet completed its acquisition of Monogram Technologies, a developer of autonomous robotic knee surgery. As a result, robots tie hospitals to a single implant supplier for many years, which raises the value of each installed system.
Robotics, outpatient surgery and deals reshape the field
How are payment models shifting joint surgery decisions?
Payment models are shifting joint surgery decisions, because hospitals now carry more financial risk for whole episodes of care. The Transforming Episode Accountability Model began on Jan. 1, 2026, and runs for five years as a mandatory, episode-based program. It covers lower extremity joint replacement, surgical hip and femur fracture treatment and spinal fusion, along with 2 other surgical episodes. Hospitals in the model are rewarded for lower total cost and better outcomes after surgery. As a result, buyers compare implant prices, readmission rates and recovery times more closely, and same-day surgery gains ground in many hospital systems. Suppliers that share outcome data with hospitals gain an edge in these contract talks.
Why are focused acquisitions rising among large suppliers?
Focused acquisitions are rising among large suppliers, because companies want leadership in faster-growing joint and extremity niches. In April 2025, Zimmer Biomet completed its acquisition of Paragon 28, a company focused exclusively on foot and ankle care. In January 2024, Enovis closed its purchase of LimaCorporate, adding shoulder implants and revision offerings in extremities. In October 2025, Johnson & Johnson announced plans to separate DePuy Synthes into a standalone company serving upwards of 7 million patients a year. In turn, foot and ankle implants grow at 4.95% a year, the fastest site and other large suppliers are reviewing their own portfolios for similar moves.
Can outpatient joint surgery open new demand?
Suppliers have a clear opening in outpatient joint surgery, because surgery centers need compact instrument sets, efficient implant systems and fast recovery protocols. Hospitals still held 55.0% of 2025 value, but ambulatory care centers grow fastest at 5.18% a year. The TEAM model, which began on Jan. 1, 2026, adds pressure on hospitals to shorten stays for patients who need osteoarthritis treatment through knee and hip replacement. Stryker also kept Mako Shoulder in limited market release through 2025, which brings robotic planning to more shoulder cases. As a result, suppliers that support same-day discharge can win new accounts, especially among surgeon-owned centers that buy directly.
Where can sports medicine and arthroscopy add demand?
Sports medicine gives suppliers room to add demand, because active adults want faster return to work and sport after injury. Arthroscopy allows surgeons to repair ligaments, tendons and cartilage through small incisions with shorter recovery. Arthrex, Inc., Smith+Nephew and CONMED Corporation compete with instruments, anchors and visualization systems in this area. In January 2024, Enovis also expanded in extremities through its LimaCorporate purchase, which included shoulder products for active patients. In 2019, 22.3% of U.S. men aged 45 to 64 reported arthritis, according to CDC survey data, and many of these adults still want active lifestyles. In turn, arthroscopy instruments and orthobiologics, which grow fastest among products at 4.91% a year, can outpace the overall market.
Pricing, payment reform and recalls pressure suppliers
Why does pricing pressure squeeze implant margins?
Pricing pressure squeezes implant margins, because hospitals, group purchasing organizations and public tenders push for lower costs on standard implants. Volume-based procurement in China has cut prices sharply for joint and spine products. Bundled payments in the United States also cap the money available for each procedure. As a result, suppliers rely on enabling technology, service and broader portfolios to protect their pricing.
How do episode payment rules raise risk for hospitals?
Episode payment rules raise risk for hospitals, because they become responsible for costs well after the operation ends. Readmissions, complications and long rehabilitation stays now affect hospital payments directly. Smaller hospitals may lack the data and care coordination tools needed to manage this risk. In turn, some delay purchases of premium implants or capital equipment until savings are proven in their own settings.
Why do recalls and regulatory demands slow product entry?
Recalls and regulatory demands slow product entry, because implants stay in the body for many years and failures affect patients deeply. Regulators in the United States and Europe require stronger clinical evidence and post-market tracking than in the past. The European Union medical device regulation has raised documentation work for older products. As a result, some smaller suppliers withdraw products instead of paying for new studies.
How do surgeon and staff shortages limit procedure growth?
Surgeon and staff shortages limit procedure growth, because joint and spine operations need trained surgeons, anesthesia teams and nurses. Many low and middle-income countries have too few orthopedic surgeons for their aging populations. Waiting lists for hip and knee surgery remain long in several public health systems. In turn, suppliers invest in training programs, robotic guidance and simplified instruments to raise surgical capacity.
North America leads as Asia Pacific gains pace
| Region | Value, 2025 (USD billion) | Share, 2025 | CAGR, 2026–2035 |
|---|---|---|---|
| North America | 21.85 | 42.0% | 3.76% |
| Europe | 14.04 | 27.0% | 3.56% |
| Asia Pacific | 10.92 | 21.0% | 5.26% |
| Latin America | 3.12 | 6.0% | 4.56% |
| Middle East & Africa | 2.08 | 4.0% | 4.66% |
Why do U.S. procedure volumes keep North America in the lead?
North America held a 42.0% share of 2025 value and grows at 3.76% a year through 2035. The United States drives this position, because hospitals and surgery centers perform large volumes of joint, spine and trauma procedures with premium implants. Robotic systems from Stryker, Zimmer Biomet and others are widely installed, and Stryker launched Mako 4 there in 2025. The TEAM payment model, which began in January 2026, pushes buyers to weigh outcomes and cost together.
How do European tenders shape implant purchases?
Europe held a 27.0% share of 2025 value and grows at 3.56% a year, the slowest pace of the five regions. Germany, France, Italy and the United Kingdom account for much of the spending, and suppliers such as B. Braun SE and Institut Straumann AG are based in the region. However, public tenders, joint registries and long waiting lists keep value growth below the global average.
Why do China and India drive Asia Pacific growth?
Asia Pacific held a 21.0% share of 2025 value and is the fastest-growing region at 5.26% a year. China and India are expanding hospital capacity and joint replacement access, while Japan and South Korea have large aging populations. Local makers such as OSSTEM IMPLANT CO., LTD. and Narang Medical Limited compete on price with global brands. This mix of volume growth and local supply keeps average prices lower.
Why are private hospitals lifting Latin American demand?
Latin America held a 6.0% share of 2025 value and grows at 4.56% a year through 2035. Brazil and Mexico lead regional spending, because private hospitals and insurers are expanding joint and trauma surgery. Road injuries also keep fixation demand steady across the region.
Why does the Middle East and Africa remain a small market?
The Middle East and Africa held a 4.0% share of 2025 value and grows at 4.66% a year through 2035. Gulf states fund modern orthopedic hospitals, while much of Africa has few specialist surgeons. This gap limits implant use outside major cities and private centers.
Acquisitions, launches and spinoffs since 2024
| Development | Status and market relevance |
|---|---|
| In January 2024, Enovis closed its acquisition of LimaCorporate, adding shoulder and revision implant offerings. | Completed; strengthens Enovis in the extremities market |
| In March 2025, Stryker made its Mako 4 robotic system commercially available and reported more than 1.5 million Mako procedures. | Launched; covers hip, knee, partial knee and spine applications |
| In April 2025, Zimmer Biomet completed its acquisition of Paragon 28, a foot and ankle company. | Completed; expands Zimmer Biomet in foot and ankle care |
| In October 2025, Zimmer Biomet completed its acquisition of Monogram Technologies. | Completed; adds semi-autonomous and autonomous robotic knee technology |
| In October 2025, Johnson & Johnson announced its intent to separate its orthopaedics business as DePuy Synthes. | Announced; creates a standalone company focused on musculoskeletal care |
Robotic guidance, 3D printing and biologics advance
- Robotic surgical guidance plans and positions implants with high accuracy, which helps surgeons reduce variation in knee, hip and spine cases.
- 3D-printed porous implants allow bone to grow into the implant surface, which supports fixation in spine and revision joint surgery.
- Orthobiologic materials support bone healing and spinal fusion, which reduces the need for bone taken from the patient.
- Patient-specific planning software builds surgical plans from imaging scans, which shortens operating time and improves implant fit.
- Connected recovery tools track patient mobility after surgery, which helps hospitals manage outcomes under episode payment models.
Need a Custom Version of This Report?
Tailor the scope, geography, or segments to your exact requirements.
- Custom geography or segment scope
- Direct access to our analyst team
Musculoskeletal suppliers compete on robots and breadth
Competition is led by a group of large musculoskeletal companies with broad implant portfolios and robotic platforms. Stryker, Zimmer Biomet, Smith+Nephew and Medtronic compete in joint replacement, trauma, spine and enabling technology. Globus Medical, which combined with NuVasive, Inc., focuses on spine implants and navigation. Enovis Corporation competes in joint reconstruction, extremities and bracing, and the German group B. Braun SE supplies joint implants, while Arthrex, Inc. and CONMED Corporation lead in sports medicine and arthroscopy. Integra LifeSciences Corporation adds biologic, nerve repair and extremity products to the field. Institut Straumann AG and OSSTEM IMPLANT CO., LTD. supply dental and maxillofacial implants, and Narang Medical Limited serves price-sensitive markets. As a result, buyers favor suppliers that combine implants, robots and service.
Companies profiled and their roles in this market
| Company | Type | Role in the market |
|---|---|---|
| Stryker | Diversified | Joint replacement, trauma and Mako robotic systems |
| Zimmer Biomet | Specialist | Knee, hip and foot and ankle implants with ROSA robotics |
| Smith+Nephew | Diversified | Joint replacement, sports medicine and CORI robotics |
| Medtronic | Diversified | Spine implants, navigation and enabling technology |
| Globus Medical | Specialist | Spine, trauma and robotic navigation after the NuVasive merger |
| Enovis Corporation | Specialist | Joint reconstruction, extremities and bracing |
| B. Braun SE | Diversified | Joint replacement and surgical instruments |
| Arthrex, Inc. | Specialist | Sports medicine and arthroscopy |
| CONMED Corporation | Diversified | Arthroscopy and sports medicine instruments |
| Integra LifeSciences Corporation | Diversified | Biologic and extremity products |
| Institut Straumann AG | Specialist | Dental and maxillofacial implants |
| OSSTEM IMPLANT CO., LTD. | Specialist | Dental implants |
| Narang Medical Limited | Specialist | Orthopedic implants and supports for price-sensitive markets |
| NuVasive, Inc. | Specialist | Spine products, now part of Globus Medical |
Outpatient joint surgery sets the growth pace
Credence Research's view is that outpatient joint surgery will set the pace of growth through 2035, because payers and surgeons want shorter stays and predictable costs. The overall market grows at 4.12% a year, supported by aging, arthritis and back pain. Robotic systems and orthobiologics grow faster than standard trauma products as hospitals invest in outcomes. Companies that combine implant breadth, enabling technology and same-day surgery support will win the most hospital and surgery center contracts.
How Credence Research sized musculoskeletal implants
The report uses 2025 as the base year and 2026 to 2035 as the forecast period. Market values come from the Credence Research model, which builds spending by product, site, end user and region. Regional and segment splits are Credence Research estimates informed by World Health Organization and U.S. government statistics, SEC filings and company press releases. No primary interviews or surveys were used in preparing this edition of the report.
Musculoskeletal implant outlook to 2035
By 2035, the orthopedic devices market is projected to reach USD 77.86 billion, with growth led by joint replacement, spine care and orthobiologics. Replacement devices will remain the largest product area, while foot, ankle and shoulder work expands fastest by site. North America keeps the highest spending per procedure, and Asia Pacific adds the most new patients. Routine joint surgery will move further into ambulatory care centers under episode payment models. As a result, advantage will depend on robots, implant breadth and service.
Frequently Asked Questions
How big is the global orthopedic devices market?
Which product leads the orthopedic devices market?
Which region leads spending on musculoskeletal implants?
Which body site accounts for most implant value?
How is U.S. payment reform affecting joint surgery?
What recent deals affect musculoskeletal implant suppliers?
Who are the leading orthopedic device companies?
What restrains growth in musculoskeletal implants?
Table of Content
Chapter 1 Market Segmentation
- 1.1 Segmentation Framework
- 1.1.1 Product and Service Classification
- 1.1.2 Application and End-Use Classification
- 1.1.3 Technology and Solution Classification
- 1.1.4 Customer and Distribution Channel Classification
- 1.1.5 Geographic Segmentation
- 1.1.6 Market Segment Definitions and Boundaries
- 1.2 By Product
- 1.2.1 Orthopedic Replacement Devices
- 1.2.2 Spinal Implants and Surgical Devices
- 1.2.3 Orthopedic Fixation Devices
- 1.2.4 Orthopedic Braces and Support Products
- 1.2.5 Arthroscopy Instruments
- 1.2.6 Orthobiologics
- 1.2.7 Bone Graft Substitutes
- 1.2.8 Orthopedic Prosthetics
- 1.3 By Site
- 1.3.1 Knee and Thigh Implants
- 1.3.2 Hip Implants
- 1.3.3 Spine
- 1.3.4 Shoulder
- 1.3.5 Foot and Ankle Implants
- 1.3.6 Hand and Wrist
- 1.3.7 Arm and Elbow
- 1.3.8 Craniomaxillofacial Implants
- 1.3.9 Others
- 1.4 By End User
- 1.4.1 Hospitals
- 1.4.2 Ambulatory Care Centers
- 1.4.3 Orthopedic Centers
- 1.4.4 Specialized Clinics
- 1.4.5 Home Care Settings
- 1.4.6 Others
Chapter 2 Introduction
- 2.1 Report Objectives and Scope
- 2.2 Product Definition and Industry Terminology
- 2.3 Market Inclusions and Exclusions
- 2.4 Research Process
- 2.4.1 Primary Research and Expert Interviews
- 2.4.2 Secondary Research and Source Review
- 2.4.3 Top-Down and Bottom-Up Estimation
- 2.4.4 Data Triangulation and Verification
- 2.5 Market Size Measurement Basis
- 2.5.1 2025: USD 52.01 billion → 2035: USD 77.86 billion
- 2.6 Historical and Forecast Reference Periods
- 2.6.1 Historical Period: 2018-2025
- 2.6.2 Base Year: 2025
- 2.6.3 Forecast Period: 2025-2035
- 2.7 Research Assumptions and Limitations
Chapter 3 Executive Summary
- 3.1 Market Snapshot and Key Findings
- 3.2 Base-Year Market Size, 2025
- 3.3 Forecast Market Size, 2035
- 3.4 Revenue and Volume Growth Outlook
- 3.5 Key Demand and Supply Indicators
- 3.6 Leading Market Segments
- 3.7 Fastest-Growing Market Opportunities
- 3.8 Regional Performance Highlights
- 3.9 Technology and Industry Transformation
- 3.10 Competitive Landscape Summary
- 3.11 Analyst View and Strategic Implications
Chapter 4 Global Orthopedic Devices Market Trends and Developments
- 4.1 Historical Industry Development, 2018-2025
- 4.2 Recent Market Trends and Developments
- 4.3 Demand and Customer Behavior Trends
- 4.4 Technology and Product Innovation
- 4.5 Artificial Intelligence, Automation and Digitalization
- 4.6 Local Manufacturing and Supply Chain Realignment
- 4.7 Industry Partnerships, Mergers and Acquisitions
- 4.8 Sustainability and Circular Economy Developments
- 4.9 Government and Private Sector Investment Trends
- 4.10 Emerging Business Models and Commercialization
- 4.11 Industry Developments and Announcements
Chapter 5 Global Orthopedic Devices Market Production, Supply and Demand Analysis
- 5.1 Demand Trend and Consumption Analysis, 2018-2025
- 5.2 Demand Forecast, 2025-2035
- 5.3 Production and Output Trend, 2018-2025
- 5.4 Production and Output Forecast, 2025-2035
- 5.5 Installed Capacity and Capacity Utilization
- 5.6 Company-Wise Production Plants and Statistics
- 5.6.1 Installed Production Capacity
- 5.6.2 Actual Production
- 5.6.3 Planned Capacity and Expansion Targets
- 5.7 Supply Chain Structure and Procurement Trends
- 5.8 Supply-Demand Gap and Bottlenecks
- 5.9 Import Dependence and Sourcing Structure
- 5.10 Contract Manufacturing and Outsourcing
- 5.11 Regional Supply and Demand Concentration
Chapter 6 Global Orthopedic Devices Market Pricing Analysis
- 6.1 Pricing Structure and Measurement
- 6.2 Historical Pricing Trends, 2018-2025
- 6.3 Pricing Outlook, 2025-2035
- 6.4 Average Selling Price and Unit Economics
- 6.5 Pricing by Product and Market Segment
- 6.6 Geographic Pricing Differences
- 6.7 Key Input, Energy, Labor and Logistics Costs
- 6.8 Contract Pricing and Purchasing Models
- 6.9 Pricing Sensitivity and Competitive Positioning
- 6.10 Price, Margin and Profitability Implications
Chapter 7 Global Orthopedic Devices Market Dynamics
- 7.1 Market Growth Drivers
- 7.1.1 Demand-Side Drivers
- 7.1.2 Technology and Innovation Drivers
- 7.1.3 Infrastructure and Investment Drivers
- 7.1.4 Regulatory and Policy Drivers
- 7.2 Market Restraints
- 7.2.1 Cost and Affordability Constraints
- 7.2.2 Technology and Adoption Barriers
- 7.2.3 Supply Chain and Operational Constraints
- 7.3 Market Challenges
- 7.3.1 Competitive Pressure and Margin Erosion
- 7.3.2 Skills, Infrastructure and Implementation Gaps
- 7.4 Emerging Market Opportunities
- 7.5 Market Dynamics Impact and Time-Horizon Assessment
Chapter 8 Global Orthopedic Devices Value Chain Analysis
- 8.1 Industry Value Chain Overview
- 8.2 Upstream Suppliers and Critical Inputs
- 8.3 Technology and Component Providers
- 8.4 Manufacturing or Service Delivery
- 8.5 Distribution, Channel Partners and Integrators
- 8.6 Downstream Applications and End Users
- 8.7 Value Addition and Profit Pools
- 8.8 Vertical Integration and Outsourcing
- 8.9 Supplier Concentration and Risk
- 8.10 Supply Chain Localization and Resilience
Chapter 9 Global Orthopedic Devices Market Regulations and Policies
- 9.1 Relevant Laws, Standards and Compliance Frameworks
- 9.2 Product, Service, Safety and Quality Requirements
- 9.3 Government Policies, Incentives and Subsidies
- 9.4 Imports, Exports and Trade Barriers
- 9.5 Public Procurement and Local Content Requirements
- 9.6 Environmental and Sustainability Compliance
- 9.7 Upcoming Policy Changes and Market Implications
Chapter 10 Global Orthopedic Devices Market Hotspots and Opportunities
- 10.1 Market Opportunity Mapping and Growth Hotspots
- 10.2 High-Growth Applications and Customer Groups
- 10.3 Underserved Markets and White-Space Opportunities
- 10.4 Emerging Technology and Product Opportunities
- 10.5 New Capacity and Investment Hotspots
- 10.6 Market Entry and Expansion Opportunities
- 10.7 Distribution and Partnership Opportunities
- 10.8 Near-Term and Long-Term Commercial Potential
- 10.9 Opportunity Attractiveness and Execution Risks
Chapter 11 Global Orthopedic Devices Market Outlook, 2025-2035
- 11.1 Market Size and Analysis
- 11.1.1 Revenue (Market Measurement: 2025: USD 52.01 billion → 2035: USD 77.86 billion)
- 11.1.2 Market Volume and Quantity Sold
- 11.1.3 Historical Market Size, 2018-2025
- 11.1.4 Base-Year Market Size, 2025
- 11.2 Market Forecast, 2025-2035
- 11.2.1 Revenue Forecast to 2035
- 11.2.2 Volume Forecast to 2035
- 11.2.3 CAGR and Year-on-Year Growth
- 11.2.4 Incremental Revenue Opportunity
- 11.3 Forecast Assumptions and Scenario Analysis
- 11.3.1 Base-Case Forecast
- 11.3.2 Optimistic and Conservative Scenarios
- 11.3.3 Technology, Pricing and Policy Sensitivities
- 11.4 Market Attractiveness and Growth Outlook
Chapter 12 Global Orthopedic Devices Market Segmentation and Outlook
- 12.1 Segmentation Summary and Market Shares, 2025
- 12.2 Largest and Fastest-Growing Segments
- 12.3 By Product - Market Size and Forecast, 2025-2035
- 12.3.1 Segment Definition and Scope
- 12.3.2 Historical Market Size, 2018-2025
- 12.3.3 Revenue Forecast, 2025-2035
- 12.3.4 Volume Forecast, 2025-2035
- 12.3.5 Base-Year Market Share, 2025
- 12.3.6 Segment CAGR and Growth Drivers
- 12.3.7 Subsegment Market Size and Forecast
- 12.3.7.1 Orthopedic Replacement Devices
- 12.3.7.2 Spinal Implants and Surgical Devices
- 12.3.7.3 Orthopedic Fixation Devices
- 12.3.7.4 Orthopedic Braces and Support Products
- 12.3.7.5 Arthroscopy Instruments
- 12.3.7.6 Orthobiologics
- 12.3.7.7 Bone Graft Substitutes
- 12.3.7.8 Orthopedic Prosthetics
- 12.3.8 Subsegment Pricing and Adoption Trends
- 12.3.9 Leading Suppliers and Competition
- 12.3.10 Regional Demand and Opportunities
- 12.4 By Site - Market Size and Forecast, 2025-2035
- 12.4.1 Segment Definition and Scope
- 12.4.2 Historical Market Size, 2018-2025
- 12.4.3 Revenue Forecast, 2025-2035
- 12.4.4 Volume Forecast, 2025-2035
- 12.4.5 Base-Year Market Share, 2025
- 12.4.6 Segment CAGR and Growth Drivers
- 12.4.7 Subsegment Market Size and Forecast
- 12.4.7.1 Knee and Thigh Implants
- 12.4.7.2 Hip Implants
- 12.4.7.3 Spine
- 12.4.7.4 Shoulder
- 12.4.7.5 Foot and Ankle Implants
- 12.4.7.6 Hand and Wrist
- 12.4.7.7 Arm and Elbow
- 12.4.7.8 Craniomaxillofacial Implants
- 12.4.7.9 Others
- 12.4.8 Subsegment Pricing and Adoption Trends
- 12.4.9 Leading Suppliers and Competition
- 12.4.10 Regional Demand and Opportunities
- 12.5 By End User - Market Size and Forecast, 2025-2035
- 12.5.1 Segment Definition and Scope
- 12.5.2 Historical Market Size, 2018-2025
- 12.5.3 Revenue Forecast, 2025-2035
- 12.5.4 Volume Forecast, 2025-2035
- 12.5.5 Base-Year Market Share, 2025
- 12.5.6 Segment CAGR and Growth Drivers
- 12.5.7 Subsegment Market Size and Forecast
- 12.5.7.1 Hospitals
- 12.5.7.2 Ambulatory Care Centers
- 12.5.7.3 Orthopedic Centers
- 12.5.7.4 Specialized Clinics
- 12.5.7.5 Home Care Settings
- 12.5.7.6 Others
- 12.5.8 Subsegment Pricing and Adoption Trends
- 12.5.9 Leading Suppliers and Competition
- 12.5.10 Regional Demand and Opportunities
- 12.6 Segment Growth Comparison
- 12.7 Segment Attractiveness and Priority Matrix
Chapter 13 Global Orthopedic Devices End-Use and Application Market Outlook
- 13.1 End-Use Industry and Customer Demand Structure
- 13.2 Leading Applications and Customer Groups
- 13.3 End-Use Market Size, Share and Forecast
- 13.4 Major End-Use Industry Deep Dives
- 13.4.1 Customer Requirements and Use Cases
- 13.4.2 Demand and Replacement Cycles
- 13.4.3 Technical and Regulatory Considerations
- 13.4.4 Purchasing and Procurement Models
- 13.4.5 Leading Vendors and Distribution Channels
- 13.4.6 Forecast and Commercial Opportunities
- 13.5 Emerging Applications and Cross-Segment Demand
- 13.6 End-Use Industry Investment Priorities
Chapter 14 Global Orthopedic Devices Geographic Market Outlook, 2025-2035
- 14.1 Regional Market Size and Share, 2025
- 14.2 Regional Market Forecast, 2025-2035
- 14.3 Regional Pricing, Production and Demand Differences
- 14.4 North America
- 14.4.1 United States
- 14.4.2 Canada
- 14.4.3 Mexico
- 14.5 Europe
- 14.5.1 Germany
- 14.5.2 France
- 14.5.3 Italy
- 14.5.4 United Kingdom
- 14.5.5 Spain
- 14.5.6 Poland
- 14.5.7 Russia
- 14.5.8 Netherlands
- 14.5.9 Belgium
- 14.5.10 Sweden
- 14.5.11 Denmark
- 14.5.12 Norway
- 14.5.13 Rest of Europe
- 14.6 Asia Pacific
- 14.6.1 China
- 14.6.2 India
- 14.6.3 Japan
- 14.6.4 South Korea
- 14.6.5 Thailand
- 14.6.6 Indonesia
- 14.6.7 Vietnam
- 14.6.8 Malaysia
- 14.6.9 Australia
- 14.6.10 Rest of Asia Pacific
- 14.7 Latin America
- 14.7.1 Brazil
- 14.7.2 Argentina
- 14.7.3 Colombia
- 14.7.4 Chile
- 14.7.5 Rest of Latin America
- 14.8 Middle East
- 14.8.1 Saudi Arabia
- 14.8.2 United Arab Emirates
- 14.8.3 Turkey
- 14.8.4 Israel
- 14.8.5 Iran
- 14.8.6 Rest of the Middle East
- 14.9 Africa
- 14.9.1 South Africa
- 14.9.2 Egypt
- 14.9.3 Nigeria
- 14.9.4 Morocco
- 14.9.5 Rest of Africa
- 14.10 Regional Investment, Policy and Supply Chain Differences
- 14.11 Regional Competitive Landscape
- 14.12 Geographic Growth Hotspots
Chapter 15 Global Orthopedic Devices Technology, Innovation and Sustainability Outlook
- 15.1 Technology Landscape and Maturity
- 15.2 Product, Process and Service Innovation
- 15.3 AI, Automation and Digital Tools in the Industry
- 15.4 Technology Adoption and Performance Benchmarking
- 15.5 Innovation Pipeline and R&D Investment
- 15.6 Patent and Intellectual Property Trends
- 15.7 Energy Efficiency and Resource Management
- 15.8 Sustainability, Recycling and Circularity
- 15.9 Technology Roadmap, 2025-2035
- 15.10 Risks of Obsolescence and Technology Substitution
Chapter 16 Global Orthopedic Devices Market Key Strategic Imperatives
- 16.1 Growth and Market Entry Priorities
- 16.2 High-Return Products and Segments
- 16.3 Pricing, Profitability and Cost Optimization
- 16.4 Technology Investment and Product Differentiation
- 16.5 Supply Chain Localization and Resilience
- 16.6 Distribution and Customer Acquisition
- 16.7 Partnership, Acquisition and Capacity Strategy
- 16.8 Regional Expansion Priorities
- 16.9 Short-, Medium- and Long-Term Actions
Chapter 17 Competition Outlook
- 17.1 Industry Competition Characteristics
- 17.2 Market Structure and Concentration
- 17.3 Market Share and Competitive Positioning, 2025
- 17.4 Company-Wise Revenue and Product Benchmarking
- 17.5 Production and Service Capacity Benchmarking
- 17.6 Technology, Pricing and Differentiation
- 17.7 Regional Footprint and Distribution Strength
- 17.8 Mergers, Acquisitions and Strategic Alliances
- 17.9 New Entrants and Competitive Threats
- 17.10 Porter's Five Forces and Industry Attractiveness
- 17.11 Competitive Outlook, 2025-2035
Chapter 18 Company Profiles
- 18.1 Company Coverage and Selection Criteria
- 18.2 Zimmer Biomet
- 18.2.1 Business Description
- 18.2.2 Company Ownership and Geographic Presence
- 18.2.3 Product and Service Portfolio
- 18.2.4 Manufacturing and Operating Footprint
- 18.2.5 Production Capacity and Expansion Plans
- 18.2.6 Financial Performance and Investment
- 18.2.7 Market Share and Competitive Position
- 18.2.8 Technology and Innovation Capabilities
- 18.2.9 Strategic Alliances or Partnerships
- 18.2.10 Recent Developments
- 18.2.11 Growth Strategy and Outlook
- 18.3 Smith+Nephew
- 18.4 Medtronic
- 18.5 Stryker
- 18.6 B. Braun SE
- 18.7 NuVasive, Inc.
- 18.8 Enovis Corporation
- 18.9 Institut Straumann AG
- 18.10 OSSTEM IMPLANT CO., LTD.
- 18.11 Narang Medical Limited
- 18.12 Globus Medical
- 18.13 Arthrex, Inc.
- 18.14 CONMED Corporation
- 18.15 Integra LifeSciences Corporation
- 18.16 Other Relevant Market Participants
Note: Every listed company is profiled on the structure shown under the first company. The company list is preliminary and may change based on research findings, market developments, data availability and client requirements.
Chapter 19 Disclaimer
- 19.1 Research and Forecast Disclaimer
- 19.2 Data Source and Estimation Limitations
Note: The depth of individual sections depends on data availability for this market. Volume, capacity, trade and other unit-based metrics are included where applicable.

