
Hospital renewal and chronic care lift equipment spending
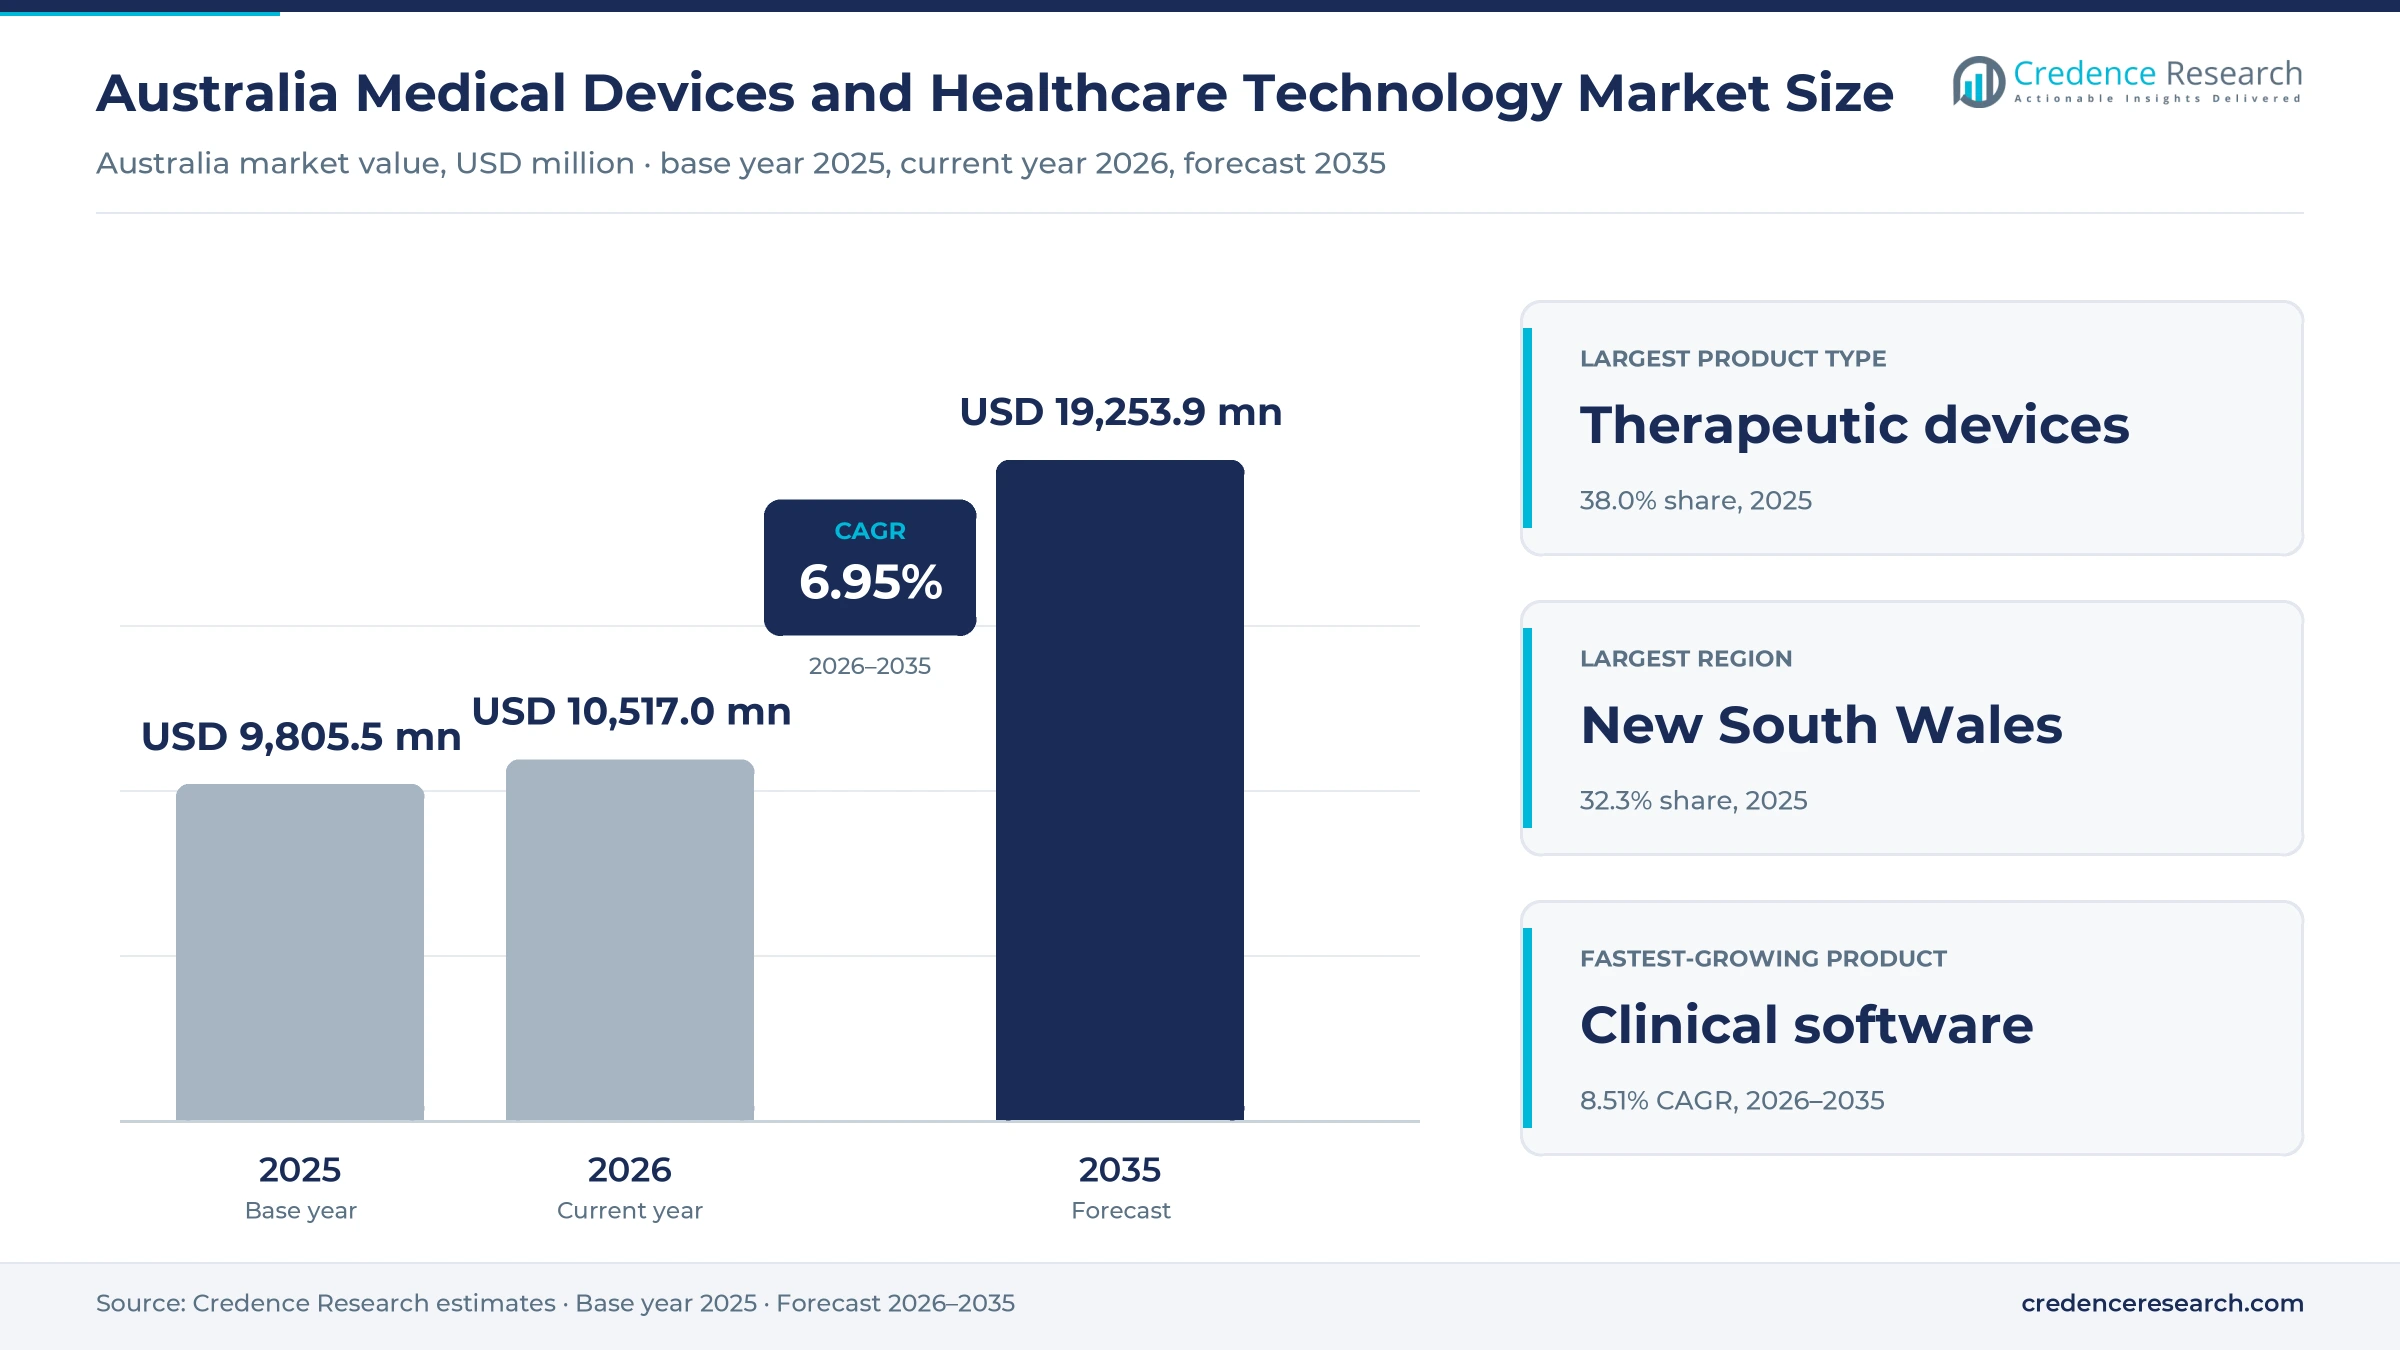
The Australia medical devices and healthcare technology market was valued at USD 9.81 billion in 2025 and is projected to increase from USD 10.52 billion in 2026 to USD 19.25 billion by 2035, registering a CAGR of 6.95% during 2026–2035. Demand comes from public hospitals that replace scanners and surgical systems, private hospitals and clinics that add capacity, community and aged care providers that buy monitoring tools and households that buy glucose sensors and sleep therapy devices. New South Wales held the largest regional share, 32.3% in 2025, because it has the largest population and the largest public hospital network. Queensland is the fastest-growing region at 7.32% a year, as steady migration adds patients to its hospitals. In turn, NSW Health began training staff on a single statewide patient record in November 2025, which links clinical software with hospital equipment.
Which equipment and software does the estimate cover?
The estimate measures the value of diagnostic systems, therapeutic devices, monitoring devices and clinical software sold to hospitals, clinics, aged care providers and households in Australia. Values include public tenders, direct sales to private hospital groups, specialist distribution and retail and online sales of home-use devices.
The estimate excludes medicines, consumables sold without a device, general office software and building works. The value chain runs from global and local manufacturers through regulators, sponsors, distributors and service teams to public health services, private providers, community providers and patients who use devices at home.
Australia Medical Devices and Healthcare Technology Market Insights
- The Australia medical devices and healthcare technology market was valued at USD 9.81 billion in 2025 and is projected to reach USD 19.25 billion by 2035, registering a CAGR of 6.95% during 2026–2035.
- New South Wales held a 32.3% share of 2025 value, because it has the largest population and the largest public hospital network in the country.
- Therapeutic devices led with a 38.0% share of 2025 value, because hospitals spend heavily on surgical, cardiac, respiratory and implantable systems.
- The Victorian Government announced $35 million on July 18, 2025, for 10 equipment projects at eight health services, including CT, MRI and PET/CT units.
- NSW Health plans to run a single digital patient record across more than 220 public hospitals by 2028, replacing nine separate electronic medical records.
Therapeutic devices lead while clinical software rises
Why do therapeutic devices lead product demand?
Based on product type, the market is categorized into diagnostic systems, therapeutic devices, monitoring devices and clinical software. Therapeutic Devices led with a 38.0% share of 2025 value, because hospitals spend heavily on surgical, cardiac, respiratory and implantable systems. Clinical Software grows fastest at 8.51% a year, as state health systems replace older records and link equipment to shared platforms.
Which care settings account for most equipment value?
Based on care setting, the market is categorized into hospital care, ambulatory care, residential care and home care. Hospital Care led with a 58.0% share of 2025 value, because scanners, operating room systems and intensive care equipment sit mainly in hospitals. Home Care grows fastest at 8.27% a year, as subsidized glucose sensors and connected sleep therapy devices move chronic care into homes.
Who buys most clinical equipment and software?
Based on customer type, the market is categorized into public health purchasers, private provider purchasers, community provider purchasers and household purchasers. Public Health Purchasers led with a 52.0% share of 2025 value, because state health departments fund most hospital equipment. Household Purchasers grow fastest at 7.96% a year, as patients buy sensors, masks and home monitors with subsidies and private cover.
How do suppliers sell clinical equipment?
Based on sales channel, the market is categorized into public tender, direct enterprise sales, specialist distribution and retail and digital commerce. Public Tender led with a 47.0% share of 2025 value, because state health systems buy most large equipment through formal tenders. Retail and Digital Commerce grows fastest at 8.06% a year, as pharmacies and online stores sell more home-use devices.
| Segment Group | Leading Sub-segment | Share, 2025 | Fastest-growing Sub-segment | CAGR, 2026–2035 |
|---|---|---|---|---|
| By Product Type | Therapeutic Devices | 38.0% | Clinical Software | 8.51% |
| By Care Setting | Hospital Care | 58.0% | Home Care | 8.27% |
| By Customer Type | Public Health Purchasers | 52.0% | Household Purchasers | 7.96% |
| By Sales Channel | Public Tender | 47.0% | Retail and Digital Commerce | 8.06% |
Request a Free Sample
Fill in your details and we'll send you a free sample report.
- Sample data tables & charts
- Research methodology
Equipment renewal, connected care and records lift demand
How does clinical equipment replacement lift demand?
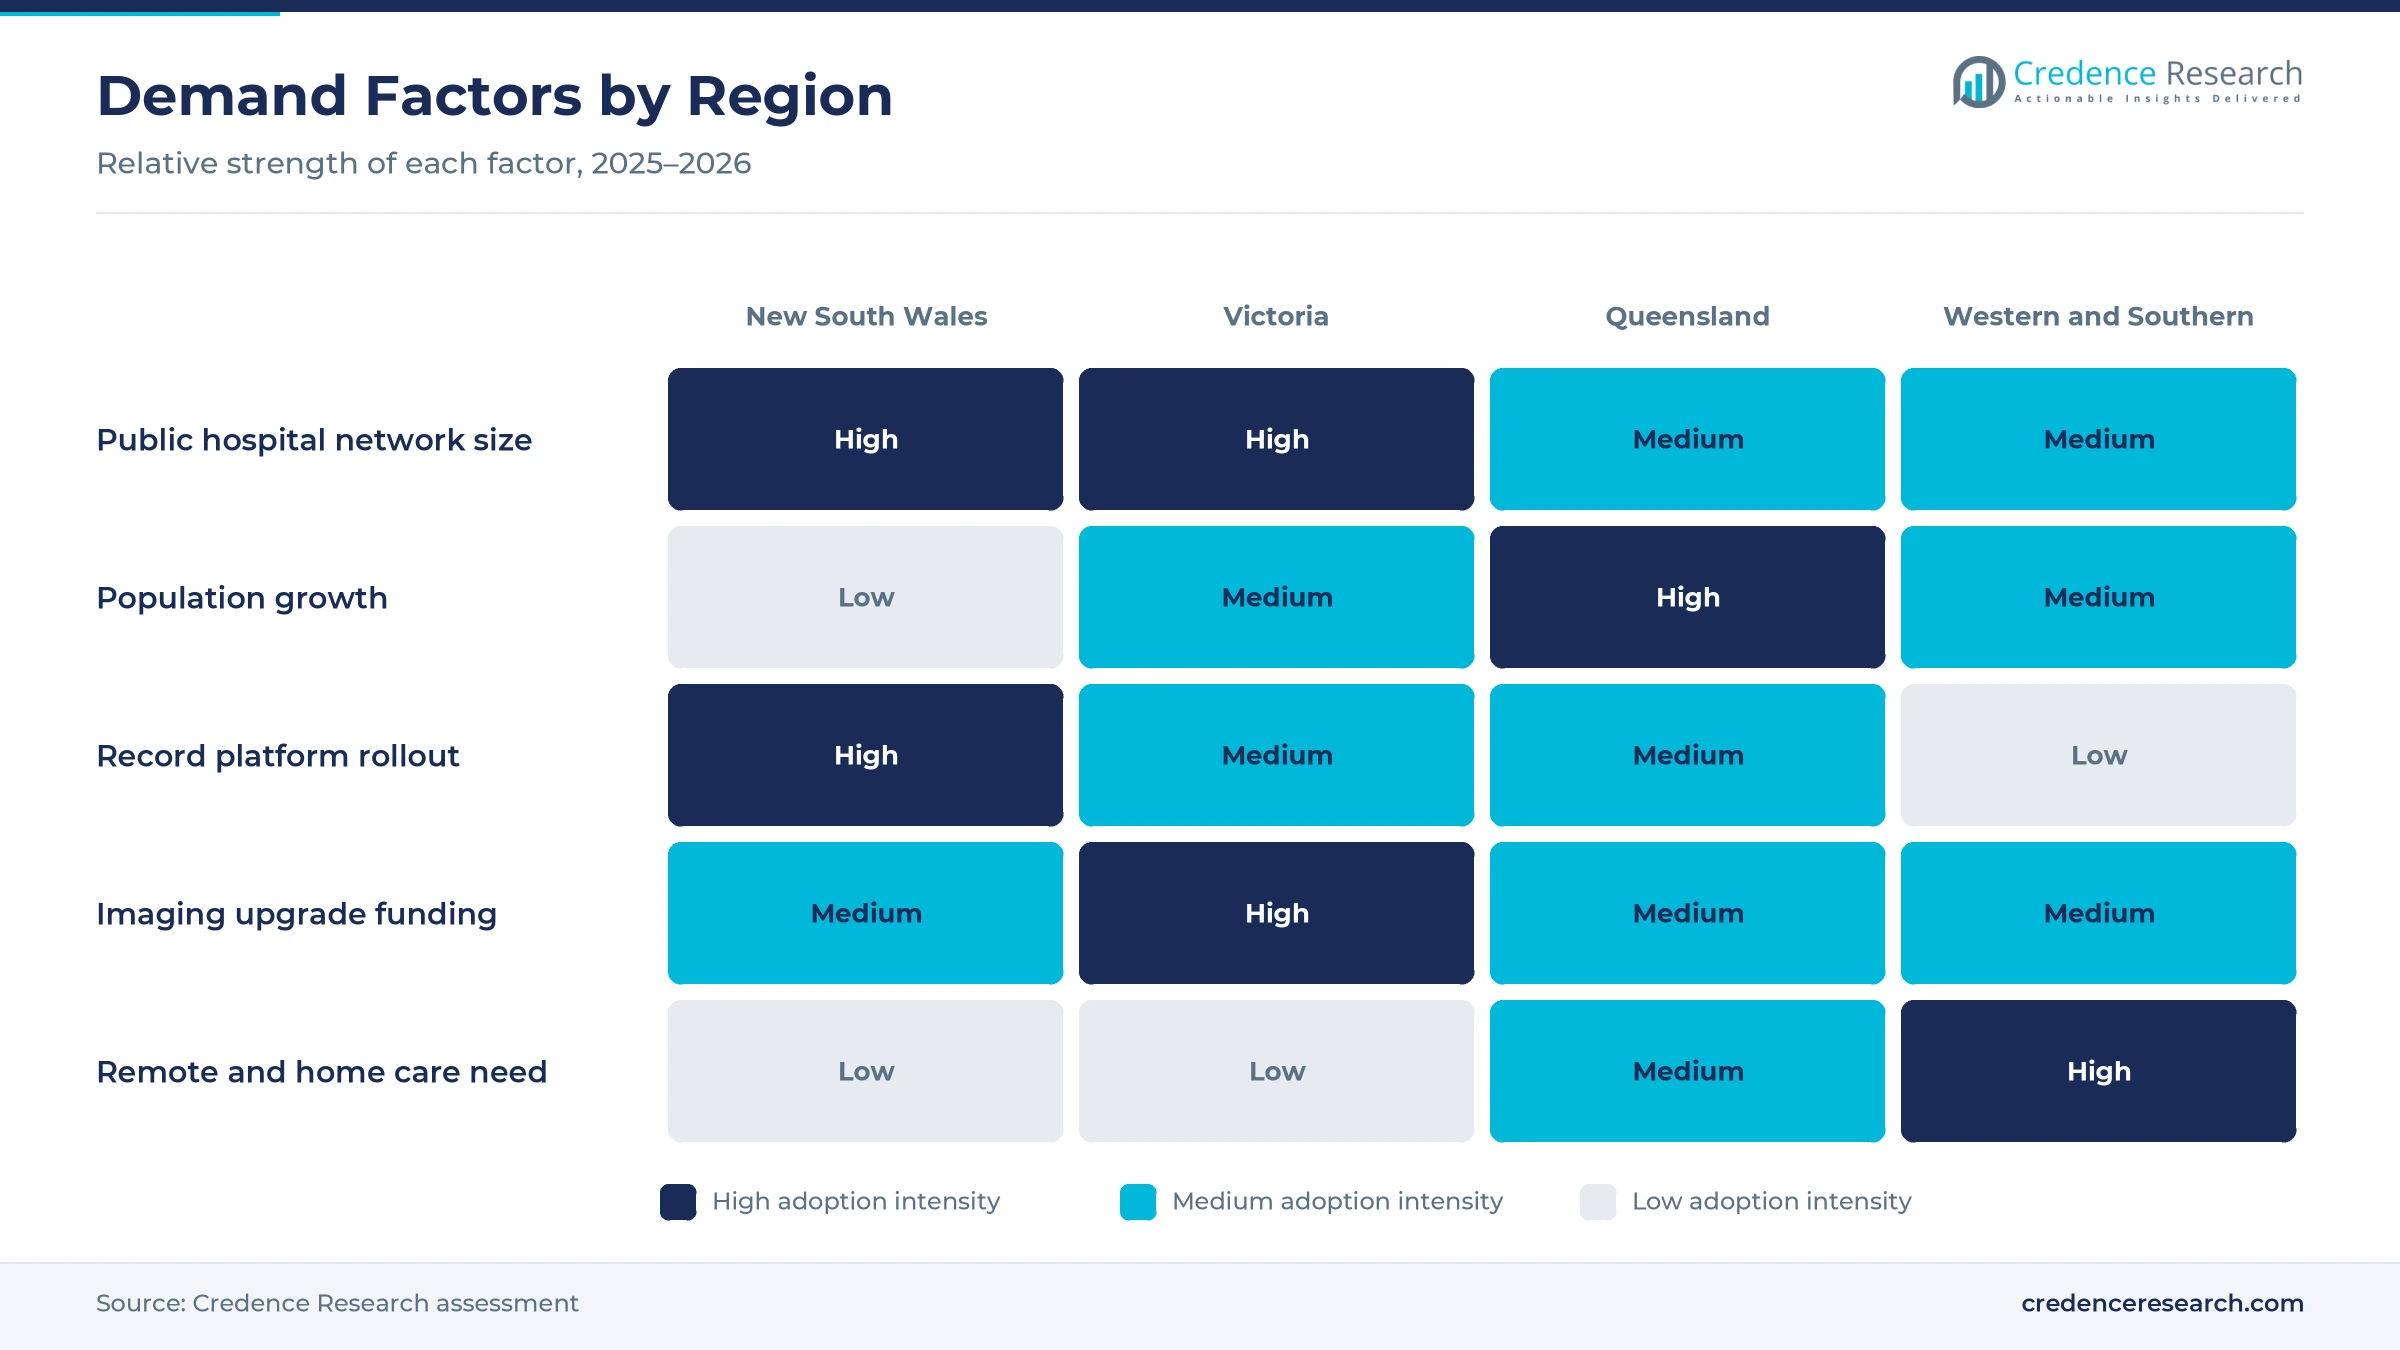
Clinical equipment replacement lifts demand, because public hospitals must renew scanners and surgical systems as they age and as patient numbers rise. The Victorian Government announced $35 million on July 18, 2025, for 10 projects at eight health services, including CT, MRI, PET/CT and SPECT-CT units. Philips also holds 20-year managed equipment agreements with two NSW health districts that cover imaging at nine hospital sites. Siemens supplies about 6,000 items under a 15-year managed equipment contract at Fiona Stanley Hospital in Perth. As a result, public tenders hold a 47.0% share of 2025 value, the largest channel share, as states renew imaging fleets.
Why does connected chronic care widen home demand?
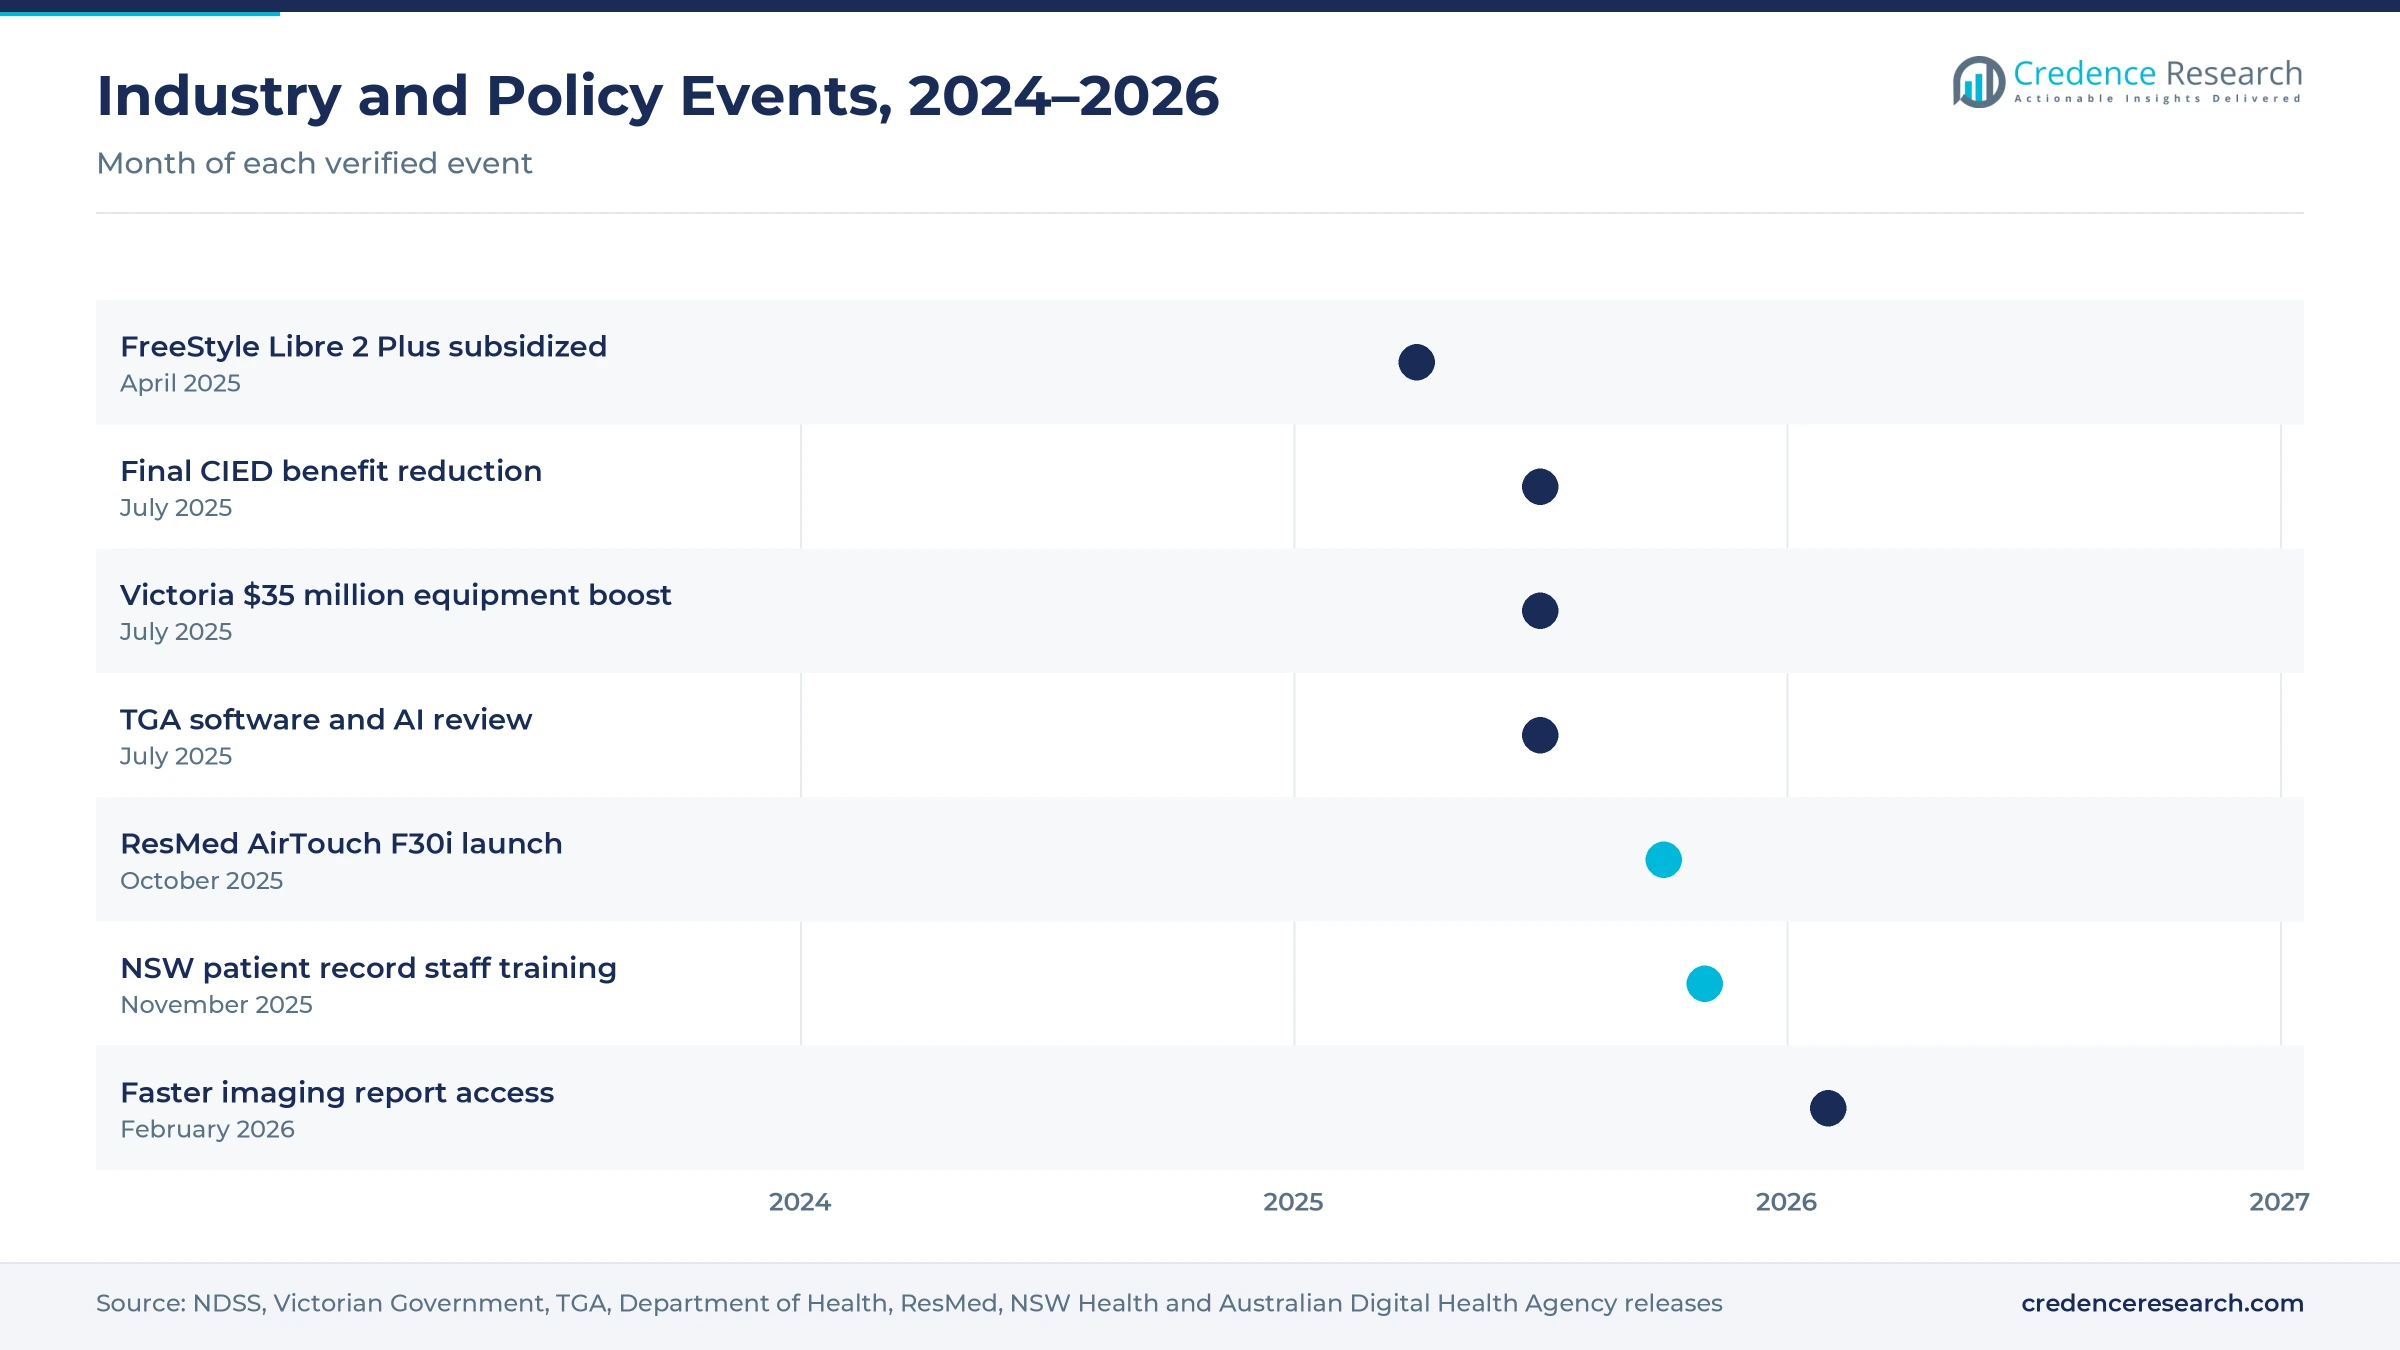
Connected chronic care widens home demand, because sensors and therapy devices now send data to patients and clinicians between visits. FreeStyle Libre 2 Plus sensors became subsidized through the National Diabetes Services Scheme on April 1, 2025, with a co-pay of $17.35 per sensor. All people with type 1 diabetes can apply for subsidized glucose monitoring, and FreeStyle Libre 3 Plus sensors for pump users followed on Dec. 1, 2025. ResMed also launched its AirTouch F30i Comfort mask in Australia on Oct. 27, 2025, for AirSense 11 and other sleep therapy devices. In turn, home care grows at 8.27% a year, the fastest setting rate, as oxygen concentrators and sensors move care home.
How does clinical platform modernization raise software spending?
Clinical platform modernization raises software spending, because state health systems are replacing many separate records with one shared platform. NSW Health began training staff on its single digital patient record on Nov. 17, 2025, with more than 25,000 staff among the first users. The program will replace nine electronic medical records, 10 patient administration systems and five laboratory systems. When complete in 2028, it will cover more than 220 public hospitals, 65 laboratories and about 600 community health centers. As a result, clinical software grows at 8.51% a year, the fastest product rate, as patient record systems link to bedside devices.
Why do an aging population and health spending support growth?
An aging population and steady health spending support growth, because older patients need more diagnosis, surgery and monitoring. People aged 65 and over made up 18.1% of the Australian population in 2025, up from 17.1% in 2022, according to World Bank data. Current health spending reached 10.4% of gross domestic product in 2023, according to the World Bank. The national population also grew by 392,700 people in the year to March 31, 2026, to about 27.92 million, which adds demand for hospital beds, scanners and monitors. In turn, public health purchasers hold a 52.0% share of 2025 value, the largest customer share.
Shared records, AI rules and imaging upgrades reshape buying
How is the shift to shared health records changing diagnostics?
The shift to shared health records is changing diagnostics, because pathology and imaging results now reach patients and clinicians faster. From mid-October 2025, most pathology results became viewable in My Health Record right after upload, according to the Australian Digital Health Agency. From February 2026, limb X-ray reports became viewable at once, while other imaging reports have a five-day delay instead of seven days. Pathology and imaging providers also face share-by-default upload duties from mid-2026, after a six-month delay once the rules are final. As a result, labs that run in vitro diagnostics need connected reporting systems.
Why is the rise of tighter AI software rules notable?
The rise of tighter AI software rules is notable, because many new clinical tools rely on algorithms that change over time. The Therapeutic Goods Administration published a review of medical device software, including AI, on July 25, 2025, and found that targeted reforms are needed. The review recommended urgent work on digital scribes, digital mental health tools and guidance on adaptive and generative AI. It also planned more compliance action against unapproved software and a review of classification rules for predictive tools. Until new guidance appears, developers may refer to ISO/IEC 42001:2023 and ISO/IEC 5338:2023 for AI management and training data. In turn, suppliers of digital therapeutics and AI tools need stronger evidence.
Can advanced imaging upgrades open a new growth path?
Advanced imaging upgrades offer a growth path, because hospitals want scanners that diagnose earlier with lower radiation. Victoria's July 2025 funding covered a PET/CT unit at Austin Health, a SPECT-CT unit at Grampians Health and a wide-bore MRI scanner at Alfred Health. The South Australian Health and Medical Research Institute installed the first photon-counting CT scanner in Australia under a $9.8 million partnership with Siemens Healthineers and Dr Jones & Partners. That scanner can cut radiation doses by up to 45% compared with older scanners, according to the partners. As a result, diagnostic systems keep strong demand alongside X-ray generators in regional hospitals.
Is there room to grow in fast-growing states?
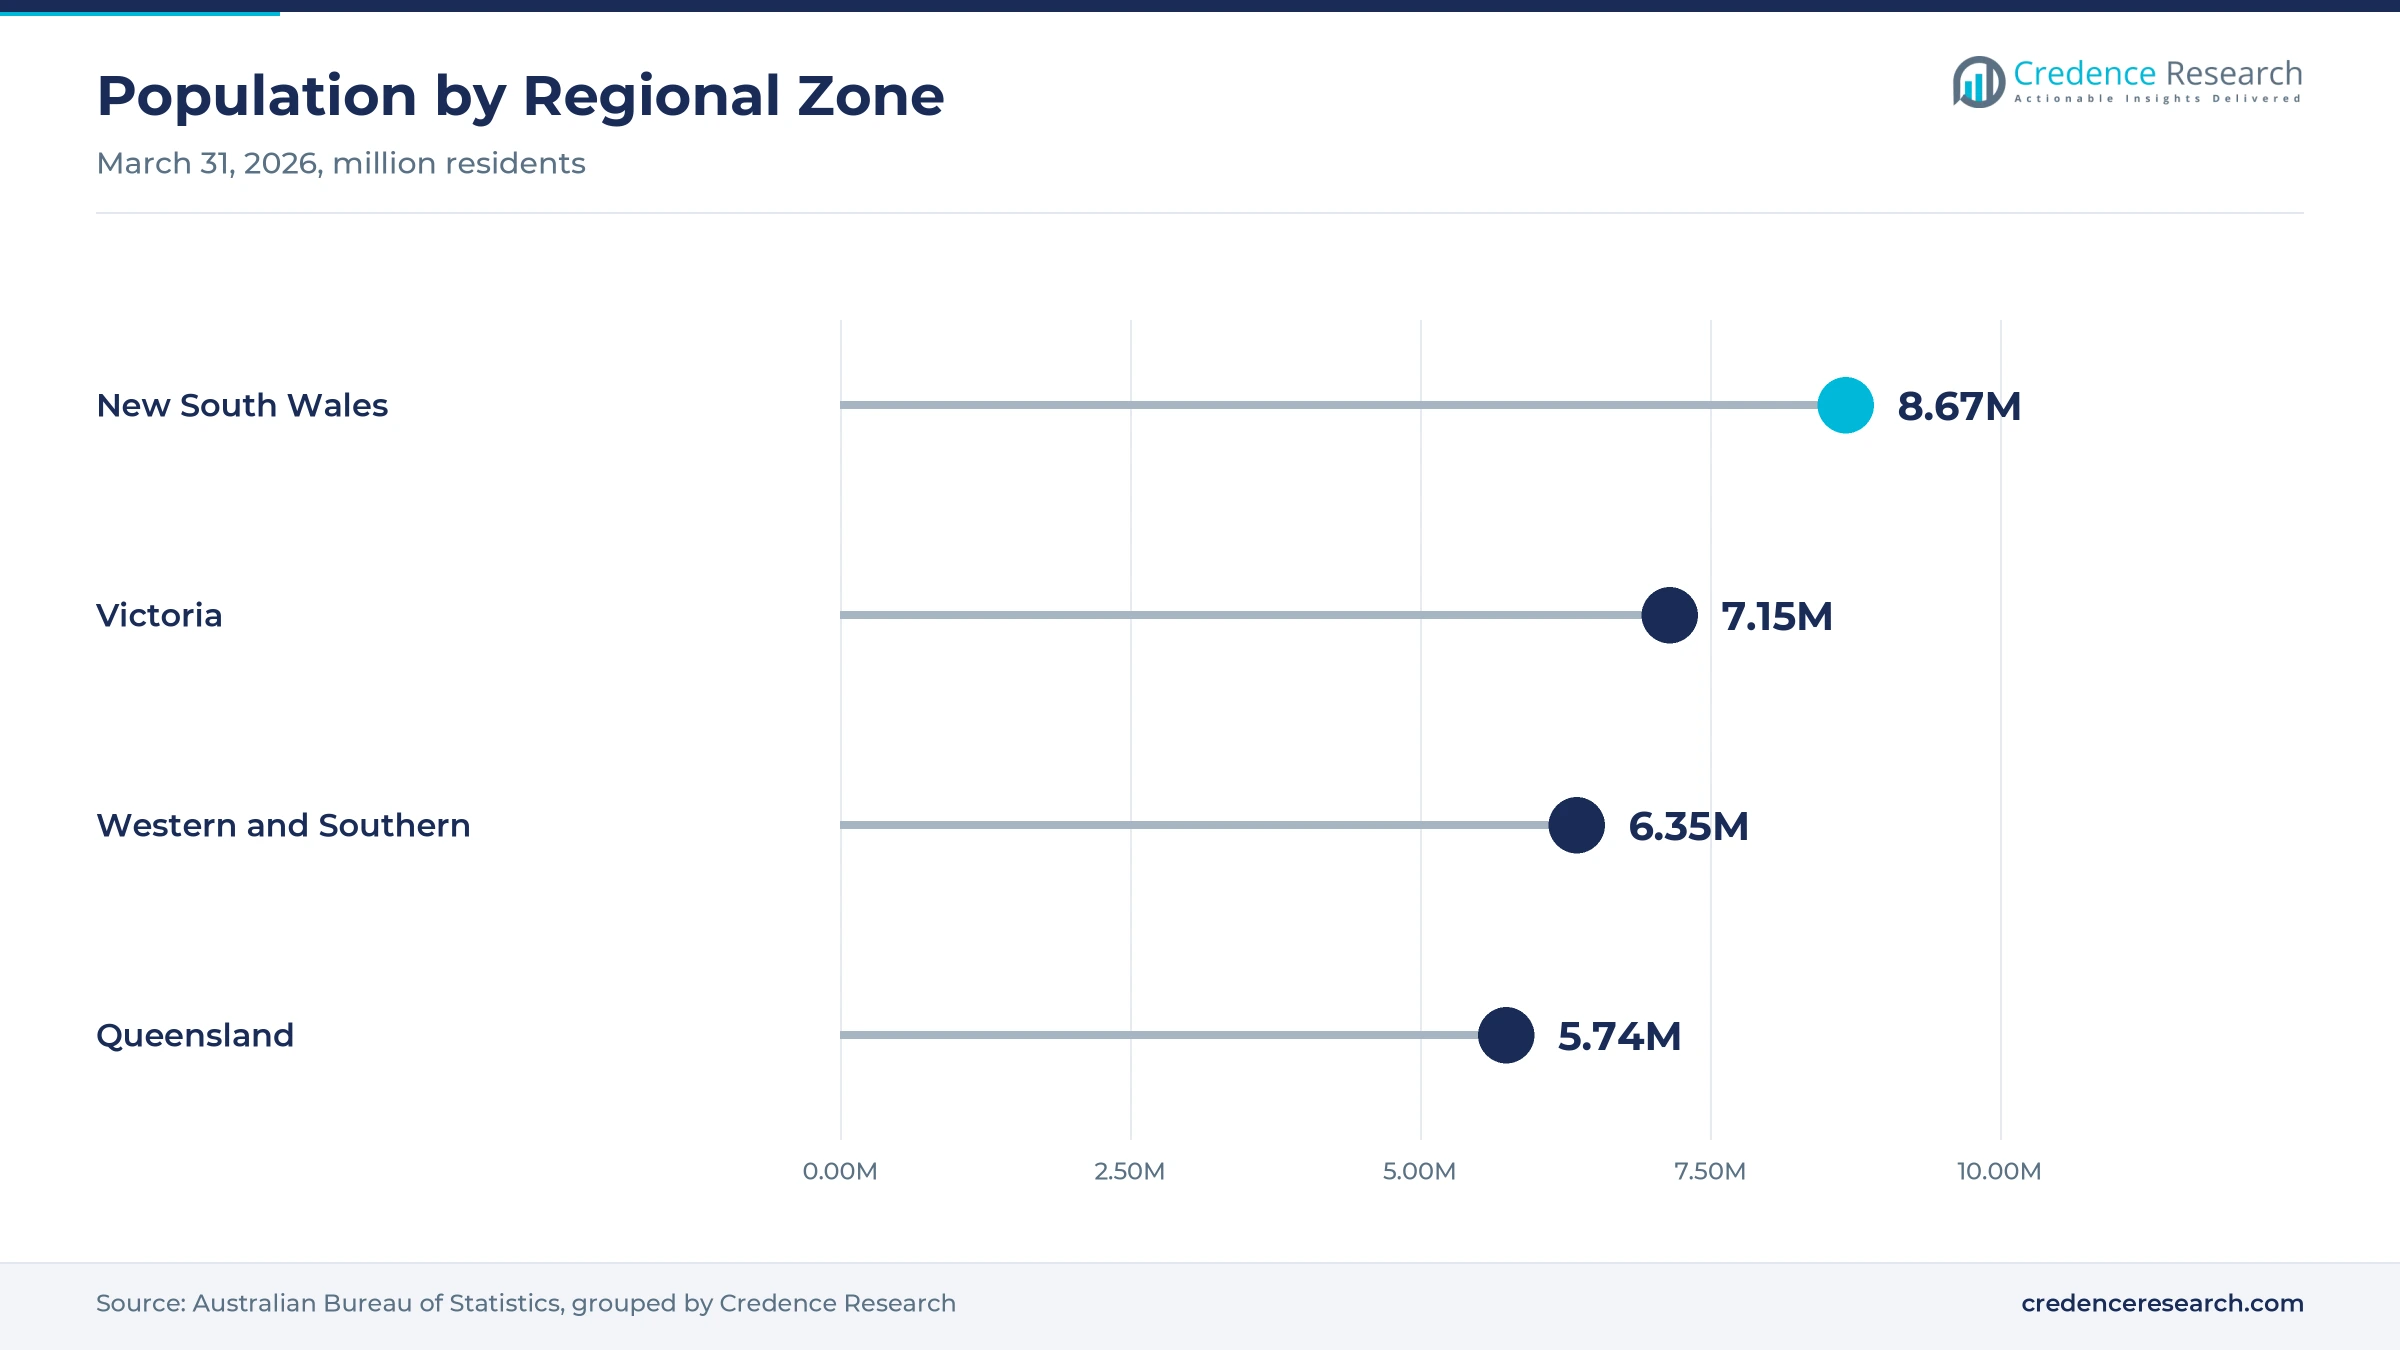
Fast-growing states have room for new capacity, because population growth adds patients faster than hospitals can expand. Queensland added about 90,100 residents in the year to March 31, 2026, to reach about 5.74 million people. Western Australia added about 64,200 residents over the same period, the fastest growth rate of any state, to reach about 3.10 million. Victoria also added about 109,500 residents, the largest increase of any state. In turn, Queensland records the fastest regional growth in this estimate, as new hospital beds, clinics and aged care places in growing suburbs need scanners, monitors and software.
Price cuts, approvals and cyber risk weigh on suppliers
Why do device price cuts weigh on suppliers?
Device price cuts weigh on suppliers, because private health insurance benefits for many implants are moving closer to public hospital prices. The final reduction of 20% of the gap for cardiac implantable electronic devices on the Prescribed List took effect on July 1, 2025. As a result, implant makers earn less per unit in private hospitals. Private hospitals also push suppliers for lower prices on other implants. Suppliers respond with bundled service, lower-cost product lines and evidence that supports value.
How do approval and compliance rules raise costs?
Approval and compliance rules raise costs, because every device and much clinical software must be listed before supply in Australia. The regulator plans more compliance action against unapproved software, including AI tools. In turn, smaller developers spend more on evidence, quality systems and regulatory advice before launch. Suppliers respond with early regulator contact, shared quality systems and approvals gained in other markets first, which can shorten local reviews.
Why does cyber risk slow connected equipment rollouts?
Cyber risk slows connected equipment rollouts, because networked scanners, pumps and monitors can expose hospital systems to attack. Health services must test security before they link devices to shared patient records. As a result, procurement takes longer and integration costs rise for suppliers and hospitals. Suppliers respond with security updates, network segmentation tools and service contracts that cover patching for the full life of the equipment.
How do budget limits delay equipment purchases?
Budget limits delay equipment purchases, because state health systems fund new scanners from capital programs that compete with staff and building costs. Large purchases often wait for annual budget rounds or special funding announcements. However, managed equipment contracts can spread these costs over 15 to 20 years of service. Suppliers respond with leasing, managed services and long-term replacement plans that fit public budget cycles.
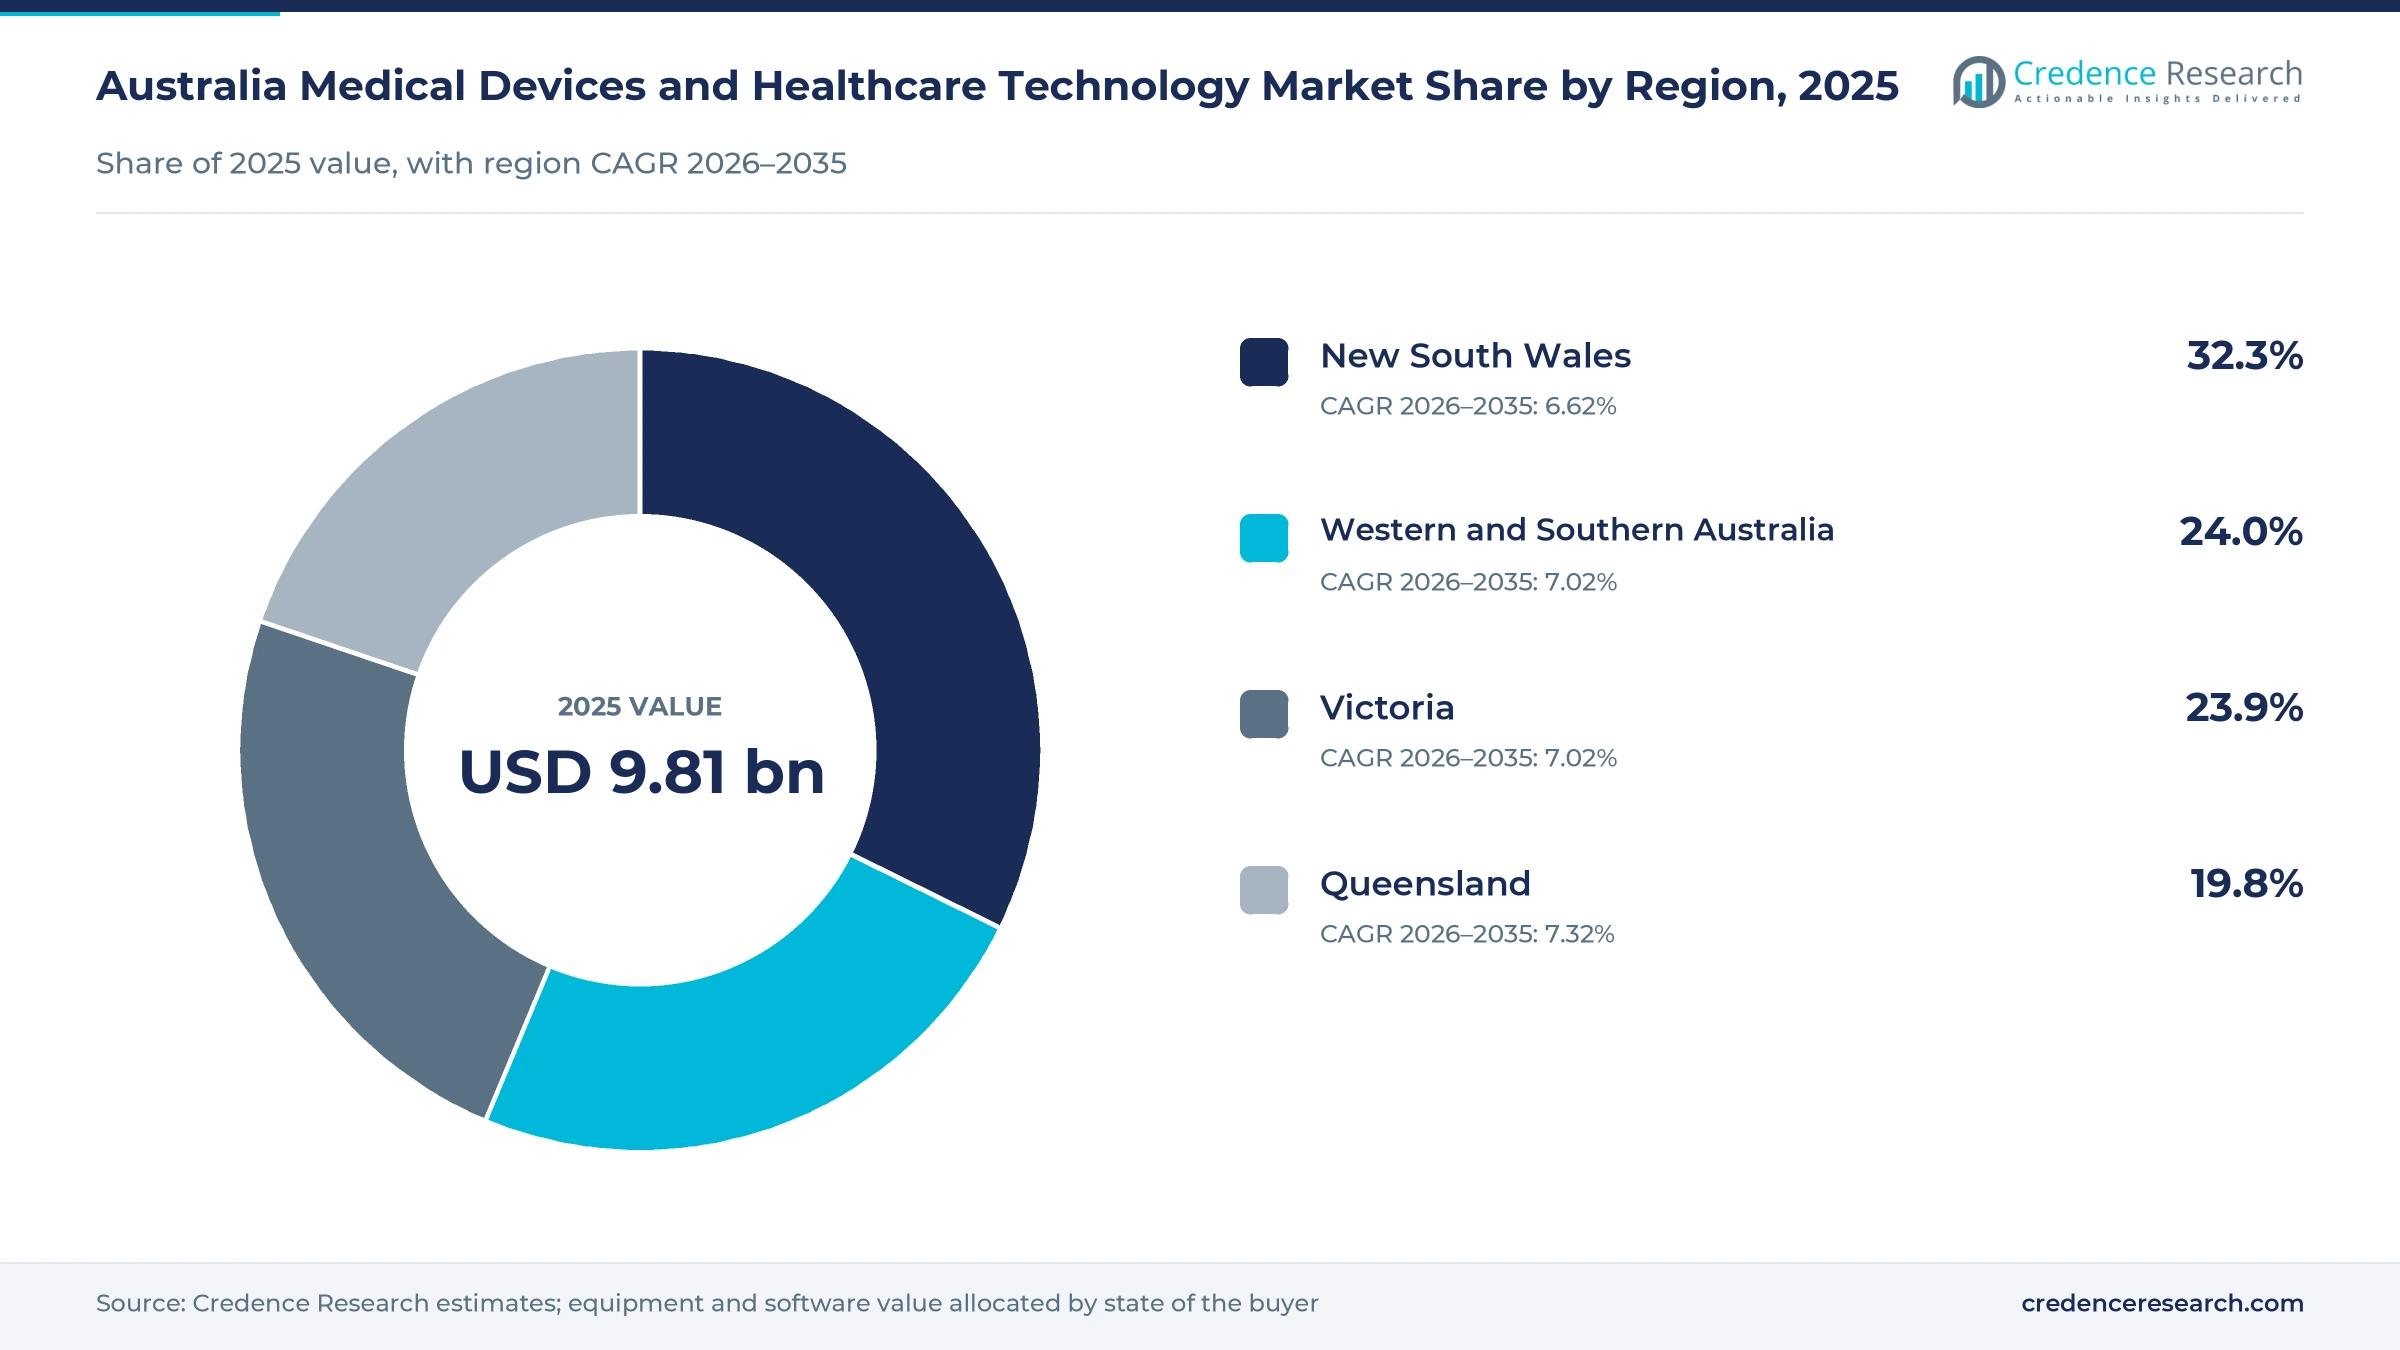
New South Wales leads while Queensland grows fastest
| Region | Value, 2025 (USD billion) | Share, 2025 | CAGR, 2026–2035 |
|---|---|---|---|
| New South Wales | 3.17 | 32.3% | 6.62% |
| Western and Southern Australia | 2.35 | 24.0% | 7.02% |
| Victoria | 2.34 | 23.9% | 7.02% |
| Queensland | 1.94 | 19.8% | 7.32% |
Why does new South Wales hold the largest share?
New South Wales held a 32.3% share of 2025 value and grows at 6.62% a year, because it has the largest population and the largest public hospital network. The state had about 8.67 million residents at March 31, 2026. NSW Health is also rolling out a single digital patient record across more than 220 public hospitals by 2028. Medtronic runs its Australian head office in Macquarie Park, New South Wales. However, growth is slower than in other zones because the state population grew only about 1.1% over the year.
How does Western and Southern Australia support demand?
Western and Southern Australia held a 24.0% share of 2025 value and grows at 7.02% a year, because the zone combines Western Australia, South Australia, Tasmania and the territories. Western Australia had about 3.10 million residents and South Australia about 1.92 million at March 31, 2026. Fiona Stanley Hospital in Perth uses a long managed equipment contract with Siemens, and Adelaide hosts the first photon-counting CT scanner in Australia. In turn, the zone buys advanced imaging and service-based equipment.
How does Victoria support equipment demand?
Victoria held a 23.9% share of 2025 value and grows at 7.02% a year, because Melbourne hosts large teaching hospitals and cancer centers. The state had about 7.15 million residents at March 31, 2026, after adding about 109,500 people in a year. The state government funded new CT, MRI, PET/CT and SPECT-CT units in July 2025 at eight health services. As a result, Victorian hospitals remain major buyers of diagnostic systems.
Why does Queensland grow fastest?
Queensland held a 19.8% share of 2025 value and grows fastest at 7.32% a year, because steady migration from other states keeps adding patients. The state had about 5.74 million residents at March 31, 2026, after adding about 90,100 people in a year. In turn, new hospital beds and clinics in southeast Queensland need scanners, monitors and software.
Subsidies, launches and record rollouts from 2024 to 2026
| Development | Status and market relevance |
|---|---|
| In April 2025, FreeStyle Libre 2 Plus sensors became subsidized through the National Diabetes Services Scheme. | All people with type 1 diabetes can apply for subsidized glucose monitoring |
| In July 2025, the Victorian Government announced $35 million for 10 hospital equipment projects. | Covers CT, MRI, PET/CT and SPECT-CT units at eight health services |
| In July 2025, the Therapeutic Goods Administration published its review of software and AI regulation. | Found that targeted reforms are needed |
| In October 2025, ResMed launched the AirTouch F30i Comfort mask in Australia. | Works with AirSense 11 and other sleep therapy devices |
| In November 2025, NSW Health began training staff on its single digital patient record. | More than 220 public hospitals covered by 2028 |
Connected sensors, AI and unified records reshape care
- Connected glucose sensors send readings to phones and insulin pumps every few minutes, which helps patients manage diabetes at home.
- Photon-counting CT counts individual X-ray photons, which gives sharper images and can cut radiation doses for patients.
- Robotic-assisted surgery gives surgeons precise control and procedure data, which supports urologic, gynecologic and general laparoscopic work.
- Unified patient record platforms combine records, patient administration and lab data, which lets devices send results into one system.
Need a Custom Version of This Report?
Tailor the scope, geography, or segments to your exact requirements.
- Custom geography or segment scope
- Direct access to our analyst team
Suppliers compete on service, evidence and connectivity
Competition is led by global device makers, imaging companies and local digital health firms, and rivals compete on service, evidence and connectivity. ResMed launched a new fabric CPAP mask in Australia in October 2025, which won a gold Good Design Award. Abbott supplies FreeStyle Libre glucose sensors that are subsidized through the national diabetes scheme. Medtronic offers its Hugo robotic surgery system from its Macquarie Park head office. Siemens Healthineers runs long managed equipment contracts and supplied the first photon-counting CT scanner in Australia. Philips holds 20-year imaging agreements with two NSW health districts, while Telstra Health builds hospital billing and record software. GE HealthCare, Johnson & Johnson MedTech, Stryker and Becton Dickinson also compete for hospital tenders and private hospital contracts.
Companies profiled and their roles in this market
| Company | Type | Role in the market |
|---|---|---|
| ResMed | Sleep and respiratory device maker | Launched the AirTouch F30i Comfort mask in October 2025 |
| Abbott Laboratories | Diabetes device maker | FreeStyle Libre 2 Plus subsidized from April 2025 |
| Medtronic | Surgical and cardiac device maker | Offers the Hugo robotic surgery system in Australia |
| Siemens Healthineers | Imaging and service provider | Supplied the first photon-counting CT scanner in Australia |
| Philips Healthcare | Imaging and service provider | Holds 20-year imaging agreements with two NSW districts |
| Telstra Health | Clinical software provider | Bought a stake in hospital billing software firm PowerHealth |
Credence Research view on Australian clinical equipment
Credence Research's view is that Australian clinical equipment spending will grow steadily because hospitals must renew aging equipment while chronic care moves into homes. Therapeutic devices remain the largest product group, while clinical software and monitoring devices gain share as state record platforms and subsidized sensors spread. Price cuts for implants, tighter software rules and cyber risk still slow growth. Suppliers with strong service networks, connected products and clinical evidence should gain share fastest, especially in public tenders and home care.
How the Australian clinical equipment estimate was built
The report uses 2025 as the base year on a calendar basis, and market values come from the Credence Research model. That model combines World Bank health spending and population data, official state population statistics, government funding announcements, regulator releases and company announcements on launches and contracts. Segment splits and regional growth rates are Credence Research estimates, while regional shares follow the client-defined split. Sources used are public reports, official statistics, trade press, government releases and company releases, and no interviews or surveys were used.
Hospital renewal and home care carry growth to 2035
Clinical equipment and software value is expected to reach USD 19.25 billion by 2035, a 6.95% CAGR during 2026–2035, as hospital renewal, chronic care at home and record platforms keep spending rising. Growth should be strong while NSW completes its single patient record by 2028 and states replace imaging fleets. After that, home monitoring and AI software will carry more growth as patients age. Faster approvals would lift uptake, while deeper implant price cuts would slow supplier returns.
Frequently Asked Questions
How big is the Australia medical devices and healthcare technology market?
Which product type leads Australian clinical equipment value?
Which region leads the Australia medical devices and healthcare technology market?
How is NSW changing its hospital records?
Which glucose sensors are subsidized in Australia?
Which care setting is growing fastest?
Who are the leading medical device companies in Australia?
What are the main challenges for clinical equipment suppliers?
Table of Content
Chapter 1 Market Segmentation
- 1.1 Segmentation Framework
- 1.1.1 Product and Service Classification
- 1.1.2 Application and End-Use Classification
- 1.1.3 Technology and Solution Classification
- 1.1.4 Customer and Distribution Channel Classification
- 1.1.5 Geographic Segmentation
- 1.1.6 Market Segment Definitions and Boundaries
- 1.2 By Product Type
- 1.2.1 Diagnostic Systems
- 1.2.2 Therapeutic Devices
- 1.2.3 Monitoring Devices
- 1.2.4 Clinical Software
- 1.3 By Care Setting
- 1.3.1 Hospital Care
- 1.3.2 Ambulatory Care
- 1.3.3 Residential Care
- 1.3.4 Home Care
- 1.4 By Customer Type
- 1.4.1 Public Health Purchasers
- 1.4.2 Private Provider Purchasers
- 1.4.3 Community Provider Purchasers
- 1.4.4 Household Purchasers
- 1.5 By Sales Channel
- 1.5.1 Public Tender
- 1.5.2 Direct Enterprise Sales
- 1.5.3 Specialist Distribution
- 1.5.4 Retail and Digital Commerce
Chapter 2 Introduction
- 2.1 Report Objectives and Scope
- 2.2 Product Definition and Industry Terminology
- 2.3 Market Inclusions and Exclusions
- 2.4 Research Process
- 2.4.1 Primary Research and Expert Interviews
- 2.4.2 Secondary Research and Source Review
- 2.4.3 Top-Down and Bottom-Up Estimation
- 2.4.4 Data Triangulation and Verification
- 2.5 Market Size Measurement Basis
- 2.5.1 2025: USD 9.81 billion → 2035: USD 19.25 billion
- 2.6 Historical and Forecast Reference Periods
- 2.6.1 Historical Period: 2018-2025
- 2.6.2 Base Year: 2025
- 2.6.3 Forecast Period: 2025-2035
- 2.7 Research Assumptions and Limitations
Chapter 3 Executive Summary
- 3.1 Market Snapshot and Key Findings
- 3.2 Base-Year Market Size, 2025
- 3.3 Forecast Market Size, 2035
- 3.4 Revenue and Volume Growth Outlook
- 3.5 Key Demand and Supply Indicators
- 3.6 Leading Market Segments
- 3.7 Fastest-Growing Market Opportunities
- 3.8 Regional Performance Highlights
- 3.9 Technology and Industry Transformation
- 3.10 Competitive Landscape Summary
- 3.11 Analyst View and Strategic Implications
Chapter 4 Australia Medical Devices and Healthcare Technology Market Trends and Developments
- 4.1 Historical Industry Development, 2018-2025
- 4.2 Recent Market Trends and Developments
- 4.3 Demand and Customer Behavior Trends
- 4.4 Technology and Product Innovation
- 4.5 Artificial Intelligence, Automation and Digitalization
- 4.6 Local Manufacturing and Supply Chain Realignment
- 4.7 Industry Partnerships, Mergers and Acquisitions
- 4.8 Sustainability and Circular Economy Developments
- 4.9 Government and Private Sector Investment Trends
- 4.10 Emerging Business Models and Commercialization
- 4.11 Industry Developments and Announcements
Chapter 5 Australia Medical Devices and Healthcare Technology Market Production, Supply and Demand Analysis
- 5.1 Demand Trend and Consumption Analysis, 2018-2025
- 5.2 Demand Forecast, 2025-2035
- 5.3 Production and Output Trend, 2018-2025
- 5.4 Production and Output Forecast, 2025-2035
- 5.5 Installed Capacity and Capacity Utilization
- 5.6 Company-Wise Production Plants and Statistics
- 5.6.1 Installed Production Capacity
- 5.6.2 Actual Production
- 5.6.3 Planned Capacity and Expansion Targets
- 5.7 Supply Chain Structure and Procurement Trends
- 5.8 Supply-Demand Gap and Bottlenecks
- 5.9 Import Dependence and Sourcing Structure
- 5.10 Contract Manufacturing and Outsourcing
- 5.11 Regional Supply and Demand Concentration
Chapter 6 Australia Medical Devices and Healthcare Technology Market Pricing Analysis
- 6.1 Pricing Structure and Measurement
- 6.2 Historical Pricing Trends, 2018-2025
- 6.3 Pricing Outlook, 2025-2035
- 6.4 Average Selling Price and Unit Economics
- 6.5 Pricing by Product and Market Segment
- 6.6 Geographic Pricing Differences
- 6.7 Key Input, Energy, Labor and Logistics Costs
- 6.8 Contract Pricing and Purchasing Models
- 6.9 Pricing Sensitivity and Competitive Positioning
- 6.10 Price, Margin and Profitability Implications
Chapter 7 Australia Medical Devices and Healthcare Technology Market Dynamics
- 7.1 Market Growth Drivers
- 7.1.1 Demand-Side Drivers
- 7.1.2 Technology and Innovation Drivers
- 7.1.3 Infrastructure and Investment Drivers
- 7.1.4 Regulatory and Policy Drivers
- 7.2 Market Restraints
- 7.2.1 Cost and Affordability Constraints
- 7.2.2 Technology and Adoption Barriers
- 7.2.3 Supply Chain and Operational Constraints
- 7.3 Market Challenges
- 7.3.1 Competitive Pressure and Margin Erosion
- 7.3.2 Skills, Infrastructure and Implementation Gaps
- 7.4 Emerging Market Opportunities
- 7.5 Market Dynamics Impact and Time-Horizon Assessment
Chapter 8 Australia Medical Devices and Healthcare Technology Value Chain Analysis
- 8.1 Industry Value Chain Overview
- 8.2 Upstream Suppliers and Critical Inputs
- 8.3 Technology and Component Providers
- 8.4 Manufacturing or Service Delivery
- 8.5 Distribution, Channel Partners and Integrators
- 8.6 Downstream Applications and End Users
- 8.7 Value Addition and Profit Pools
- 8.8 Vertical Integration and Outsourcing
- 8.9 Supplier Concentration and Risk
- 8.10 Supply Chain Localization and Resilience
Chapter 9 Australia Medical Devices and Healthcare Technology Market Regulations and Policies
- 9.1 Relevant Laws, Standards and Compliance Frameworks
- 9.2 Product, Service, Safety and Quality Requirements
- 9.3 Government Policies, Incentives and Subsidies
- 9.4 Imports, Exports and Trade Barriers
- 9.5 Public Procurement and Local Content Requirements
- 9.6 Environmental and Sustainability Compliance
- 9.7 Upcoming Policy Changes and Market Implications
Chapter 10 Australia Medical Devices and Healthcare Technology Market Hotspots and Opportunities
- 10.1 Market Opportunity Mapping and Growth Hotspots
- 10.2 High-Growth Applications and Customer Groups
- 10.3 Underserved Markets and White-Space Opportunities
- 10.4 Emerging Technology and Product Opportunities
- 10.5 New Capacity and Investment Hotspots
- 10.6 Market Entry and Expansion Opportunities
- 10.7 Distribution and Partnership Opportunities
- 10.8 Near-Term and Long-Term Commercial Potential
- 10.9 Opportunity Attractiveness and Execution Risks
Chapter 11 Australia Medical Devices and Healthcare Technology Market Outlook, 2025-2035
- 11.1 Market Size and Analysis
- 11.1.1 Revenue (Market Measurement: 2025: USD 9.81 billion → 2035: USD 19.25 billion)
- 11.1.2 Market Volume and Quantity Sold
- 11.1.3 Historical Market Size, 2018-2025
- 11.1.4 Base-Year Market Size, 2025
- 11.2 Market Forecast, 2025-2035
- 11.2.1 Revenue Forecast to 2035
- 11.2.2 Volume Forecast to 2035
- 11.2.3 CAGR and Year-on-Year Growth
- 11.2.4 Incremental Revenue Opportunity
- 11.3 Forecast Assumptions and Scenario Analysis
- 11.3.1 Base-Case Forecast
- 11.3.2 Optimistic and Conservative Scenarios
- 11.3.3 Technology, Pricing and Policy Sensitivities
- 11.4 Market Attractiveness and Growth Outlook
Chapter 12 Australia Medical Devices and Healthcare Technology Market Segmentation and Outlook
- 12.1 Segmentation Summary and Market Shares, 2025
- 12.2 Largest and Fastest-Growing Segments
- 12.3 By Product Type - Market Size and Forecast, 2025-2035
- 12.3.1 Segment Definition and Scope
- 12.3.2 Historical Market Size, 2018-2025
- 12.3.3 Revenue Forecast, 2025-2035
- 12.3.4 Volume Forecast, 2025-2035
- 12.3.5 Base-Year Market Share, 2025
- 12.3.6 Segment CAGR and Growth Drivers
- 12.3.7 Subsegment Market Size and Forecast
- 12.3.7.1 Diagnostic Systems
- 12.3.7.2 Therapeutic Devices
- 12.3.7.3 Monitoring Devices
- 12.3.7.4 Clinical Software
- 12.3.8 Subsegment Pricing and Adoption Trends
- 12.3.9 Leading Suppliers and Competition
- 12.3.10 Regional Demand and Opportunities
- 12.4 By Care Setting - Market Size and Forecast, 2025-2035
- 12.4.1 Segment Definition and Scope
- 12.4.2 Historical Market Size, 2018-2025
- 12.4.3 Revenue Forecast, 2025-2035
- 12.4.4 Volume Forecast, 2025-2035
- 12.4.5 Base-Year Market Share, 2025
- 12.4.6 Segment CAGR and Growth Drivers
- 12.4.7 Subsegment Market Size and Forecast
- 12.4.7.1 Hospital Care
- 12.4.7.2 Ambulatory Care
- 12.4.7.3 Residential Care
- 12.4.7.4 Home Care
- 12.4.8 Subsegment Pricing and Adoption Trends
- 12.4.9 Leading Suppliers and Competition
- 12.4.10 Regional Demand and Opportunities
- 12.5 By Customer Type - Market Size and Forecast, 2025-2035
- 12.5.1 Segment Definition and Scope
- 12.5.2 Historical Market Size, 2018-2025
- 12.5.3 Revenue Forecast, 2025-2035
- 12.5.4 Volume Forecast, 2025-2035
- 12.5.5 Base-Year Market Share, 2025
- 12.5.6 Segment CAGR and Growth Drivers
- 12.5.7 Subsegment Market Size and Forecast
- 12.5.7.1 Public Health Purchasers
- 12.5.7.2 Private Provider Purchasers
- 12.5.7.3 Community Provider Purchasers
- 12.5.7.4 Household Purchasers
- 12.5.8 Subsegment Pricing and Adoption Trends
- 12.5.9 Leading Suppliers and Competition
- 12.5.10 Regional Demand and Opportunities
- 12.6 By Sales Channel - Market Size and Forecast, 2025-2035
- 12.6.1 Segment Definition and Scope
- 12.6.2 Historical Market Size, 2018-2025
- 12.6.3 Revenue Forecast, 2025-2035
- 12.6.4 Volume Forecast, 2025-2035
- 12.6.5 Base-Year Market Share, 2025
- 12.6.6 Segment CAGR and Growth Drivers
- 12.6.7 Subsegment Market Size and Forecast
- 12.6.7.1 Public Tender
- 12.6.7.2 Direct Enterprise Sales
- 12.6.7.3 Specialist Distribution
- 12.6.7.4 Retail and Digital Commerce
- 12.6.8 Subsegment Pricing and Adoption Trends
- 12.6.9 Leading Suppliers and Competition
- 12.6.10 Regional Demand and Opportunities
- 12.7 Segment Growth Comparison
- 12.8 Segment Attractiveness and Priority Matrix
Chapter 13 Australia Medical Devices and Healthcare Technology End-Use and Application Market Outlook
- 13.1 End-Use Industry and Customer Demand Structure
- 13.2 Leading Applications and Customer Groups
- 13.3 End-Use Market Size, Share and Forecast
- 13.4 Major End-Use Industry Deep Dives
- 13.4.1 Customer Requirements and Use Cases
- 13.4.2 Demand and Replacement Cycles
- 13.4.3 Technical and Regulatory Considerations
- 13.4.4 Purchasing and Procurement Models
- 13.4.5 Leading Vendors and Distribution Channels
- 13.4.6 Forecast and Commercial Opportunities
- 13.5 Emerging Applications and Cross-Segment Demand
- 13.6 End-Use Industry Investment Priorities
Chapter 14 Australia Medical Devices and Healthcare Technology Geographic Market Outlook, 2025-2035
- 14.1 Domestic Market Distribution and Demand Clusters
- 14.2 State- or Province-Wise Market Size and Forecast, 2025-2035
- 14.3 City and Metropolitan Market Outlook
- 14.4 Industrial, Manufacturing and Commercial Clusters
- 14.5 Geographic Concentration of Key End Users
- 14.6 Local Pricing and Purchasing Differences
- 14.7 Domestic Production Facilities and Capacity Map
- 14.8 Local Infrastructure and Project Pipeline
- 14.9 State-Level Policy and Incentive Differences
- 14.10 Subnational Investment Hotspots and Opportunities
- 14.11 Distribution and Logistics Networks
- 14.12 Domestic Competitive Footprint
Chapter 15 Australia Medical Devices and Healthcare Technology Technology, Innovation and Sustainability Outlook
- 15.1 Technology Landscape and Maturity
- 15.2 Product, Process and Service Innovation
- 15.3 AI, Automation and Digital Tools in the Industry
- 15.4 Technology Adoption and Performance Benchmarking
- 15.5 Innovation Pipeline and R&D Investment
- 15.6 Patent and Intellectual Property Trends
- 15.7 Energy Efficiency and Resource Management
- 15.8 Sustainability, Recycling and Circularity
- 15.9 Technology Roadmap, 2025-2035
- 15.10 Risks of Obsolescence and Technology Substitution
Chapter 16 Australia Medical Devices and Healthcare Technology Market Key Strategic Imperatives
- 16.1 Growth and Market Entry Priorities
- 16.2 High-Return Products and Segments
- 16.3 Pricing, Profitability and Cost Optimization
- 16.4 Technology Investment and Product Differentiation
- 16.5 Supply Chain Localization and Resilience
- 16.6 Distribution and Customer Acquisition
- 16.7 Partnership, Acquisition and Capacity Strategy
- 16.8 Regional Expansion Priorities
- 16.9 Short-, Medium- and Long-Term Actions
Chapter 17 Competition Outlook
- 17.1 Industry Competition Characteristics
- 17.2 Market Structure and Concentration
- 17.3 Market Share and Competitive Positioning, 2025
- 17.4 Company-Wise Revenue and Product Benchmarking
- 17.5 Production and Service Capacity Benchmarking
- 17.6 Technology, Pricing and Differentiation
- 17.7 Regional Footprint and Distribution Strength
- 17.8 Mergers, Acquisitions and Strategic Alliances
- 17.9 New Entrants and Competitive Threats
- 17.10 Porter's Five Forces and Industry Attractiveness
- 17.11 Competitive Outlook, 2025-2035
Chapter 18 Company Profiles
- 18.1 Company Coverage and Selection Criteria
- 18.2 Medtronic plc
- 18.2.1 Business Description
- 18.2.2 Company Ownership and Geographic Presence
- 18.2.3 Product and Service Portfolio
- 18.2.4 Manufacturing and Operating Footprint
- 18.2.5 Production Capacity and Expansion Plans
- 18.2.6 Financial Performance and Investment
- 18.2.7 Market Share and Competitive Position
- 18.2.8 Technology and Innovation Capabilities
- 18.2.9 Strategic Alliances or Partnerships
- 18.2.10 Recent Developments
- 18.2.11 Growth Strategy and Outlook
- 18.3 GE HealthCare Technologies
- 18.4 Johnson & Johnson MedTech
- 18.5 Siemens Healthineers AG
- 18.6 ResMed Inc.
- 18.7 Philips Healthcare
- 18.8 Stryker Corporation
- 18.9 Abbott Laboratories
- 18.10 Telstra Health
- 18.11 Becton Dickinson
- 18.12 Other Relevant Market Participants
Note: Every listed company is profiled on the structure shown under the first company. The company list is preliminary and may change based on research findings, market developments, data availability and client requirements.
Chapter 19 Disclaimer
- 19.1 Research and Forecast Disclaimer
- 19.2 Data Source and Estimation Limitations
Note: The depth of individual sections depends on data availability for this market. Volume, capacity, trade and other unit-based metrics are included where applicable.

