
High ACL surgery rates keep knee devices in steady demand
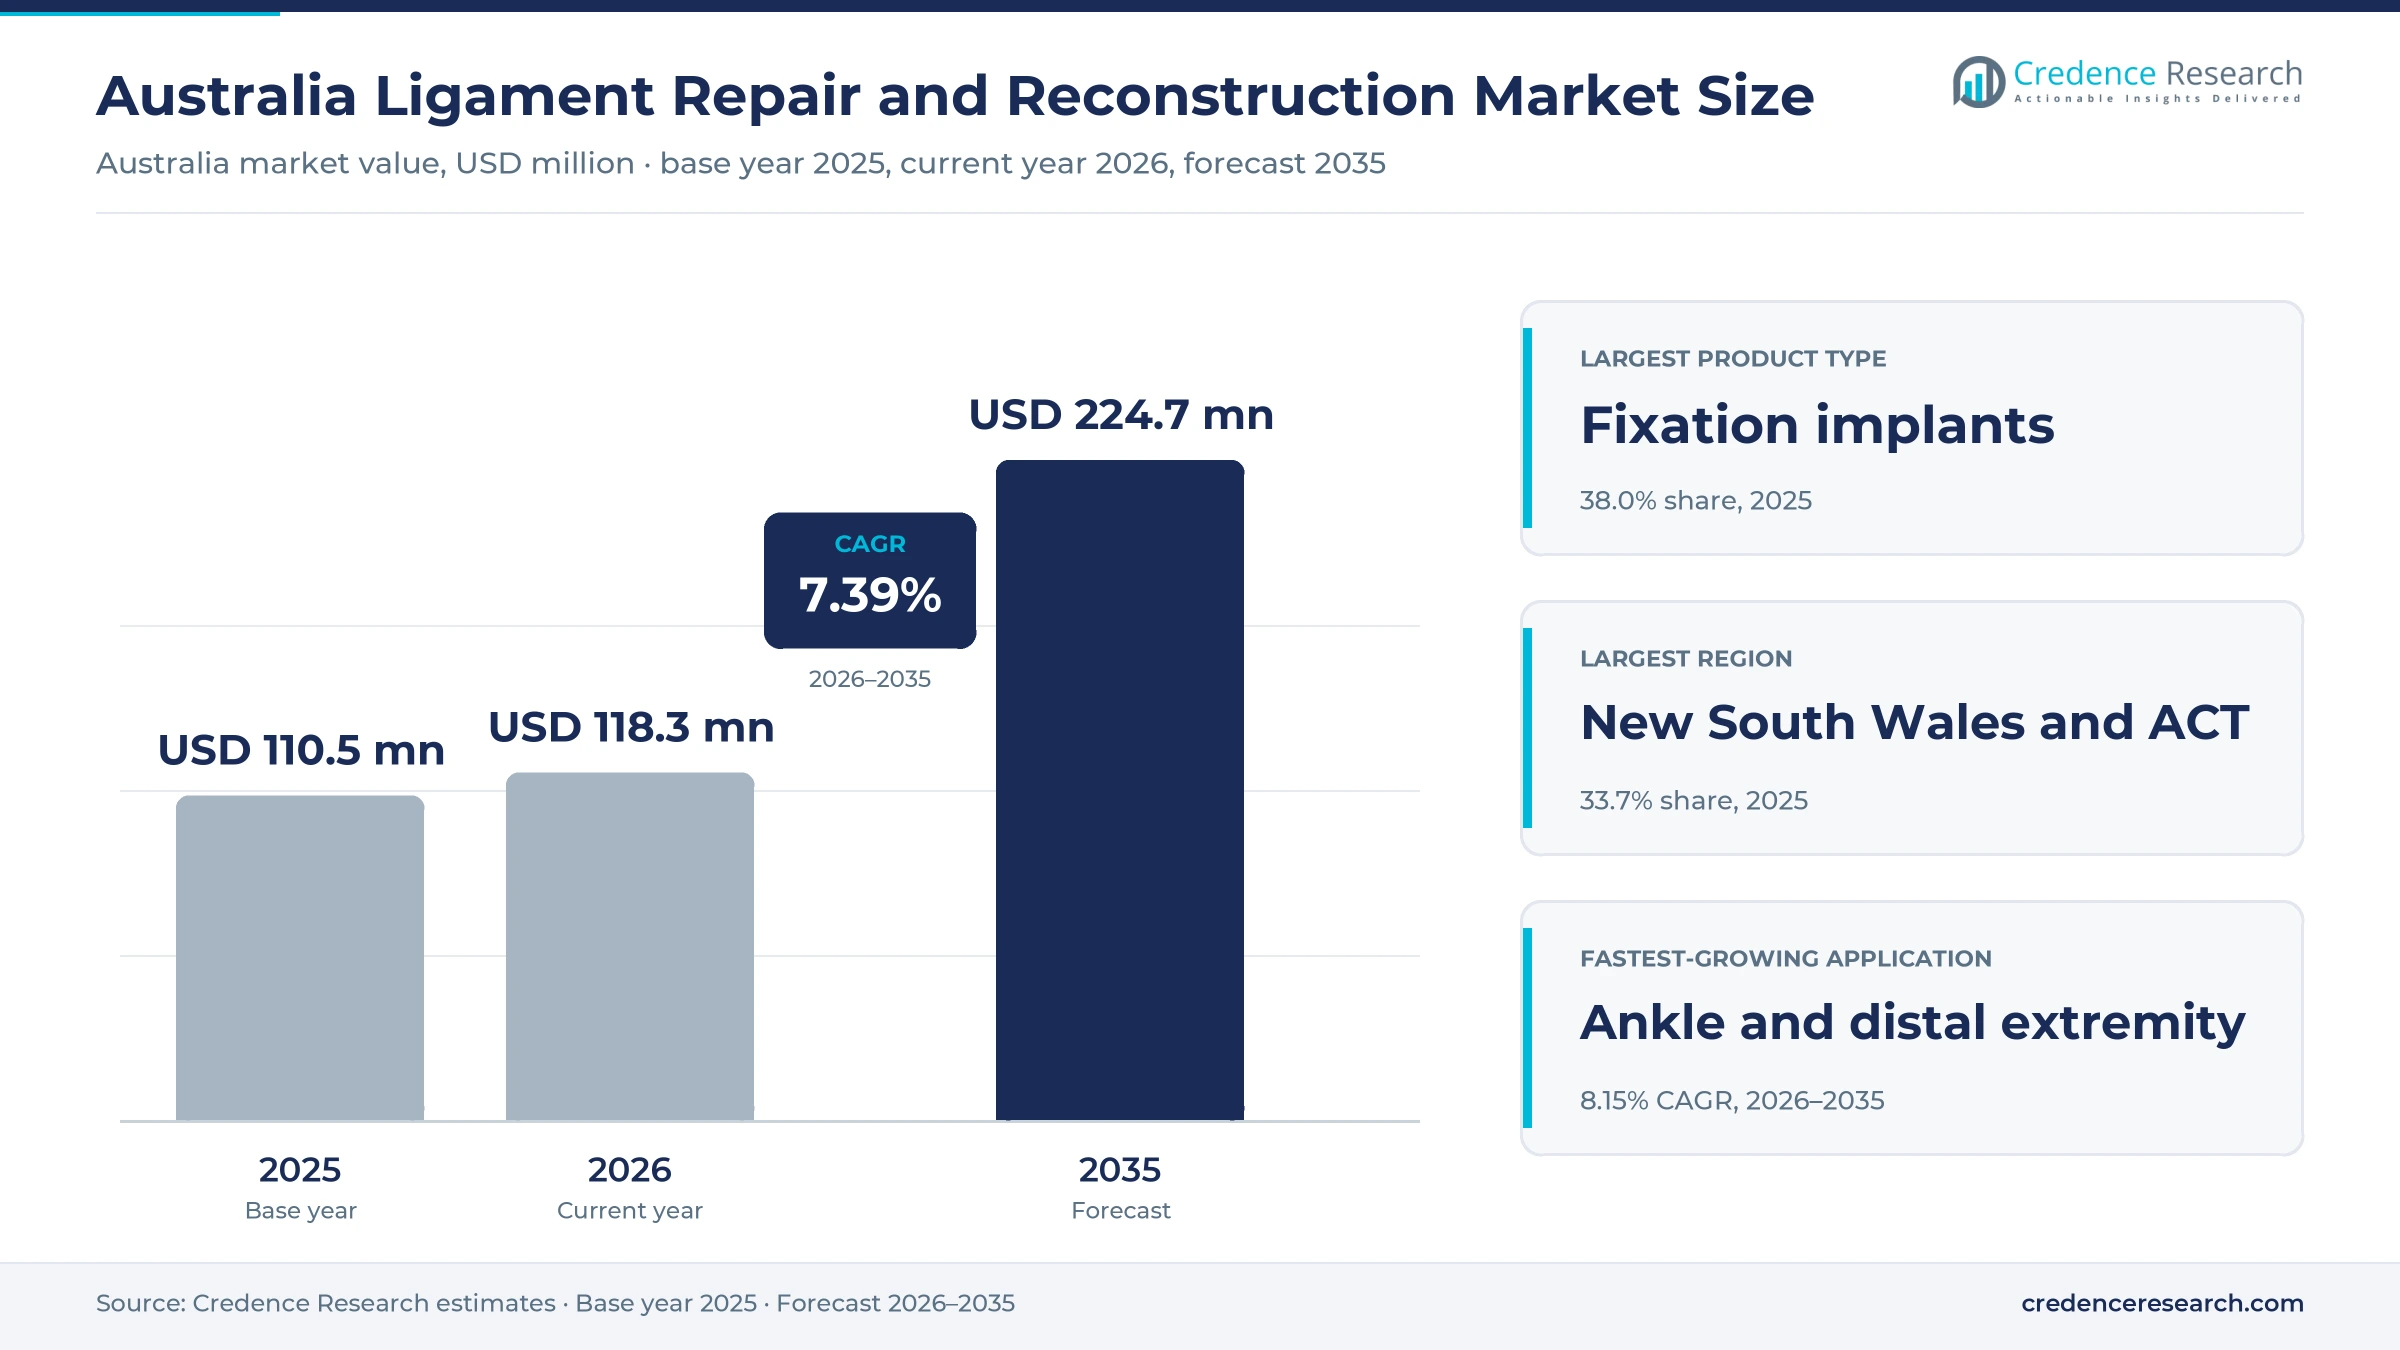
The Australia ligament repair and reconstruction market was valued at USD 110.5 million in 2025 and is projected to increase from USD 118.3 million in 2026 to USD 224.7 million by 2035, registering a CAGR of 7.39% during 2026–2035. Demand comes from young athletes who rupture knee ligaments in football, netball and other pivoting sports, adults who need shoulder and ankle soft-tissue repair, and private hospitals that perform most elective sports surgery. New South Wales and the Australian Capital Territory held the largest regional share, 33.7% in 2025, because Sydney and Canberra concentrate sports surgeons and private hospital groups. Queensland and the Northern Territory form the fastest-growing region at 7.70% a year, as population growth adds younger patients. Australia has one of the highest population-adjusted rates of ACL reconstruction in the world, which keeps device demand high. In turn, the final cut to private device benefits on July 1, 2024, has narrowed the price gap between public and private hospitals.
Which ligament repair and reconstruction devices does the estimate cover?
The estimate measures the value of devices and tissue used in ligament repair and reconstruction procedures in Australian hospitals and day surgeries. It covers fixation implants such as interference screws, buttons and suture anchors, allograft and synthetic graft products, arthroscopy consumables such as shaver blades and sutures, and reusable arthroscopy instruments. Values include sales to public hospitals, private hospitals and standalone day surgeries.
The estimate excludes joint replacement implants, external braces and supports, rehabilitation services and surgeon fees. The value chain runs from manufacturers and tissue banks through direct sales teams and specialist distributors to hospital purchasing networks, private hospital groups and independent surgical providers that treat knee, shoulder and ankle injuries.
Australia Ligament Repair and Reconstruction Market Insights
- The Australia ligament repair and reconstruction market was valued at USD 110.5 million in 2025 and is projected to reach USD 224.7 million by 2035, registering a CAGR of 7.39% during 2026–2035.
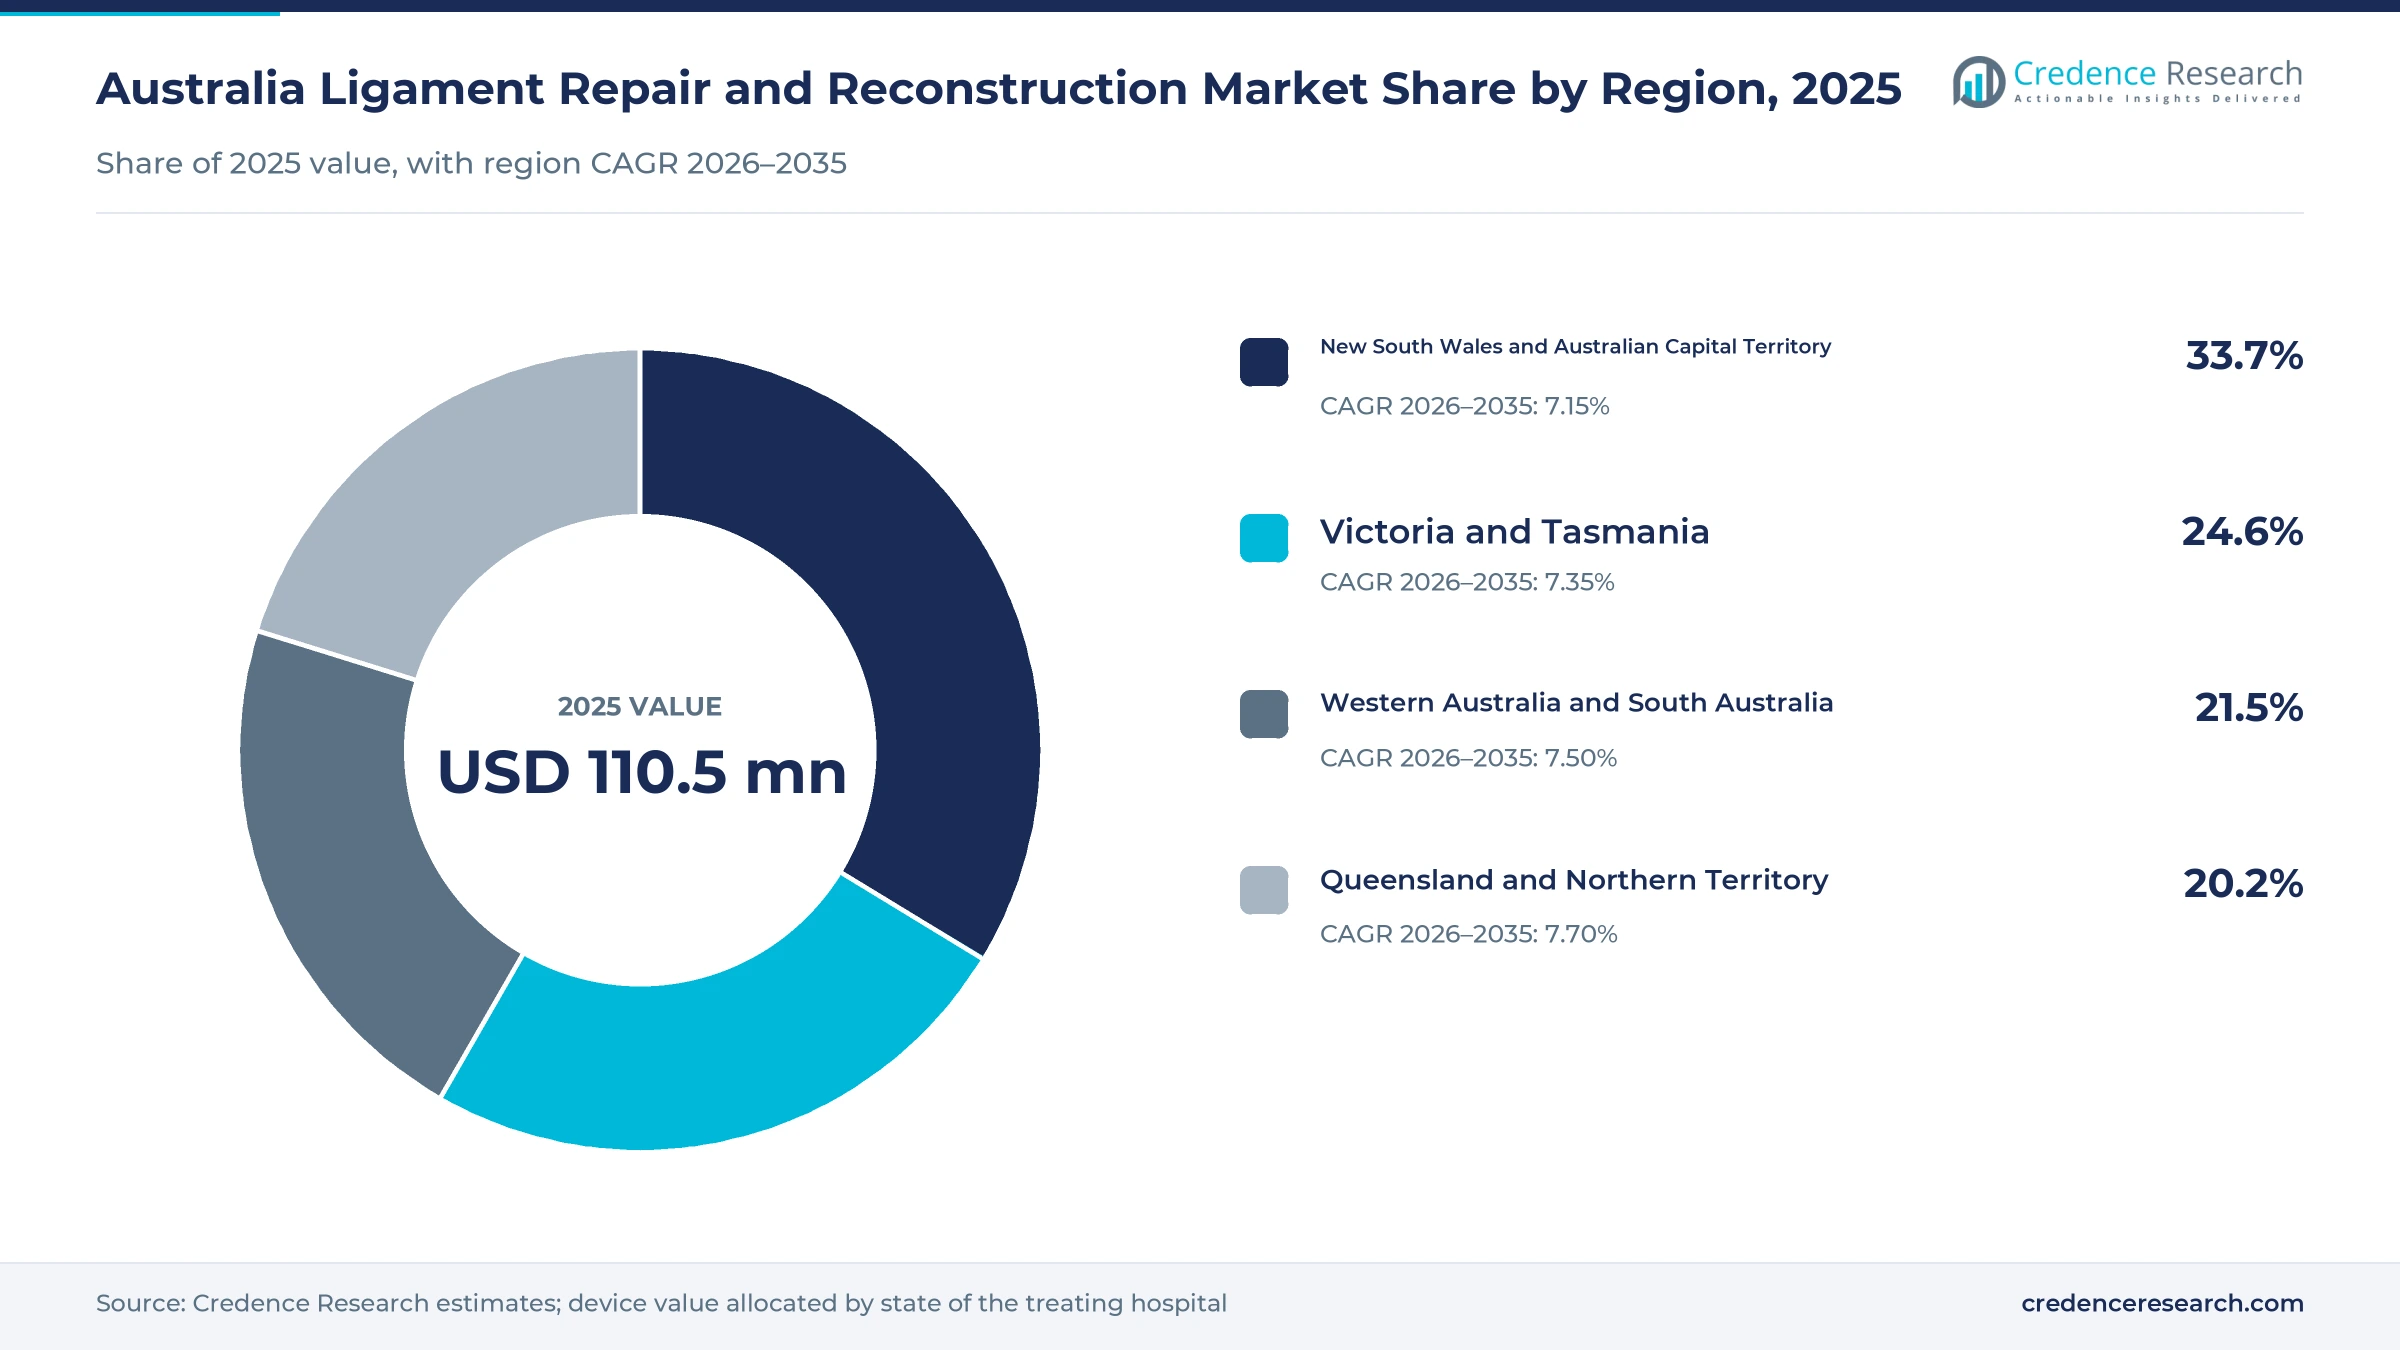
- New South Wales and the Australian Capital Territory held a 33.7% share of 2025 value, because Sydney concentrates sports surgeons and private hospitals.
- Fixation implants led with a 38.0% share of 2025 value, because every knee, shoulder and ankle repair needs screws, buttons or anchors.
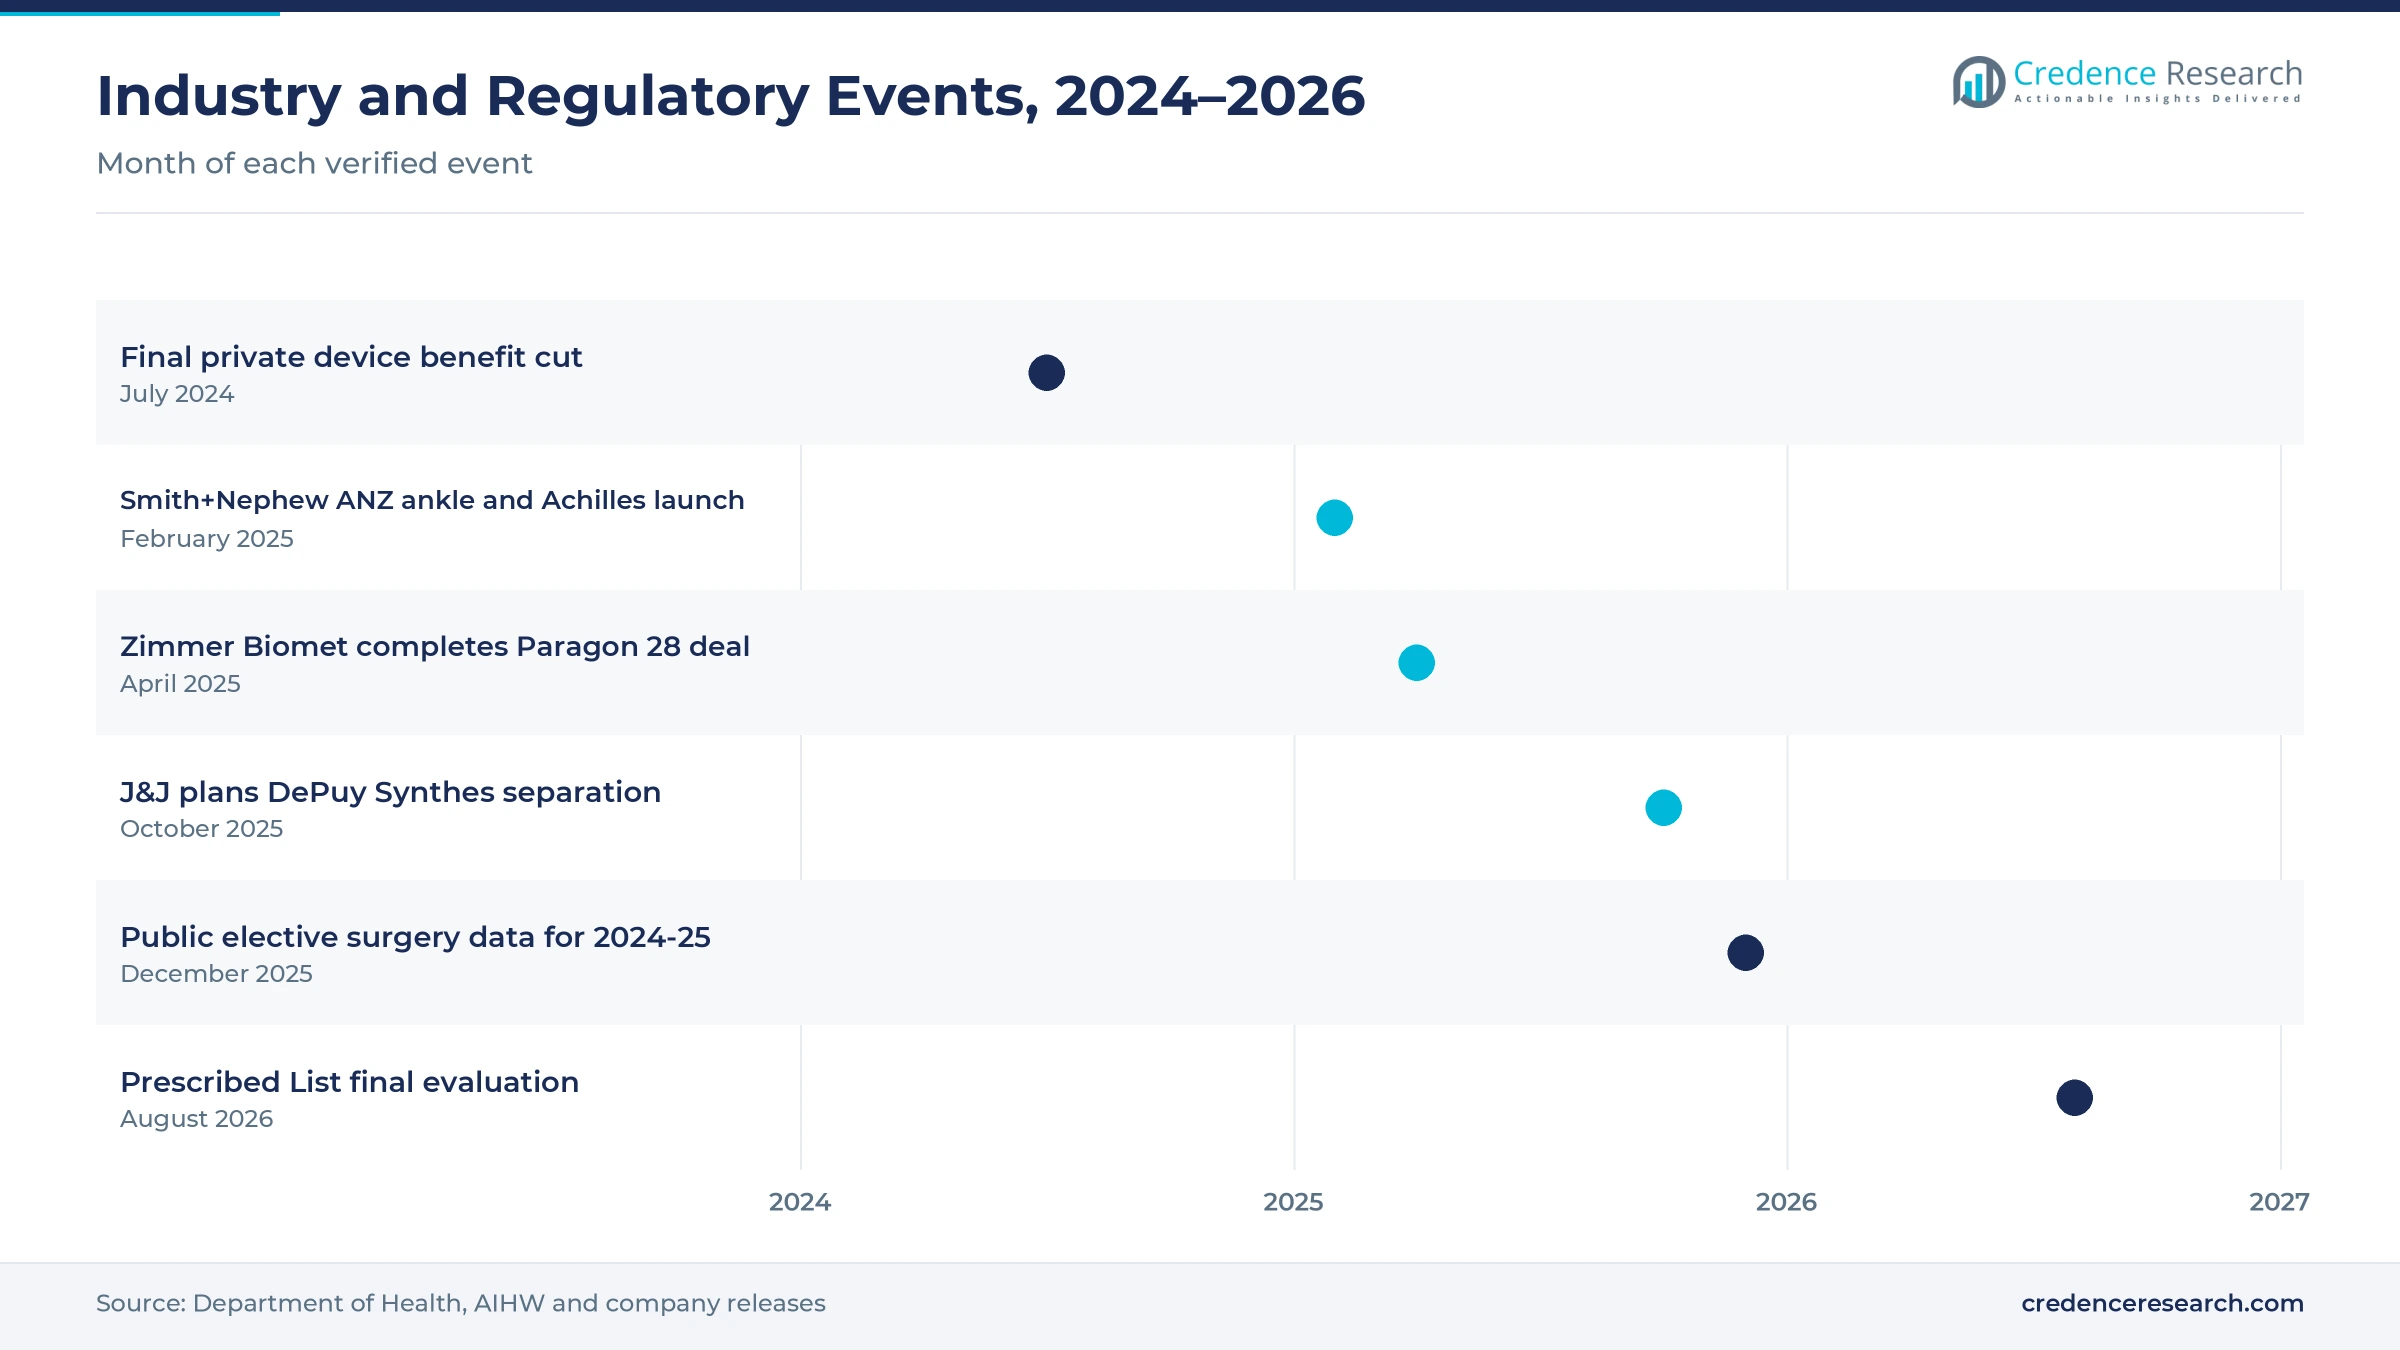
- Private device benefits fell by a final 20% of the public price gap on July 1, 2024, completing a three-step reform that began in 2022.
- Zimmer Biomet completed its acquisition of foot and ankle specialist Paragon 28 on April 21, 2025, widening its extremity repair portfolio.
Fixation implants lead while graft products grow fastest
Why do fixation implants lead product demand?
Based on product type, the market is categorized into fixation implants, graft products, arthroscopy consumables and arthroscopy instruments. Fixation Implants led with a 38.0% share of 2025 value, because every ligament repair and reconstruction needs screws, buttons or anchors to hold the graft. Graft Products grow fastest at 8.04% a year, as surgeons use more allograft and synthetic options for younger patients.
How do private hospitals and day surgeries split demand?
Based on care setting, the market is categorized into public hospitals, private hospitals and standalone day surgeries. Private Hospitals led with a 56.0% share of 2025 value, because most elective sports surgery is done for patients with private hospital cover. Standalone Day Surgeries grow fastest at 8.39% a year, as shoulder and ankle repairs move to short-stay settings.
Why does knee reconstruction dominate procedure demand?
Based on application, the market is categorized into knee ligament reconstruction, shoulder soft-tissue repair and ankle and distal extremity ligament repair. Knee Ligament Reconstruction led with a 58.0% share of 2025 value, because ACL injuries are common in pivoting sports. Ankle and Distal Extremity Ligament Repair grows fastest at 8.15% a year, as new anchors and adjustable implants widen treatment.
How do direct and distributor channels reach surgeons?
Based on sales channel, the market is categorized into direct manufacturer sales, specialist distributor sales and direct tissue supplier sales. Direct Manufacturer Sales led with a 55.0% share of 2025 value, because large manufacturers support surgeons in theater with their own staff. Direct Tissue Supplier Sales grow fastest at 7.86% a year, as hospitals buy more allograft tissue.
| Segment Group | Leading Sub-segment | Share, 2025 | Fastest-growing Sub-segment | CAGR, 2026–2035 |
|---|---|---|---|---|
| By Product Type | Fixation Implants | 38.0% | Graft Products | 8.04% |
| By Care Setting | Private Hospitals | 56.0% | Standalone Day Surgeries | 8.39% |
| By Application | Knee Ligament Reconstruction | 58.0% | Ankle and Distal Extremity Ligament Repair | 8.15% |
| By Sales Channel | Direct Manufacturer Sales | 55.0% | Direct Tissue Supplier Sales | 7.86% |
Request a Free Sample
Fill in your details and we'll send you a free sample report.
- Sample data tables & charts
- Research methodology
Sports injuries, new devices and private cover drive demand
Why does high ACL reconstruction demand anchor the market?
High ACL reconstruction demand anchors the market, because pivoting sports such as football and netball cause many knee ligament ruptures each year. Australia recorded 197,557 primary ACL reconstructions between July 2000 and June 2015, according to a national study. The annual rate rose 43% to 77.4 per 100,000 people over that period, which the authors describe as the highest population-adjusted rate in the world. The same study found a rate of 52 in the United States and 37 in New Zealand. As a result, knee ligament reconstruction holds a 58.0% share of 2025 value, as high procedure demand keeps hospitals buying grafts, fixation implants and consumables.
How does specialist product availability widen procedures?
Specialist product availability widens procedures, because new implants let surgeons repair injuries that were once treated with braces or rest. Smith+Nephew launched the ULTRABRIDGE Achilles reconstruction system and the ULTRABRACE ankle instability technique in Australia and New Zealand on Feb. 17, 2025, according to its release. Both systems let surgeons adjust suture tension after anchor insertion. Stryker's Australian sports medicine range also lists the AIR All-Inside Repair system, XBraid TT tape and ICONIX anchors. In turn, fixation implants hold a 38.0% share of 2025 value, as hospitals stock more anchors alongside arthroscopy devices for each procedure.
Why do sports medicine portfolios widen surgeon choice?
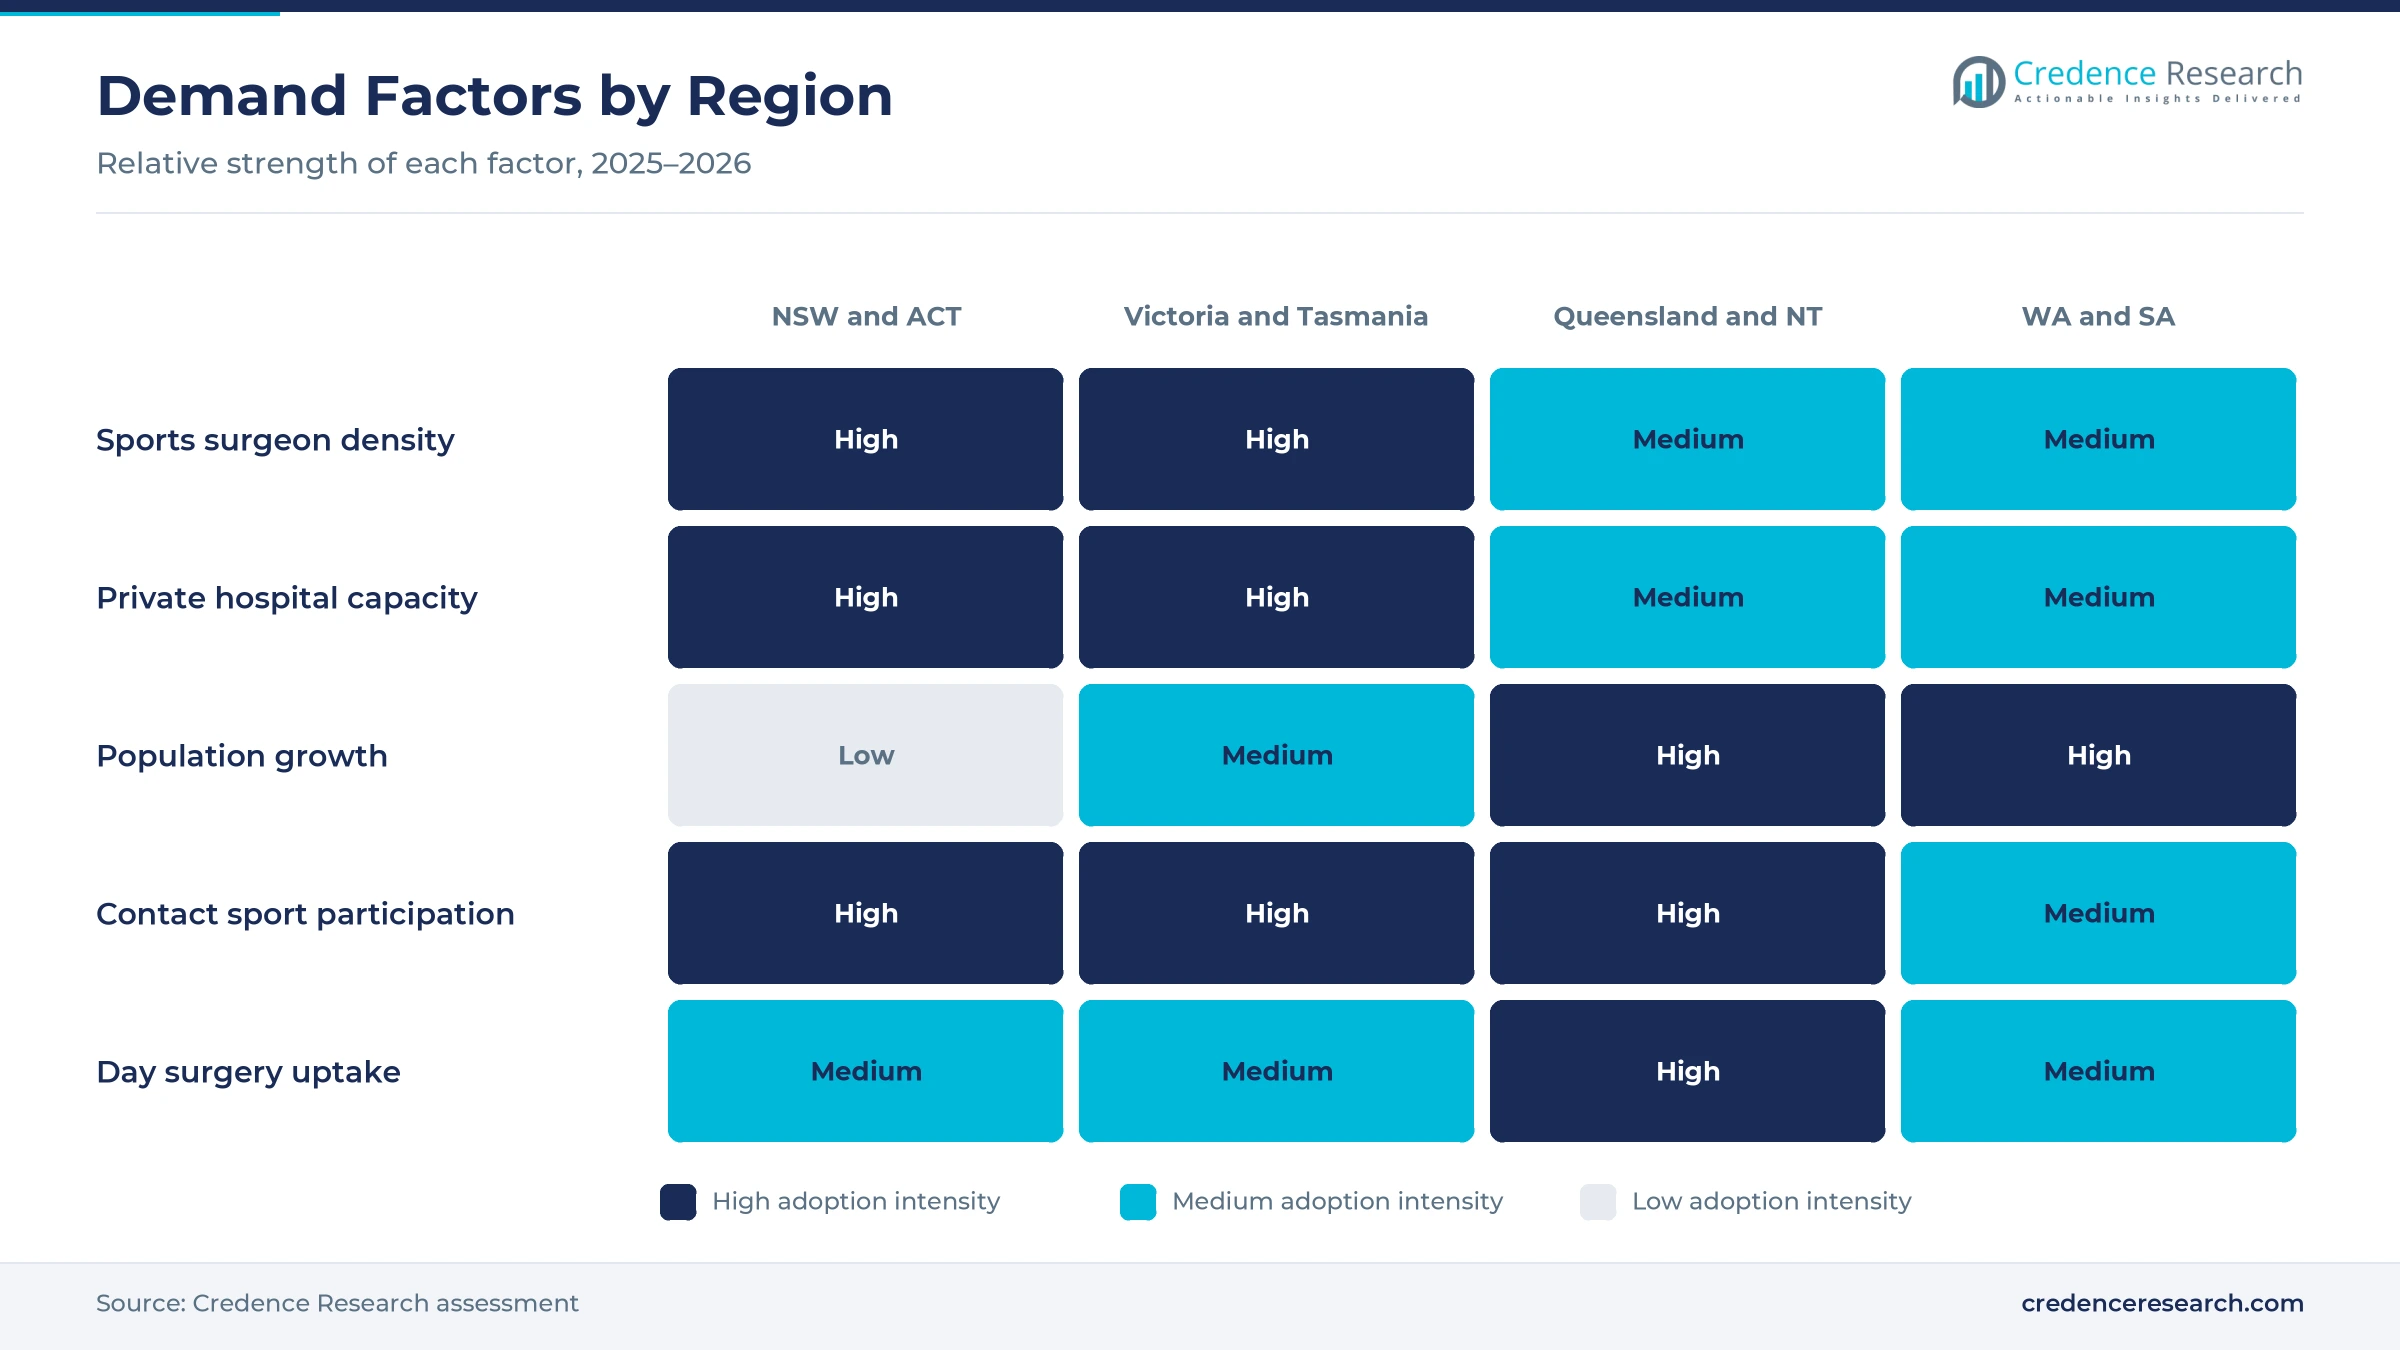
Broad sports medicine portfolios widen surgeon choice, because suppliers that cover knee, shoulder and ankle repair can support every case on a theater list. Arthrex runs a New South Wales sports medicine team focused on knee and shoulder products, alongside extremities, trauma and orthobiologics. Device Technologies became the exclusive distributor of Zimmer Biomet sports medicine products in Australia and New Zealand from April 2021. Zimmer Biomet then completed its acquisition of Paragon 28 on April 21, 2025, adding foot and ankle products. As a result, direct manufacturer sales hold a 55.0% share of 2025 value, as companies place sports medicine staff in theaters.
How does private hospital cover sustain surgery volumes?
Private hospital cover sustains surgery volumes, because insured patients can book elective repair without long public waiting lists. About 12.8 million people, or 45.8% of the population, held hospital cover at June 30, 2026, according to the prudential regulator. Insurers paid $5,330.86 million in hospital benefits in the June 2026 quarter alone. Australia also spent about 10.4% of GDP on health in 2023, up from 9.9% in 2022, according to World Bank data. As a result, private hospitals hold a 56.0% share of 2025 value, as insured athletes and workers choose faster surgery after knee and shoulder injuries.
Price gap reform and day surgery reshape device supply
How is the shift to short-stay surgery changing care?
The shift to short-stay surgery is changing where ligament repair takes place, because many shoulder and ankle cases no longer need an overnight stay. Private hospital episodes reached 1,347,202 in the June 2026 quarter, up 38.3% on the March quarter, mainly because of hospital-substitute care. Stryker's Australian sports medicine range also lists a surgery center category, which shows how suppliers now design kits for short-stay settings. In addition, public hospitals performed 791,000 elective admissions in 2024-25. In turn, standalone day surgeries grow at 8.39% a year, the fastest care setting rate, as surgeons move suitable cases out of large hospitals.
Why is the rise of price gap reform reshaping device pricing?
The rise of price gap reform is reshaping device pricing, because private benefits for many implants are now closer to public hospital prices. The health department cut benefits by 40% of the gap on July 1, 2022, 20% on July 1, 2023, and a final 20% on July 1, 2024, according to the health department. The final evaluation estimated savings of about $540 million over the three years to June 2025. Prostheses benefits also fell to 12.8% of hospital benefits in 2025 from 14.1% in 2021. As a result, direct tissue supplier sales grow at 7.86% a year, as hospitals compare graft and implant costs more closely.
Can graft products for younger patients open new growth?
Graft products for younger patients offer a growth path, because children and teenagers who rupture ligaments need durable reconstruction. ACL reconstruction rates among people under 25 rose 74% between 2000 and 2015. Children aged 5 to 14 posted the fastest annual growth, at 7.7% for boys and 8.8% for girls. The peak rate reached 283 per 100,000 for men aged 20 to 24 and 164 per 100,000 for women aged 15 to 19. In turn, graft products grow at 8.04% a year, the fastest product rate, as surgeons weigh allografts, synthetic grafts and bone graft substitutes for younger patients.
Is there room to grow ankle and extremity ligament repair?
Ankle and extremity ligament repair has room to grow, because many lateral ankle and Achilles injuries are still treated without surgery. Smith+Nephew's 2025 launches included an all-suture anchor with needles for open procedures. Zimmer Biomet's Paragon 28 deal focused on what it called the fast-growing foot and ankle orthopedic space. Arthrex also lists extremities alongside knee and shoulder work in its Australian sports medicine teams. This mix of launches and deals gives surgeons more implant choices for small joints. As a result, ankle and distal extremity ligament repair grows at 8.15% a year, the fastest application rate, as surgeons adopt suture anchor techniques for unstable ankles.
Benefit cuts, waiting lists and patient gaps test suppliers
How do benefit cuts compress device prices?
Benefit cuts compress device prices, because private insurers now pay less for many implants listed on the Prescribed List. The median gap above public prices for affected products fell from $177 to $35 after the reforms. As a result, suppliers earn less on each fixation implant sold to private hospitals. Companies respond with bundled kits, new products listed at higher benefits and closer cost control in their sales and service teams.
Why do public waiting lists delay ligament surgery?
Public waiting lists delay ligament surgery, because elective sports procedures rank behind urgent cases in public hospitals. The median wait for public elective surgery was 45 days in 2024-25, and many orthopedic cases wait longer than that median. In turn, uninsured patients may delay knee reconstruction and risk further cartilage damage. Hospitals respond with surgery blitzes, outsourcing to private hospitals and more short-stay theater sessions that clear elective lists faster.
How do rising out-of-pocket gaps deter private patients?
Rising out-of-pocket gaps deter some private patients, because they still pay gaps for surgeon, anesthesia and hospital charges. The average hospital episode gap rose 7.5% to $513.24 in the June 2026 quarter. As a result, some insured patients delay surgery or choose public treatment, which shifts volume away from private theaters. Providers respond with no-gap surgeon schemes, day surgery pathways and clearer cost quotes before treatment begins.
Why does graft failure risk shape product choices?
Graft failure risk shapes product choices, because young athletes who return to pivoting sports face higher rates of repeat injury. Revision surgery needs more complex fixation, larger grafts and longer rehabilitation than a first reconstruction. In turn, surgeons and hospitals carry higher costs and longer theater times for each revision case. Suppliers respond with revision kits, stronger fixation devices, surgeon training programs and outcome data that support product selection.
New South Wales leads while Queensland grows fastest
| Region | Value, 2025 (USD million) | Share, 2025 | CAGR, 2026–2035 |
|---|---|---|---|
| New South Wales and Australian Capital Territory | 37.2 | 33.7% | 7.15% |
| Victoria and Tasmania | 27.2 | 24.6% | 7.35% |
| Western Australia and South Australia | 23.8 | 21.5% | 7.50% |
| Queensland and Northern Territory | 22.3 | 20.2% | 7.70% |
Why do New South Wales and the ACT hold the largest share?
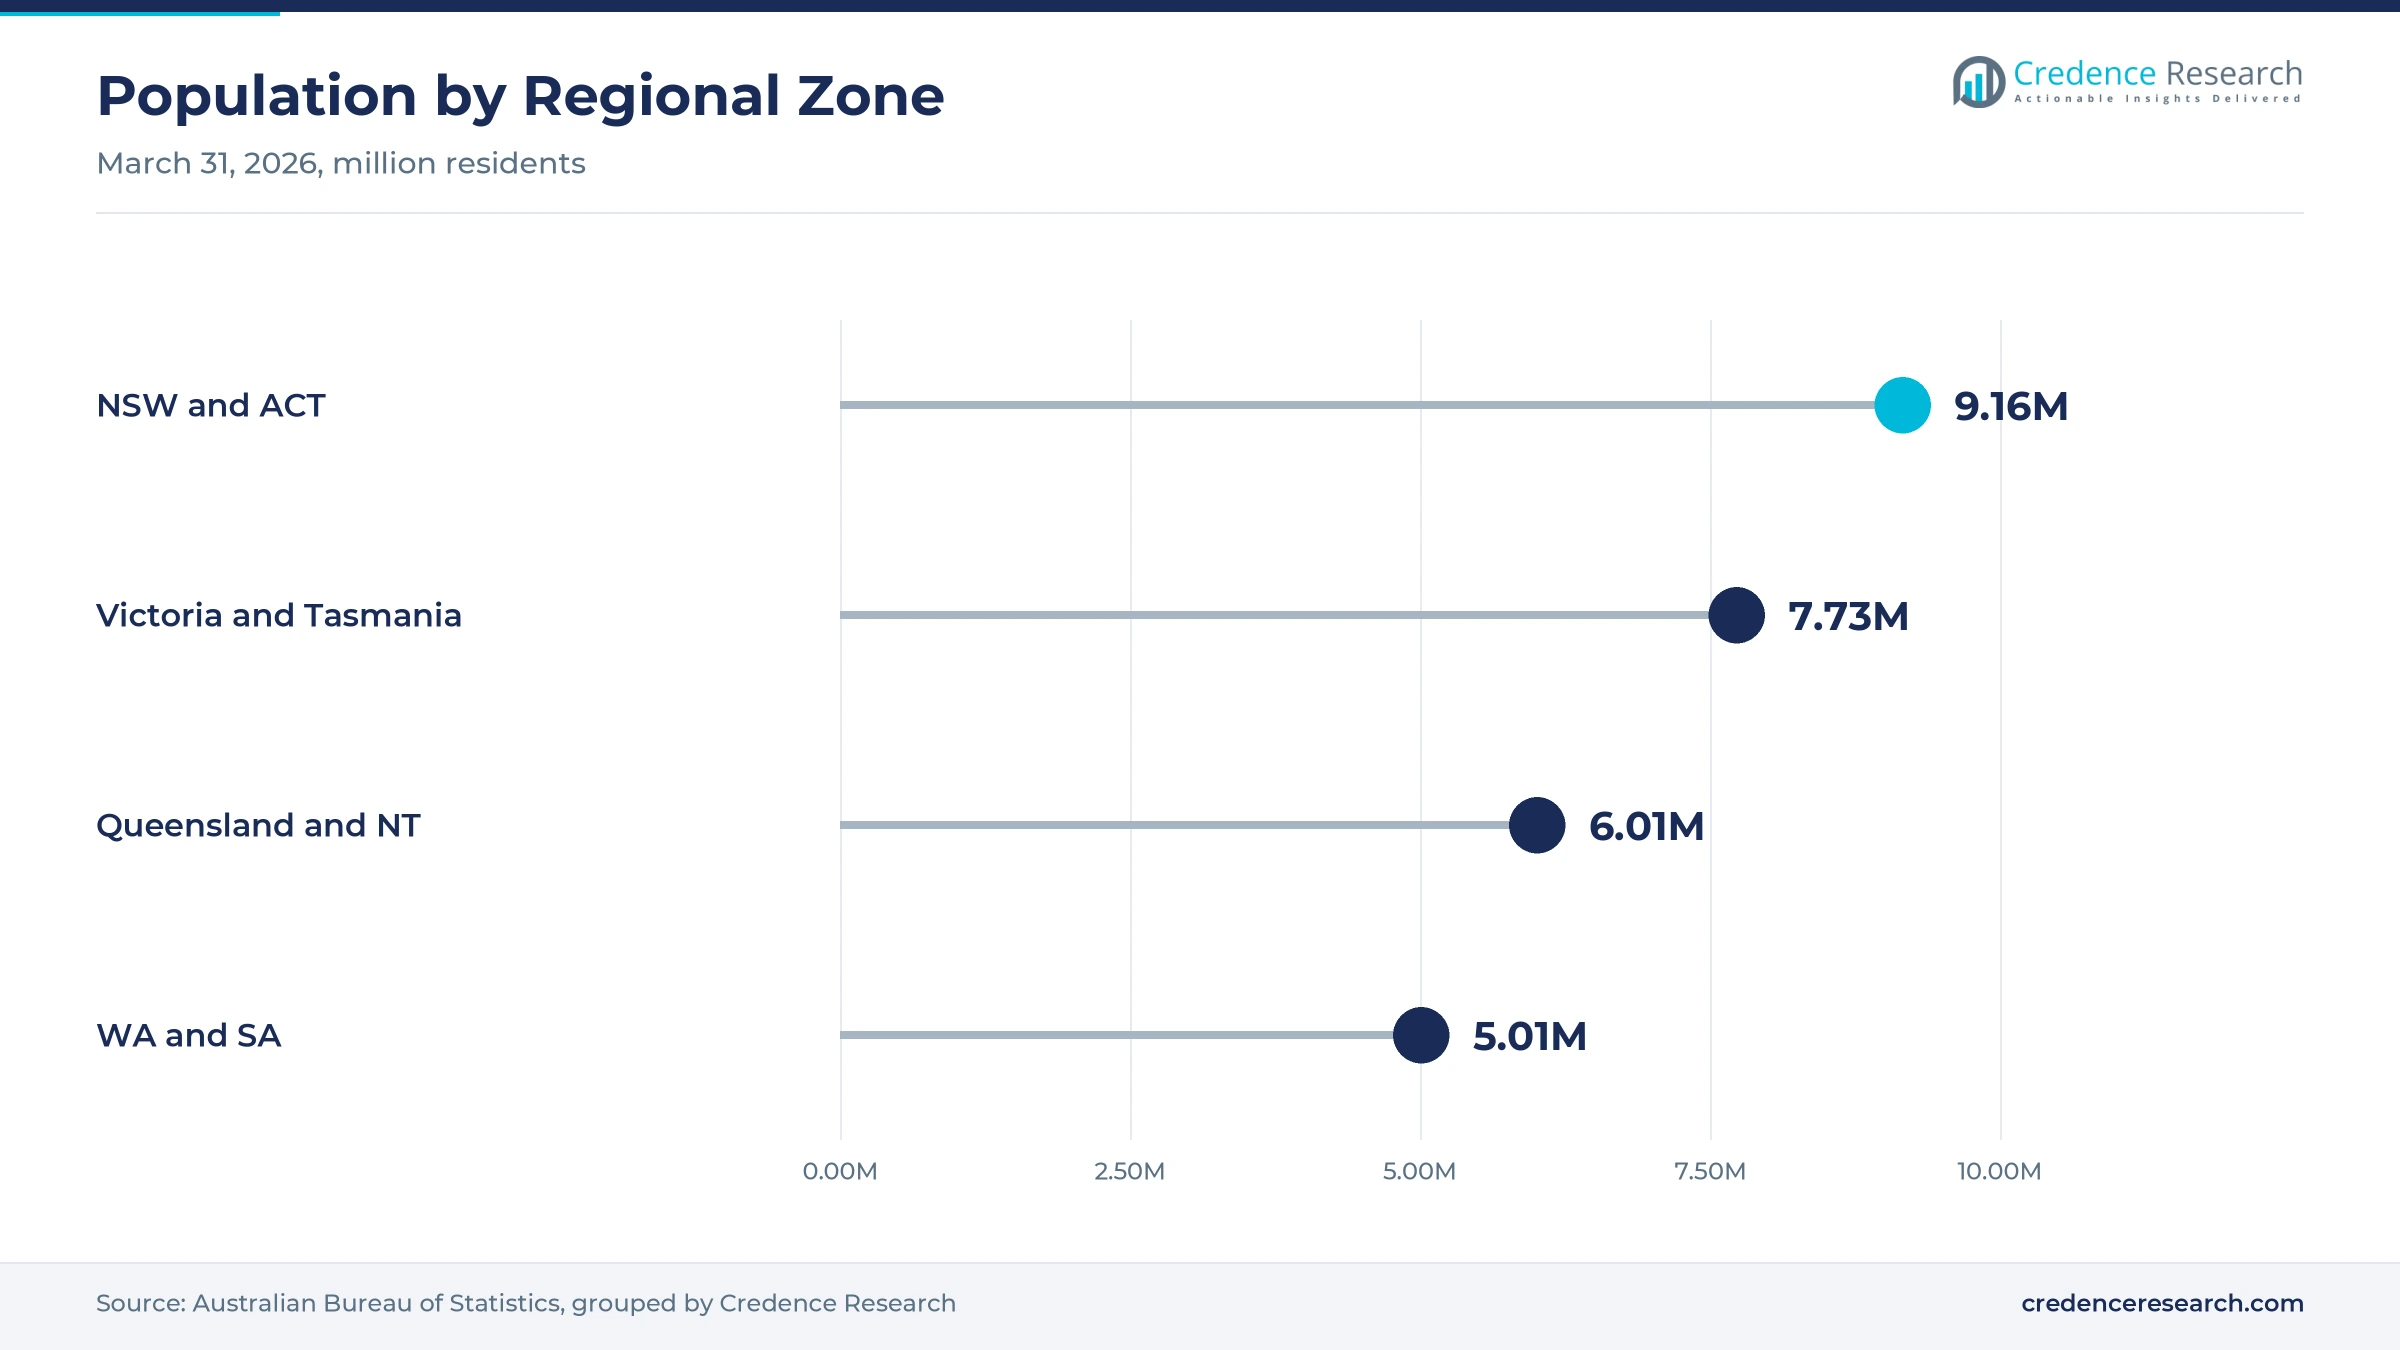
New South Wales and the Australian Capital Territory held a 33.7% share of 2025 value and grow at 7.15% a year, because Sydney and Canberra concentrate sports surgeons, private hospitals and professional sports teams. The two jurisdictions had about 9.16 million residents at March 31, 2026. However, growth is slower than in other zones, as New South Wales grew only 1.1% in the year to March 2026.
How do Victoria and Tasmania support device demand?
Victoria and Tasmania held a 24.6% share of 2025 value and grow at 7.35% a year, because Melbourne hosts large private hospital groups and a strong football culture that produces many knee injuries. The two states had about 7.73 million residents at March 31, 2026. Victoria added about 109,500 residents in the year, which supports steady demand for sports surgery.
What drives Western Australia and South Australia demand?
Western Australia and South Australia held a 21.5% share of 2025 value and grow at 7.50% a year, because Perth and Adelaide run large private orthopedic practices. Western Australia posted the fastest state population growth at 2.1% in the year to March 2026. As a result, demand for knee and shoulder repair rises among younger workers and athletes in Perth.
Why do Queensland and the Northern Territory grow fastest?
Queensland and the Northern Territory held a 20.2% share of 2025 value and grow fastest at 7.70% a year, because Queensland added about 90,100 residents in the year to March 2026. Private hospital investment in southeast Queensland also adds theater capacity for sports surgery.
Launches, acquisitions and device reform from 2024 to 2026
| Development | Status and market relevance |
|---|---|
| In July 2024, the final 20% cut to the private device price gap took effect. | Completed the three-step benefit reform that began in 2022 |
| In February 2025, Smith+Nephew launched ULTRABRIDGE and ULTRABRACE in Australia and New Zealand. | Added adjustable tension repair for Achilles and ankle injuries |
| In April 2025, Zimmer Biomet completed its acquisition of Paragon 28. | Added a foot and ankle specialist portfolio |
| In October 2025, Johnson & Johnson announced its intent to separate its orthopedics business as DePuy Synthes. | Targeted completion within 18 to 24 months |
| In August 2026, the final evaluation of the Prescribed List reforms was released. | Estimated about $540 million in savings over three years |
All-suture anchors and adjustable fixation reshape surgery
- All-suture anchors use soft suture instead of rigid implants, which preserves bone and suits small joints such as the ankle and shoulder.
- Adjustable tension fixation lets surgeons refine graft or repair tension after anchor insertion, which supports activity-based repair.
- All-inside reconstruction systems build and fix knee grafts through small portals, which shortens incisions and recovery.
- High-definition arthroscopy towers combine cameras, displays and fluid control, which improves views during knee and shoulder repair.
Need a Custom Version of This Report?
Tailor the scope, geography, or segments to your exact requirements.
- Custom geography or segment scope
- Direct access to our analyst team
Sports medicine specialists compete on surgeon support
Competition is led by global sports medicine manufacturers that sell directly to hospitals, alongside specialist distributors and tissue suppliers. Smith+Nephew launched adjustable Achilles and ankle repair systems in Australia and New Zealand in February 2025. Stryker offers an Australian sports medicine range across knee, shoulder, hip and small joints, including all-inside repair and anchor systems. Arthrex runs sports medicine sales teams in New South Wales focused on knee and shoulder products. Zimmer Biomet sells its sports medicine portfolio through Device Technologies and added Paragon 28 in April 2025. DePuy Synthes is preparing to separate from Johnson & Johnson as a standalone orthopedics company. Rivals compete on surgeon training, theater support, implant range, benefit listings and pricing for private hospital groups.
Companies profiled and their roles in this market
| Company | Type | Role in the market |
|---|---|---|
| Smith+Nephew Australia | Sports medicine manufacturer | Launched ULTRABRIDGE and ULTRABRACE in Australia in February 2025 |
| Stryker Australia | Sports medicine manufacturer | Offers AIR All-Inside Repair, XBraid TT and ICONIX in Australia |
| Arthrex Australia | Sports medicine manufacturer | Runs New South Wales knee and shoulder sales teams |
| Zimmer Biomet Australia | Orthopedic manufacturer | Sells sports medicine products through Device Technologies |
| Device Technologies | Specialist distributor | Exclusive Zimmer Biomet sports medicine distributor since April 2021 |
Credence Research view on Australian soft-tissue repair
Credence Research's view is that Australian ligament repair and reconstruction value will grow steadily because the country keeps very high rates of sports injury surgery. Knee reconstruction remains the core application, while ankle repair, graft products and day surgeries gain share. Benefit reform has narrowed private device prices, although new products and rising procedure volumes still support growth. Suppliers that combine broad portfolios, surgeon training and theater support should gain share fastest across public and private hospitals.
How the Australian ligament device estimate was built
The report uses 2025 as the base year on a calendar basis, and market values come from the Credence Research model. That model combines published ACL reconstruction rates, private health insurance statistics, health department device benefit rules and evaluations, public hospital surgery data, World Bank health spending data, population statistics and company product announcements. Segment splits and regional growth rates are Credence Research estimates, while regional shares follow the client-defined split. Sources used are public reports, official statistics, journal articles, trade press and company releases, and no interviews or surveys were used.
Young patients and private surgery carry growth to 2035
Device value is expected to reach USD 224.7 million by 2035, a 7.39% CAGR during 2026–2035, as sports injuries, new implants and private surgery keep demand rising. Growth should stay strong through 2028 as more shoulder and ankle cases move to day surgeries. After that, graft products and extremity repair will carry more growth. Further benefit cuts would slow price growth, while shorter public waiting lists would lift procedure volumes. Suppliers with broad portfolios and strong surgeon support are expected to gain the most.
Frequently Asked Questions
How big is the Australia ligament repair and reconstruction market?
Which product type leads Australian ligament device value?
Which region leads the Australia ligament repair and reconstruction market?
How common is ACL reconstruction in Australia?
How did device benefit reform affect implant prices?
Which care setting is growing fastest?
Who are the leading ligament repair suppliers in Australia?
What are the main challenges for ligament device suppliers?
Table of Content
Chapter 1 Market Segmentation
- 1.1 Segmentation Framework
- 1.1.1 Product and Service Classification
- 1.1.2 Application and End-Use Classification
- 1.1.3 Technology and Solution Classification
- 1.1.4 Customer and Distribution Channel Classification
- 1.1.5 Geographic Segmentation
- 1.1.6 Market Segment Definitions and Boundaries
- 1.2 By Product Type
- 1.2.1 Fixation Implants
- 1.2.2 Graft Products
- 1.2.3 Arthroscopy Consumables
- 1.2.4 Arthroscopy Instruments
- 1.3 By Care Setting
- 1.3.1 Public Hospitals
- 1.3.2 Private Hospitals
- 1.3.3 Standalone Day Surgeries
- 1.4 By Application
- 1.4.1 Knee Ligament Reconstruction
- 1.4.2 Shoulder Soft-Tissue Repair
- 1.4.3 Ankle and Distal Extremity Ligament Repair
- 1.5 By Sales Channel
- 1.5.1 Direct Manufacturer Sales
- 1.5.2 Specialist Distributor Sales
- 1.5.3 Direct Tissue Supplier Sales
Chapter 2 Introduction
- 2.1 Report Objectives and Scope
- 2.2 Product Definition and Industry Terminology
- 2.3 Market Inclusions and Exclusions
- 2.4 Research Process
- 2.4.1 Primary Research and Expert Interviews
- 2.4.2 Secondary Research and Source Review
- 2.4.3 Top-Down and Bottom-Up Estimation
- 2.4.4 Data Triangulation and Verification
- 2.5 Market Size Measurement Basis
- 2.5.1 2025: USD 110.5 million → 2035: USD 224.7 million
- 2.6 Historical and Forecast Reference Periods
- 2.6.1 Historical Period: 2018-2025
- 2.6.2 Base Year: 2025
- 2.6.3 Forecast Period: 2025-2035
- 2.7 Research Assumptions and Limitations
Chapter 3 Executive Summary
- 3.1 Market Snapshot and Key Findings
- 3.2 Base-Year Market Size, 2025
- 3.3 Forecast Market Size, 2035
- 3.4 Revenue and Volume Growth Outlook
- 3.5 Key Demand and Supply Indicators
- 3.6 Leading Market Segments
- 3.7 Fastest-Growing Market Opportunities
- 3.8 Regional Performance Highlights
- 3.9 Technology and Industry Transformation
- 3.10 Competitive Landscape Summary
- 3.11 Analyst View and Strategic Implications
Chapter 4 Australia Ligament Repair and Reconstruction Market Trends and Developments
- 4.1 Historical Industry Development, 2018-2025
- 4.2 Recent Market Trends and Developments
- 4.3 Demand and Customer Behavior Trends
- 4.4 Technology and Product Innovation
- 4.5 Artificial Intelligence, Automation and Digitalization
- 4.6 Local Manufacturing and Supply Chain Realignment
- 4.7 Industry Partnerships, Mergers and Acquisitions
- 4.8 Sustainability and Circular Economy Developments
- 4.9 Government and Private Sector Investment Trends
- 4.10 Emerging Business Models and Commercialization
- 4.11 Industry Developments and Announcements
Chapter 5 Australia Ligament Repair and Reconstruction Market Production, Supply and Demand Analysis
- 5.1 Demand Trend and Consumption Analysis, 2018-2025
- 5.2 Demand Forecast, 2025-2035
- 5.3 Production and Output Trend, 2018-2025
- 5.4 Production and Output Forecast, 2025-2035
- 5.5 Installed Capacity and Capacity Utilization
- 5.6 Company-Wise Production Plants and Statistics
- 5.6.1 Installed Production Capacity
- 5.6.2 Actual Production
- 5.6.3 Planned Capacity and Expansion Targets
- 5.7 Supply Chain Structure and Procurement Trends
- 5.8 Supply-Demand Gap and Bottlenecks
- 5.9 Import Dependence and Sourcing Structure
- 5.10 Contract Manufacturing and Outsourcing
- 5.11 Regional Supply and Demand Concentration
Chapter 6 Australia Ligament Repair and Reconstruction Market Pricing Analysis
- 6.1 Pricing Structure and Measurement
- 6.2 Historical Pricing Trends, 2018-2025
- 6.3 Pricing Outlook, 2025-2035
- 6.4 Average Selling Price and Unit Economics
- 6.5 Pricing by Product and Market Segment
- 6.6 Geographic Pricing Differences
- 6.7 Key Input, Energy, Labor and Logistics Costs
- 6.8 Contract Pricing and Purchasing Models
- 6.9 Pricing Sensitivity and Competitive Positioning
- 6.10 Price, Margin and Profitability Implications
Chapter 7 Australia Ligament Repair and Reconstruction Market Dynamics
- 7.1 Market Growth Drivers
- 7.1.1 Demand-Side Drivers
- 7.1.2 Technology and Innovation Drivers
- 7.1.3 Infrastructure and Investment Drivers
- 7.1.4 Regulatory and Policy Drivers
- 7.2 Market Restraints
- 7.2.1 Cost and Affordability Constraints
- 7.2.2 Technology and Adoption Barriers
- 7.2.3 Supply Chain and Operational Constraints
- 7.3 Market Challenges
- 7.3.1 Competitive Pressure and Margin Erosion
- 7.3.2 Skills, Infrastructure and Implementation Gaps
- 7.4 Emerging Market Opportunities
- 7.5 Market Dynamics Impact and Time-Horizon Assessment
Chapter 8 Australia Ligament Repair and Reconstruction Value Chain Analysis
- 8.1 Industry Value Chain Overview
- 8.2 Upstream Suppliers and Critical Inputs
- 8.3 Technology and Component Providers
- 8.4 Manufacturing or Service Delivery
- 8.5 Distribution, Channel Partners and Integrators
- 8.6 Downstream Applications and End Users
- 8.7 Value Addition and Profit Pools
- 8.8 Vertical Integration and Outsourcing
- 8.9 Supplier Concentration and Risk
- 8.10 Supply Chain Localization and Resilience
Chapter 9 Australia Ligament Repair and Reconstruction Market Regulations and Policies
- 9.1 Relevant Laws, Standards and Compliance Frameworks
- 9.2 Product, Service, Safety and Quality Requirements
- 9.3 Government Policies, Incentives and Subsidies
- 9.4 Imports, Exports and Trade Barriers
- 9.5 Public Procurement and Local Content Requirements
- 9.6 Environmental and Sustainability Compliance
- 9.7 Upcoming Policy Changes and Market Implications
Chapter 10 Australia Ligament Repair and Reconstruction Market Hotspots and Opportunities
- 10.1 Market Opportunity Mapping and Growth Hotspots
- 10.2 High-Growth Applications and Customer Groups
- 10.3 Underserved Markets and White-Space Opportunities
- 10.4 Emerging Technology and Product Opportunities
- 10.5 New Capacity and Investment Hotspots
- 10.6 Market Entry and Expansion Opportunities
- 10.7 Distribution and Partnership Opportunities
- 10.8 Near-Term and Long-Term Commercial Potential
- 10.9 Opportunity Attractiveness and Execution Risks
Chapter 11 Australia Ligament Repair and Reconstruction Market Outlook, 2025-2035
- 11.1 Market Size and Analysis
- 11.1.1 Revenue (Market Measurement: 2025: USD 110.5 million → 2035: USD 224.7 million)
- 11.1.2 Market Volume and Quantity Sold
- 11.1.3 Historical Market Size, 2018-2025
- 11.1.4 Base-Year Market Size, 2025
- 11.2 Market Forecast, 2025-2035
- 11.2.1 Revenue Forecast to 2035
- 11.2.2 Volume Forecast to 2035
- 11.2.3 CAGR and Year-on-Year Growth
- 11.2.4 Incremental Revenue Opportunity
- 11.3 Forecast Assumptions and Scenario Analysis
- 11.3.1 Base-Case Forecast
- 11.3.2 Optimistic and Conservative Scenarios
- 11.3.3 Technology, Pricing and Policy Sensitivities
- 11.4 Market Attractiveness and Growth Outlook
Chapter 12 Australia Ligament Repair and Reconstruction Market Segmentation and Outlook
- 12.1 Segmentation Summary and Market Shares, 2025
- 12.2 Largest and Fastest-Growing Segments
- 12.3 By Product Type - Market Size and Forecast, 2025-2035
- 12.3.1 Segment Definition and Scope
- 12.3.2 Historical Market Size, 2018-2025
- 12.3.3 Revenue Forecast, 2025-2035
- 12.3.4 Volume Forecast, 2025-2035
- 12.3.5 Base-Year Market Share, 2025
- 12.3.6 Segment CAGR and Growth Drivers
- 12.3.7 Subsegment Market Size and Forecast
- 12.3.7.1 Fixation Implants
- 12.3.7.2 Graft Products
- 12.3.7.3 Arthroscopy Consumables
- 12.3.7.4 Arthroscopy Instruments
- 12.3.8 Subsegment Pricing and Adoption Trends
- 12.3.9 Leading Suppliers and Competition
- 12.3.10 Regional Demand and Opportunities
- 12.4 By Care Setting - Market Size and Forecast, 2025-2035
- 12.4.1 Segment Definition and Scope
- 12.4.2 Historical Market Size, 2018-2025
- 12.4.3 Revenue Forecast, 2025-2035
- 12.4.4 Volume Forecast, 2025-2035
- 12.4.5 Base-Year Market Share, 2025
- 12.4.6 Segment CAGR and Growth Drivers
- 12.4.7 Subsegment Market Size and Forecast
- 12.4.7.1 Public Hospitals
- 12.4.7.2 Private Hospitals
- 12.4.7.3 Standalone Day Surgeries
- 12.4.8 Subsegment Pricing and Adoption Trends
- 12.4.9 Leading Suppliers and Competition
- 12.4.10 Regional Demand and Opportunities
- 12.5 By Application - Market Size and Forecast, 2025-2035
- 12.5.1 Segment Definition and Scope
- 12.5.2 Historical Market Size, 2018-2025
- 12.5.3 Revenue Forecast, 2025-2035
- 12.5.4 Volume Forecast, 2025-2035
- 12.5.5 Base-Year Market Share, 2025
- 12.5.6 Segment CAGR and Growth Drivers
- 12.5.7 Subsegment Market Size and Forecast
- 12.5.7.1 Knee Ligament Reconstruction
- 12.5.7.2 Shoulder Soft-Tissue Repair
- 12.5.7.3 Ankle and Distal Extremity Ligament Repair
- 12.5.8 Subsegment Pricing and Adoption Trends
- 12.5.9 Leading Suppliers and Competition
- 12.5.10 Regional Demand and Opportunities
- 12.6 By Sales Channel - Market Size and Forecast, 2025-2035
- 12.6.1 Segment Definition and Scope
- 12.6.2 Historical Market Size, 2018-2025
- 12.6.3 Revenue Forecast, 2025-2035
- 12.6.4 Volume Forecast, 2025-2035
- 12.6.5 Base-Year Market Share, 2025
- 12.6.6 Segment CAGR and Growth Drivers
- 12.6.7 Subsegment Market Size and Forecast
- 12.6.7.1 Direct Manufacturer Sales
- 12.6.7.2 Specialist Distributor Sales
- 12.6.7.3 Direct Tissue Supplier Sales
- 12.6.8 Subsegment Pricing and Adoption Trends
- 12.6.9 Leading Suppliers and Competition
- 12.6.10 Regional Demand and Opportunities
- 12.7 Segment Growth Comparison
- 12.8 Segment Attractiveness and Priority Matrix
Chapter 13 Australia Ligament Repair and Reconstruction End-Use and Application Market Outlook
- 13.1 End-Use Industry and Customer Demand Structure
- 13.2 Leading Applications and Customer Groups
- 13.3 End-Use Market Size, Share and Forecast
- 13.4 Major End-Use Industry Deep Dives
- 13.4.1 Customer Requirements and Use Cases
- 13.4.2 Demand and Replacement Cycles
- 13.4.3 Technical and Regulatory Considerations
- 13.4.4 Purchasing and Procurement Models
- 13.4.5 Leading Vendors and Distribution Channels
- 13.4.6 Forecast and Commercial Opportunities
- 13.5 Emerging Applications and Cross-Segment Demand
- 13.6 End-Use Industry Investment Priorities
Chapter 14 Australia Ligament Repair and Reconstruction Geographic Market Outlook, 2025-2035
- 14.1 Domestic Market Distribution and Demand Clusters
- 14.2 State- or Province-Wise Market Size and Forecast, 2025-2035
- 14.3 City and Metropolitan Market Outlook
- 14.4 Industrial, Manufacturing and Commercial Clusters
- 14.5 Geographic Concentration of Key End Users
- 14.6 Local Pricing and Purchasing Differences
- 14.7 Domestic Production Facilities and Capacity Map
- 14.8 Local Infrastructure and Project Pipeline
- 14.9 State-Level Policy and Incentive Differences
- 14.10 Subnational Investment Hotspots and Opportunities
- 14.11 Distribution and Logistics Networks
- 14.12 Domestic Competitive Footprint
Chapter 15 Australia Ligament Repair and Reconstruction Technology, Innovation and Sustainability Outlook
- 15.1 Technology Landscape and Maturity
- 15.2 Product, Process and Service Innovation
- 15.3 AI, Automation and Digital Tools in the Industry
- 15.4 Technology Adoption and Performance Benchmarking
- 15.5 Innovation Pipeline and R&D Investment
- 15.6 Patent and Intellectual Property Trends
- 15.7 Energy Efficiency and Resource Management
- 15.8 Sustainability, Recycling and Circularity
- 15.9 Technology Roadmap, 2025-2035
- 15.10 Risks of Obsolescence and Technology Substitution
Chapter 16 Australia Ligament Repair and Reconstruction Market Key Strategic Imperatives
- 16.1 Growth and Market Entry Priorities
- 16.2 High-Return Products and Segments
- 16.3 Pricing, Profitability and Cost Optimization
- 16.4 Technology Investment and Product Differentiation
- 16.5 Supply Chain Localization and Resilience
- 16.6 Distribution and Customer Acquisition
- 16.7 Partnership, Acquisition and Capacity Strategy
- 16.8 Regional Expansion Priorities
- 16.9 Short-, Medium- and Long-Term Actions
Chapter 17 Competition Outlook
- 17.1 Industry Competition Characteristics
- 17.2 Market Structure and Concentration
- 17.3 Market Share and Competitive Positioning, 2025
- 17.4 Company-Wise Revenue and Product Benchmarking
- 17.5 Production and Service Capacity Benchmarking
- 17.6 Technology, Pricing and Differentiation
- 17.7 Regional Footprint and Distribution Strength
- 17.8 Mergers, Acquisitions and Strategic Alliances
- 17.9 New Entrants and Competitive Threats
- 17.10 Porter's Five Forces and Industry Attractiveness
- 17.11 Competitive Outlook, 2025-2035
Chapter 18 Company Profiles
- 18.1 Company Coverage and Selection Criteria
- 18.2 Arthrex Australia
- 18.2.1 Business Description
- 18.2.2 Company Ownership and Geographic Presence
- 18.2.3 Product and Service Portfolio
- 18.2.4 Manufacturing and Operating Footprint
- 18.2.5 Production Capacity and Expansion Plans
- 18.2.6 Financial Performance and Investment
- 18.2.7 Market Share and Competitive Position
- 18.2.8 Technology and Innovation Capabilities
- 18.2.9 Strategic Alliances or Partnerships
- 18.2.10 Recent Developments
- 18.2.11 Growth Strategy and Outlook
- 18.3 Smith+Nephew Australia
- 18.4 Stryker Australia
- 18.5 DePuy Synthes
- 18.6 Zimmer Biomet Australia
- 18.7 Other Relevant Market Participants
Note: Every listed company is profiled on the structure shown under the first company. The company list is preliminary and may change based on research findings, market developments, data availability and client requirements.
Chapter 19 Disclaimer
- 19.1 Research and Forecast Disclaimer
- 19.2 Data Source and Estimation Limitations
Note: The depth of individual sections depends on data availability for this market. Volume, capacity, trade and other unit-based metrics are included where applicable.

