
Multiyear institutional and site contracts anchor demand
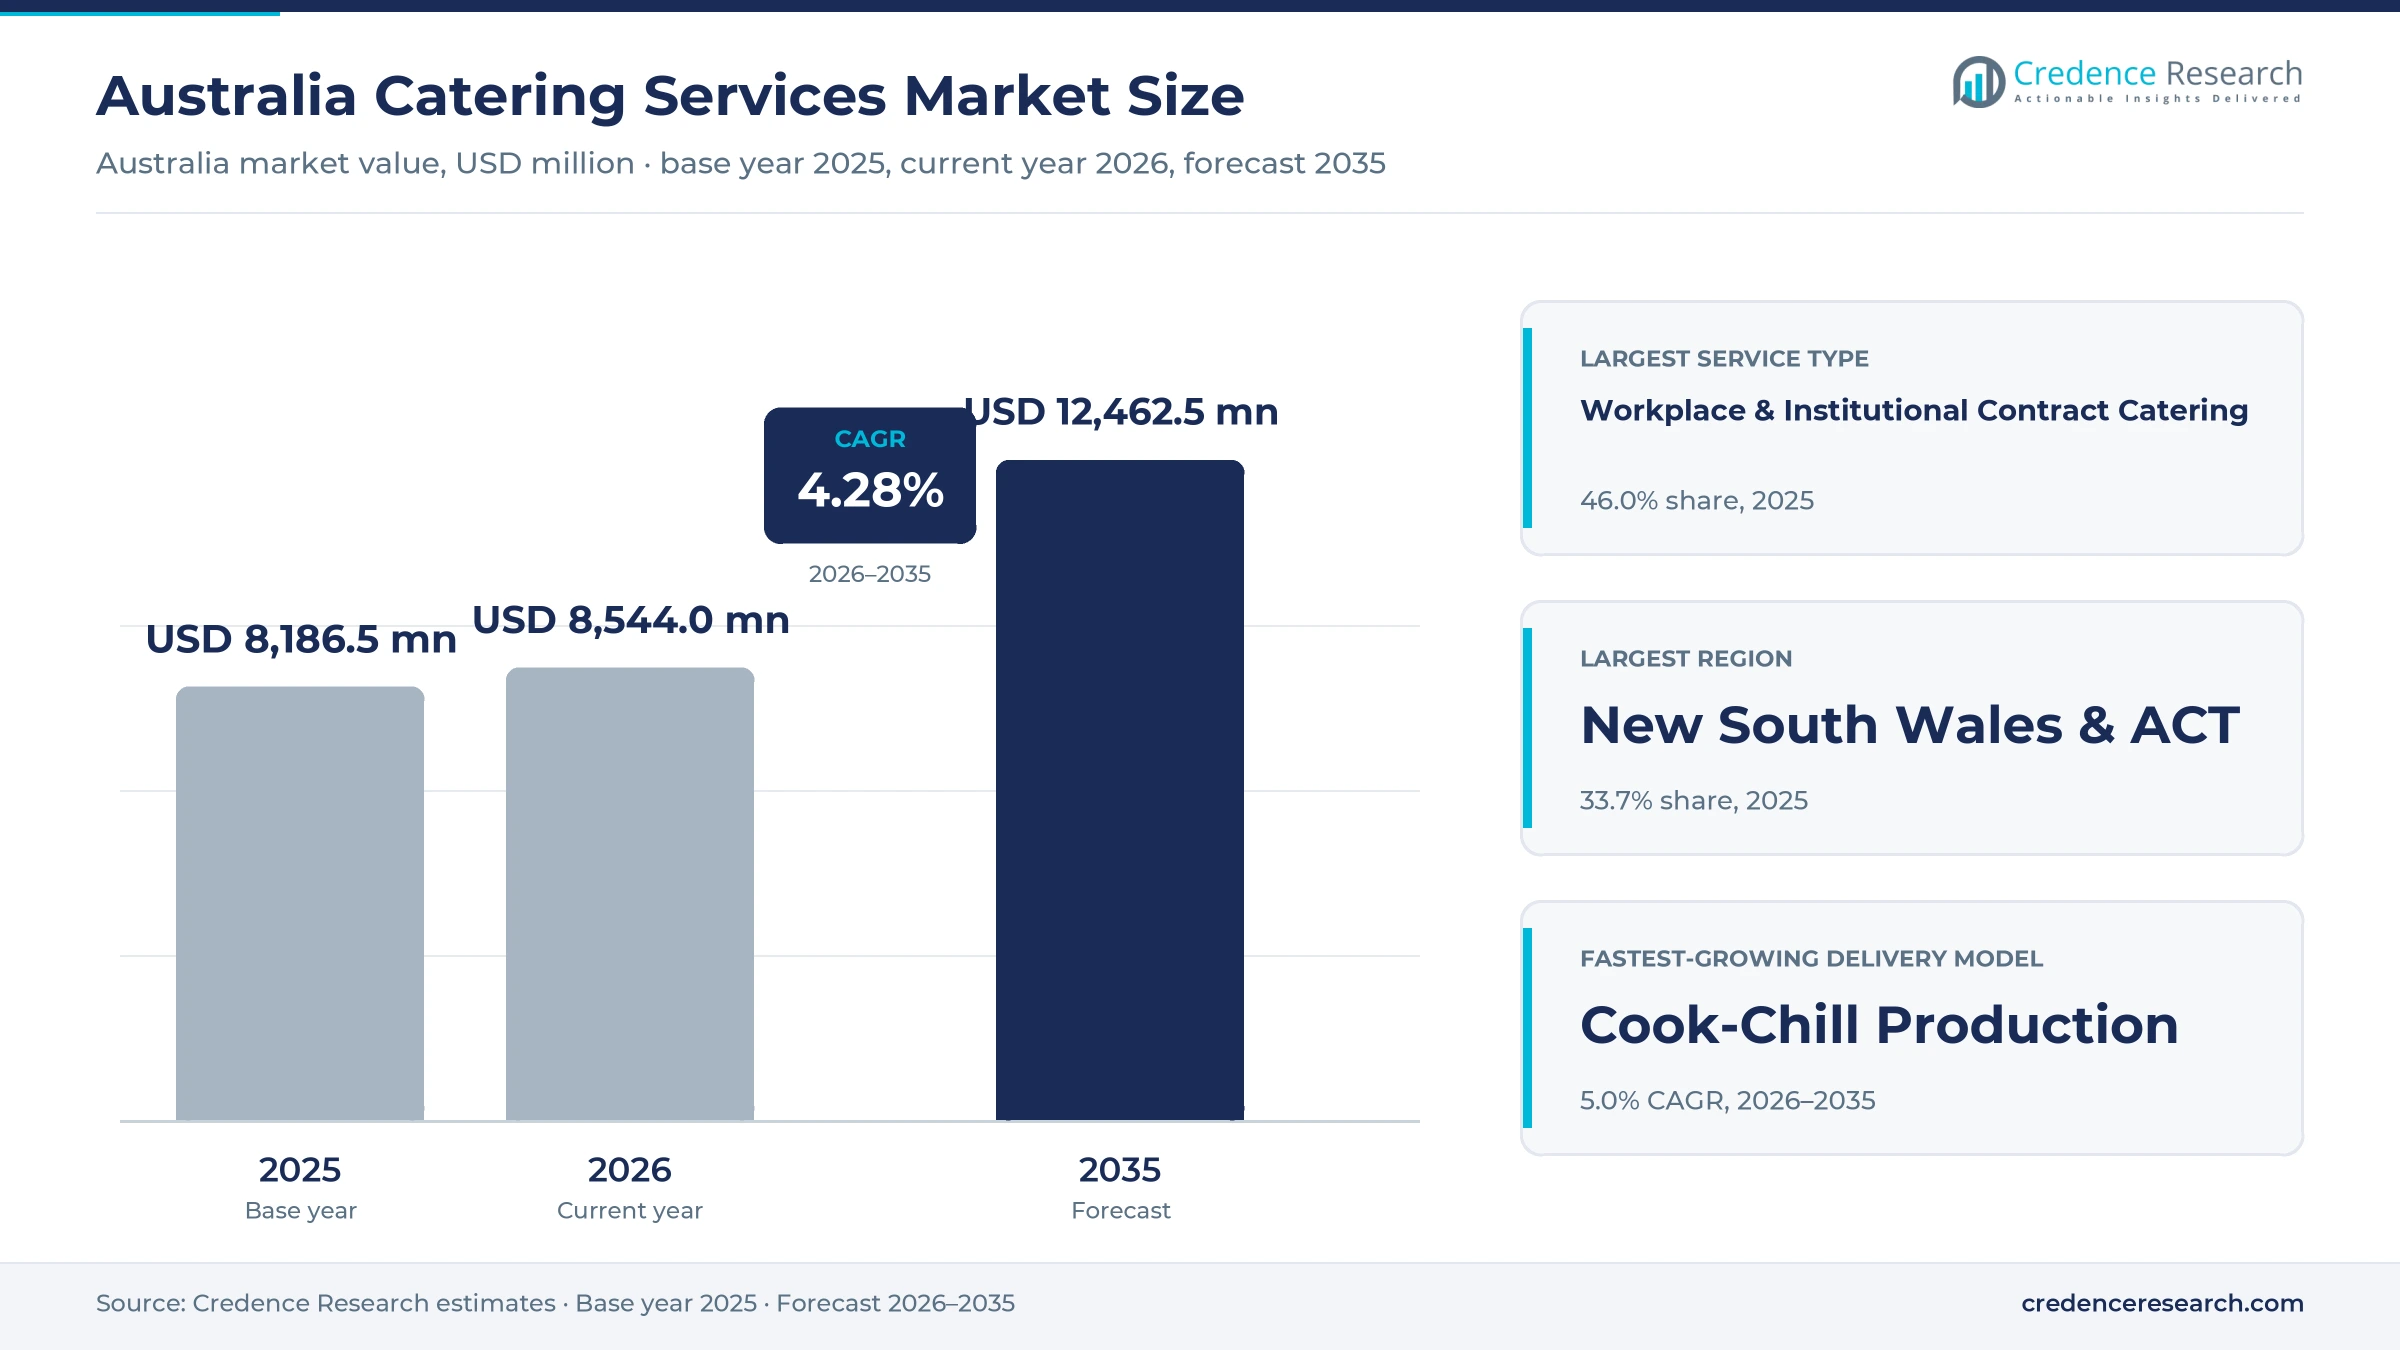
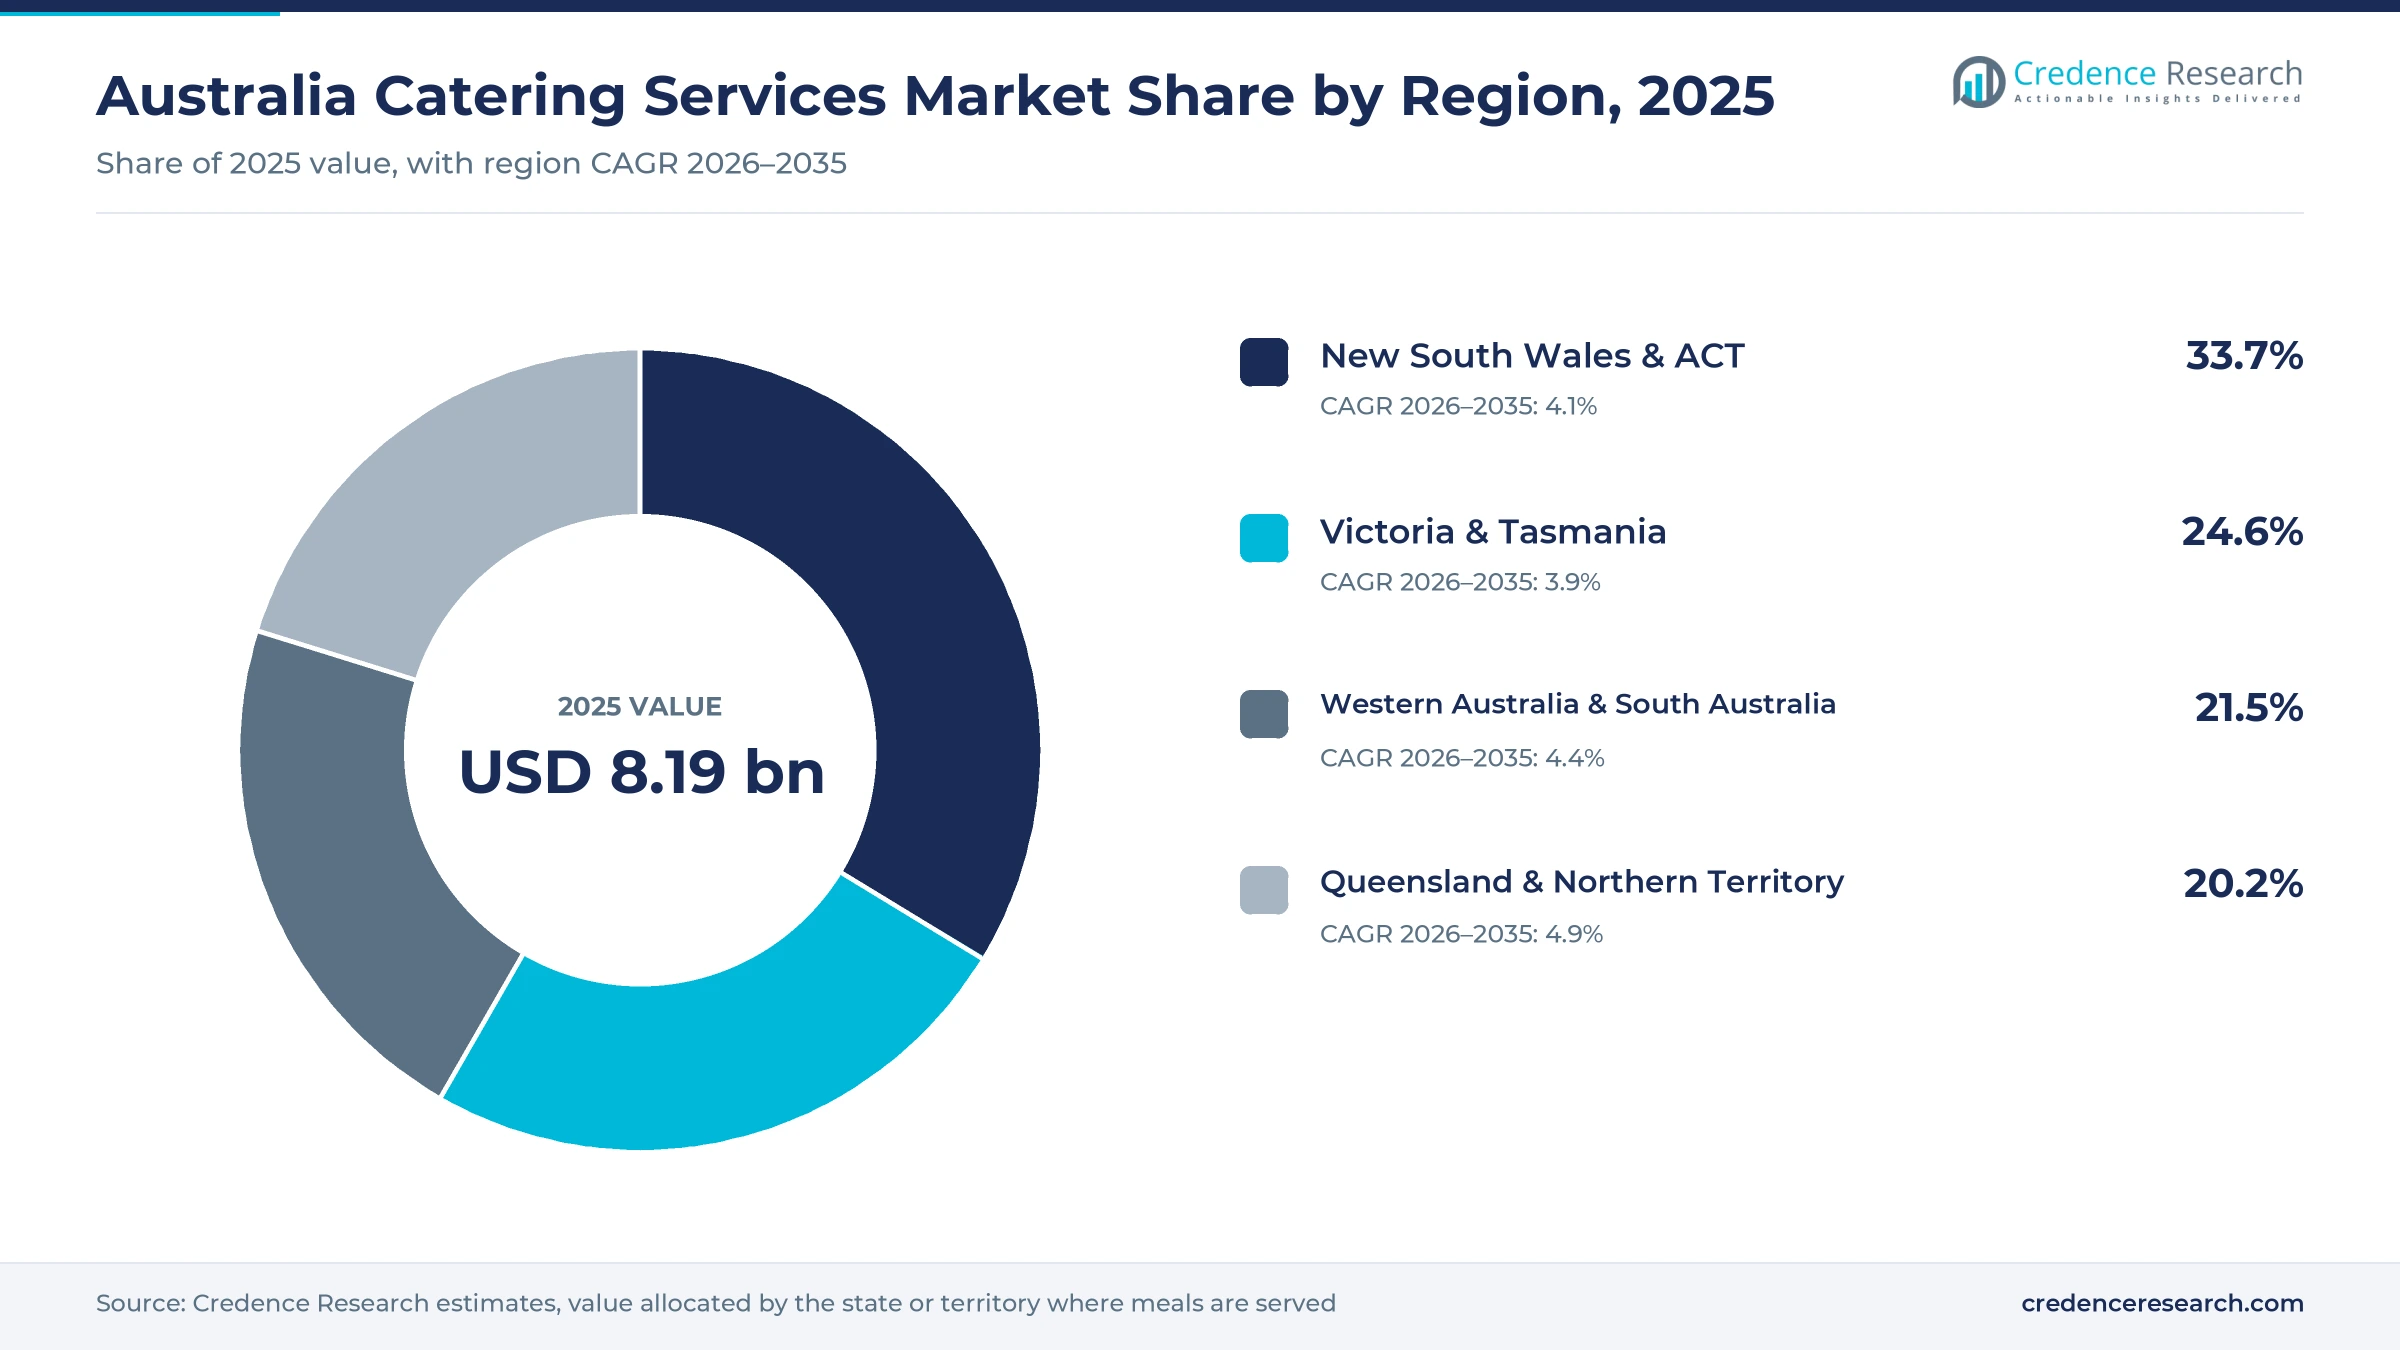
The Australia catering services market was valued at USD 8.19 billion in 2025 and is projected to increase from USD 8.54 billion in 2026 to USD 12.46 billion by 2035, registering a CAGR of 4.28% during 2026–2035. Hospitals, aged care homes, Defence bases, mine villages, stadiums and airlines buy most contracted meals, and multiyear tenders set the price, menu and staffing terms. New South Wales and the Australian Capital Territory held the largest share, 33.7% in 2025, because the Sydney and Canberra concentration of hospitals, offices, venues and international flights is the deepest in the country. Queensland and the Northern Territory form the fastest-growing region at 4.9% a year, supported by coal basin villages and venue planning for the 2032 Games. A food and nutrition standard for residential aged care took effect with the new Aged Care Act on Nov. 1, 2025, and it raises menu, dining and dietitian review requirements for every provider. Award wage rises and food inflation, however, squeeze contractors that hold fixed-price terms.
Site, venue and aircraft meal contracts define the scope
The estimate measures what Australian buyers pay external caterers for prepared meals, snacks and beverages, including the labor, kitchen operation and service staff bundled into those contracts. It covers workplace and institutional contracts, event and venue catering, remote workforce villages and airline and transport catering, whether meals are cooked on site, in central kitchens or through cook-chill production.
The estimate excludes restaurants and takeaway outlets selling directly to diners, in-house kitchens run by public hospitals and aged care operators with their own staff, and accommodation charges that are not tied to meals. Value flows from food distributors and equipment suppliers through contract caterers and venue concession holders to employers, health and aged care operators, government agencies, venue owners and airlines.
Australia Catering Services Market Insights
- The Australia catering services market grows from USD 8.19 billion in 2025 to USD 12.46 billion by 2035 at a 4.28% CAGR, supported by aged care, resources and venue contracts.
- New South Wales and the ACT held 33.7% of 2025 value, while Queensland and the Northern Territory grow fastest at 4.9% a year.
- Workplace and institutional contract catering led service types with 46.0% of 2025 value, because hospitals, Defence bases and offices sign multiyear meal contracts.
- Aged Care Quality Standard 6 on food and nutrition took effect on Nov. 1, 2025, and residential providers now need an annual dietitian assessment of menus and dining.
- Defence signed Living and Working Services contracts in September 2025 with Compass Group, ISS and Ventia, each for an initial six years across separate state regions.
Contract meals lead while travel and cook-chill grow fastest
Institutional contracts lead as travel meals grow fastest
Based on service type, the market is categorized into workplace and institutional contract catering, event and venue catering, remote and workforce catering and transport and travel catering. Workplace & Institutional Contract Catering led with 46.0% of 2025 value because hospitals, Defence bases and offices sign multiyear contracts for daily meals. ISS says it serves about 5 million patient meals a year in Australian healthcare and runs food services at 94 Defence sites. Transport & Travel Catering grows fastest at 5.2% a year, as airlines add routes. dnata won catering contracts with Hainan Airlines, Tianjin Air and Beijing Capital Airlines at Sydney and Melbourne in March 2025, covering about 380,000 meals a year.
Resources lead end use while aged care grows fastest
Based on end-use industry, the market is categorized into business and industry, healthcare and aged care, education and public services and resources and mobility. Resources & Mobility led with 30.0% of 2025 value, a Credence Research estimate built from village room counts and airline meal volumes, because mine and gas sites feed rostered workforces in villages. Sodexo's Rio Tinto contract covers 14 million meals a year across 25 Pilbara villages, according to Sodexo. Healthcare & Aged Care grows fastest at 4.8% a year, as resident needs rise. Of about 196,000 people in permanent residential aged care on June 30, 2025, 59% were aged 85 or over, according to GEN aged care data.
On-site kitchens lead while cook-chill grows fastest
Based on delivery model, the market is categorized into on-site production, central kitchen distribution, cook-chill production and mobile and pop-up service. On-Site Production led with 56.0% of 2025 value because aged care homes, villages and venues expect meals cooked near the point of service. Cater Care says it supplies fresh ingredients to more than 145 sites and makes aged care afternoon tea on site. Cook-Chill Production grows fastest at 5.0% a year, as health systems centralize production. HealthShare NSW, a public in-house producer outside this estimate, supplies 128 hospitals from two food production units at Camperdown and Cessnock, which sets the cost benchmark contract cook-chill bidders must beat elsewhere.
Fixed-price terms lead as revenue-share deals grow fastest
Based on revenue model, the market is categorized into fixed-price contract, cost-plus contract, management fee and per-meal and revenue-share arrangements. Fixed-Price Contract led with 35.0% of 2025 value, an estimate since caterers do not disclose contract types, because public buyers lock prices over long terms. Defence base services contracts run an initial six years with extension options to a maximum of 10 years, according to the Department of Defence. Per-Meal & Revenue-Share grows fastest at 4.8% a year, as venue owners hand catering to partners that share sales. Taronga Zoo Sydney extended Trippas White Group as its exclusive food and beverage partner for seven years from Dec. 1, 2025, Spice News reported.
| Segment Group | Leading Sub-segment | Share, 2025 | Fastest-growing Sub-segment | CAGR, 2026–2035 |
|---|---|---|---|---|
| By Service Type | Workplace & Institutional Contract Catering | 46.0% | Transport & Travel Catering | 5.2% |
| By End-Use Industry | Resources & Mobility | 30.0% | Healthcare & Aged Care | 4.8% |
| By Delivery Model | On-Site Production | 56.0% | Cook-Chill Production | 5.0% |
| By Revenue Model | Fixed-Price Contract | 35.0% | Per-Meal & Revenue-Share | 4.8% |
Caterers price per resident day, room night or meal
Contract catering in Australia is priced per resident day in aged care, per room night in workforce villages and per meal or per head at venues and events. Labor takes the largest share of each rate, so award decisions and roster length move prices more than ingredient costs. A median aged care home spent AUD 36.89 per resident per day on food, catering staff and supplies in the December 2023 quarter, The Weekly Source reported from health department data. Buyers that index rates to wages keep suppliers stable, while those that hold flat rates invite service cuts or early exits.
| Contract or cost line | Typical price or fee | Basis |
|---|---|---|
| Residential aged care food and catering, median home | AUD 36.89 per resident per day | Health department data reported by The Weekly Source, December 2023 quarter |
| Aged care food and ingredients referral threshold | Below AUD 10 per resident per day | Australian Government health department guidance, 2025 |
| Owned workforce village room night, accommodation and meals | USD 76 average daily rate | Civeo second-quarter 2025 results |
| Catering labor cost floor | AUD 24.95 per hour national minimum wage | Fair Work Commission, from July 1, 2025 |
Request a Free Sample
Fill in your details and we'll send you a free sample report.
- Sample data tables & charts
- Research methodology
Outsourcing, aged care rules and visitors lift demand
First-time outsourcing pulls new sites into contracts
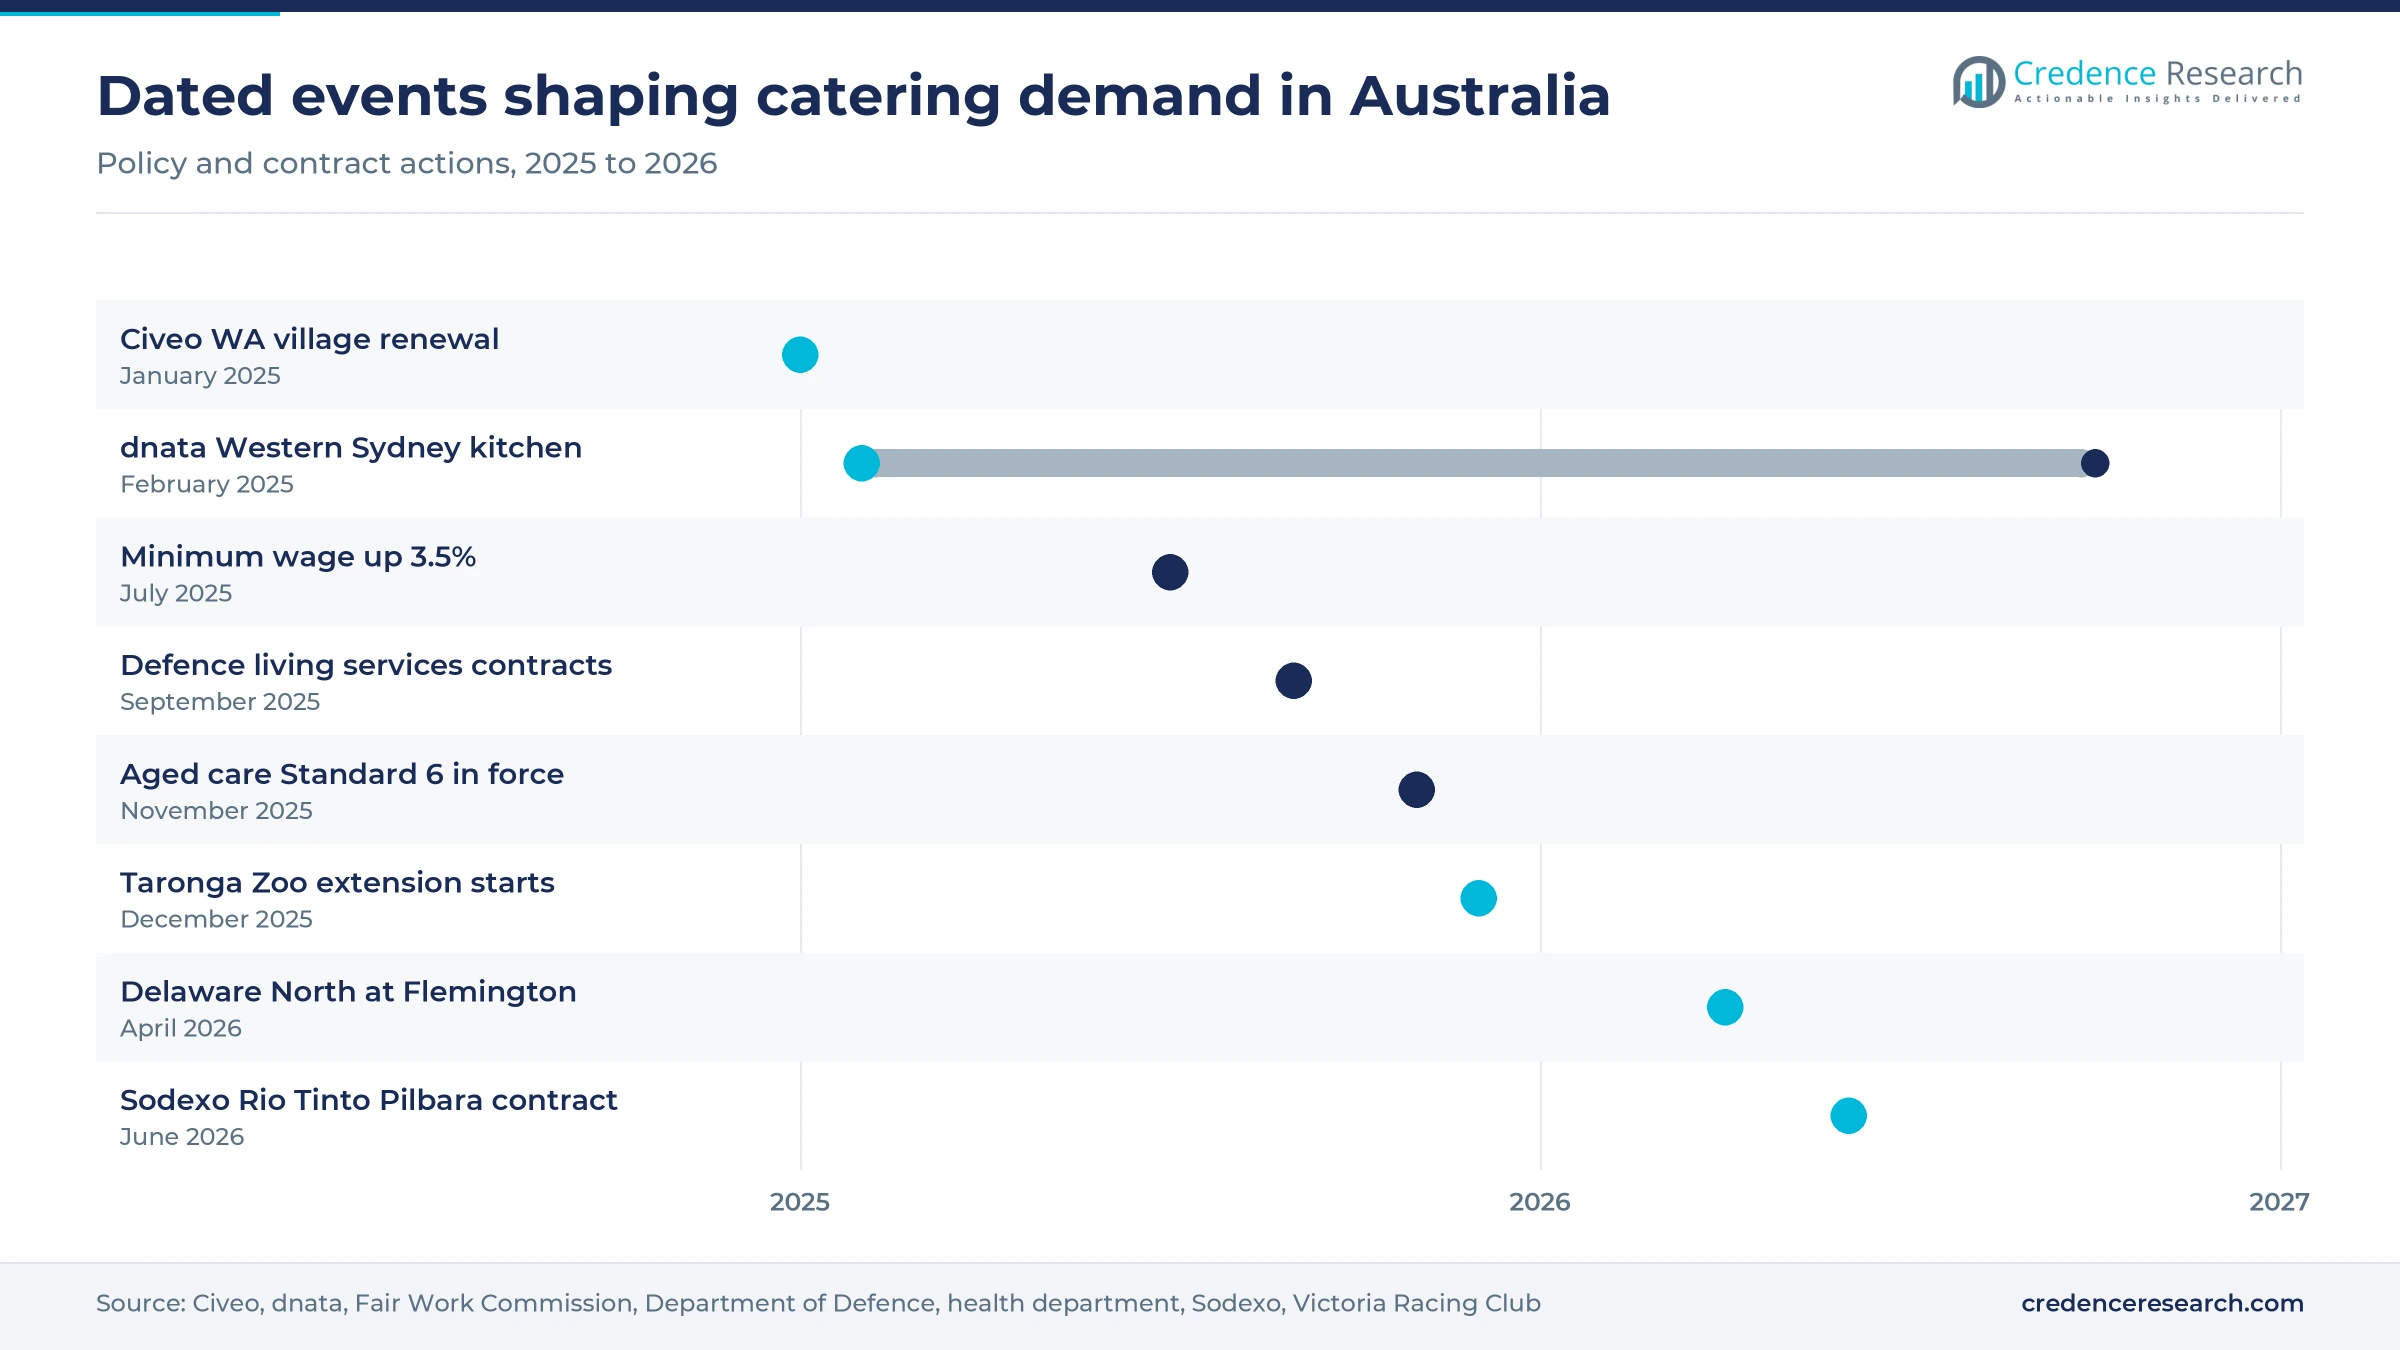
Resource companies and village owners are moving catering, cleaning and village upkeep from in-house teams or separate vendors to one contractor, which adds sites that were never bought as catering before. Civeo won its first integrated services contract in Queensland in May 2025, covering catering, cleaning and maintenance at two Bowen Basin villages from June 2025, according to its release on Business Wire. Its Western Australian renewal from Jan. 1, 2025, widened work from seven villages to 11. Westgold Resources renewed Sodexo for five years in June 2026 across five villages with about 1,500 rooms, including the Higginsville village mobilized in December 2025, Sodexo said. Contractors that can staff a new village quickly win these first awards, while smaller local caterers lose single-service work.
Aged care food rules raise the bar for contracted meals
Aged care food rules now carry legal weight, which pushes providers toward caterers with dietitian, texture-modification and reporting capability. Standard 6 on food and nutrition took effect with the new Aged Care Act on Nov. 1, 2025, and Dietitians Australia said residential providers must have an accredited practising dietitian assess menus and dining once a year. Providers also report food spending each quarter, and homes spending less than AUD 10 per resident per day on food and ingredients are referred to the regulator for review. The Aged Care Quality and Safety Commission is also rolling out 1,000 menu and mealtime assessments completed by accredited practising dietitians, health department guidance states. Specialist caterers gain, while small in-house kitchens face higher compliance cost.
Visitor spending recovery fills venue and event kitchens
Higher visitor spending lifts function, stadium and racecourse catering, where revenue rises with each attendee. Spending in Australia by international visitors reached AUD 39.2 billion in 2025, 25% above 2019, even though trips stayed 5% below 2019, according to Tourism Research Australia. The Australian Business Events Association counted 19.8 million business event visitors in 2024, Travel Weekly reported in August 2025. The Victoria Racing Club appointed Delaware North in February 2026 to run hospitality at Flemington from April 2026, including race days, functions and corporate areas. Longer, higher-spending stays favor caterers with premium menus and venue concessions, while budget event caterers gain less from the recovery.
Defence base contracts bundle meals with living services
Defence now buys catering inside regional living and working bundles, which concentrates volume with a few contractors that can run whole bases. The Department of Defence signed Living and Working Services contracts on Sept. 11, 2025, with Compass Group for New South Wales, the ACT and Queensland, ISS for South Australia and Western Australia and Ventia for the Northern Territory, Victoria and Tasmania. ISS said its contract covers 85 locations from February 2026 and that 98% of services are self-delivered. Compass Group said it has worked with Defence since 1995. Holders gain long periods of secured meal volume, while firms outside these awards lose access to base catering until the next tender round.
Digital food safety and waste targets reshape kitchen work
Health caterers shift toward digital food safety records
Health and aged care caterers are shifting from paper checklists toward digital food safety and ordering systems. Food Standard 3.2.2A, in force for most sectors from Dec. 8, 2023, treats caterers that serve ready-to-eat potentially hazardous food as category one businesses that need a food safety supervisor and trained handlers and must show their food is safe, with records one accepted method, according to the NSW Food Authority. ISS moved the 650-bed Flinders Medical Centre and two other Adelaide hospitals to its Safe Food Pro system, it said in November 2024. Cater Care says teams at numerous aged care sites take resident lunch orders on tablets. Caterers with live allergen and texture records win hospital and aged care tenders, while paper-based operators face audit risk.
Waste reduction targets reshape menus and production runs
Caterers are shifting toward shorter menus, tighter forecasting and waste tracking because uneaten food is now a cost and reporting issue. End Food Waste Australia said in October 2024 that about 20% of food served by caterers goes uneaten, and that hospitality wastes more than 1.2 million metric tons of food a year, 16% of the national total. ISS has set a 50% food-waste reduction target for 2027 on its Australian food services page. Rio Tinto's village contract adds health and wellness programs to catering, which links menu design to workforce outcomes. Contractors that measure plate waste can price more sharply, while event caterers serving buffets carry the largest exposure.
Opportunity in new airport kitchens and inflight volume
Airport growth creates openings for airside kitchens that serve new airlines and buy-on-board menus. dnata announced a A$17 million inflight catering facility at Western Sydney International in February 2025, with capacity for three million meals a year and room to expand from 3,200 to 6,400 square meters. Short-term visitor arrivals rose 8% to about 9.1 million in 2025-26, according to the Australian Bureau of Statistics, still 3% below the 2018-19 peak. Jetstar extended its inflight retail contract with dnata for four years in May 2025, including pre-order and buy-on-board menus. Caterers with airside approvals and airline meal production capacity can sign carriers before Western Sydney traffic builds.
Opportunity in school lunch programs and boarding schools
Public school lunch programs open a new institutional channel for caterers that can deliver hot meals at low cost per plate. Tasmania's Healthy School Lunch Program ran in 45 government schools in October 2025 and will reach 60 in 2026, serving more than 13,000 free lunches a week, the state education department said. Around 320,000 hot lunches had been served since the June 2024 launch. Cater Care says it serves breakfast to about 2,000 boarding students each day. Caterers with regional kitchens and per-meal pricing are best placed if other states copy the Tasmanian model, although no national funding has been announced.
Wage rises, input inflation and re-tenders squeeze margins
Award wage rises lift labor costs on long contracts
Catering is labor heavy, so minimum wage decisions move cost faster than many contracts can reprice. The Fair Work Commission raised the national minimum wage by 3.5% to AUD 24.95 an hour from July 1, 2025. Caterers on fixed-price contracts without annual wage indexation are the most exposed, especially at aged care and remote sites with seven-day rosters. Contract terms that link prices to award changes limit the loss, although buyers resist them in tenders.
Food and energy inflation erodes fixed-price menus
Food and energy costs rose faster than many menu prices during 2025, which narrowed margins on fixed meal rates. Food and non-alcoholic beverage prices rose 3.4% and electricity 21.5% in the year to December 2025, the Australian Bureau of Statistics reported in January 2026, as rebates ran out in Queensland and Western Australia. Kitchen-heavy cook-chill operators and village caterers carry the largest energy exposure. Cost-plus and indexed contracts pass more of the rise to buyers.
Re-tender cycles put incumbent contracts at risk
Large buyers retest the market at every renewal, which keeps incumbents under price pressure even when service is rated well. Rio Tinto ran a global partner selection process before awarding Sodexo the seven-year Pilbara contract that replaced a previous 10-year agreement in 2026. Merivale replaced Delaware North as caterer at the Sydney Cricket Ground from December 2021, Real Estate Source reported. Incumbents that lose one anchor contract can strand staff, kitchens and equipment, so mobilization cost sits heavily on bidders.
Slow Games venue delivery delays Queensland event demand
Queensland event caterers are planning capacity around 2032 venues whose timing is still uncertain. The Games Independent Infrastructure and Coordination Authority is delivering 17 venues, seven new and 10 upgraded, yet Brisbane Stadium at Victoria Park remains in planning, approvals and early works, and the National Aquatic Centre in planning and approvals, its website shows. Caterers that hire or lease kitchens early carry idle cost. Concession bids for new venues will come later than many operators expected.
NSW and ACT lead as Queensland and NT grow fastest
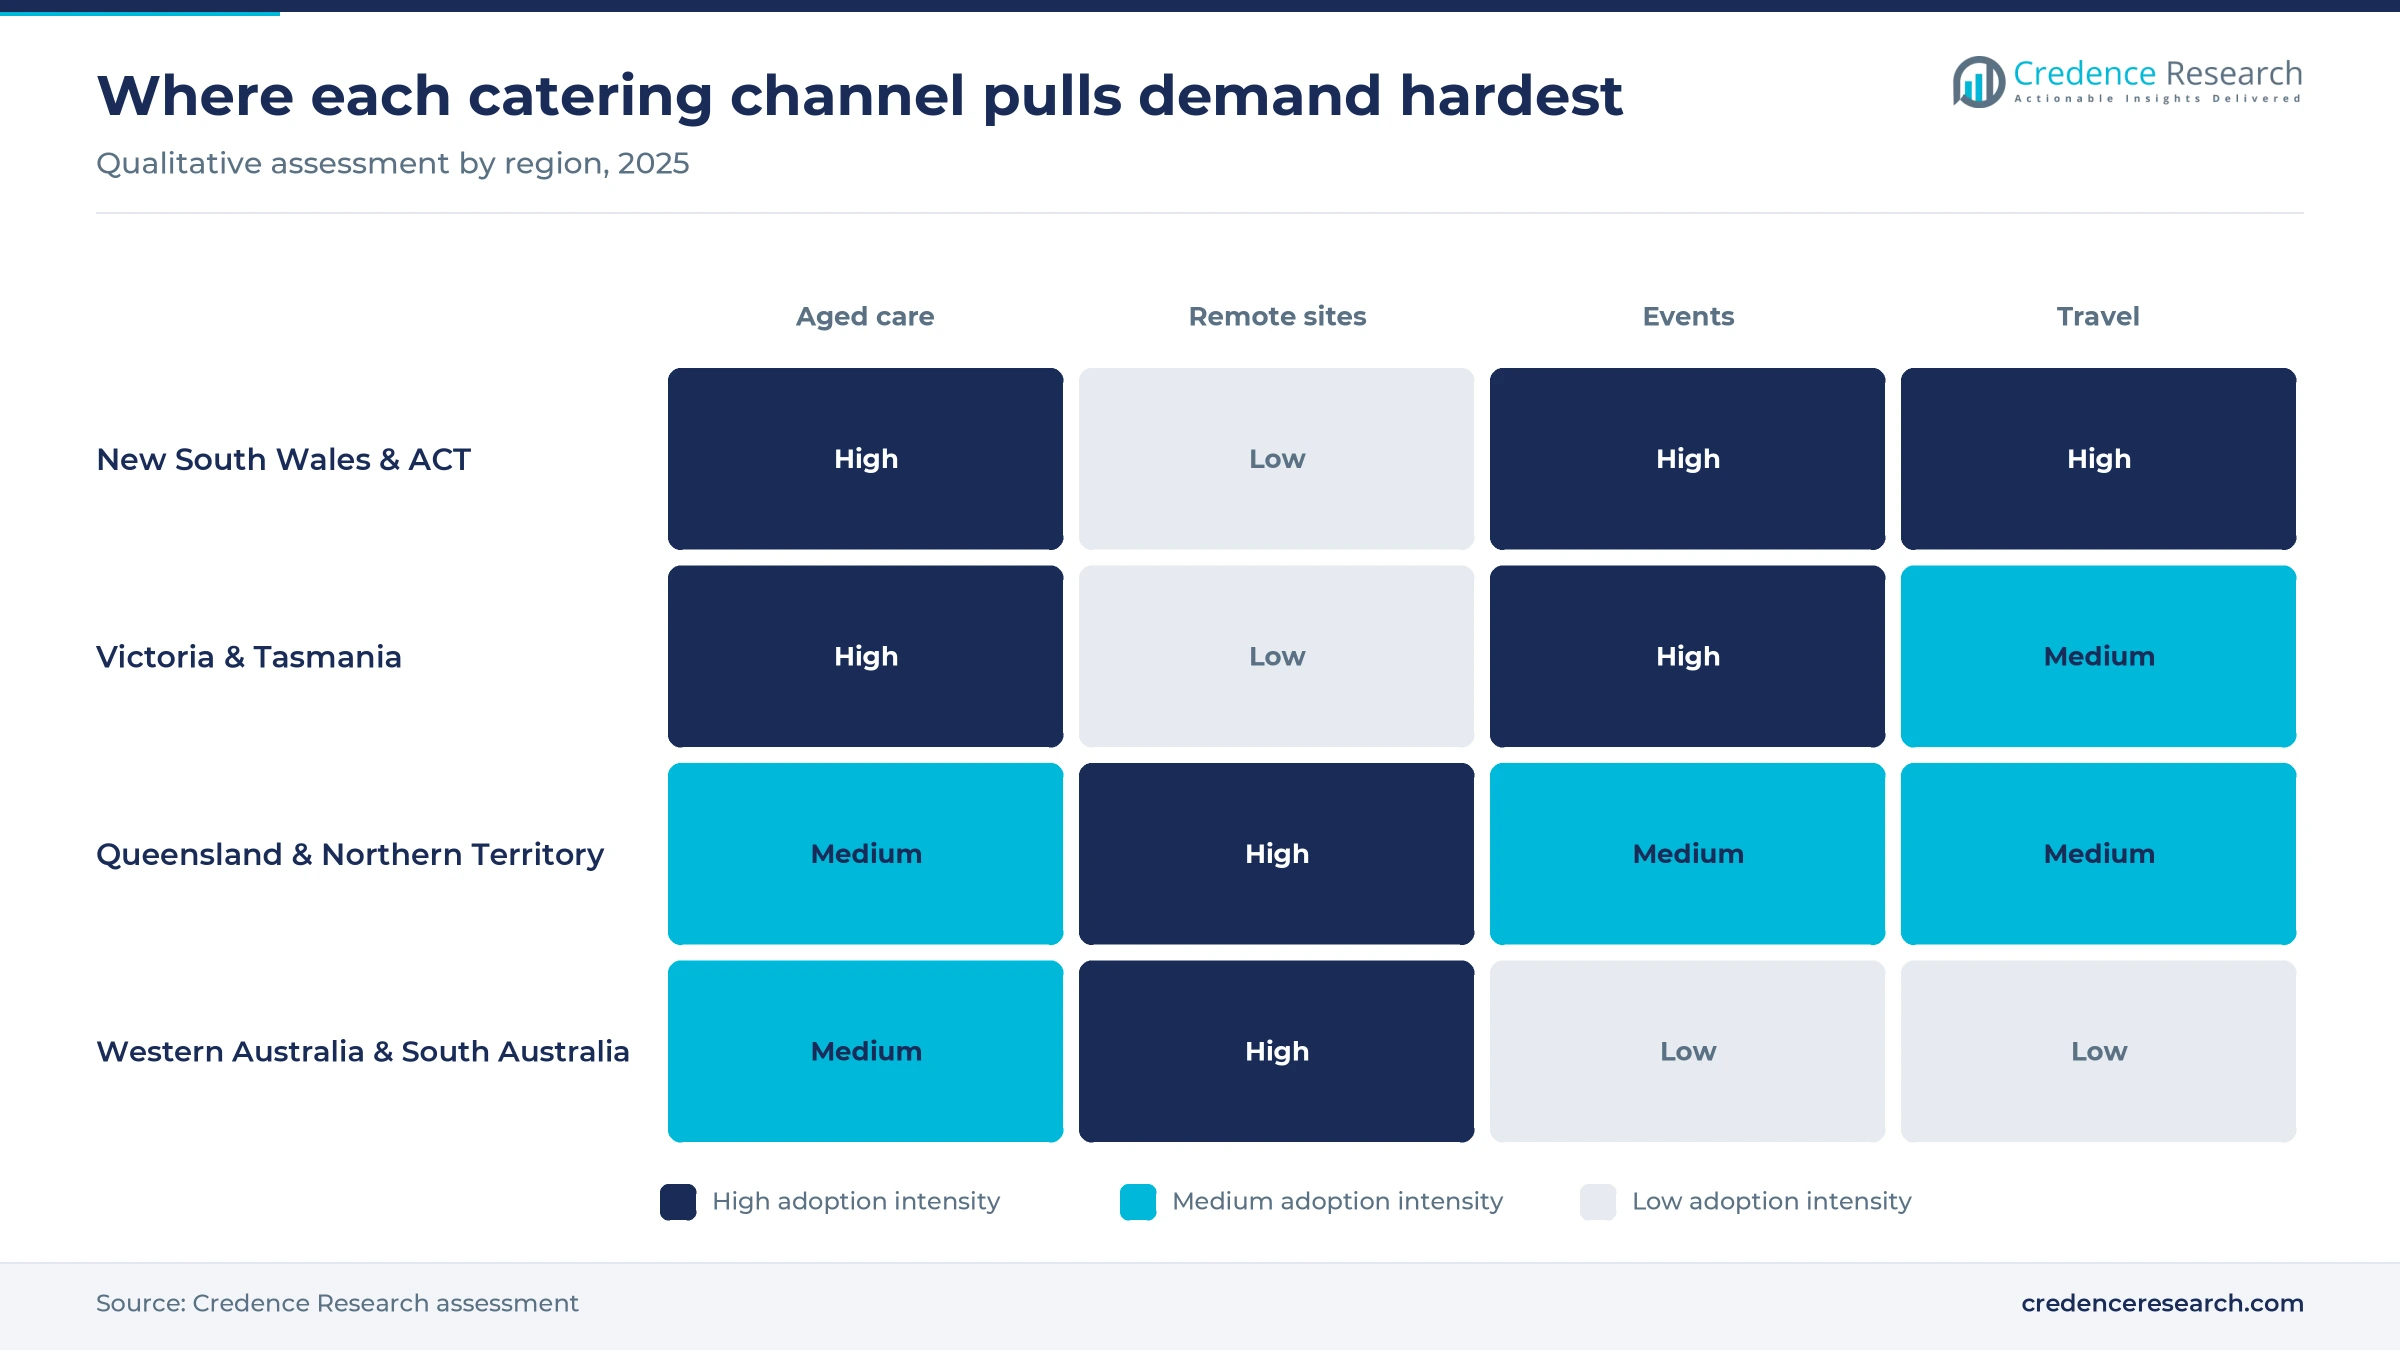
New South Wales and the ACT hold about one-third of national value, Victoria and Tasmania rank second, and Queensland and the Northern Territory grow fastest. Regional shares are Credence Research estimates, because no official statistic separates contracted catering by state.
| Region | Value, 2025 (USD billion) | Share, 2025 | CAGR, 2026–2035 |
|---|---|---|---|
| New South Wales & ACT | 2.76 | 33.7% | 4.1% |
| Victoria & Tasmania | 2.01 | 24.6% | 3.9% |
| Western Australia & South Australia | 1.76 | 21.5% | 4.4% |
| Queensland & Northern Territory | 1.65 | 20.2% | 4.9% |
NSW and ACT lead on hospitals, offices and flights
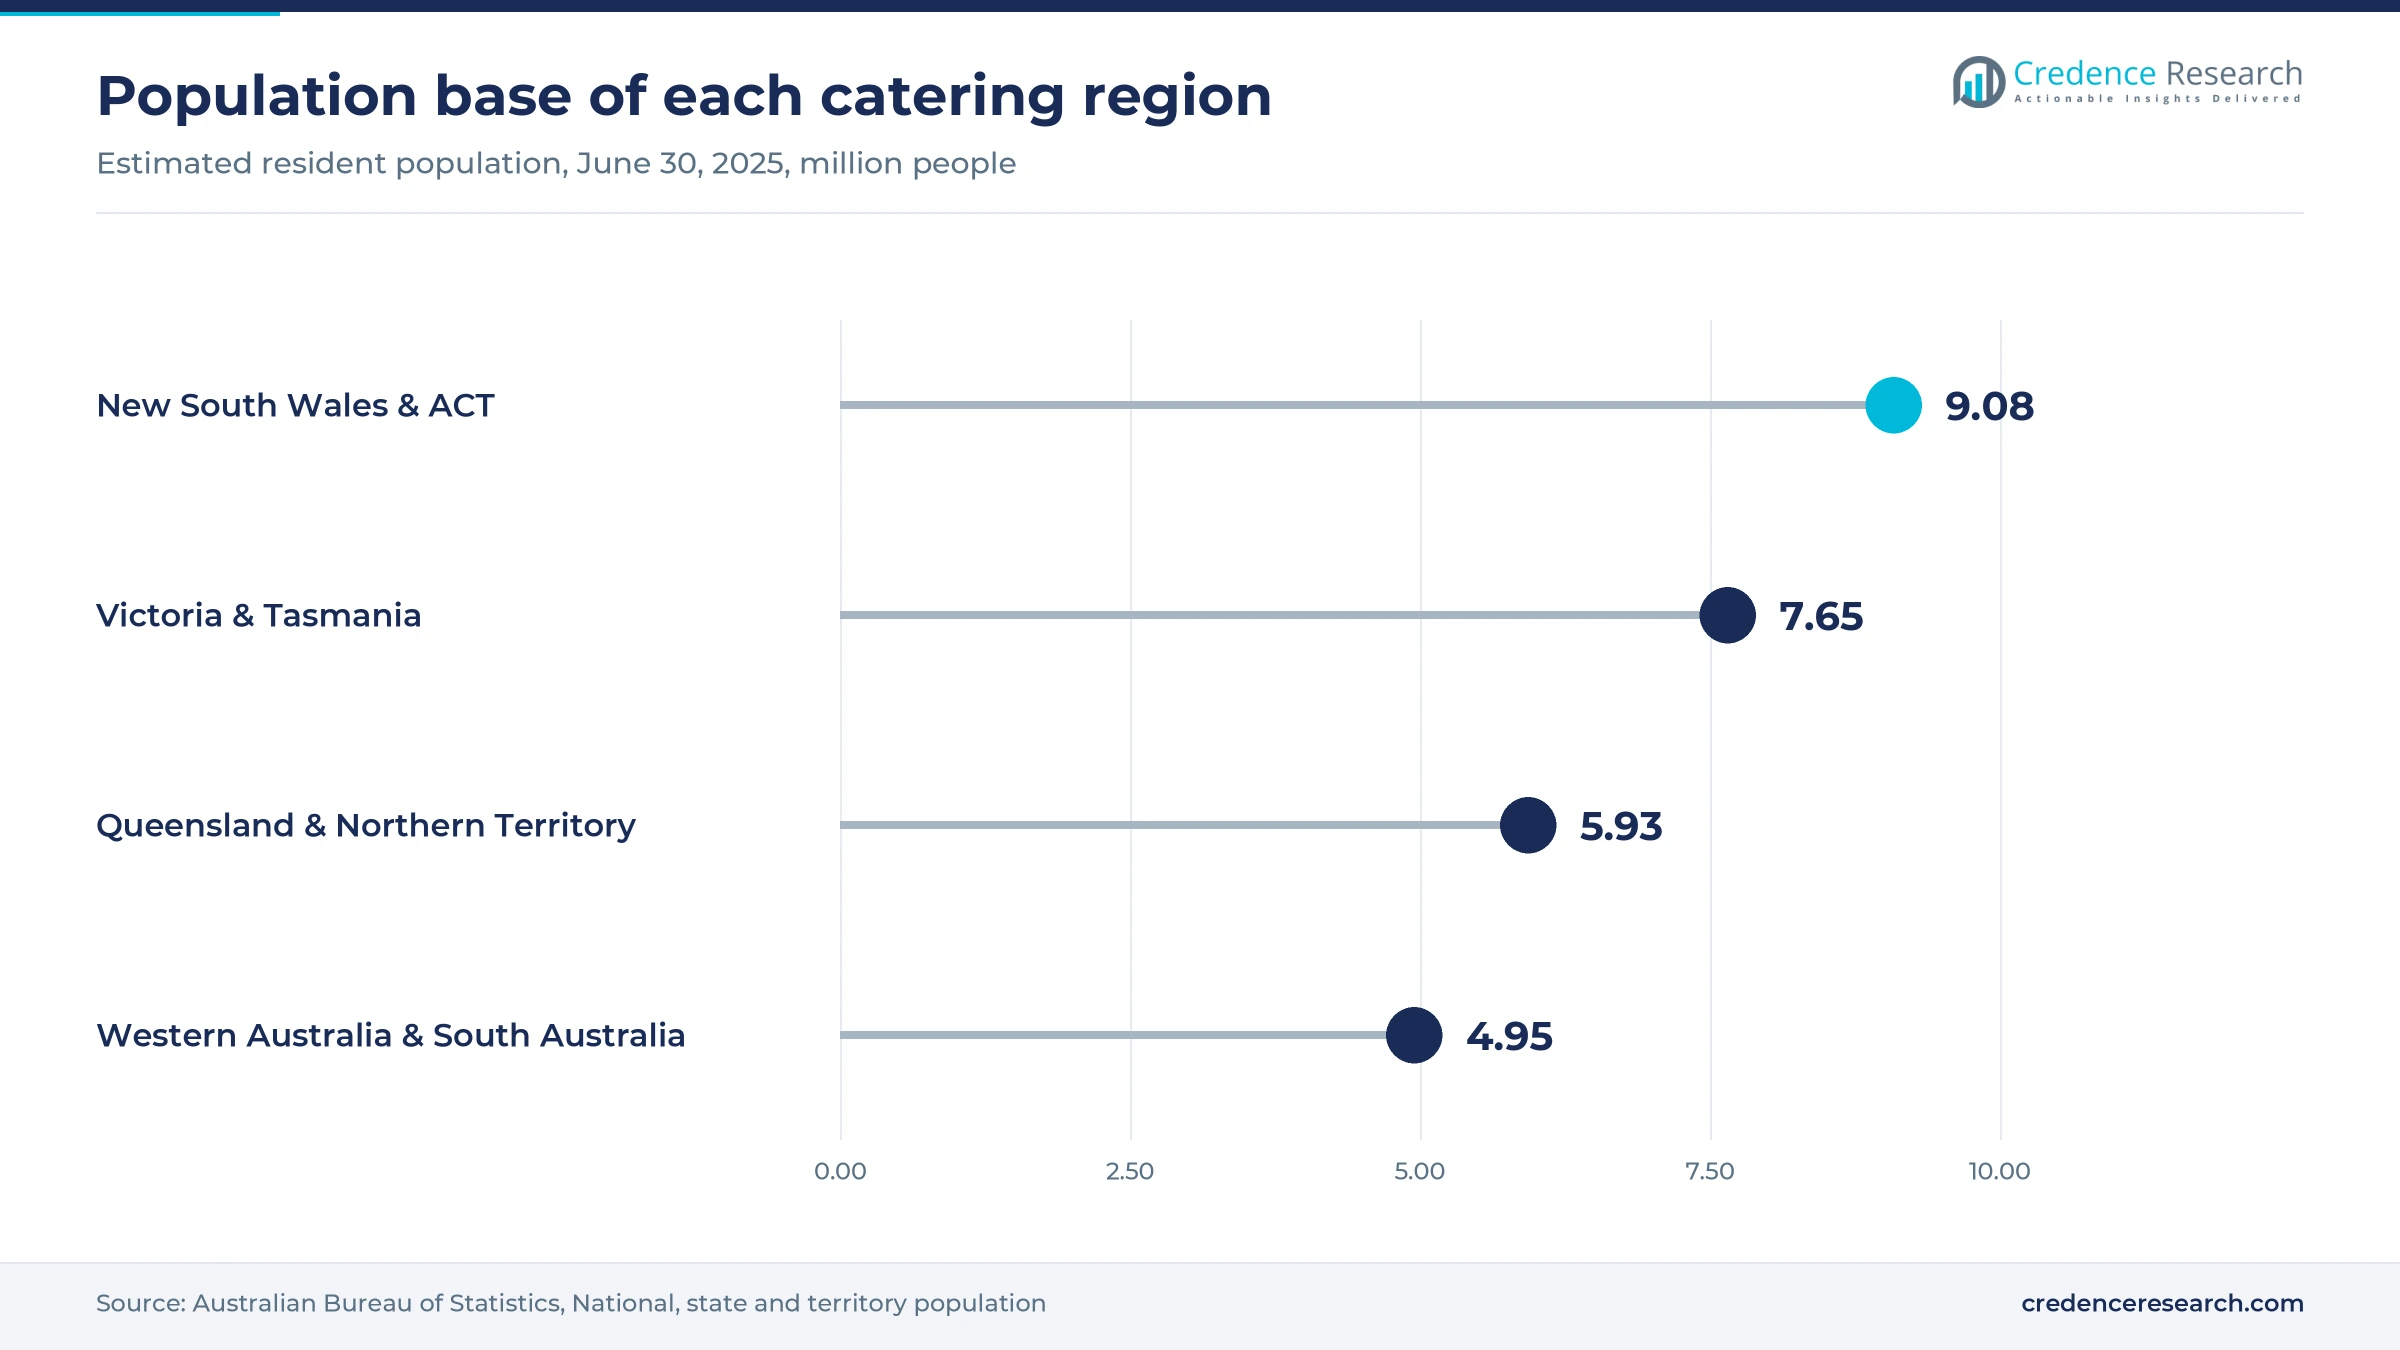
New South Wales and the ACT held 33.7% of 2025 value and grow at 4.1% a year. The zone had about 9.1 million residents in June 2025, the largest base of offices, hospitals and Defence sites, including the Canberra bases in Compass Group's Defence region. Sydney also holds the main international gateway and, from late 2026, the new Western Sydney airport kitchens described above. Event caterers such as The Fresh Collective compete for corporate functions and venue partnerships, which keeps pricing competitive.
Victoria and Tasmania lean on racing, sport and aged care
Victoria and Tasmania held 24.6% of 2025 value and grow at 3.9% a year, the slowest pace of the four regions. Melbourne's venue calendar keeps concession demand high, as Delaware North took over Flemington hospitality in April 2026, while Tasmania's slow population growth limits new institutional sites. Stadium events and casino tourism add function demand in Melbourne, while aged care specialists such as Contemporary Catering in Bayswater serve the dense suburban home network. Tasmanian school lunches add a small but growing institutional channel for regional kitchens.
Queensland and NT grow fastest on basins and Games venues
Queensland and the Northern Territory held 20.2% of 2025 value and form the fastest-growing region at 4.9% a year. Queensland's population grew 1.8% to about 5.67 million in the year to June 2025. Bowen Basin coal villages have begun moving to integrated catering contracts, as noted above, while Games athlete villages are planned in Brisbane, the Sunshine Coast, the Gold Coast and Rockhampton. The Northern Territory adds Defence and gas workforce demand from a population of about 264,000.
WA and SA rest on Pilbara villages and Defence bases
Western Australia and South Australia held 21.5% of 2025 value and grow at 4.4% a year. Western Australia had the fastest population growth of any state at 2.2% in the year to June 2025, and its iron ore and gold villages give the zone a share well above its population weight. ISS patient meals at Adelaide hospitals and its Defence contract in both states add institutional volume. Remote contracts dominate value, so commodity cycles move this region more than any other.
Recent awards span villages, Defence, venues and airports
| Development | Status and market relevance |
|---|---|
| In January 2025, Civeo renewed and expanded an integrated services contract covering eleven Western Australian villages for 2025 to 2030 | Contract renewal in effect from Jan. 1, 2025, adding four villages to the earlier seven |
| In February 2025, dnata announced a A$17 million inflight catering facility at Western Sydney International with three million meals of yearly capacity | Investment under construction, due for completion with the airport in late 2026 |
| In September 2025, the Department of Defence signed Living and Working Services contracts with Compass Group, ISS and Ventia | Contracts signed for an initial six years, with ISS services starting in February 2026 |
| In February 2026, the Victoria Racing Club appointed Delaware North as hospitality services provider at Flemington Racecourse | Multiyear award, with service starting in April 2026 |
| In May 2026, Sodexo was awarded a seven-year facilities contract for Rio Tinto's Pilbara villages, including about 14 million meals a year | Contract award after a global partner selection, with services from June 2026 |
Cook-chill, texture menus and digital logs change kitchens
- Cook-chill and blast chilling lets central kitchens cook in volume, chill meals quickly and reheat them at hospitals, aged care homes and aircraft galleys, which cuts staff hours at each site.
- Texture-modified menus adjust food and drink consistency for residents and patients with swallowing difficulty, a core requirement in dietitian-led hospital and aged care contracts.
- Digital food safety records replace paper temperature and allergen logs with live dashboards that auditors can check at any time, which matters because older people and the sick are among the groups hit hardest by unsafe food, according to the World Health Organization.
- Tablet ordering at the point of care records resident meal choices before service, which improves choice and reduces plate waste in aged care dining rooms.
Need a Custom Version of This Report?
Tailor the scope, geography, or segments to your exact requirements.
- Custom geography or segment scope
- Direct access to our analyst team
Village ownership, clearances and venue rights shape rivalry
Competition in the Australia catering services market sorts suppliers by site access, security clearance and venue rights rather than by menu price alone. Compass Group Australia holds Defence living and working services in New South Wales, the ACT and Queensland and runs remote sites through its ESS business. Sodexo Australia competes on large resources contracts, shown by the Rio Tinto and Westgold awards. ISS Facility Services Australia combines hospital patient meals with Defence work in South Australia and Western Australia. Civeo Australia competes as a village owner and operator in Western Australia and Queensland. Delaware North Australia and Trippas White Group hold stadium, racecourse and attraction concessions, while dnata Catering & Retail serves airlines at the main airports. Cater Care spans aged care, remote and education sites, The Fresh Collective focuses on Sydney events and venues, and Contemporary Catering specializes in Victorian aged care.
Multinationals hold contracts while specialists own niches
Supply in Australia splits into three distinct groups of competing firms. Multinational contract caterers such as Compass Group, Sodexo and ISS hold the largest institutional, Defence and resources contracts, because they can mobilize staff and bundle cleaning and facilities work into integrated facility management offers. Civeo owns villages and sells rooms with meals, a barrier that pure caterers cannot copy. Venue and event specialists such as Delaware North, Trippas White Group and The Fresh Collective compete on concession rights, while dnata holds airside kitchens and approvals at the main airports, a barrier that new entrants cannot copy quickly. No public statistic measures concentration, so shares here rest on Credence Research estimates.
Caterers active in Australia
| Company | Type | Role in the market |
|---|---|---|
| Compass Group Australia | Multinational contract caterer | Defence living services in NSW, ACT and Queensland plus remote ESS sites |
| Sodexo Australia | Multinational contract caterer | Runs Rio Tinto Pilbara and Westgold village catering and facilities |
| ISS Facility Services Australia | Integrated facility services provider | Hospital patient meals and Defence catering in South and Western Australia |
| Civeo Australia | Village owner and operator | Sells rooms, meals and integrated services in WA and Bowen Basin villages |
| Delaware North Australia | Venue hospitality specialist | Runs stadium and Flemington racecourse food and beverage service |
| dnata Catering & Retail | Airline caterer | Supplies inflight meals at major airports, including Western Sydney International |
| Cater Care | Specialist contract caterer | Serves aged care, remote, education and business sites nationwide |
| Trippas White Group | Venue and attraction caterer | Exclusive food and beverage partner at Taronga Zoo Sydney |
| The Fresh Collective | Event and venue caterer | Caters Sydney corporate functions, weddings and partner venues |
| Contemporary Catering | Aged care catering specialist | Provides contracted meals to aged care homes from Bayswater, Victoria |
Aged care compliance and site bundles will decide share
Credence Research's view is that contracted catering in Australia is shifting from single-service meal deals toward compliance-heavy and bundled site contracts. Aged care is the clearest test, because Standard 6 turns menu quality into an audited obligation that many small in-house kitchens will struggle to meet. Resources villages and Defence bases will keep concentrating volume with operators that can mobilize whole sites. Venue and airport catering will grow with visitor spending, but concession rights decide who benefits. Caterers that win wage indexation in their contracts will hold margin as labor costs keep rising.
Meal counts, room nights and contract terms drive estimates
The report on the Australia catering services market uses 2025 as the base year and forecasts value to 2035. Market values come from the Credence Research model, which links meal counts, aged care resident days, village room nights, Defence and venue contracts and airline activity to typical contract rates. Regional, service type, end-use, delivery and revenue model splits are Credence Research estimates, because official statistics do not separate contracted catering by these groups. Sources include government statistics and guidance, regulator and Defence releases, company announcements and results, industry association material and press reports. No interviews or surveys were used to prepare this edition of the report.
Aged care, resources and airports carry demand to 2035
Through 2035, demand will rest on aged care homes buying compliant menus, resources companies outsourcing whole villages, Defence bases under regional bundles and visitor-driven venue and airline catering. Cook-chill production grows at 5.0% a year in the base case, the fastest delivery model, as hospitals and aged care groups centralize kitchens. Western Sydney International and the 2032 Games venues add new catering points late in the period. The main risks are wage rises without contract indexation, food and energy inflation and commodity cycles that close remote villages.
Wage pass-through and resource activity set the range
The range of outcomes depends on whether caterers can pass wage and food costs into contract rates and on how many resource villages stay at full occupancy. A commodity downturn that closes villages, combined with flat aged care funding, would slow growth. Faster aged care outsourcing under Standard 6, new airport kitchens and timely Games venues would lift it. Labor terms decide the spread in every case, because staff costs take the largest share of each meal rate.
| Scenario | CAGR, 2026–2035 | Value, 2035 | What has to hold |
|---|---|---|---|
| Downside | 3.0% | USD 11.13 billion | Resource villages close in a commodity downturn and caterers absorb wage rises on fixed rates |
| Base | 4.28% | USD 12.46 billion | Aged care, Defence and resources contracts renew on recent terms with partial wage indexation |
| Upside | 5.4% | USD 13.69 billion | Aged care outsourcing accelerates and Western Sydney and Games venues add catering volume on time |
Frequently Asked Questions
How big is the Australia catering services market?
Which region leads catering demand in Australia?
Which region grows fastest?
Which service type leads the market?
Why does cook-chill production grow fastest?
How are catering contracts priced?
What holds the market back?
Who are the main companies in this market?
Table of Content
Chapter 1 Market Segmentation
- 1.1 Segmentation Framework
- 1.1.1 Product and Service Classification
- 1.1.2 Application and End-Use Classification
- 1.1.3 Technology and Solution Classification
- 1.1.4 Customer and Distribution Channel Classification
- 1.1.5 Geographic Segmentation
- 1.1.6 Market Segment Definitions and Boundaries
- 1.2 By Service Type
- 1.2.1 Workplace & Institutional Contract Catering
- 1.2.2 Event & Venue Catering
- 1.2.3 Remote & Workforce Catering
- 1.2.4 Transport & Travel Catering
- 1.3 By End-Use Industry
- 1.3.1 Business & Industry
- 1.3.2 Healthcare & Aged Care
- 1.3.3 Education & Public Services
- 1.3.4 Resources & Mobility
- 1.4 By Delivery Model
- 1.4.1 On-Site Production
- 1.4.2 Central Kitchen Distribution
- 1.4.3 Cook-Chill Production
- 1.4.4 Mobile & Pop-Up Service
- 1.5 By Revenue Model
- 1.5.1 Fixed-Price Contract
- 1.5.2 Cost-Plus Contract
- 1.5.3 Management Fee
- 1.5.4 Per-Meal & Revenue-Share
Chapter 2 Introduction
- 2.1 Report Objectives and Scope
- 2.2 Product Definition and Industry Terminology
- 2.3 Market Inclusions and Exclusions
- 2.4 Research Process
- 2.4.1 Primary Research and Expert Interviews
- 2.4.2 Secondary Research and Source Review
- 2.4.3 Top-Down and Bottom-Up Estimation
- 2.4.4 Data Triangulation and Verification
- 2.5 Market Size Measurement Basis
- 2.5.1 2025: USD 8.19 billion → 2035: USD 12.46 billion
- 2.6 Historical and Forecast Reference Periods
- 2.6.1 Historical Period: 2018-2025
- 2.6.2 Base Year: 2025
- 2.6.3 Forecast Period: 2025-2035
- 2.7 Research Assumptions and Limitations
Chapter 3 Executive Summary
- 3.1 Market Snapshot and Key Findings
- 3.2 Base-Year Market Size, 2025
- 3.3 Forecast Market Size, 2035
- 3.4 Revenue and Volume Growth Outlook
- 3.5 Key Demand and Supply Indicators
- 3.6 Leading Market Segments
- 3.7 Fastest-Growing Market Opportunities
- 3.8 Regional Performance Highlights
- 3.9 Technology and Industry Transformation
- 3.10 Competitive Landscape Summary
- 3.11 Analyst View and Strategic Implications
Chapter 4 Australia Catering Services Market Trends and Developments
- 4.1 Historical Industry Development, 2018-2025
- 4.2 Recent Market Trends and Developments
- 4.3 Demand and Customer Behavior Trends
- 4.4 Technology and Product Innovation
- 4.5 Artificial Intelligence, Automation and Digitalization
- 4.6 Local Manufacturing and Supply Chain Realignment
- 4.7 Industry Partnerships, Mergers and Acquisitions
- 4.8 Sustainability and Circular Economy Developments
- 4.9 Government and Private Sector Investment Trends
- 4.10 Emerging Business Models and Commercialization
- 4.11 Industry Developments and Announcements
Chapter 5 Australia Catering Services Market Supply and Demand Analysis
- 5.1 Demand Trend and Consumption Analysis, 2018-2025
- 5.2 Demand Forecast, 2025-2035
- 5.3 Supply Chain Structure and Procurement Trends
- 5.4 Supply-Demand Gap and Bottlenecks
- 5.5 Import Dependence and Sourcing Structure
- 5.6 Regional Supply and Demand Concentration
Chapter 6 Australia Catering Services Market Pricing Analysis
- 6.1 Pricing Structure and Measurement
- 6.2 Historical Pricing Trends, 2018-2025
- 6.3 Pricing Outlook, 2025-2035
- 6.4 Pricing by Product and Market Segment
- 6.5 Geographic Pricing Differences
- 6.6 Key Input, Energy, Labor and Logistics Costs
- 6.7 Contract Pricing and Purchasing Models
- 6.8 Pricing Sensitivity and Competitive Positioning
- 6.9 Price, Margin and Profitability Implications
Chapter 7 Australia Catering Services Market Dynamics
- 7.1 Market Growth Drivers
- 7.1.1 Demand-Side Drivers
- 7.1.2 Technology and Innovation Drivers
- 7.1.3 Infrastructure and Investment Drivers
- 7.1.4 Regulatory and Policy Drivers
- 7.2 Market Restraints
- 7.2.1 Cost and Affordability Constraints
- 7.2.2 Technology and Adoption Barriers
- 7.2.3 Supply Chain and Operational Constraints
- 7.3 Market Challenges
- 7.3.1 Competitive Pressure and Margin Erosion
- 7.3.2 Skills, Infrastructure and Implementation Gaps
- 7.4 Emerging Market Opportunities
- 7.5 Market Dynamics Impact and Time-Horizon Assessment
Chapter 8 Australia Catering Services Value Chain Analysis
- 8.1 Industry Value Chain Overview
- 8.2 Upstream Suppliers and Critical Inputs
- 8.3 Technology and Component Providers
- 8.4 Manufacturing or Service Delivery
- 8.5 Distribution, Channel Partners and Integrators
- 8.6 Downstream Applications and End Users
- 8.7 Value Addition and Profit Pools
- 8.8 Vertical Integration and Outsourcing
- 8.9 Supplier Concentration and Risk
- 8.10 Supply Chain Localization and Resilience
Chapter 9 Australia Catering Services Market Regulations and Policies
- 9.1 Relevant Laws, Standards and Compliance Frameworks
- 9.2 Product, Service, Safety and Quality Requirements
- 9.3 Government Policies, Incentives and Subsidies
- 9.4 Imports, Exports and Trade Barriers
- 9.5 Public Procurement and Local Content Requirements
- 9.6 Data Protection, AI and Cybersecurity Compliance
- 9.7 Upcoming Policy Changes and Market Implications
Chapter 10 Australia Catering Services Market Hotspots and Opportunities
- 10.1 Market Opportunity Mapping and Growth Hotspots
- 10.2 High-Growth Applications and Customer Groups
- 10.3 Underserved Markets and White-Space Opportunities
- 10.4 Emerging Technology and Product Opportunities
- 10.5 New Capacity and Investment Hotspots
- 10.6 Market Entry and Expansion Opportunities
- 10.7 Distribution and Partnership Opportunities
- 10.8 Near-Term and Long-Term Commercial Potential
- 10.9 Opportunity Attractiveness and Execution Risks
Chapter 11 Australia Catering Services Market Outlook, 2025-2035
- 11.1 Market Size and Analysis
- 11.1.1 Revenue (Market Measurement: 2025: USD 8.19 billion → 2035: USD 12.46 billion)
- 11.1.2 Historical Market Size, 2018-2025
- 11.1.3 Base-Year Market Size, 2025
- 11.2 Market Forecast, 2025-2035
- 11.2.1 Revenue Forecast to 2035
- 11.2.2 CAGR and Year-on-Year Growth
- 11.2.3 Incremental Revenue Opportunity
- 11.3 Forecast Assumptions and Scenario Analysis
- 11.3.1 Base-Case Forecast
- 11.3.2 Optimistic and Conservative Scenarios
- 11.3.3 Technology, Pricing and Policy Sensitivities
- 11.4 Market Attractiveness and Growth Outlook
Chapter 12 Australia Catering Services Market Segmentation and Outlook
- 12.1 Segmentation Summary and Market Shares, 2025
- 12.2 Largest and Fastest-Growing Segments
- 12.3 By Service Type - Market Size and Forecast, 2025-2035
- 12.3.1 Segment Definition and Scope
- 12.3.2 Historical Market Size, 2018-2025
- 12.3.3 Revenue Forecast, 2025-2035
- 12.3.4 Base-Year Market Share, 2025
- 12.3.5 Segment CAGR and Growth Drivers
- 12.3.6 Subsegment Market Size and Forecast
- 12.3.6.1 Workplace & Institutional Contract Catering
- 12.3.6.2 Event & Venue Catering
- 12.3.6.3 Remote & Workforce Catering
- 12.3.6.4 Transport & Travel Catering
- 12.3.7 Subsegment Pricing and Adoption Trends
- 12.3.8 Leading Suppliers and Competition
- 12.3.9 Regional Demand and Opportunities
- 12.4 By End-Use Industry - Market Size and Forecast, 2025-2035
- 12.4.1 Segment Definition and Scope
- 12.4.2 Historical Market Size, 2018-2025
- 12.4.3 Revenue Forecast, 2025-2035
- 12.4.4 Base-Year Market Share, 2025
- 12.4.5 Segment CAGR and Growth Drivers
- 12.4.6 Subsegment Market Size and Forecast
- 12.4.6.1 Business & Industry
- 12.4.6.2 Healthcare & Aged Care
- 12.4.6.3 Education & Public Services
- 12.4.6.4 Resources & Mobility
- 12.4.7 Subsegment Pricing and Adoption Trends
- 12.4.8 Leading Suppliers and Competition
- 12.4.9 Regional Demand and Opportunities
- 12.5 By Delivery Model - Market Size and Forecast, 2025-2035
- 12.5.1 Segment Definition and Scope
- 12.5.2 Historical Market Size, 2018-2025
- 12.5.3 Revenue Forecast, 2025-2035
- 12.5.4 Base-Year Market Share, 2025
- 12.5.5 Segment CAGR and Growth Drivers
- 12.5.6 Subsegment Market Size and Forecast
- 12.5.6.1 On-Site Production
- 12.5.6.2 Central Kitchen Distribution
- 12.5.6.3 Cook-Chill Production
- 12.5.6.4 Mobile & Pop-Up Service
- 12.5.7 Subsegment Pricing and Adoption Trends
- 12.5.8 Leading Suppliers and Competition
- 12.5.9 Regional Demand and Opportunities
- 12.6 By Revenue Model - Market Size and Forecast, 2025-2035
- 12.6.1 Segment Definition and Scope
- 12.6.2 Historical Market Size, 2018-2025
- 12.6.3 Revenue Forecast, 2025-2035
- 12.6.4 Base-Year Market Share, 2025
- 12.6.5 Segment CAGR and Growth Drivers
- 12.6.6 Subsegment Market Size and Forecast
- 12.6.6.1 Fixed-Price Contract
- 12.6.6.2 Cost-Plus Contract
- 12.6.6.3 Management Fee
- 12.6.6.4 Per-Meal & Revenue-Share
- 12.6.7 Subsegment Pricing and Adoption Trends
- 12.6.8 Leading Suppliers and Competition
- 12.6.9 Regional Demand and Opportunities
- 12.7 Segment Growth Comparison
- 12.8 Segment Attractiveness and Priority Matrix
Chapter 13 Australia Catering Services End-Use and Application Market Outlook
- 13.1 End-Use Industry and Customer Demand Structure
- 13.2 Leading Applications and Customer Groups
- 13.3 End-Use Market Size, Share and Forecast
- 13.4 Major End-Use Industry Deep Dives
- 13.4.1 Customer Requirements and Use Cases
- 13.4.2 Demand and Replacement Cycles
- 13.4.3 Technical and Regulatory Considerations
- 13.4.4 Purchasing and Procurement Models
- 13.4.5 Leading Vendors and Distribution Channels
- 13.4.6 Forecast and Commercial Opportunities
- 13.5 Emerging Applications and Cross-Segment Demand
- 13.6 End-Use Industry Investment Priorities
Chapter 14 Australia Catering Services Geographic Market Outlook, 2025-2035
- 14.1 Domestic Market Distribution and Demand Clusters
- 14.2 State- or Province-Wise Market Size and Forecast, 2025-2035
- 14.3 City and Metropolitan Market Outlook
- 14.4 Industrial, Manufacturing and Commercial Clusters
- 14.5 Geographic Concentration of Key End Users
- 14.6 Local Pricing and Purchasing Differences
- 14.7 Domestic Production Facilities and Capacity Map
- 14.8 Local Infrastructure and Project Pipeline
- 14.9 State-Level Policy and Incentive Differences
- 14.10 Subnational Investment Hotspots and Opportunities
- 14.11 Distribution and Logistics Networks
- 14.12 Domestic Competitive Footprint
Chapter 15 Australia Catering Services Technology, Innovation and Sustainability Outlook
- 15.1 Technology Landscape and Maturity
- 15.2 Product, Process and Service Innovation
- 15.3 AI, Automation and Digital Tools in the Industry
- 15.4 Technology Adoption and Performance Benchmarking
- 15.5 Innovation Pipeline and R&D Investment
- 15.6 Energy Efficiency and Resource Management
- 15.7 Sustainability, Recycling and Circularity
- 15.8 Technology Roadmap, 2025-2035
- 15.9 Risks of Obsolescence and Technology Substitution
Chapter 16 Australia Catering Services Market Key Strategic Imperatives
- 16.1 Growth and Market Entry Priorities
- 16.2 High-Return Products and Segments
- 16.3 Pricing, Profitability and Cost Optimization
- 16.4 Technology Investment and Product Differentiation
- 16.5 Supply Chain Localization and Resilience
- 16.6 Distribution and Customer Acquisition
- 16.7 Partnership, Acquisition and Capacity Strategy
- 16.8 Regional Expansion Priorities
- 16.9 Short-, Medium- and Long-Term Actions
Chapter 17 Competition Outlook
- 17.1 Industry Competition Characteristics
- 17.2 Market Structure and Concentration
- 17.3 Market Share and Competitive Positioning, 2025
- 17.4 Company-Wise Revenue and Product Benchmarking
- 17.5 Production and Service Capacity Benchmarking
- 17.6 Technology, Pricing and Differentiation
- 17.7 Regional Footprint and Distribution Strength
- 17.8 Mergers, Acquisitions and Strategic Alliances
- 17.9 New Entrants and Competitive Threats
- 17.10 Porter's Five Forces and Industry Attractiveness
- 17.11 Competitive Outlook, 2025-2035
Chapter 18 Company Profiles
- 18.1 Company Coverage and Selection Criteria
- 18.2 Compass Group Australia
- 18.2.1 Business Description
- 18.2.2 Company Ownership and Geographic Presence
- 18.2.3 Product and Service Portfolio
- 18.2.4 Manufacturing and Operating Footprint
- 18.2.5 Financial Performance and Investment
- 18.2.6 Market Share and Competitive Position
- 18.2.7 Technology and Innovation Capabilities
- 18.2.8 Strategic Alliances or Partnerships
- 18.2.9 Recent Developments
- 18.2.10 Growth Strategy and Outlook
- 18.3 Sodexo Australia
- 18.4 ISS Facility Services Australia
- 18.5 Civeo Australia
- 18.6 Delaware North Australia
- 18.7 dnata Catering & Retail
- 18.8 Cater Care
- 18.9 Trippas White Group
- 18.10 The Fresh Collective
- 18.11 Contemporary Catering
- 18.12 Other Relevant Market Participants
Note: Every listed company is profiled on the structure shown under the first company. The company list is preliminary and may change based on research findings, market developments, data availability and client requirements.
Chapter 19 Disclaimer
- 19.1 Research and Forecast Disclaimer
- 19.2 Data Source and Estimation Limitations
Note: The depth of individual sections depends on data availability for this market. Volume, capacity, trade and other unit-based metrics are included where applicable.

