
Injectable output and Type I glass shape container demand
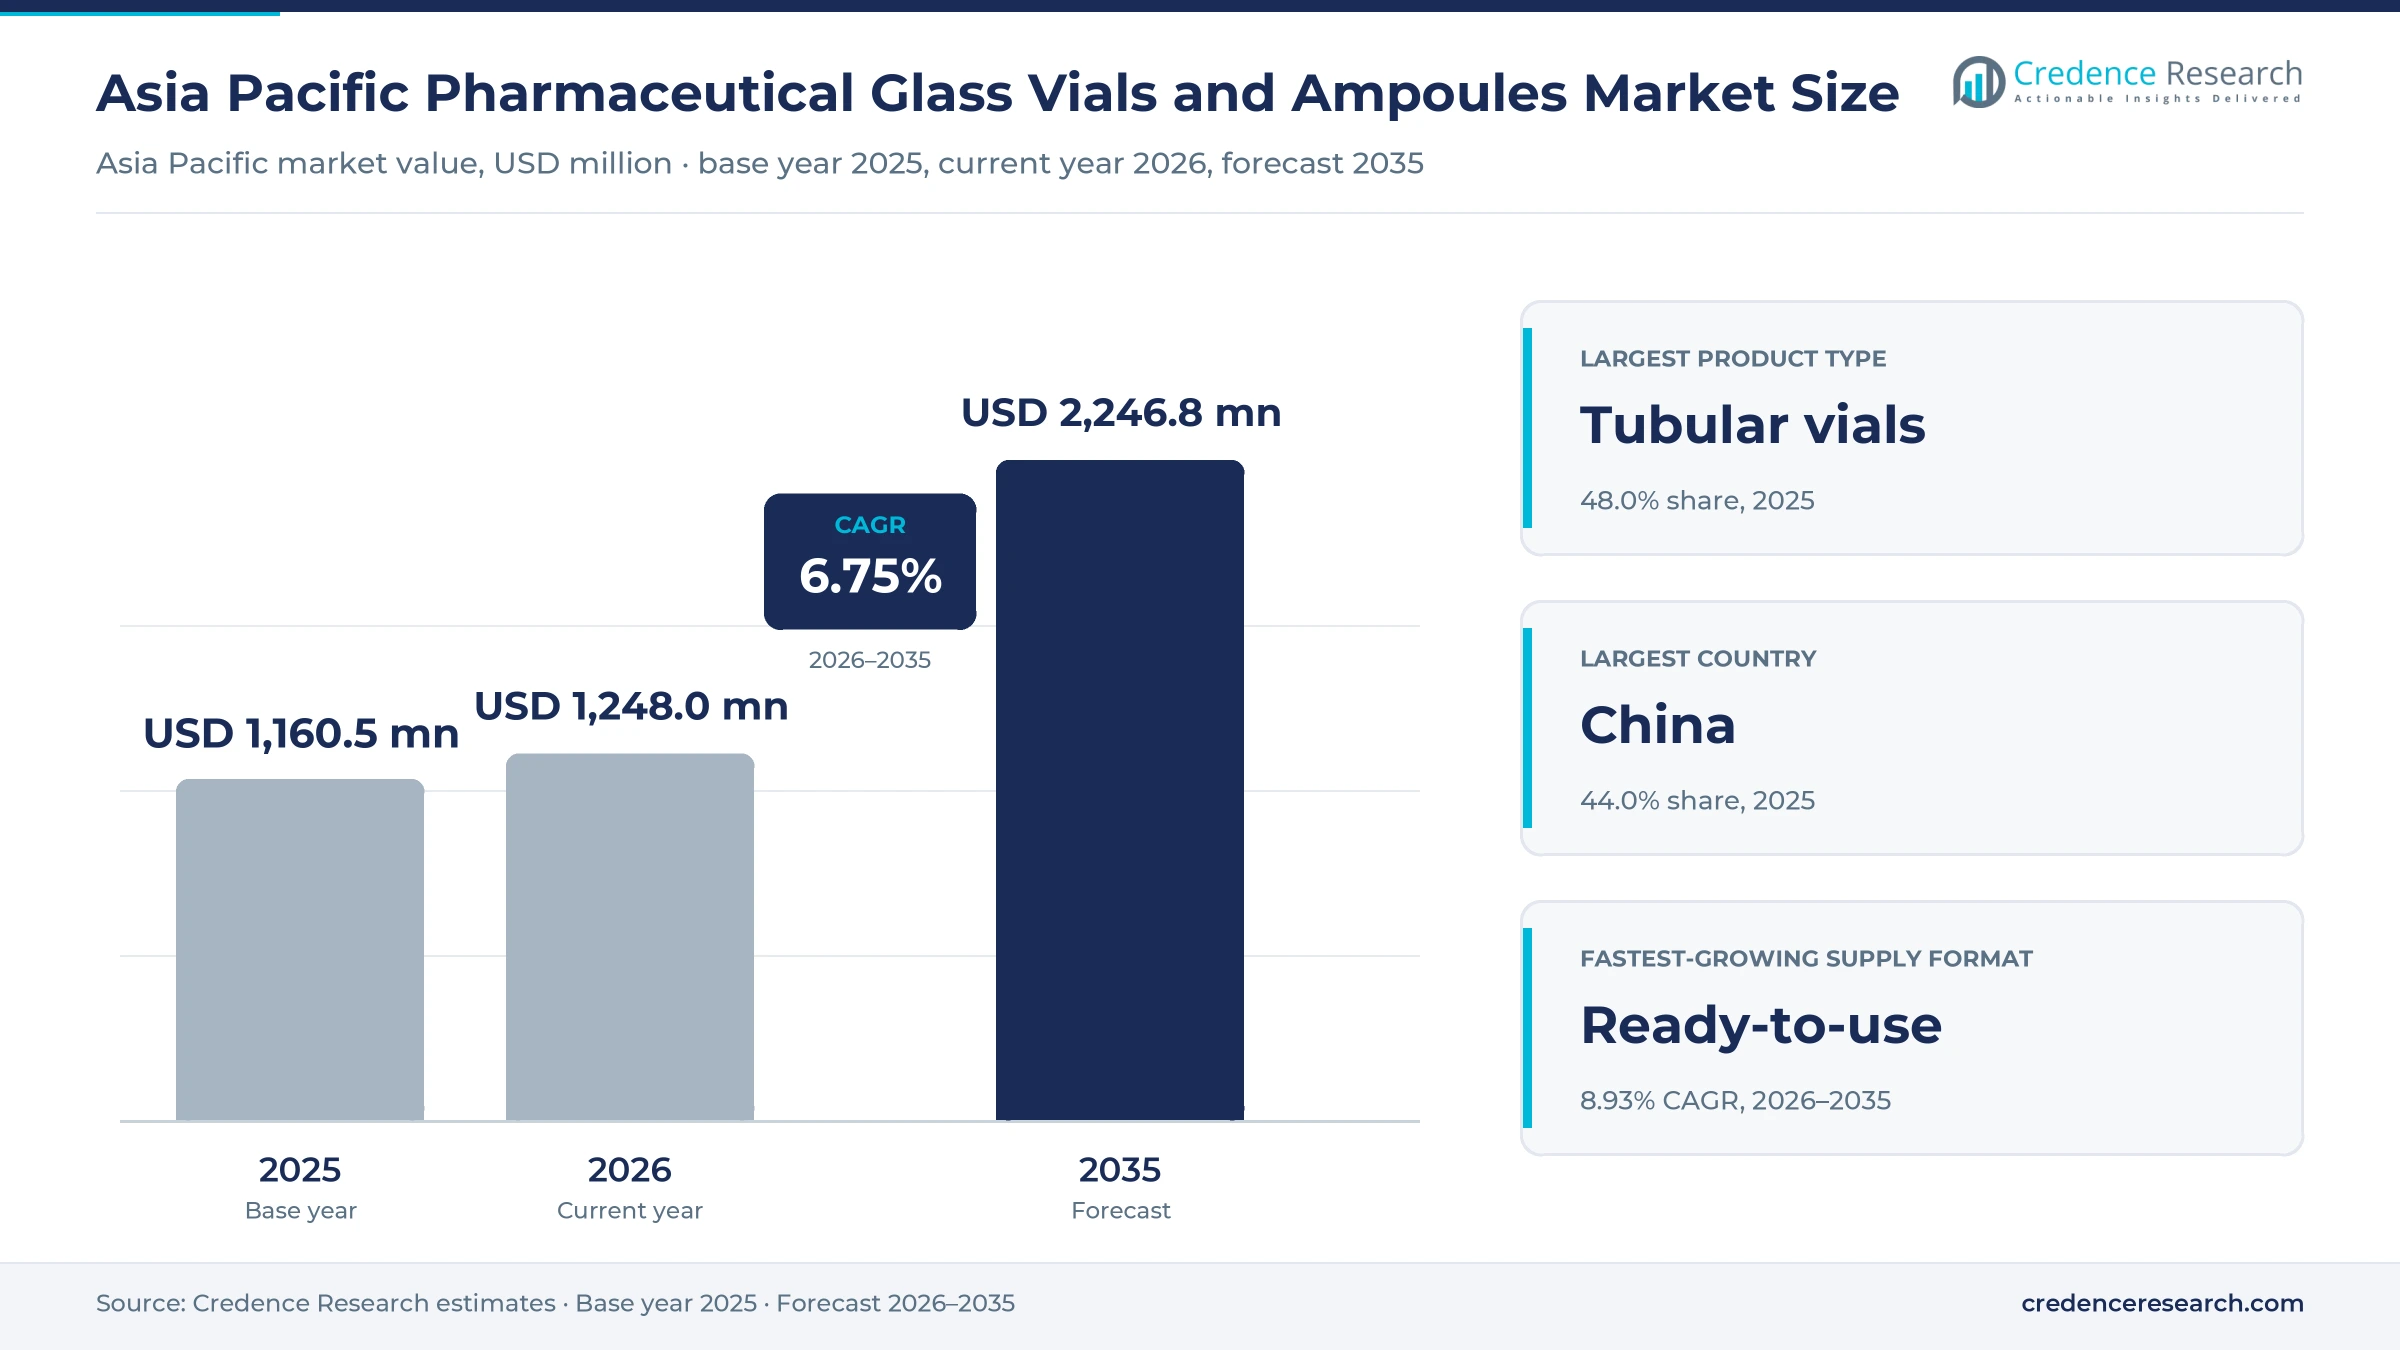
The Asia Pacific pharmaceutical glass vials and ampoules market was valued at USD 1.16 billion in 2025 and is projected to increase from USD 1.25 billion in 2026 to USD 2.25 billion by 2035, registering a CAGR of 6.75% during 2026–2035. Demand comes from generic drug makers, vaccine producers, biologics companies and contract manufacturers that fill injectable medicines into glass vials and ampoules. China held the largest country share, 44.0% in 2025, because its large injectable sector buys borosilicate vials from domestic and foreign glassmakers. India is the fastest-growing country at 8.22% a year, as local converters add tubing, vial and cartridge capacity for domestic and export drug production. The biggest commercial change came in September 2025, when Corning and SGD Pharma inaugurated a Type I glass tubing plant in Telangana. This plant gives Indian vial makers a local source of high-grade tubing instead of imports.
Which glass containers and buyers does the estimate cover?
The estimate measures the value of glass vials and ampoules sold to drug makers in Asia Pacific for injectable and other liquid medicines. It covers tubular vials, molded vials and ampoules made from Type I, Type II and Type III glass, supplied in bulk nonsterile, bulk sterile and ready-to-use formats.
The estimate excludes prefilled syringes, cartridges, plastic vials, closures and the glass tubing sold between glassmakers and converters. The value chain runs from glass melting and tubing plants through converters and washing or sterilization lines to drug makers, vaccine producers and contract manufacturers in each country.
Asia Pacific Pharmaceutical Glass Vials and Ampoules Market Insights
- The Asia Pacific pharmaceutical glass vials and ampoules market was valued at USD 1.16 billion in 2025 and is projected to reach USD 2.25 billion by 2035, registering a CAGR of 6.75% during 2026–2035.
- China held a 44.0% share of 2025 value, because its injectable drug makers buy vials and ampoules from a large domestic and foreign supplier base.
- Tubular vials led with a 48.0% share of 2025 value, because vaccines, biologics and small-volume injectables rely on precise tubular formats.
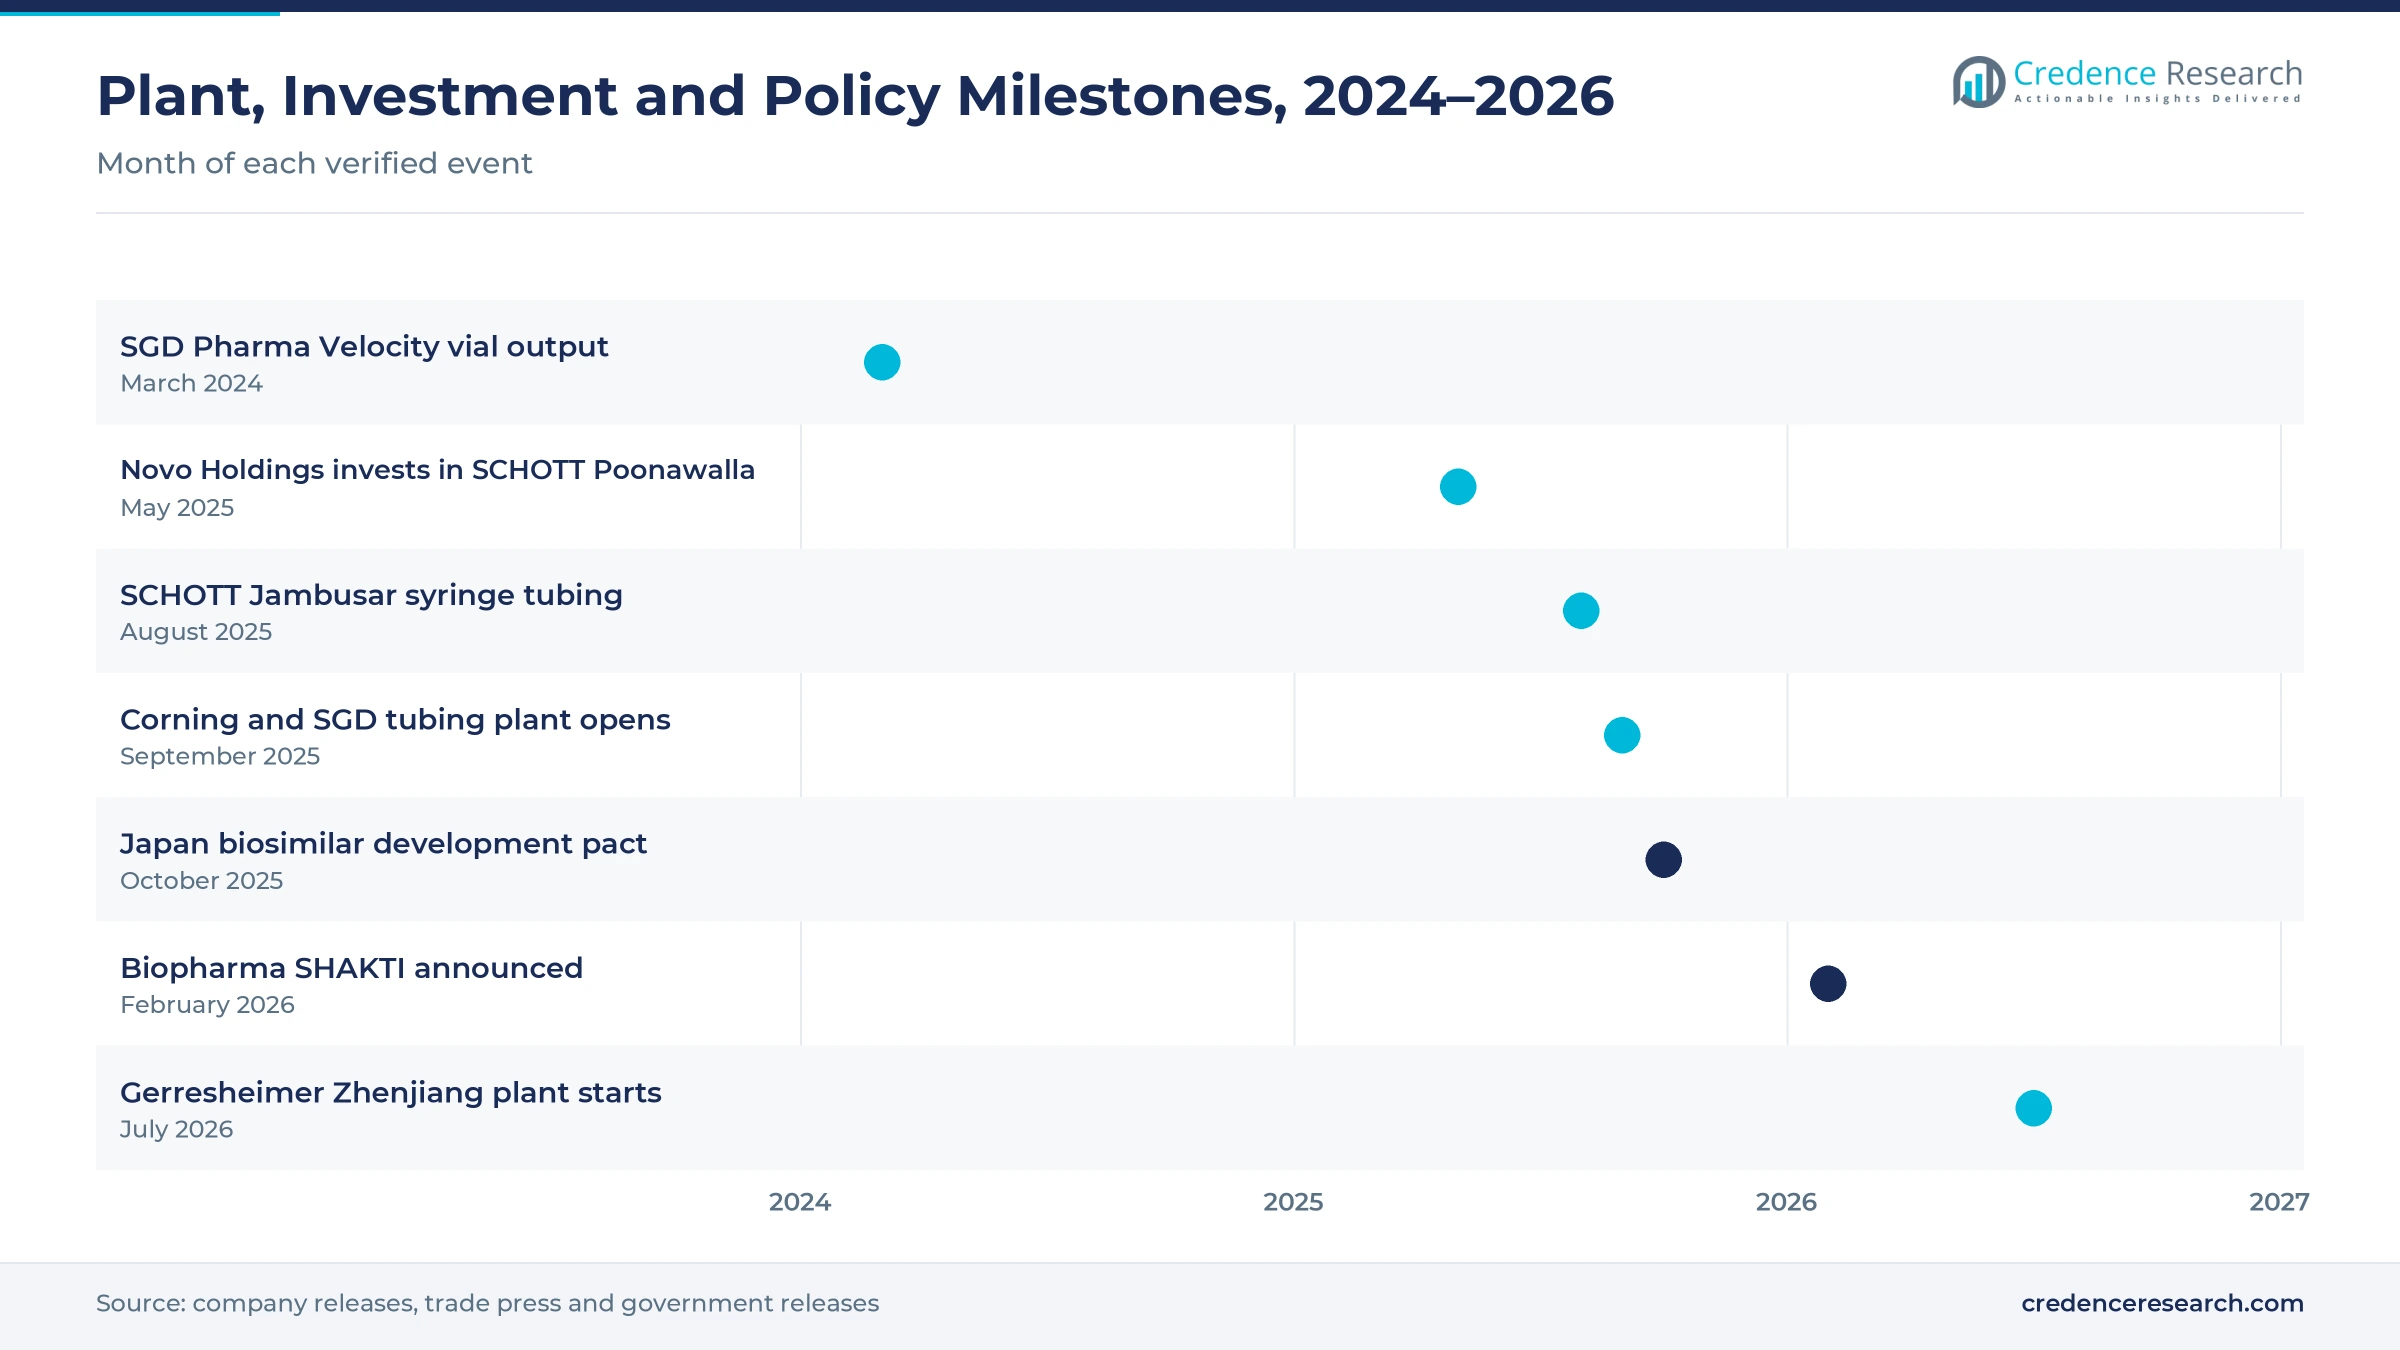
- Corning and SGD Pharma inaugurated their Type I glass tubing plant in Telangana, India, in September 2025, after Velocity vial output began in March 2024.
- Ready-to-use supply grows fastest at 8.93% a year during 2026–2035, as drug makers cut washing and sterilization steps on filling lines.
Tubular vials lead while ready-to-use supply grows fastest
Why do tubular vials hold the largest value?
Based on product type, the market is categorized into molded vials, tubular vials and ampoules. Tubular Vials led with a 48.0% share of 2025 value, because vaccines, biologics and small-volume injectables need thin, precise walls and tight dimensions. Tubular Vials also grow fastest at 7.15% a year, as Indian and Chinese converters add tubing and forming lines for biologics customers across the region.
How does glass type affect container choice?
Based on glass performance, the market is categorized into Type I glass, Type II glass and Type III glass. Type I Glass led with a 58.0% share of 2025 value, because borosilicate glass resists chemical attack from injectable formulations. Type I Glass also grows fastest at 7.50% a year, as regulators and drug makers raise container standards for generic injectables and biologics.
Which drug types use the most containers?
Based on application, the market is categorized into small-molecule injectables, vaccines, non-vaccine biologics and other pharmaceutical preparations. Small-Molecule Injectables led with a 46.0% share of 2025 value, because generic injectable output in China and India fills billions of vials and ampoules. Non-Vaccine Biologics grow fastest at 8.56% a year, as biosimilar and antibody output expands in India, Japan and China.
How fast are ready-to-use formats gaining ground?
Based on supply format, the market is categorized into bulk nonsterile, bulk sterile and ready-to-use containers. Bulk Nonsterile led with a 72.0% share of 2025 value, because most drug makers still wash and depyrogenate containers on their own lines. Ready-to-Use grows fastest at 8.93% a year, as contract manufacturers buy nested and tray-packed vials for flexible filling.
| Segment Group | Leading Sub-segment | Share, 2025 | Fastest-growing Sub-segment | CAGR, 2026–2035 |
|---|---|---|---|---|
| By Product Type | Tubular Vials | 48.0% | Tubular Vials | 7.15% |
| By Glass Performance | Type I Glass | 58.0% | Type I Glass | 7.50% |
| By Application | Small-Molecule Injectables | 46.0% | Non-Vaccine Biologics | 8.56% |
| By Supply Format | Bulk Nonsterile | 72.0% | Ready-to-Use | 8.93% |
Request a Free Sample
Fill in your details and we'll send you a free sample report.
- Sample data tables & charts
- Research methodology
Biologics, Indian capacity and filling lines lift demand
Why does biologics container qualification favor Type I glass?
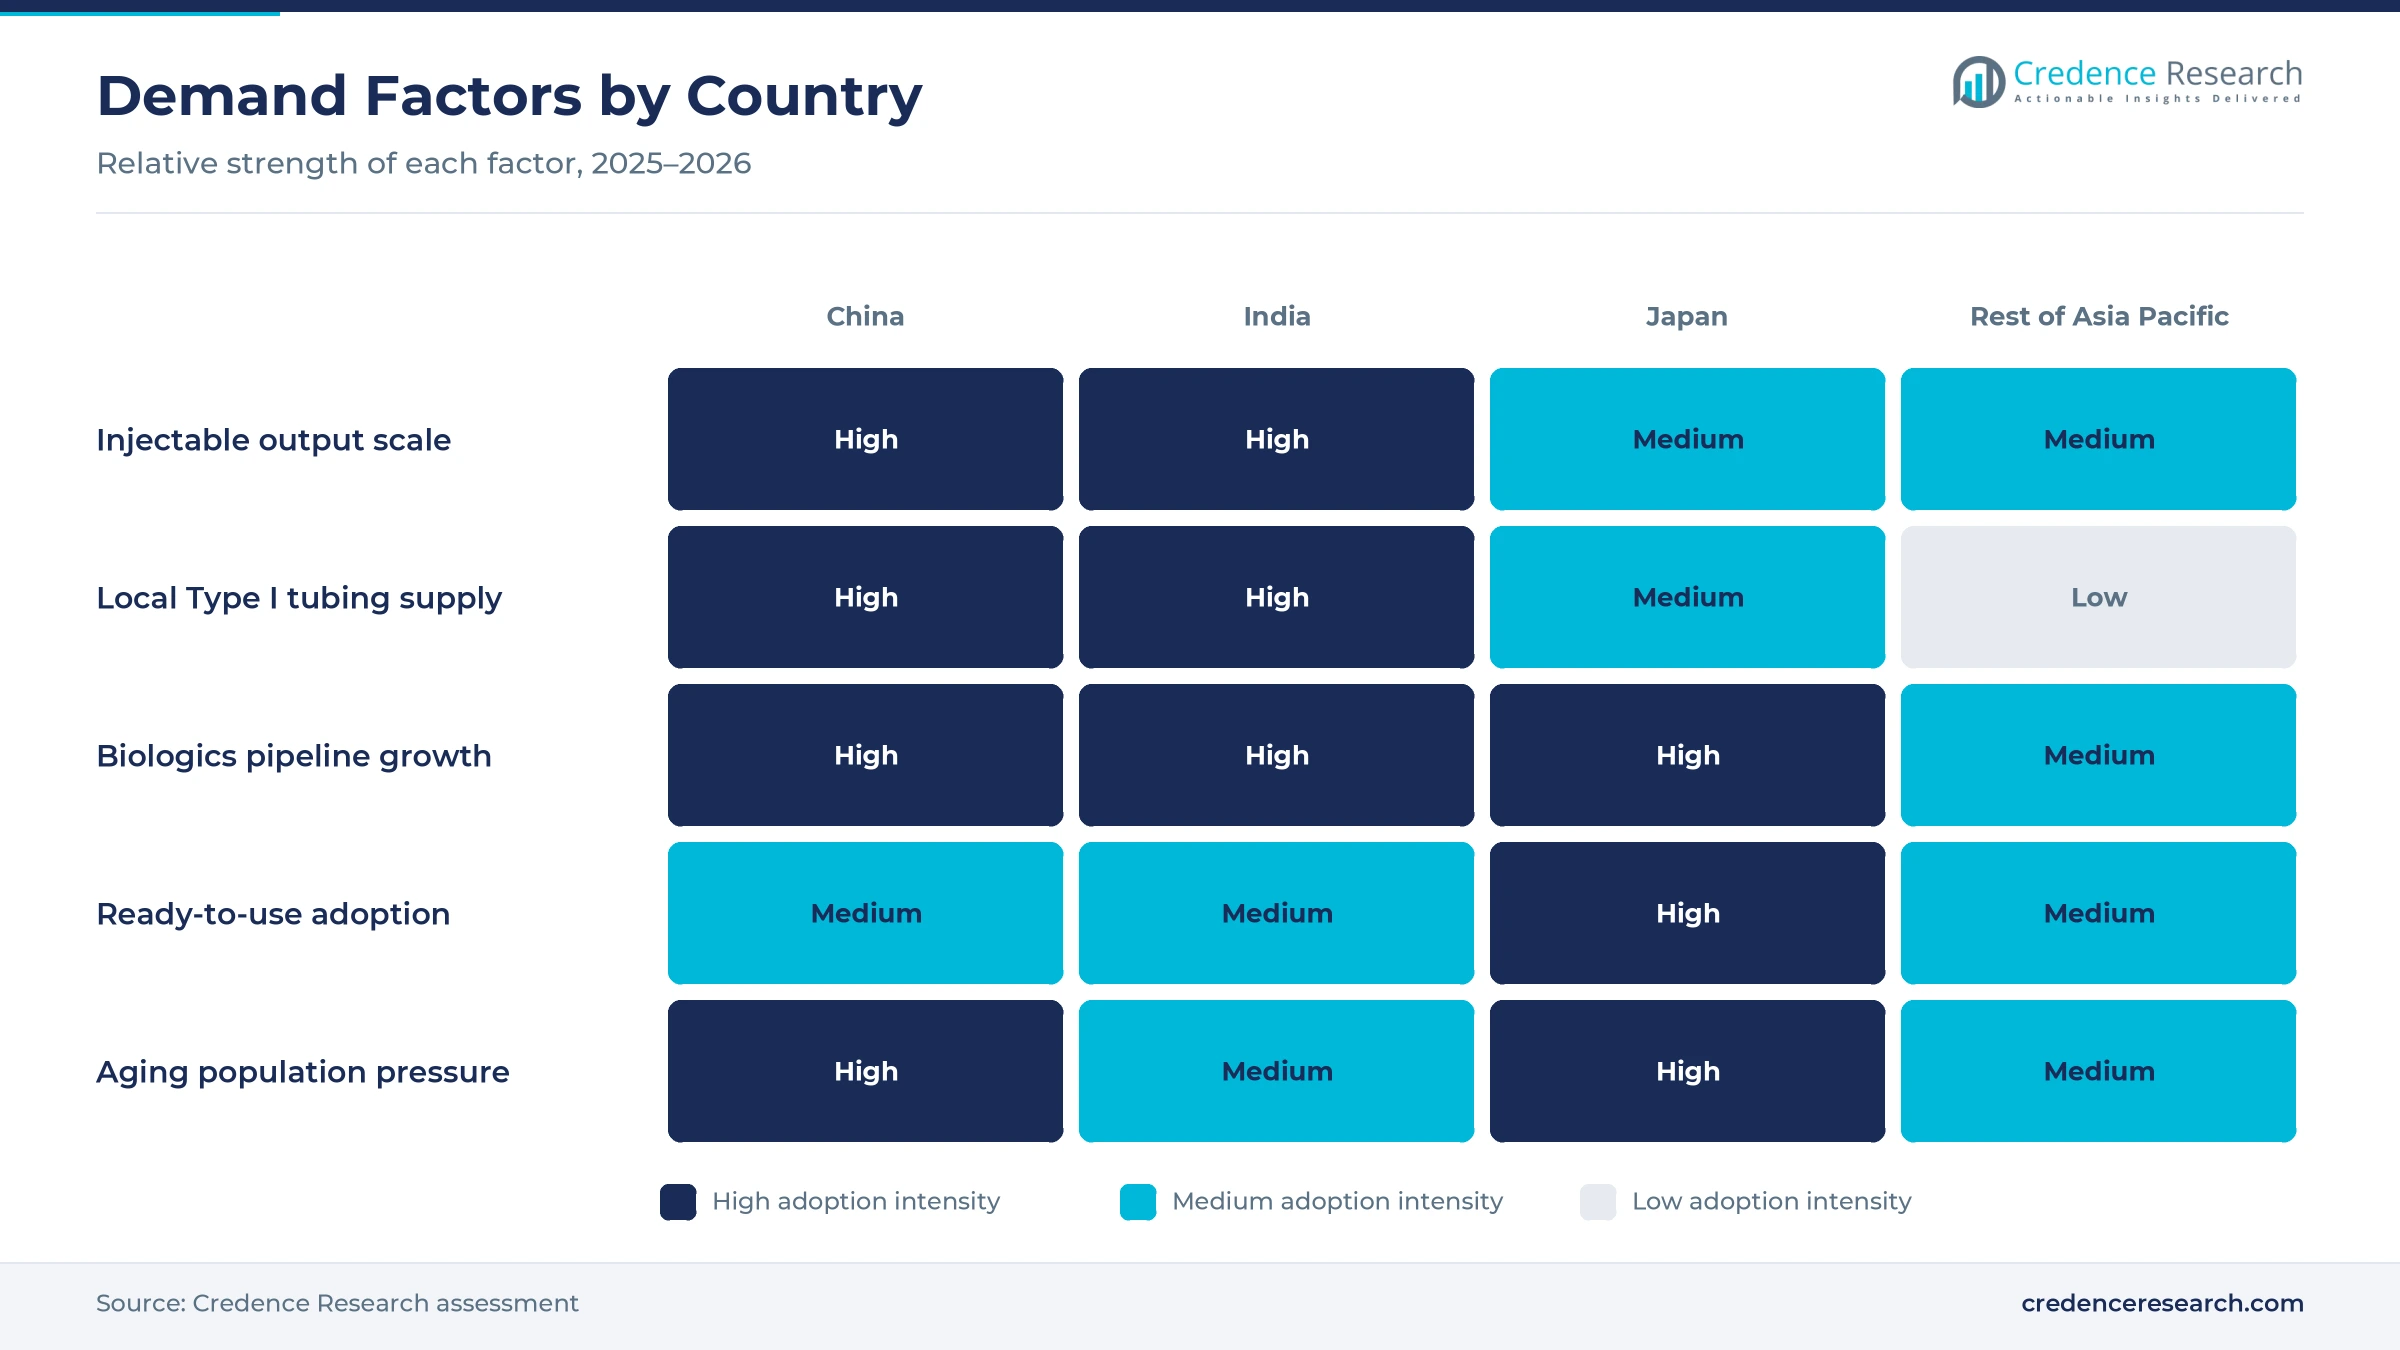
Biologics-compatible container qualification favors Type I borosilicate glass, because protein drugs and vaccines need stable surfaces and low extractables over long shelf lives. The Corning and SGD Pharma plant in Telangana makes Type I tubing for injectables, diagnostics and biologics, according to Packaging Gateway. Its Velocity vials cut glass particulates by up to 96% and raise fill and finish efficiency by 20% to 50%. Shandong Pharmaceutical Glass also supplies Type I vaccine vials from 1 ml to 20 ml and sells to more than 1,000 drug makers in China. As a result, Type I glass holds 58.0% of 2025 value, while non-vaccine biologics grow at 8.56% a year, the fastest application.
How does investment in Indian manufacturing lift demand?
Investment across the Indian manufacturing ecosystem lifts container demand, because domestic drug makers want local glass with shorter lead times. Novo Holdings invested in SCHOTT Poonawalla in May 2025 alongside TPG, and the venture runs three Indian plants with capacity above 3 billion units a year, according to Novo Holdings. SCHOTT also began syringe and cartridge tubing output at Jambusar, Gujarat, in August 2025, at its second-largest tubing site worldwide. Nipro planned a furnace upgrade at Meerut, Uttar Pradesh, in July 2024 for operation by mid-2025, which widens its range of tubing sizes. In turn, India becomes the fastest-growing country, as local plants replace imported containers.
How does filling-line integration raise value per container?
Preparation and filling-line integration raises value per container, because drug makers want vials that run faster on automated lines with fewer rejects. SGD Pharma began Velocity vial production at its Vemula plant in March 2024, and the site makes more than three million vials and ampoules a day. SGD Pharma also offers Sterinity ready-to-use Type I molded vials in 10 ml and 20 ml trays, which remove the in-house sterilization step. SCHOTT's perfeXion system checks 100,000 data points every minute on its Indian tubing lines, according to SCHOTT. As a result, ready-to-use supply grows at 8.93% a year, the fastest supply format during 2026–2035.
Why does Japan's biosimilar policy support container demand?
Japan's biosimilar policy supports demand for high-grade containers, because more domestic biologics output needs qualified vials for each new product. The Ministry of Health, Labour and Welfare aims for biosimilars to exceed 80% of prescriptions for at least 60% of eligible ingredients by the end of fiscal 2029. Alfresa Holdings, Kidswell Bio and Chiome Bioscience agreed on Oct. 6, 2025, to develop biosimilars together after a ministry subsidy selection in May 2025. The partners then signed a joint venture agreement in November 2025 with Mycenax Biotech of Taiwan for local drug substance and drug product output. In turn, Japan holds 16.0% of 2025 value, the third-largest country share in the region.
Local capacity, coated vials and cartridges reshape supply
How is the shift to local capacity in China changing supply?
The shift to local capacity in China is changing supply, because foreign converters now build plants close to Chinese injectable makers. Gerresheimer and Shuangfeng Glass started a new vial and ampoule plant in Zhenjiang in July 2026, with a building of about 40,000 square meters. The venture doubles Gerresheimer's injectable primary packaging capacity across China. SCHOTT's Jinyun tubing plant in Zhejiang opened in June 2021 with initial capacity of 20,000 metric tons of Type I borosilicate glass, while its Suzhou plant makes more than 100 million vials and ampoules a year. As a result, China keeps the largest country share, because buyers can source most container types from local plants.
Why is the rise of cartridges and coated vials notable?
The rise of cartridges and coated vials is notable, because new injectables need containers that suit pens, autoinjectors and fast filling lines. Nipro began making dental and pen cartridges at its Pune plant in July 2025 to meet growing demand for these formats across Asia. SCHOTT's new Jambusar tubing serves syringes and cartridges for GLP-1 drugs such as semaglutide. Corning's Velocity vials also retain 90% of their strength and cut crack generation threefold, which helps drug makers run high-speed filling lines with fewer stoppages. In turn, ampoules lose share slowly, while tubular vials keep 48.0% of 2025 value, because buyers move toward precise borosilicate tubing formats.
Can India's biopharma program open new demand?
India's biopharma program can open new demand, because state support for biologics creates new filling lines that need qualified vials. The Union Budget 2026-27 announced Biopharma SHAKTI with Rs 10,000 crore over five years, three new pharmaceutical institutes and more than 1,000 accredited clinical trial sites. India's pharmaceutical exports also topped $30 billion in fiscal 2024-25, up more than 9% from about $27.5 billion, according to All India Radio. The United States took more than a third of those exports, which keeps Indian injectable makers focused on strict container quality. As a result, Indian contract drug producers add container demand across the country.
Is there room to grow as populations age?
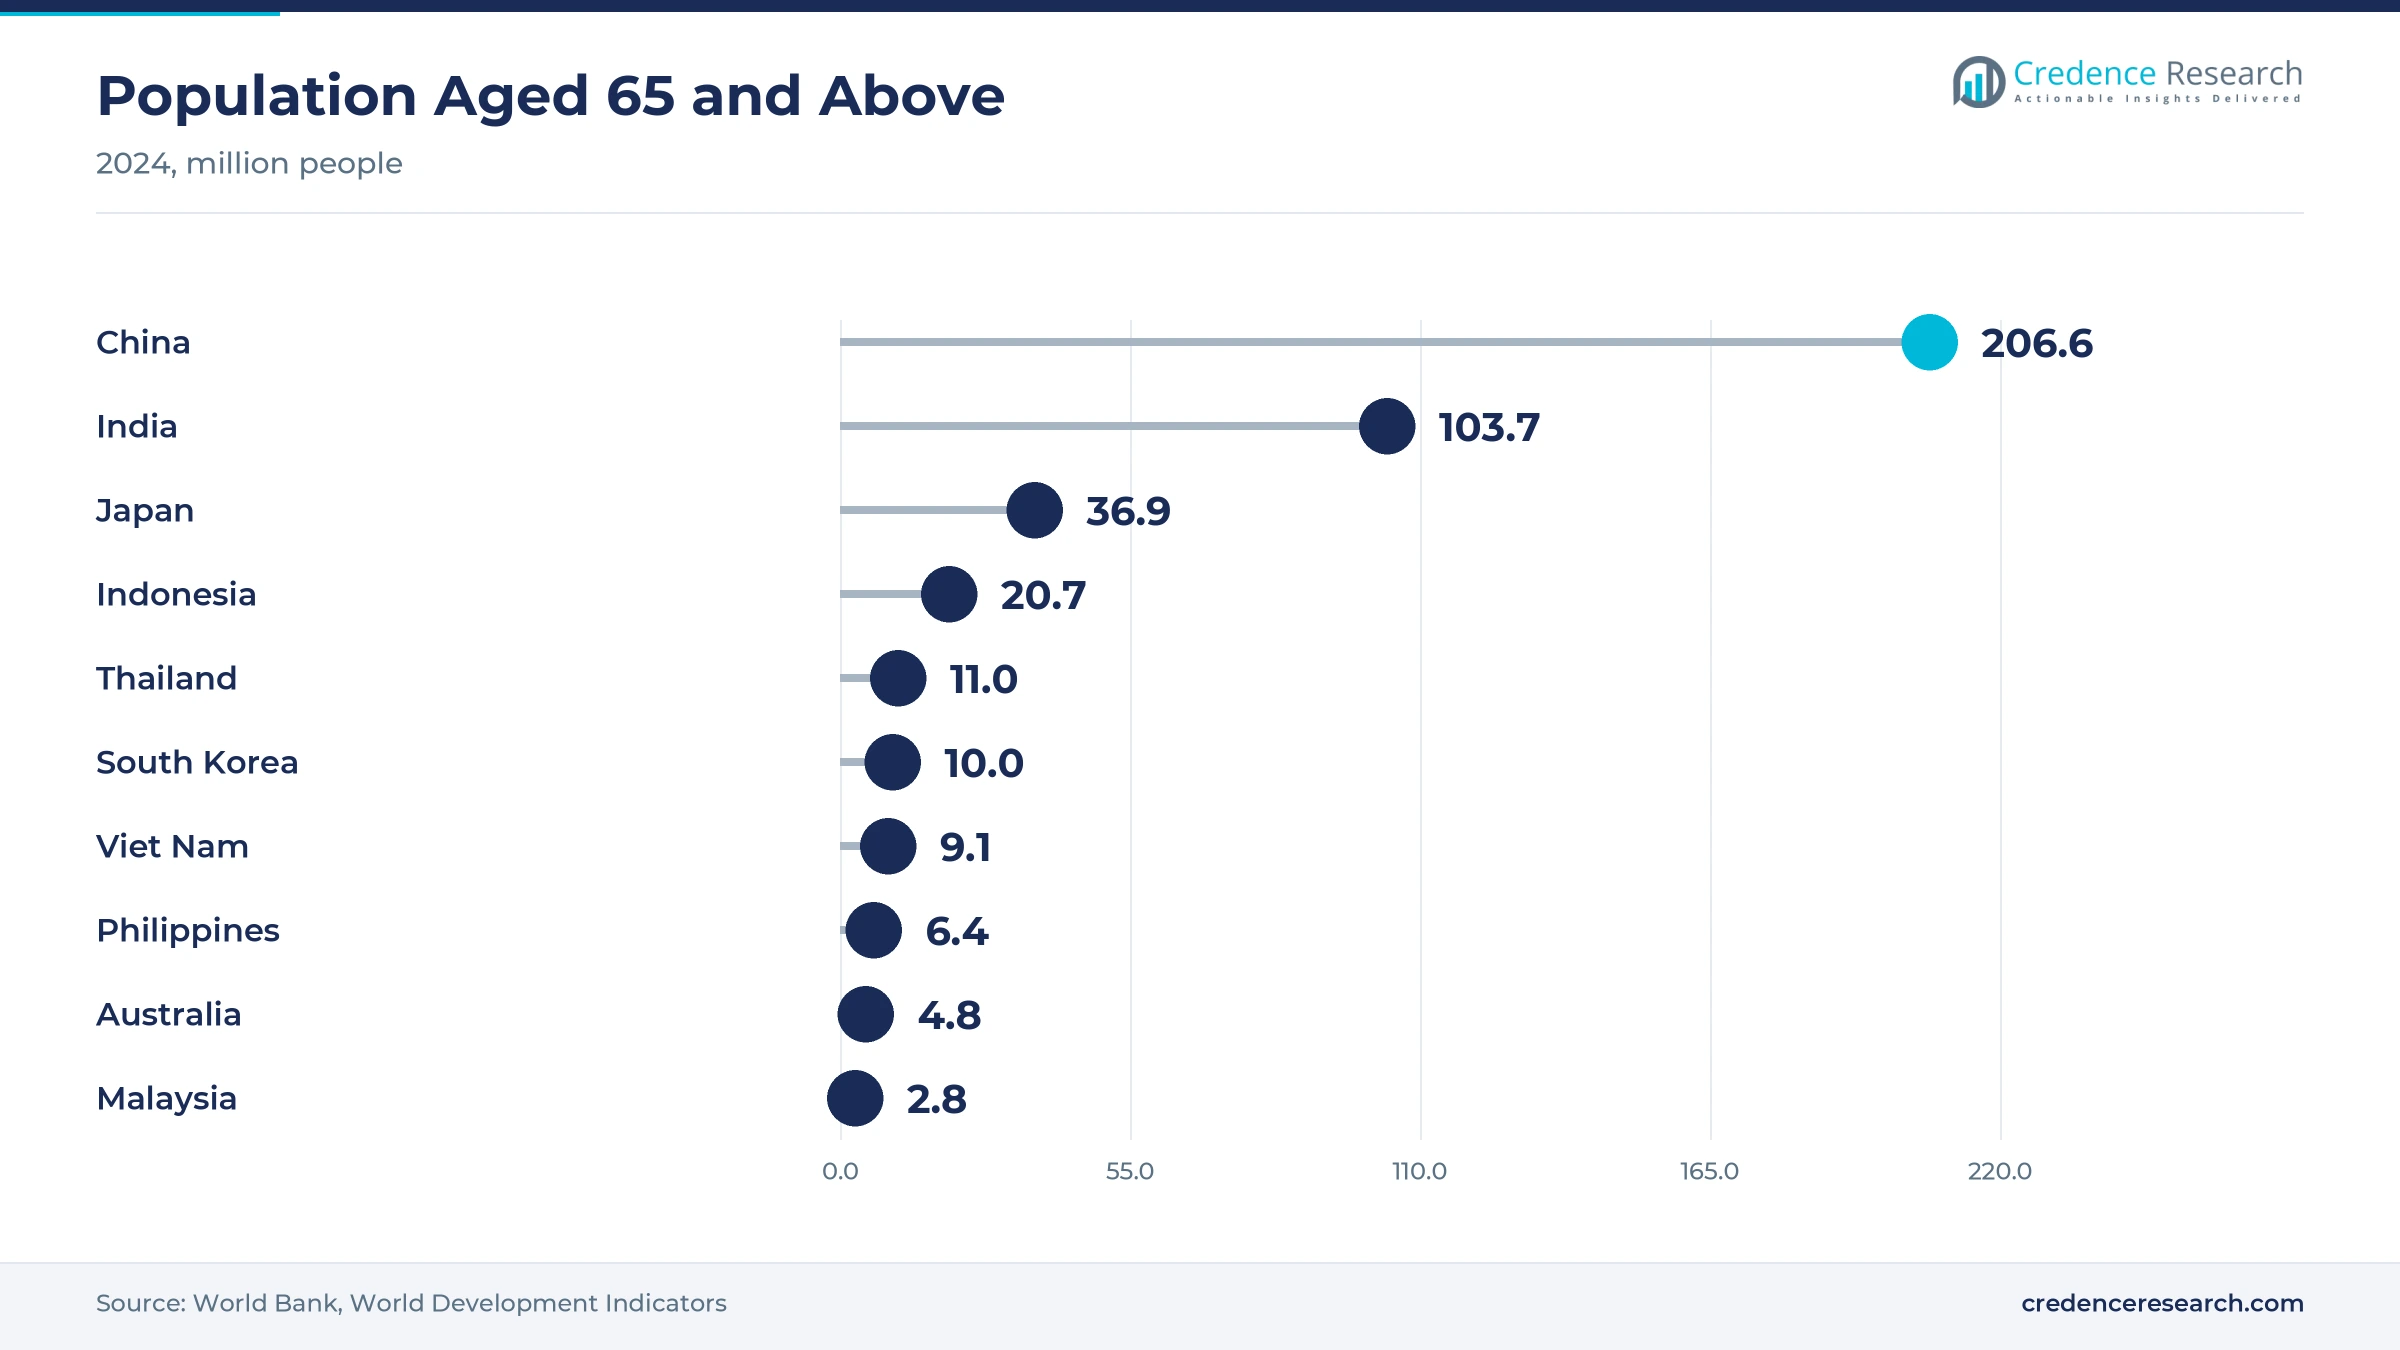
Aging populations offer room to grow, because older patients use more vaccines, biologics and hospital injectables each year. China had about 206.6 million people aged 65 and above in 2024, while India had 103.7 million and Japan had 36.9 million, according to the World Bank. Indonesia had 20.7 million older residents and Thailand had 11.0 million in the same year. These numbers point to rising demand for flu, pneumonia and shingles vaccines and for long-term biologic therapy in hospitals and clinics. In turn, the rest of Asia Pacific holds 22.0% of 2025 value, as regional biologics contract makers expand filling capacity.
Qualification time, furnace costs and plastics limit growth
How does long container qualification slow supplier changes?
Long container qualification slows supplier changes in every country, because each new vial needs stability, extractables and container closure tests before regulators accept it. As a result, drug makers keep existing suppliers for years, and new converters wait long periods before they win orders. Suppliers respond with shared data packages and standard dimensions, which shorten customer testing. This barrier favors established glassmakers that hold long approval records with major drug makers across the region.
Why do furnace energy costs pressure margins?
Furnace energy costs pressure margins, because glass melting runs around the clock and uses large amounts of gas and electricity. In turn, converters face higher costs when fuel prices rise, while drug makers resist price increases on long contracts. Companies respond with efficient furnaces, electric boosting and heat recovery, which cut energy use per ton of glass. This pressure weighs most on smaller glassmakers that still run older furnaces with weaker heat recovery and higher fuel use per ton of glass.
How do plastic containers and syringes limit glass demand?
Plastic containers and prefilled formats limit glass demand, because some drug makers move sensitive products into polymer vials or ready-filled devices. As a result, glass vials lose part of the volume for products that need break resistance or simpler dosing. Glassmakers respond with coated vials, stronger glass and their own syringe ranges, which keep customers in their portfolio. This shift affects ampoules and small vials the most, because these formats face the strongest competition from polymer and prefilled devices.
Why do quality failures carry high costs?
Quality failures carry high costs, because cracks, particles or delamination can force product recalls and supply gaps for patients. In turn, drug makers demand tighter inspection data and audit suppliers often, which raises compliance costs for converters. Companies respond with camera inspection, automated forming and zero-defect programs, which reduce defect rates. This burden favors suppliers that invest early in inspection technology, trained quality staff and traceable production records for every batch.
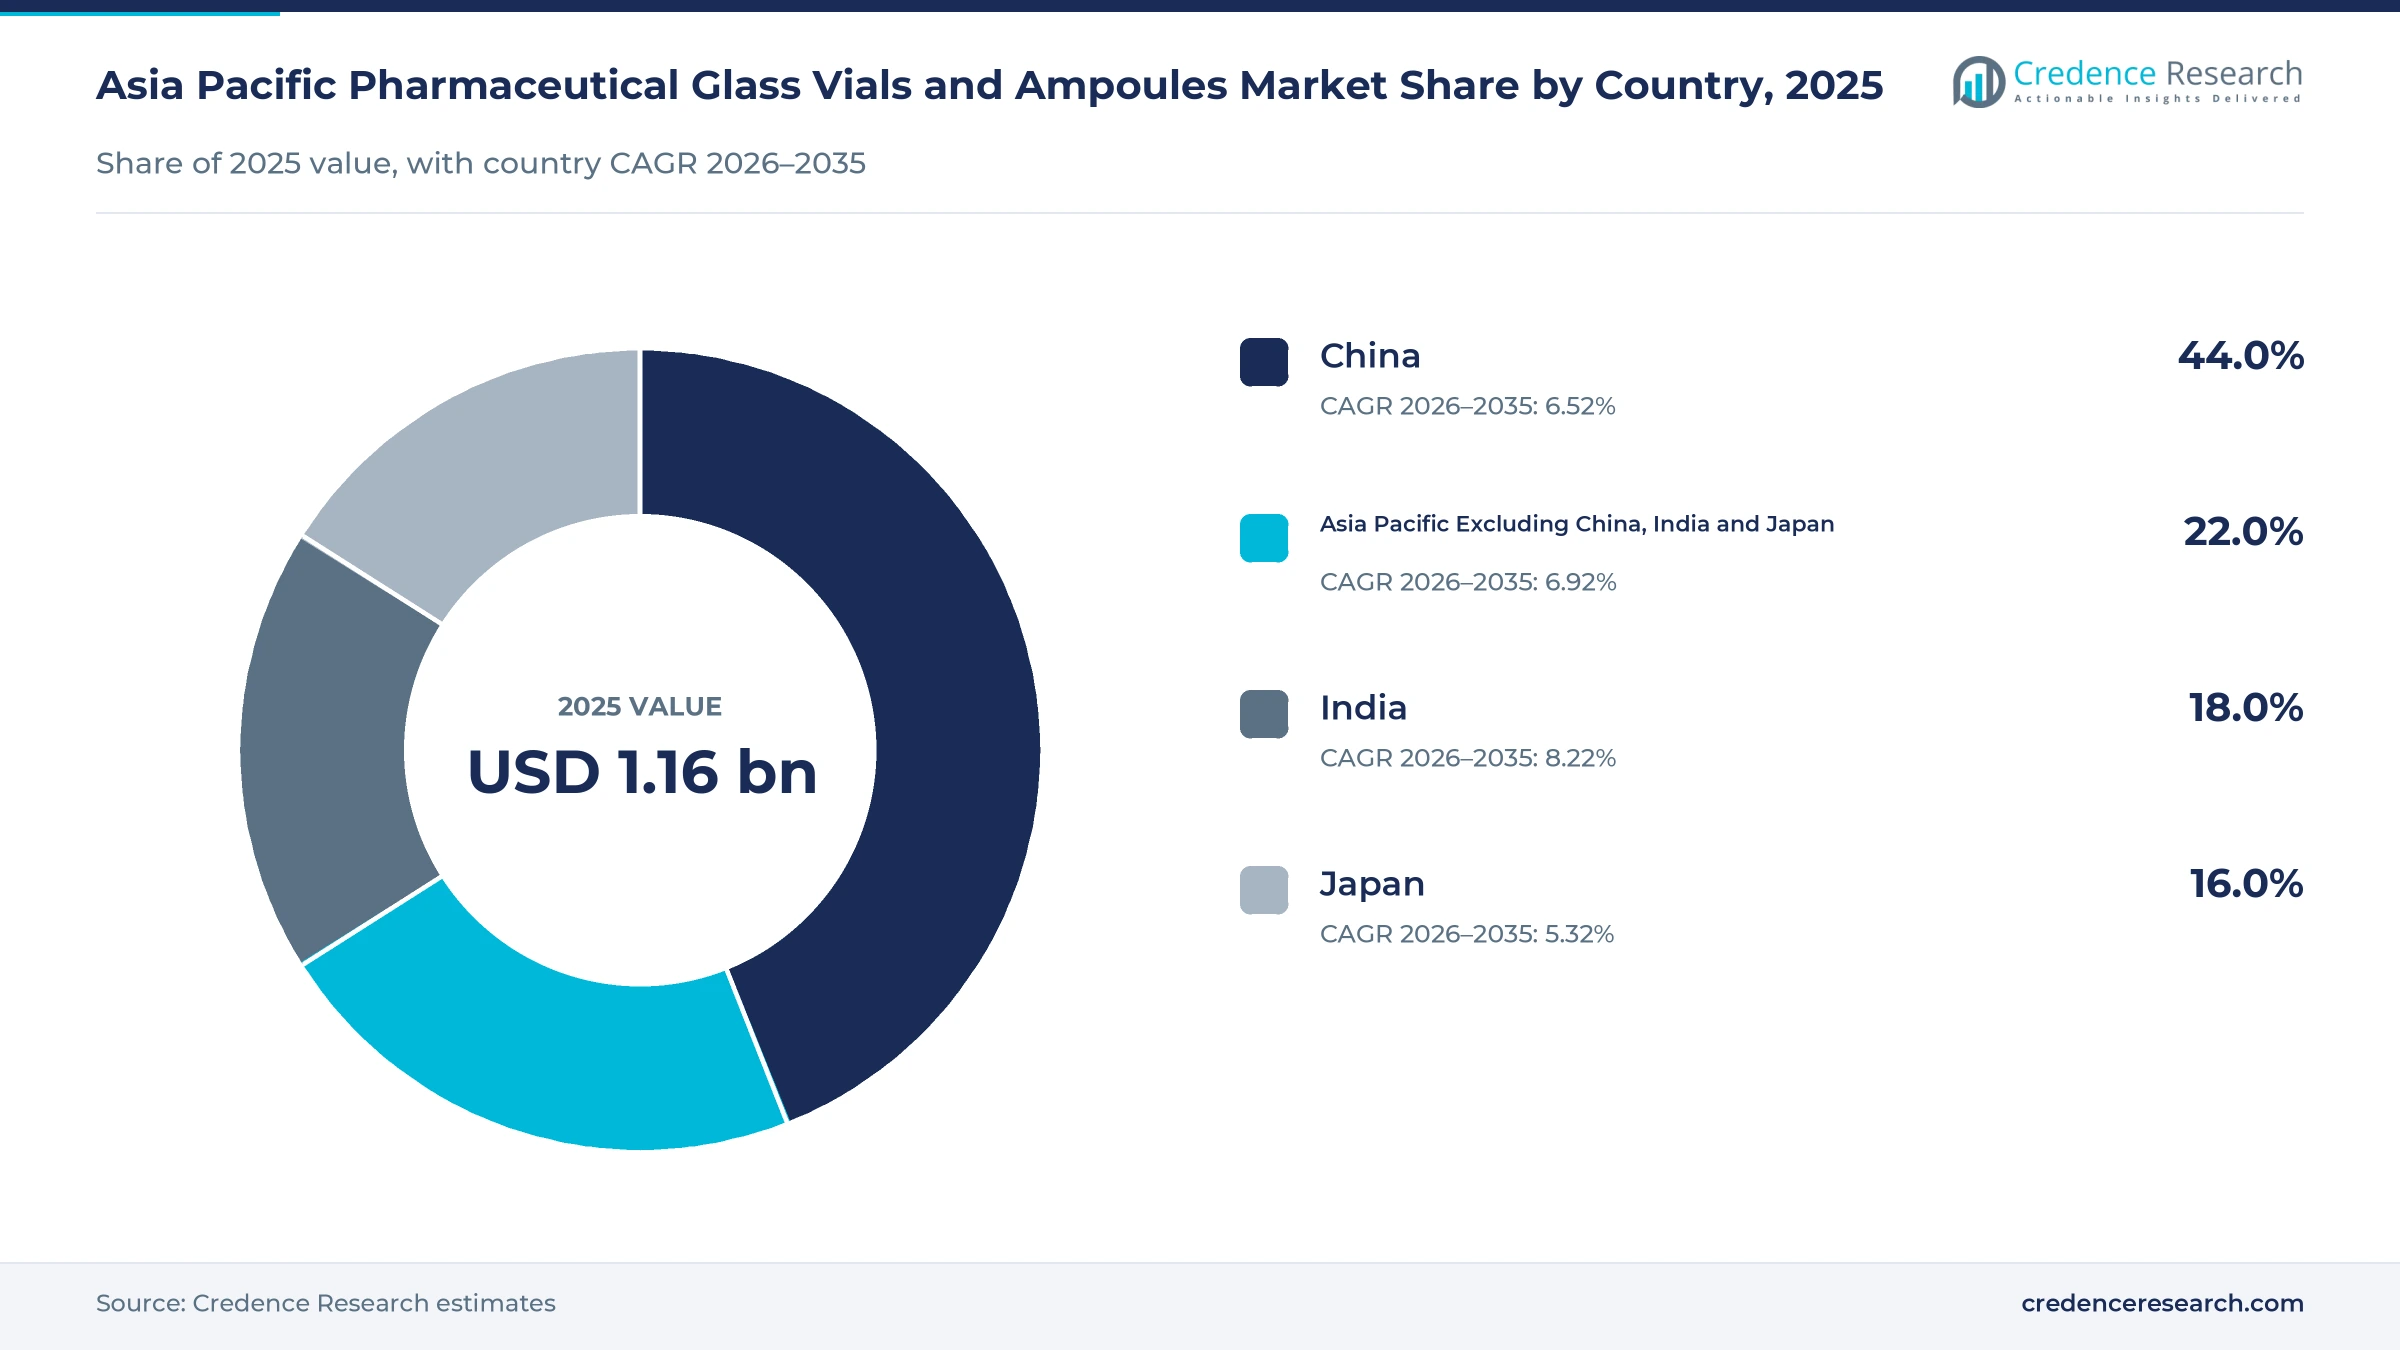
China leads while India adds the fastest growth
| Country | Value, 2025 (USD billion) | Share, 2025 | CAGR, 2026–2035 |
|---|---|---|---|
| China | 0.51 | 44.0% | 6.52% |
| Asia Pacific Excluding China, India and Japan | 0.26 | 22.0% | 6.92% |
| India | 0.21 | 18.0% | 8.22% |
| Japan | 0.19 | 16.0% | 5.32% |
Why does China hold the largest share?
China held a 44.0% share of 2025 value and grows at 6.52% a year, because its injectable drug makers fill large volumes of vials and ampoules for hospitals and clinics across the country. Shandong Pharmaceutical Glass sells to more than 1,000 drug makers in China and exports to over 65 countries. Gerresheimer also opened its Zhenjiang plant with Shuangfeng Glass in July 2026. As a result, China leads in both volume and local supply depth.
What makes India the fastest-growing country?
India held 18.0% of 2025 value and grows fastest at 8.22% a year, because local tubing and vial capacity is growing quickly. Corning and SGD Pharma inaugurated their Telangana tubing plant in September 2025, and SCHOTT Poonawalla runs three Indian plants. Nipro also expanded cartridge output at Pune in July 2025. In turn, Indian drug makers can buy more containers from domestic plants instead of imports.
How does Japan support high-grade demand?
Japan held a 16.0% share of 2025 value and grows at 5.32% a year, because its drug makers buy premium vials for biologics, vaccines and hospital injectables. The national biosimilar target for fiscal 2029 supports new domestic biologics output. Nipro also runs glass plants at Meerut and Pune in India, which serve customers across Asia. As a result, Japan remains a premium market with slower volume growth.
How does the rest of Asia Pacific contribute?
The rest of Asia Pacific held a 22.0% share of 2025 value and grows at 6.92% a year, because South Korea, Southeast Asia and Australia expand biologics and vaccine filling. Indonesia and Thailand also have large older populations that use more vaccines. In turn, this group adds steady demand for Type I vials from regional converters and importers.
Plant openings, investments and policies since 2024
| Development | Status and market relevance |
|---|---|
| In March 2024, SGD Pharma began Velocity vial production at its Vemula plant in Telangana, India. | Brings coated Type I vials to Indian filling lines |
| In May 2025, Novo Holdings invested in SCHOTT Poonawalla alongside TPG. | Backs the largest Indian injectable packaging maker |
| In August 2025, SCHOTT started syringe and cartridge tubing output at Jambusar, Gujarat. | Adds local high-precision tubing in India |
| In September 2025, Corning and SGD Pharma inaugurated their Type I glass tubing plant in Telangana. | Gives Indian converters a local tubing source |
| In July 2026, Gerresheimer and Shuangfeng Glass began operations at a vial and ampoule plant in Zhenjiang, China. | Doubles Gerresheimer's injectable packaging capacity in China |
Tubing, coatings and inspection systems raise quality
- Type I borosilicate tubing gives vials and ampoules high chemical resistance, which makes it the standard choice for vaccines, biologics and sensitive injectables.
- Coated glass surfaces reduce friction, particles and cracks on filling lines, as shown by Velocity vials that cut particulates by up to 96%.
- Automated camera inspection checks every container for cracks, bubbles and dimension errors, which helps converters meet zero-defect targets from drug makers.
- Nested and tray packaging delivers washed, sterilized containers ready for filling, which lets contract manufacturers skip in-house washing and depyrogenation.
Need a Custom Version of This Report?
Tailor the scope, geography, or segments to your exact requirements.
- Custom geography or segment scope
- Direct access to our analyst team
Global converters and Asian glassmakers compete on quality
Competition combines global converters with deep quality systems and Asian glassmakers with large domestic customer bases. SCHOTT Poonawalla competes in India with ampoules, vials, cartridges and prefilled syringes from three plants and more than 100 customers. SGD Pharma competes in molded and tubular vials from its Vemula site and now uses local tubing from its venture with Corning. Nipro competes with tubing, vials and cartridges from Meerut and Pune. Gerresheimer competes in China through its Zhenjiang venture with Shuangfeng Glass. Shandong Pharmaceutical Glass competes in molded vials and vaccine vials across China and export markets. Rivals compete on glass quality, defect rates, ready-to-use formats, delivery times and price, which keeps qualification data and local capacity central to winning contracts.
Which suppliers serve Asia Pacific drug makers?
| Company | Type | Role in the market |
|---|---|---|
| SCHOTT Poonawalla | Indian converter | Runs three Indian plants with capacity above 3 billion units a year |
| SGD Pharma | Global glassmaker | Makes Velocity vials at Vemula and Type I tubing with Corning |
| Nipro | Japanese glass and device maker | Upgraded its Meerut furnace and added Pune cartridge lines |
| Gerresheimer | Global converter | Opened a vial and ampoule plant in Zhenjiang in 2026 |
| Shandong Pharmaceutical Glass | Chinese glassmaker | Supplies molded and vaccine vials to more than 1,000 drug makers |
Credence Research view on Asian injectable packaging
Credence Research's view is that Asia Pacific glass vial and ampoule sales will grow steadily because biologics, vaccines and generic injectables keep adding filling capacity in India, China and Japan. Tubular vials and Type I glass remain the largest value pools, while ready-to-use formats and non-vaccine biologics add the fastest growth. Local tubing plants in India and new converter plants in China reduce import needs and lead times. Suppliers that pair local capacity with strong inspection data should gain the most, because drug makers rarely change a qualified container.
How the regional container estimate was built
The report uses 2025 as the base year on a calendar basis, and market values come from the Credence Research model. That model combines international agency statistics on population and aging, government data on pharmaceutical exports and policy, and company releases on plants, capacity and investments. Country shares, segment splits and growth rates are Credence Research estimates from public data, because the client list named the countries without shares. Sources used are international agency data, government releases, trade press and company releases, and no interviews or surveys were used.
Biologics and ready-to-use formats carry growth to 2035
The Asia Pacific pharmaceutical glass vials and ampoules market is expected to reach USD 2.25 billion by 2035, a 6.75% CAGR during 2026–2035, as drug makers add injectable, vaccine and biologics capacity across the region. Growth should be strongest in India, ready-to-use formats and non-vaccine biologics, because these areas gain most from new plants and policy support. Long qualification times, furnace energy costs and plastic alternatives could slow growth in some products, while local tubing supply should ease costs for converters.
Frequently Asked Questions
How big is the Asia Pacific pharmaceutical glass vials and ampoules market?
Which product type leads the market?
Which country leads the market?
What did Corning and SGD Pharma build in India?
Why is Type I glass so important?
Which supply format grows fastest?
Who are the leading companies in this market?
What are the main challenges for container suppliers?
Table of Content
Chapter 1 Market Segmentation
- 1.1 Segmentation Framework
- 1.1.1 Product and Service Classification
- 1.1.2 Application and End-Use Classification
- 1.1.3 Technology and Solution Classification
- 1.1.4 Customer and Distribution Channel Classification
- 1.1.5 Geographic Segmentation
- 1.1.6 Market Segment Definitions and Boundaries
- 1.2 By Product Type
- 1.2.1 Tubular Vials
- 1.2.2 Molded Vials
- 1.2.3 Ampoules
- 1.3 By Glass Performance
- 1.3.1 Type I Glass
- 1.3.2 Type II Glass
- 1.3.3 Type III Glass
- 1.4 By Application
- 1.4.1 Small-Molecule Injectables
- 1.4.2 Vaccines
- 1.4.3 Non-Vaccine Biologics
- 1.4.4 Other Pharmaceutical Preparations
- 1.5 By Supply Format
- 1.5.1 Bulk Nonsterile
- 1.5.2 Bulk Sterile
- 1.5.3 Ready-to-Use
- 1.6 By Country
- 1.6.1 China
- 1.6.2 India
- 1.6.3 Japan
- 1.6.4 Asia Pacific Excluding China, India and Japan
Chapter 2 Introduction
- 2.1 Report Objectives and Scope
- 2.2 Product Definition and Industry Terminology
- 2.3 Market Inclusions and Exclusions
- 2.4 Research Process
- 2.4.1 Primary Research and Expert Interviews
- 2.4.2 Secondary Research and Source Review
- 2.4.3 Top-Down and Bottom-Up Estimation
- 2.4.4 Data Triangulation and Verification
- 2.5 Market Size Measurement Basis
- 2.5.1 2025: USD 1.16 billion → 2035: USD 2.25 billion
- 2.6 Historical and Forecast Reference Periods
- 2.6.1 Historical Period: 2018-2025
- 2.6.2 Base Year: 2025
- 2.6.3 Forecast Period: 2025-2035
- 2.7 Research Assumptions and Limitations
Chapter 3 Executive Summary
- 3.1 Market Snapshot and Key Findings
- 3.2 Base-Year Market Size, 2025
- 3.3 Forecast Market Size, 2035
- 3.4 Revenue and Volume Growth Outlook
- 3.5 Key Demand and Supply Indicators
- 3.6 Leading Market Segments
- 3.7 Fastest-Growing Market Opportunities
- 3.8 Regional Performance Highlights
- 3.9 Technology and Industry Transformation
- 3.10 Competitive Landscape Summary
- 3.11 Analyst View and Strategic Implications
Chapter 4 Asia Pacific Pharmaceutical Glass Vials and Ampoules Market Trends and Developments
- 4.1 Historical Industry Development, 2018-2025
- 4.2 Recent Market Trends and Developments
- 4.3 Demand and Customer Behavior Trends
- 4.4 Technology and Product Innovation
- 4.5 Artificial Intelligence, Automation and Digitalization
- 4.6 Local Manufacturing and Supply Chain Realignment
- 4.7 Industry Partnerships, Mergers and Acquisitions
- 4.8 Sustainability and Circular Economy Developments
- 4.9 Government and Private Sector Investment Trends
- 4.10 Emerging Business Models and Commercialization
- 4.11 Industry Developments and Announcements
Chapter 5 Asia Pacific Pharmaceutical Glass Vials and Ampoules Market Production, Supply and Demand Analysis
- 5.1 Demand Trend and Consumption Analysis, 2018-2025
- 5.2 Demand Forecast, 2025-2035
- 5.3 Production and Output Trend, 2018-2025
- 5.4 Production and Output Forecast, 2025-2035
- 5.5 Installed Capacity and Capacity Utilization
- 5.6 Company-Wise Production Plants and Statistics
- 5.6.1 Installed Production Capacity
- 5.6.2 Actual Production
- 5.6.3 Planned Capacity and Expansion Targets
- 5.7 Supply Chain Structure and Procurement Trends
- 5.8 Supply-Demand Gap and Bottlenecks
- 5.9 Import Dependence and Sourcing Structure
- 5.10 Contract Manufacturing and Outsourcing
- 5.11 Regional Supply and Demand Concentration
Chapter 6 Asia Pacific Pharmaceutical Glass Vials and Ampoules Market Pricing Analysis
- 6.1 Pricing Structure and Measurement
- 6.2 Historical Pricing Trends, 2018-2025
- 6.3 Pricing Outlook, 2025-2035
- 6.4 Average Selling Price and Unit Economics
- 6.5 Pricing by Product and Market Segment
- 6.6 Geographic Pricing Differences
- 6.7 Key Input, Energy, Labor and Logistics Costs
- 6.8 Contract Pricing and Purchasing Models
- 6.9 Pricing Sensitivity and Competitive Positioning
- 6.10 Price, Margin and Profitability Implications
Chapter 7 Asia Pacific Pharmaceutical Glass Vials and Ampoules Market Dynamics
- 7.1 Market Growth Drivers
- 7.1.1 Demand-Side Drivers
- 7.1.2 Technology and Innovation Drivers
- 7.1.3 Infrastructure and Investment Drivers
- 7.1.4 Regulatory and Policy Drivers
- 7.2 Market Restraints
- 7.2.1 Cost and Affordability Constraints
- 7.2.2 Technology and Adoption Barriers
- 7.2.3 Supply Chain and Operational Constraints
- 7.3 Market Challenges
- 7.3.1 Competitive Pressure and Margin Erosion
- 7.3.2 Skills, Infrastructure and Implementation Gaps
- 7.4 Emerging Market Opportunities
- 7.5 Market Dynamics Impact and Time-Horizon Assessment
Chapter 8 Asia Pacific Pharmaceutical Glass Vials and Ampoules Value Chain Analysis
- 8.1 Industry Value Chain Overview
- 8.2 Upstream Suppliers and Critical Inputs
- 8.3 Technology and Component Providers
- 8.4 Manufacturing or Service Delivery
- 8.5 Distribution, Channel Partners and Integrators
- 8.6 Downstream Applications and End Users
- 8.7 Value Addition and Profit Pools
- 8.8 Vertical Integration and Outsourcing
- 8.9 Supplier Concentration and Risk
- 8.10 Supply Chain Localization and Resilience
Chapter 9 Asia Pacific Pharmaceutical Glass Vials and Ampoules Market Regulations and Policies
- 9.1 Relevant Laws, Standards and Compliance Frameworks
- 9.2 Product, Service, Safety and Quality Requirements
- 9.3 Government Policies, Incentives and Subsidies
- 9.4 Imports, Exports and Trade Barriers
- 9.5 Public Procurement and Local Content Requirements
- 9.6 Environmental and Sustainability Compliance
- 9.7 Upcoming Policy Changes and Market Implications
Chapter 10 Asia Pacific Pharmaceutical Glass Vials and Ampoules Market Hotspots and Opportunities
- 10.1 Market Opportunity Mapping and Growth Hotspots
- 10.2 High-Growth Applications and Customer Groups
- 10.3 Underserved Markets and White-Space Opportunities
- 10.4 Emerging Technology and Product Opportunities
- 10.5 New Capacity and Investment Hotspots
- 10.6 Market Entry and Expansion Opportunities
- 10.7 Distribution and Partnership Opportunities
- 10.8 Near-Term and Long-Term Commercial Potential
- 10.9 Opportunity Attractiveness and Execution Risks
Chapter 11 Asia Pacific Pharmaceutical Glass Vials and Ampoules Market Outlook, 2025-2035
- 11.1 Market Size and Analysis
- 11.1.1 Revenue (Market Measurement: 2025: USD 1.16 billion → 2035: USD 2.25 billion)
- 11.1.2 Market Volume and Quantity Sold
- 11.1.3 Historical Market Size, 2018-2025
- 11.1.4 Base-Year Market Size, 2025
- 11.2 Market Forecast, 2025-2035
- 11.2.1 Revenue Forecast to 2035
- 11.2.2 Volume Forecast to 2035
- 11.2.3 CAGR and Year-on-Year Growth
- 11.2.4 Incremental Revenue Opportunity
- 11.3 Forecast Assumptions and Scenario Analysis
- 11.3.1 Base-Case Forecast
- 11.3.2 Optimistic and Conservative Scenarios
- 11.3.3 Technology, Pricing and Policy Sensitivities
- 11.4 Market Attractiveness and Growth Outlook
Chapter 12 Asia Pacific Pharmaceutical Glass Vials and Ampoules Market Segmentation and Outlook
- 12.1 Segmentation Summary and Market Shares, 2025
- 12.2 Largest and Fastest-Growing Segments
- 12.3 By Product Type - Market Size and Forecast, 2025-2035
- 12.3.1 Segment Definition and Scope
- 12.3.2 Historical Market Size, 2018-2025
- 12.3.3 Revenue Forecast, 2025-2035
- 12.3.4 Volume Forecast, 2025-2035
- 12.3.5 Base-Year Market Share, 2025
- 12.3.6 Segment CAGR and Growth Drivers
- 12.3.7 Subsegment Market Size and Forecast
- 12.3.7.1 Tubular Vials
- 12.3.7.2 Molded Vials
- 12.3.7.3 Ampoules
- 12.3.8 Subsegment Pricing and Adoption Trends
- 12.3.9 Leading Suppliers and Competition
- 12.3.10 Regional Demand and Opportunities
- 12.4 By Glass Performance - Market Size and Forecast, 2025-2035
- 12.4.1 Segment Definition and Scope
- 12.4.2 Historical Market Size, 2018-2025
- 12.4.3 Revenue Forecast, 2025-2035
- 12.4.4 Volume Forecast, 2025-2035
- 12.4.5 Base-Year Market Share, 2025
- 12.4.6 Segment CAGR and Growth Drivers
- 12.4.7 Subsegment Market Size and Forecast
- 12.4.7.1 Type I Glass
- 12.4.7.2 Type II Glass
- 12.4.7.3 Type III Glass
- 12.4.8 Subsegment Pricing and Adoption Trends
- 12.4.9 Leading Suppliers and Competition
- 12.4.10 Regional Demand and Opportunities
- 12.5 By Application - Market Size and Forecast, 2025-2035
- 12.5.1 Segment Definition and Scope
- 12.5.2 Historical Market Size, 2018-2025
- 12.5.3 Revenue Forecast, 2025-2035
- 12.5.4 Volume Forecast, 2025-2035
- 12.5.5 Base-Year Market Share, 2025
- 12.5.6 Segment CAGR and Growth Drivers
- 12.5.7 Subsegment Market Size and Forecast
- 12.5.7.1 Small-Molecule Injectables
- 12.5.7.2 Vaccines
- 12.5.7.3 Non-Vaccine Biologics
- 12.5.7.4 Other Pharmaceutical Preparations
- 12.5.8 Subsegment Pricing and Adoption Trends
- 12.5.9 Leading Suppliers and Competition
- 12.5.10 Regional Demand and Opportunities
- 12.6 By Supply Format - Market Size and Forecast, 2025-2035
- 12.6.1 Segment Definition and Scope
- 12.6.2 Historical Market Size, 2018-2025
- 12.6.3 Revenue Forecast, 2025-2035
- 12.6.4 Volume Forecast, 2025-2035
- 12.6.5 Base-Year Market Share, 2025
- 12.6.6 Segment CAGR and Growth Drivers
- 12.6.7 Subsegment Market Size and Forecast
- 12.6.7.1 Bulk Nonsterile
- 12.6.7.2 Bulk Sterile
- 12.6.7.3 Ready-to-Use
- 12.6.8 Subsegment Pricing and Adoption Trends
- 12.6.9 Leading Suppliers and Competition
- 12.6.10 Regional Demand and Opportunities
- 12.7 By Country - Market Size and Forecast, 2025-2035
- 12.7.1 Segment Definition and Scope
- 12.7.2 Historical Market Size, 2018-2025
- 12.7.3 Revenue Forecast, 2025-2035
- 12.7.4 Volume Forecast, 2025-2035
- 12.7.5 Base-Year Market Share, 2025
- 12.7.6 Segment CAGR and Growth Drivers
- 12.7.7 Subsegment Market Size and Forecast
- 12.7.7.1 China
- 12.7.7.2 India
- 12.7.7.3 Japan
- 12.7.7.4 Asia Pacific Excluding China, India and Japan
- 12.7.8 Subsegment Pricing and Adoption Trends
- 12.7.9 Leading Suppliers and Competition
- 12.7.10 Regional Demand and Opportunities
- 12.8 Segment Growth Comparison
- 12.9 Segment Attractiveness and Priority Matrix
Chapter 13 Asia Pacific Pharmaceutical Glass Vials and Ampoules End-Use and Application Market Outlook
- 13.1 End-Use Industry and Customer Demand Structure
- 13.2 Leading Applications and Customer Groups
- 13.3 End-Use Market Size, Share and Forecast
- 13.4 Major End-Use Industry Deep Dives
- 13.4.1 Customer Requirements and Use Cases
- 13.4.2 Demand and Replacement Cycles
- 13.4.3 Technical and Regulatory Considerations
- 13.4.4 Purchasing and Procurement Models
- 13.4.5 Leading Vendors and Distribution Channels
- 13.4.6 Forecast and Commercial Opportunities
- 13.5 Emerging Applications and Cross-Segment Demand
- 13.6 End-Use Industry Investment Priorities
Chapter 14 Asia Pacific Pharmaceutical Glass Vials and Ampoules Geographic Market Outlook, 2025-2035
- 14.1 Regional Market Size and Country-Level Shares, 2025
- 14.2 Country Market Size Comparison, 2025
- 14.3 Country Market Forecasts, 2025-2035
- 14.4 Subregional Industrial and Demand Clusters
- 14.5 Intra-Regional Pricing and Cost Differences
- 14.6 Cross-Border Trade and Supply Networks
- 14.7 Regional Supply and Demand Balances
- 14.8 Country Opportunity Comparison and Prioritization
Note: Every listed country is covered on the structure shown under the first country.
Chapter 15 Asia Pacific Pharmaceutical Glass Vials and Ampoules Technology, Innovation and Sustainability Outlook
- 15.1 Technology Landscape and Maturity
- 15.2 Product, Process and Service Innovation
- 15.3 AI, Automation and Digital Tools in the Industry
- 15.4 Technology Adoption and Performance Benchmarking
- 15.5 Innovation Pipeline and R&D Investment
- 15.6 Patent and Intellectual Property Trends
- 15.7 Energy Efficiency and Resource Management
- 15.8 Sustainability, Recycling and Circularity
- 15.9 Technology Roadmap, 2025-2035
- 15.10 Risks of Obsolescence and Technology Substitution
Chapter 16 Asia Pacific Pharmaceutical Glass Vials and Ampoules Market Key Strategic Imperatives
- 16.1 Growth and Market Entry Priorities
- 16.2 High-Return Products and Segments
- 16.3 Pricing, Profitability and Cost Optimization
- 16.4 Technology Investment and Product Differentiation
- 16.5 Supply Chain Localization and Resilience
- 16.6 Distribution and Customer Acquisition
- 16.7 Partnership, Acquisition and Capacity Strategy
- 16.8 Regional Expansion Priorities
- 16.9 Short-, Medium- and Long-Term Actions
Chapter 17 Competition Outlook
- 17.1 Industry Competition Characteristics
- 17.2 Market Structure and Concentration
- 17.3 Market Share and Competitive Positioning, 2025
- 17.4 Company-Wise Revenue and Product Benchmarking
- 17.5 Production and Service Capacity Benchmarking
- 17.6 Technology, Pricing and Differentiation
- 17.7 Regional Footprint and Distribution Strength
- 17.8 Mergers, Acquisitions and Strategic Alliances
- 17.9 New Entrants and Competitive Threats
- 17.10 Porter's Five Forces and Industry Attractiveness
- 17.11 Competitive Outlook, 2025-2035
Chapter 18 Company Profiles
- 18.1 Company Coverage and Selection Criteria
- 18.2 Shandong Pharmaceutical Glass
- 18.2.1 Business Description
- 18.2.2 Company Ownership and Geographic Presence
- 18.2.3 Product and Service Portfolio
- 18.2.4 Manufacturing and Operating Footprint
- 18.2.5 Production Capacity and Expansion Plans
- 18.2.6 Financial Performance and Investment
- 18.2.7 Market Share and Competitive Position
- 18.2.8 Technology and Innovation Capabilities
- 18.2.9 Strategic Alliances or Partnerships
- 18.2.10 Recent Developments
- 18.2.11 Growth Strategy and Outlook
- 18.3 Nipro
- 18.4 SGD Pharma
- 18.5 Gerresheimer
- 18.6 SCHOTT Poonawalla
- 18.7 Other Relevant Market Participants
Note: Every listed company is profiled on the structure shown under the first company. The company list is preliminary and may change based on research findings, market developments, data availability and client requirements.
Chapter 19 Disclaimer
- 19.1 Research and Forecast Disclaimer
- 19.2 Data Source and Estimation Limitations
Note: The depth of individual sections depends on data availability for this market. Volume, capacity, trade and other unit-based metrics are included where applicable.

