
Pallet wrap, farm covers and site films keep demand rising
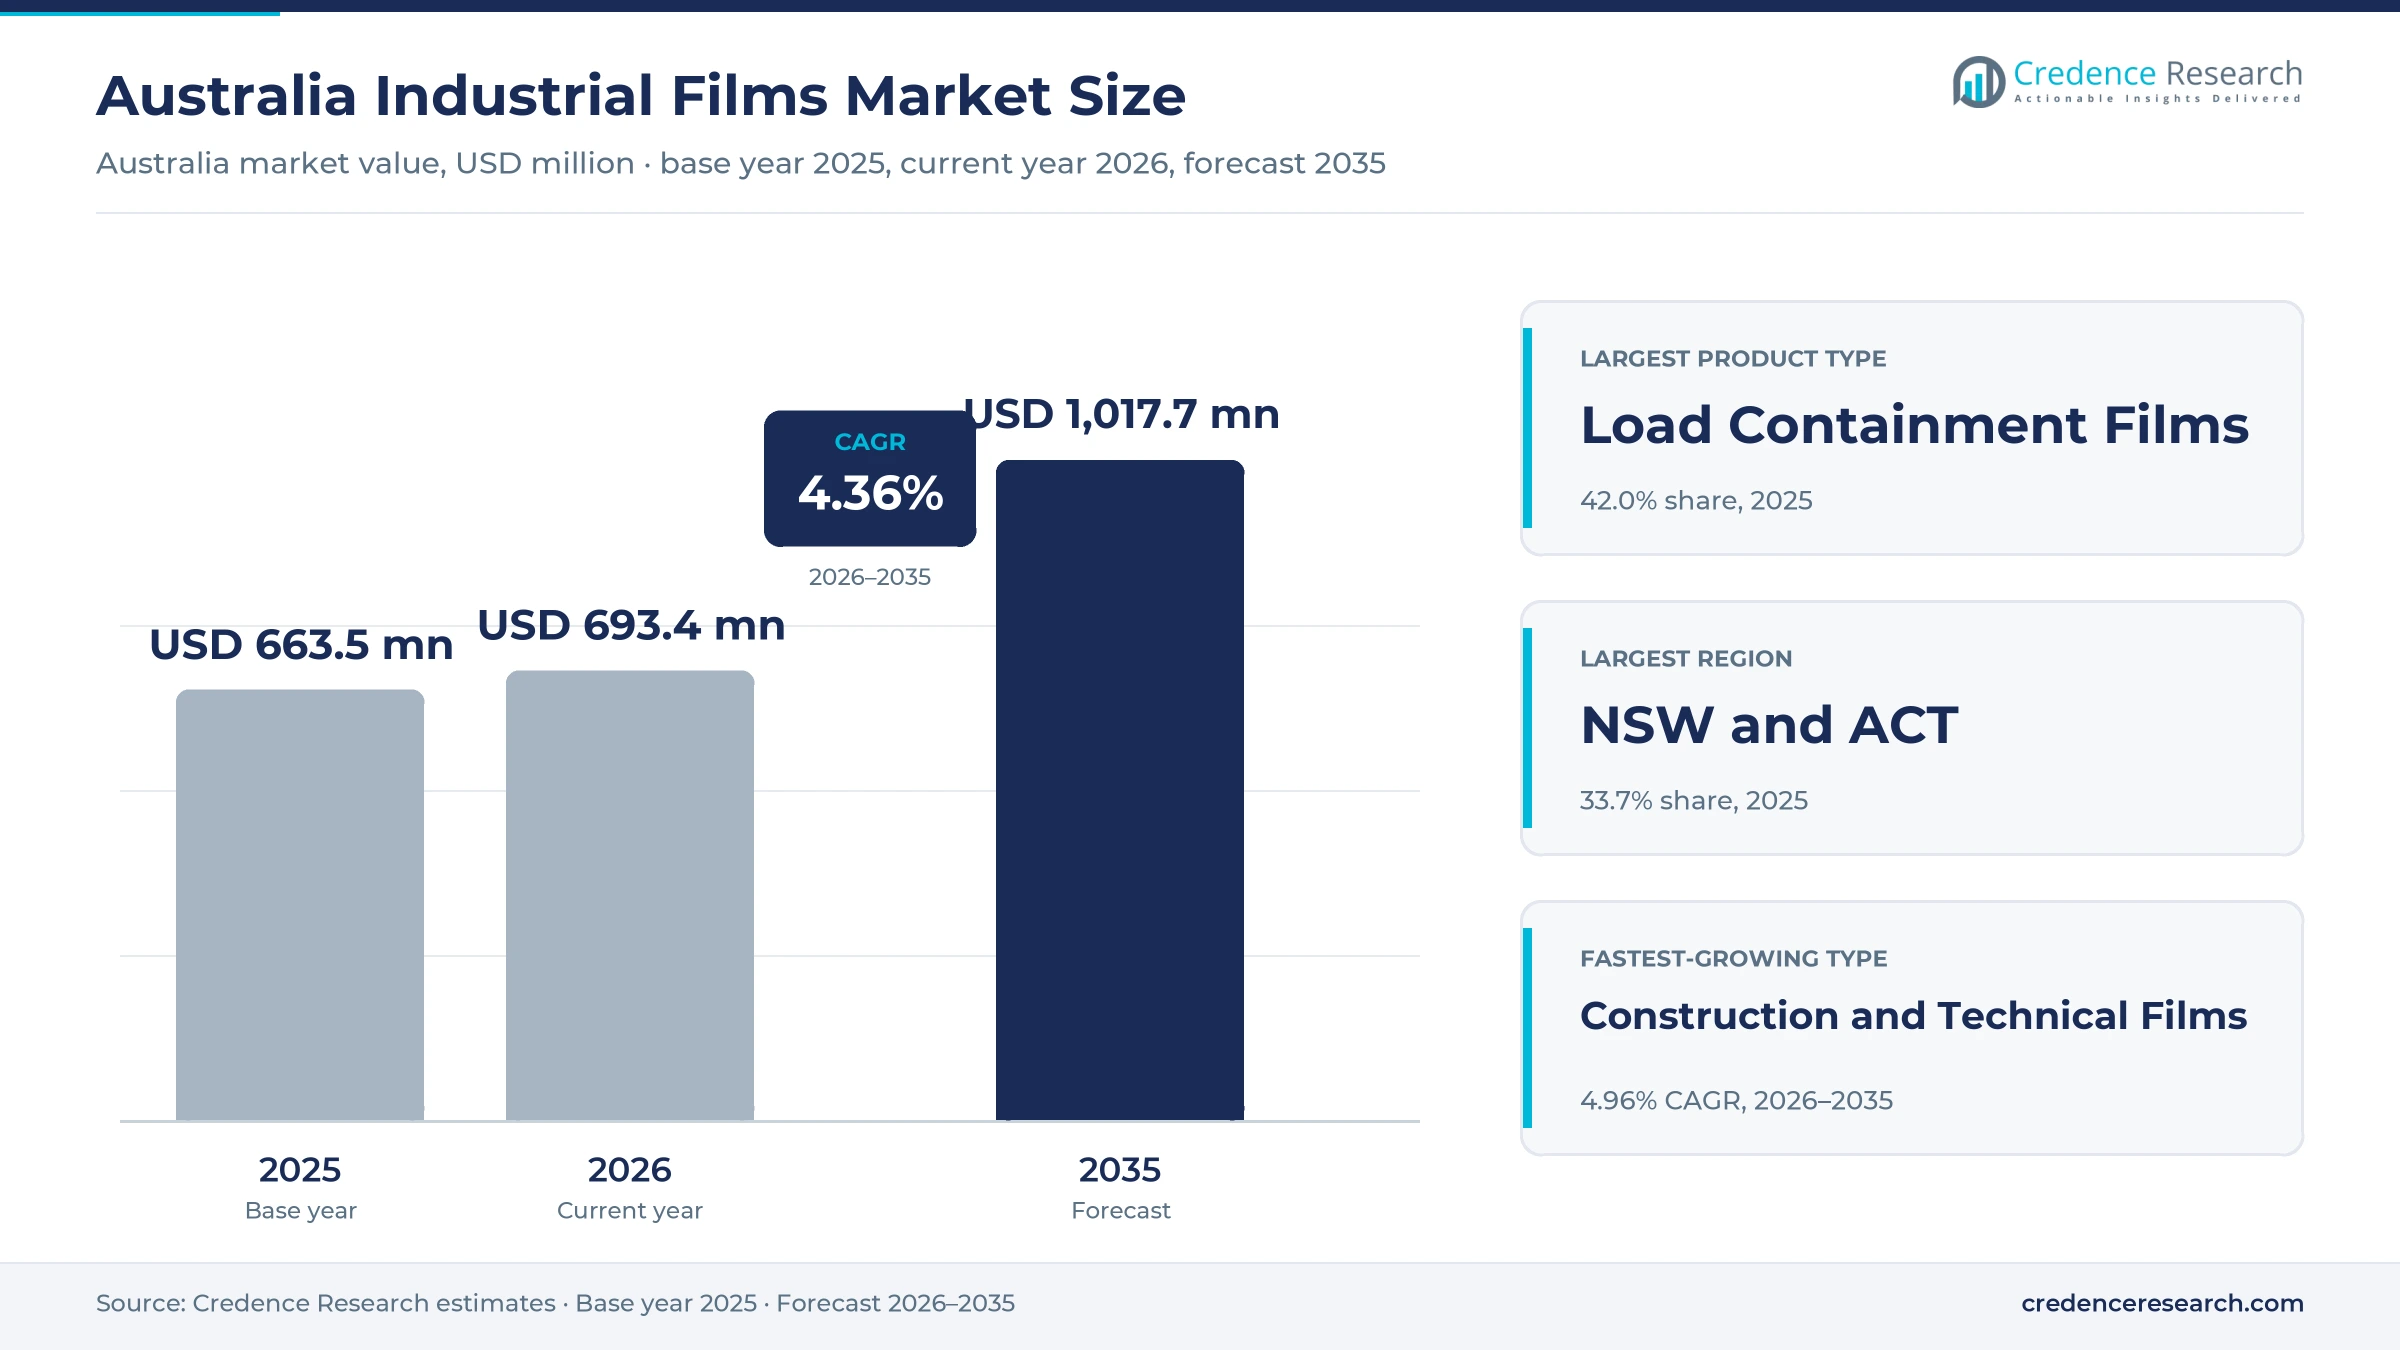
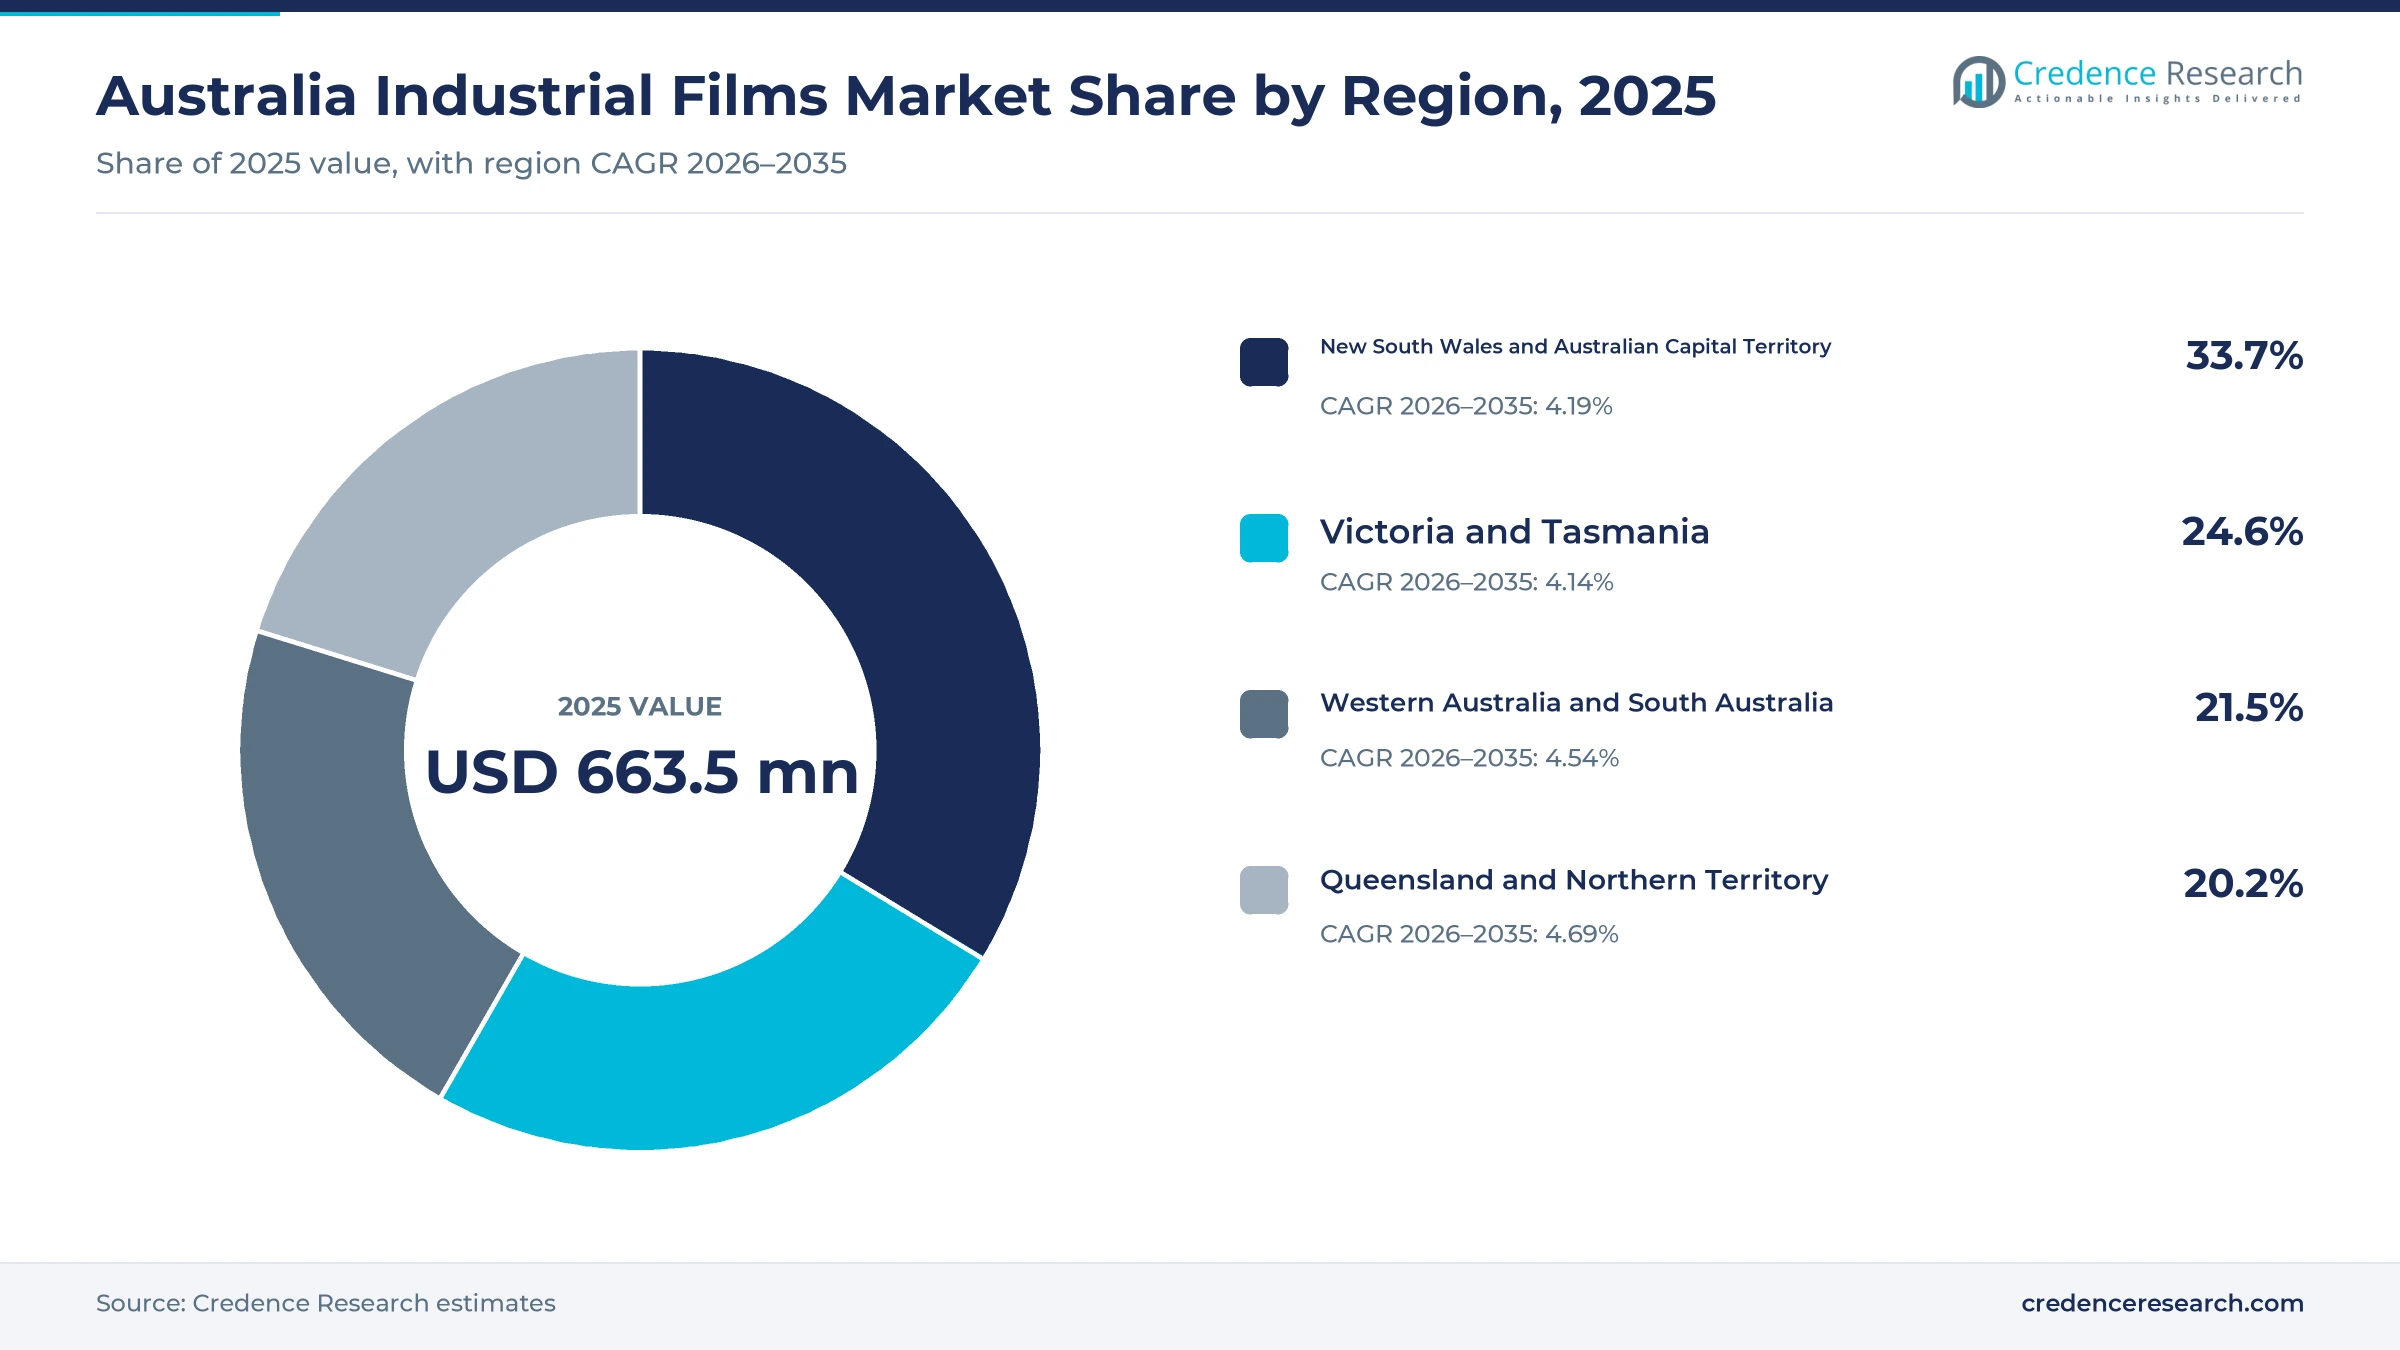
The Australia industrial films market was valued at USD 663.5 million in 2025 and is projected to increase from USD 693.4 million in 2026 to USD 1.02 billion by 2035, registering a CAGR of 4.36% during 2026–2035. Demand comes from warehouses, freight and parcel operators, farmers, food and industrial manufacturers, and builders that wrap pallets, cover silage and protect surfaces on site. New South Wales and Australian Capital Territory held the largest regional share, 33.7% in 2025, because the zone had about 9.16 million residents at March 2026. Queensland and Northern Territory is the fastest-growing region at 4.69% a year, as Queensland population rose 1.6% in the year to March 2026. In turn, environment ministers backed national packaging design standards in December 2024, which is pushing converters toward thinner, recyclable and recycled-content films.
Which industrial film products are counted in Australia?
The estimate measures spending in Australia on load containment films, agricultural films, industrial packaging films and construction and technical films made by blown, cast, coating and lamination processes. It covers films bought by distribution, farm, manufacturing and building customers through direct sales, technical distributors, packaging integrators and online business stores. Values are stated in USD million at current prices and exclude goods and services tax.
The estimate excludes consumer cling wrap, retail carry bags, printed food packaging sold to brand owners and wrapping machinery sold separately. The value chain runs from resin suppliers through local converters and importers to distributors, integrators and end users such as warehouses, farms, factories and building sites.
Australia Industrial Films Market Insights
- The Australia industrial films market was valued at USD 663.5 million in 2025 and is projected to reach USD 1.02 billion by 2035, at a 4.36% CAGR during 2026–2035.
- New South Wales and Australian Capital Territory held 33.7% of 2025 value, because the zone hosts the largest population and freight hub.
- Load containment films led product types with 42.0% of 2025 value, as pallet wrapping remains the core use across warehouses and factories.
- Environment ministers backed national packaging design standards on Dec. 10, 2024, which pushes converters toward recyclable and recycled-content film grades.
- Digital business stores grow fastest among sales channels at 5.70% a year during 2026–2035, as smaller buyers reorder pallet wrap and covers online.
Load containment leads as technical grades grow fastest
Why do load containment films lead product demand?
Based on product type, the market is categorized into load containment films, agricultural films, industrial packaging films and construction and technical films. Load Containment Films led with 42.0% of 2025 value, because every pallet that leaves a warehouse or factory needs stretch or hood film. Construction and Technical Films grow fastest at 4.96% a year, as housing builds lift demand for moisture barriers and surface protection.
Which end-use industries buy the most film?
Based on end-use industry, the market is categorized into distribution and warehousing, agriculture and horticulture, food and industrial manufacturing, and building and civil engineering. Distribution and Warehousing led with 38.0% of 2025 value, because parcel and pallet volumes run every day of the year. Distribution and Warehousing grows fastest at 4.80% a year, as online orders keep rising.
How do load, crop and surface uses split spending?
Based on application, the market is categorized into load unitization, crop and forage protection, bulk goods containment and surface and moisture protection. Load Unitization led with 44.0% of 2025 value, because stretch and hood films hold mixed loads together in transit. Surface and Moisture Protection grows fastest at 4.82% a year, as builders protect floors, windows and slabs during construction.
How do Australian buyers source industrial film?
Based on sales channel, the market is categorized into manufacturer direct, technical distributors, packaging integrators and digital business stores. Manufacturer Direct led with 40.0% of 2025 value, because large warehouses and processors buy contract volumes from converters under annual supply agreements. Digital B2B Stores grow fastest at 5.70% a year, as smaller farms, builders and workshops reorder standard rolls online with fast delivery.
| Segment Group | Leading Sub-segment | Share, 2025 | Fastest-growing Sub-segment | CAGR, 2026–2035 |
|---|---|---|---|---|
| By Product Type | Load Containment Films | 42.0% | Construction and Technical Films | 4.96% |
| By End-Use Industry | Distribution and Warehousing | 38.0% | Distribution and Warehousing | 4.80% |
| By Application | Load Unitization | 44.0% | Surface and Moisture Protection | 4.82% |
| By Sales Channel | Manufacturer Direct | 40.0% | Digital B2B Stores | 5.70% |
Request a Free Sample
Fill in your details and we'll send you a free sample report.
- Sample data tables & charts
- Research methodology
Parcel volumes, farm output and reform lift film demand
How do parcel volumes and load stability lift demand?
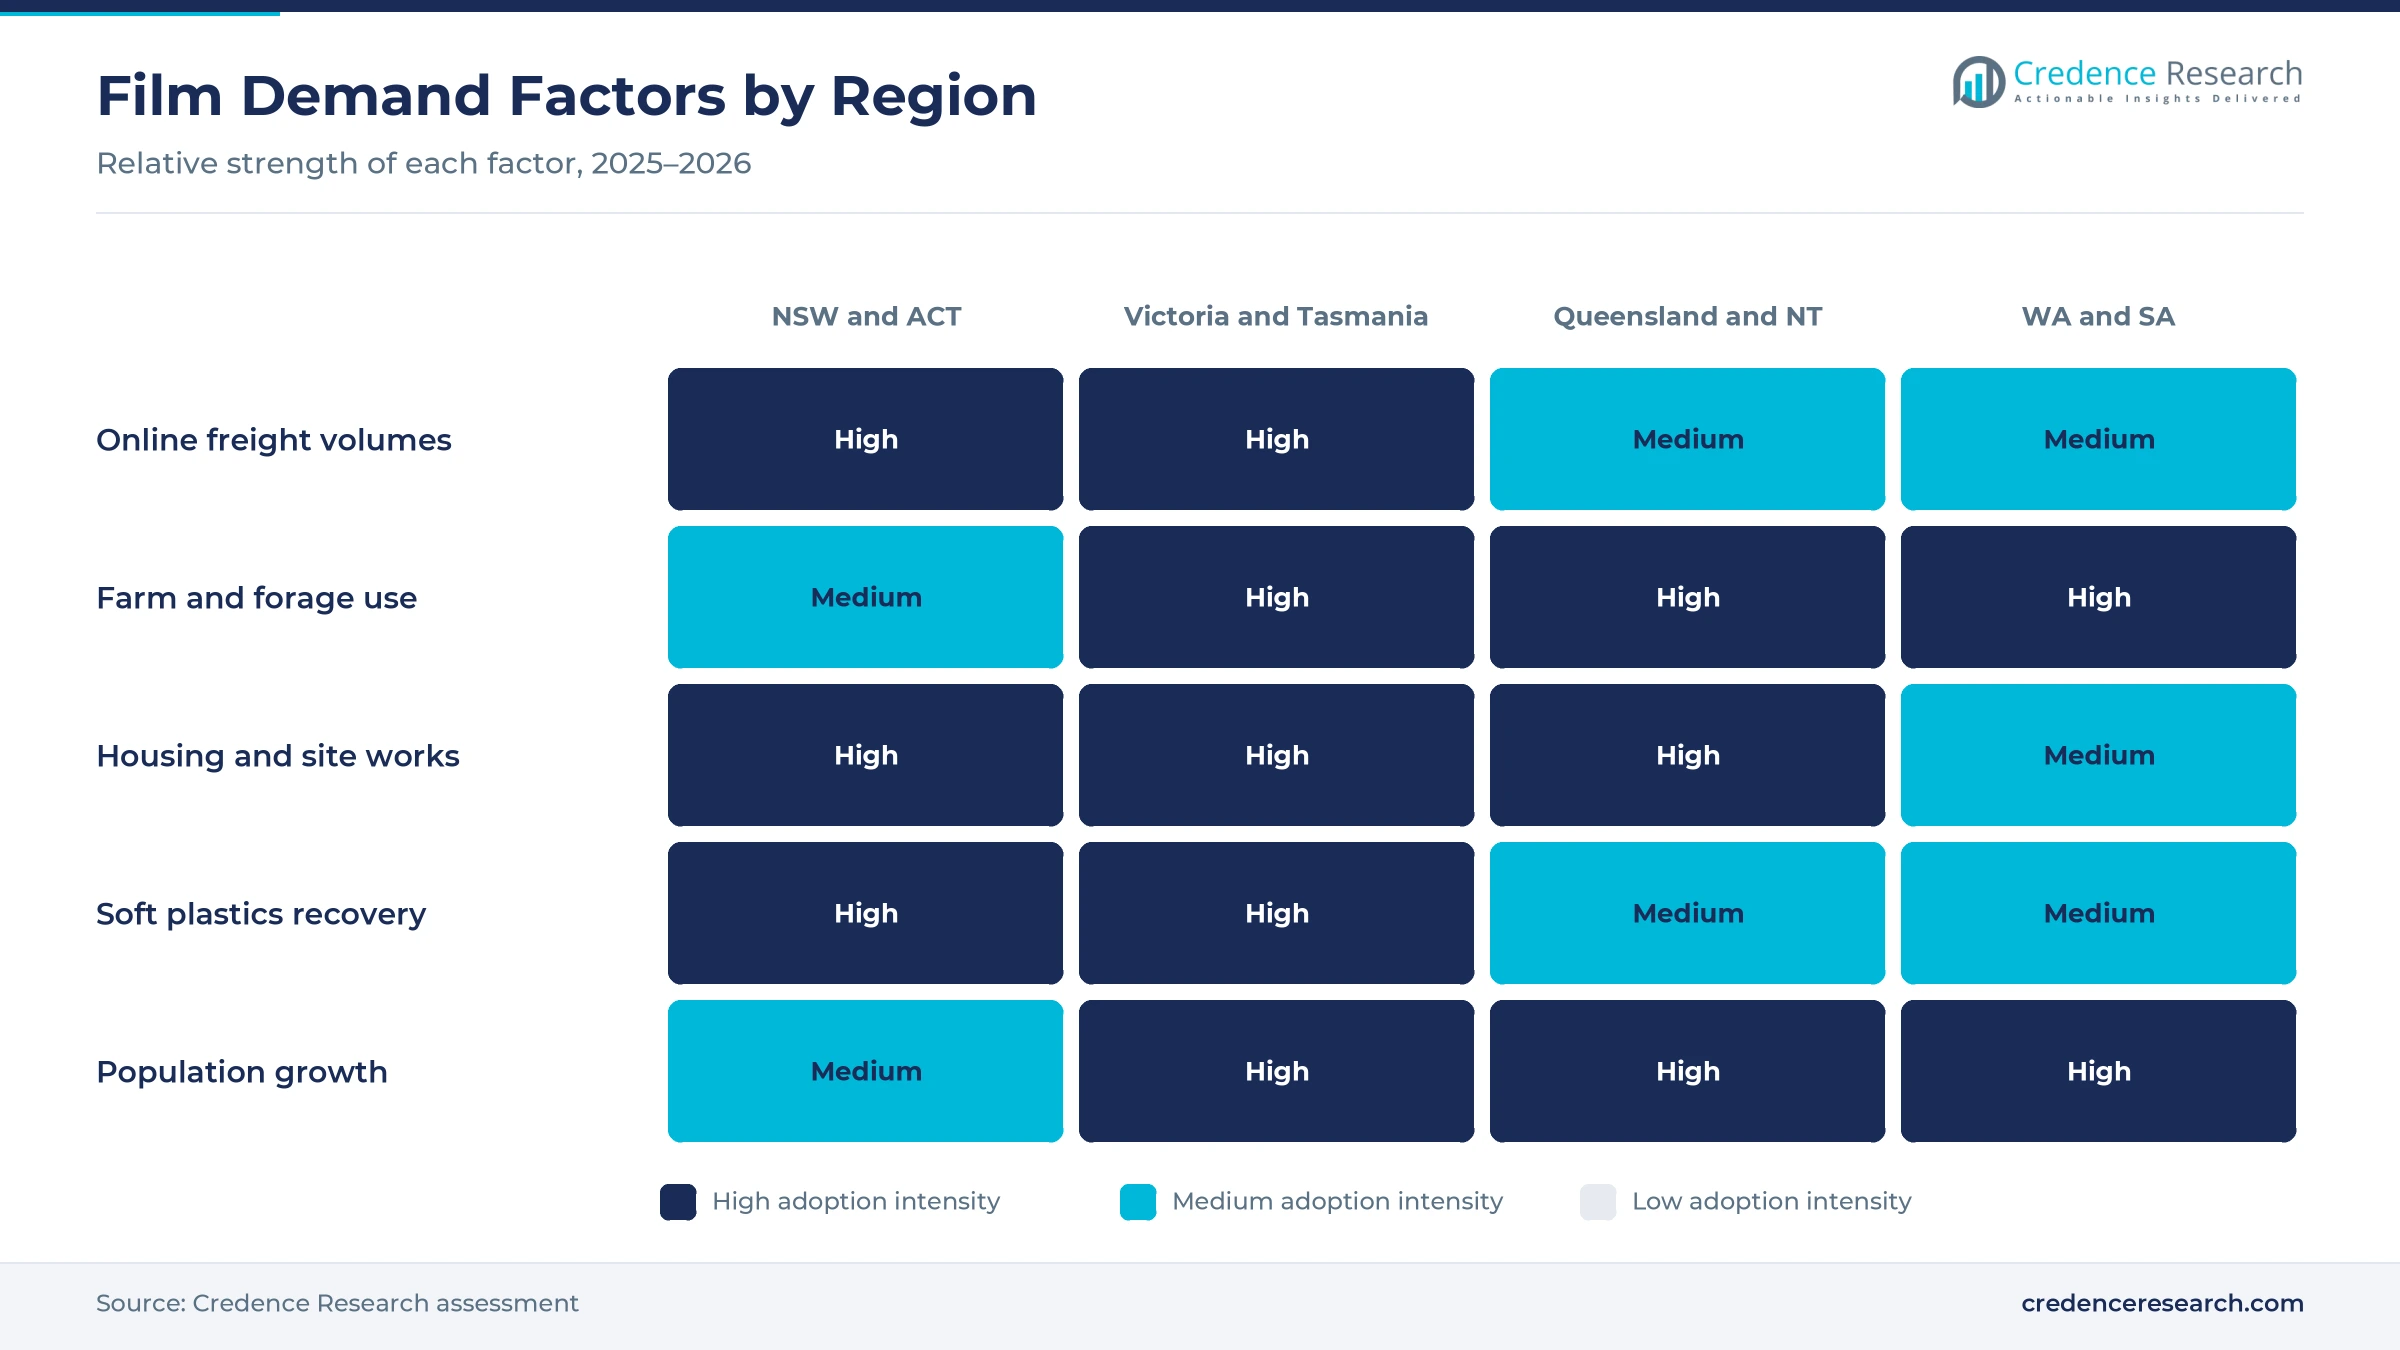
Rising parcel and pallet volumes lift demand, because every order that moves through a distribution center needs secure, stable loads. Australians spent a record AUD 82.6 billion online in 2025, up 13.9% from the year before, according to Australia Post data. About 9.8 million households shopped online during the year, while more than 1,200 parcel lockers now operate nationwide. Signode supplies machine-grade stretch film, stretch hood film and turntable, ring and orbital wrappers from its Truganina site in Victoria. Many retailers also outsource pallet building to contract packaging providers, which buy wrap in bulk. As a result, load unitization leads applications with 44.0% of 2025 value.
Why does recurring farm consumption sustain volumes?
Recurring farm consumption sustains volumes, because silage wrap, mulch and crop covers are used once a season and then replaced. Agricultural land covered about 47.3% of Australia's land area in 2024, according to the World Bank. ABARES expects the gross value of agricultural production to reach AUD 101 billion in 2025-26, while horticulture reached a record AUD 19.2 billion in its September 2025 outlook. Beef and cattle value also hit a record AUD 18.9 billion, which supports forage storage. Signode sells its Mima silage wrap for this work, alongside other crop and forage covers. In turn, agriculture and horticulture held a steady base of film demand in every state during 2025.
How does packaging reform drive film upgrading?
Packaging reform drives film upgrading, because buyers must show that wraps can be recycled or contain recycled resin. On Dec. 10, 2024, environment ministers backed national packaging design standards and a kerbside recyclability grading framework. Australia uses more than 1.3 million metric tons of plastic packaging a year, and over 1 million metric tons still ends up in landfill or as litter, according to Packaging Gateway. The reform package is also projected to cut landfill by about 370,000 metric tons a year by 2030. Consequently, converters are redesigning wraps as single-polymer polyethylene, which suits local recyclers. This shift lifts spending on multilayer grades that hold strength at thinner gauges, even as total metric tons per pallet fall.
Why do housing and site works add technical film demand?
Housing and site works add technical film demand, because builders use moisture barriers, slab underlay and temporary protection films on every project. The National Housing Accord targets 1.2 million new homes over five years from July 1, 2024, according to the Treasury. Australia also added 392,700 residents in the year to March 2026, reaching 27.9 million, according to the Australian Bureau of Statistics. POLIFILM Australia runs a sales and service center near Sydney for temporary surface protection used on glass, metal and floors. As a result, construction and technical films grow fastest among product types at 4.96% a year.
Recycled resin, consolidation and closed loops reshape films
How is the rise of recycled-content wrap reshaping ranges?
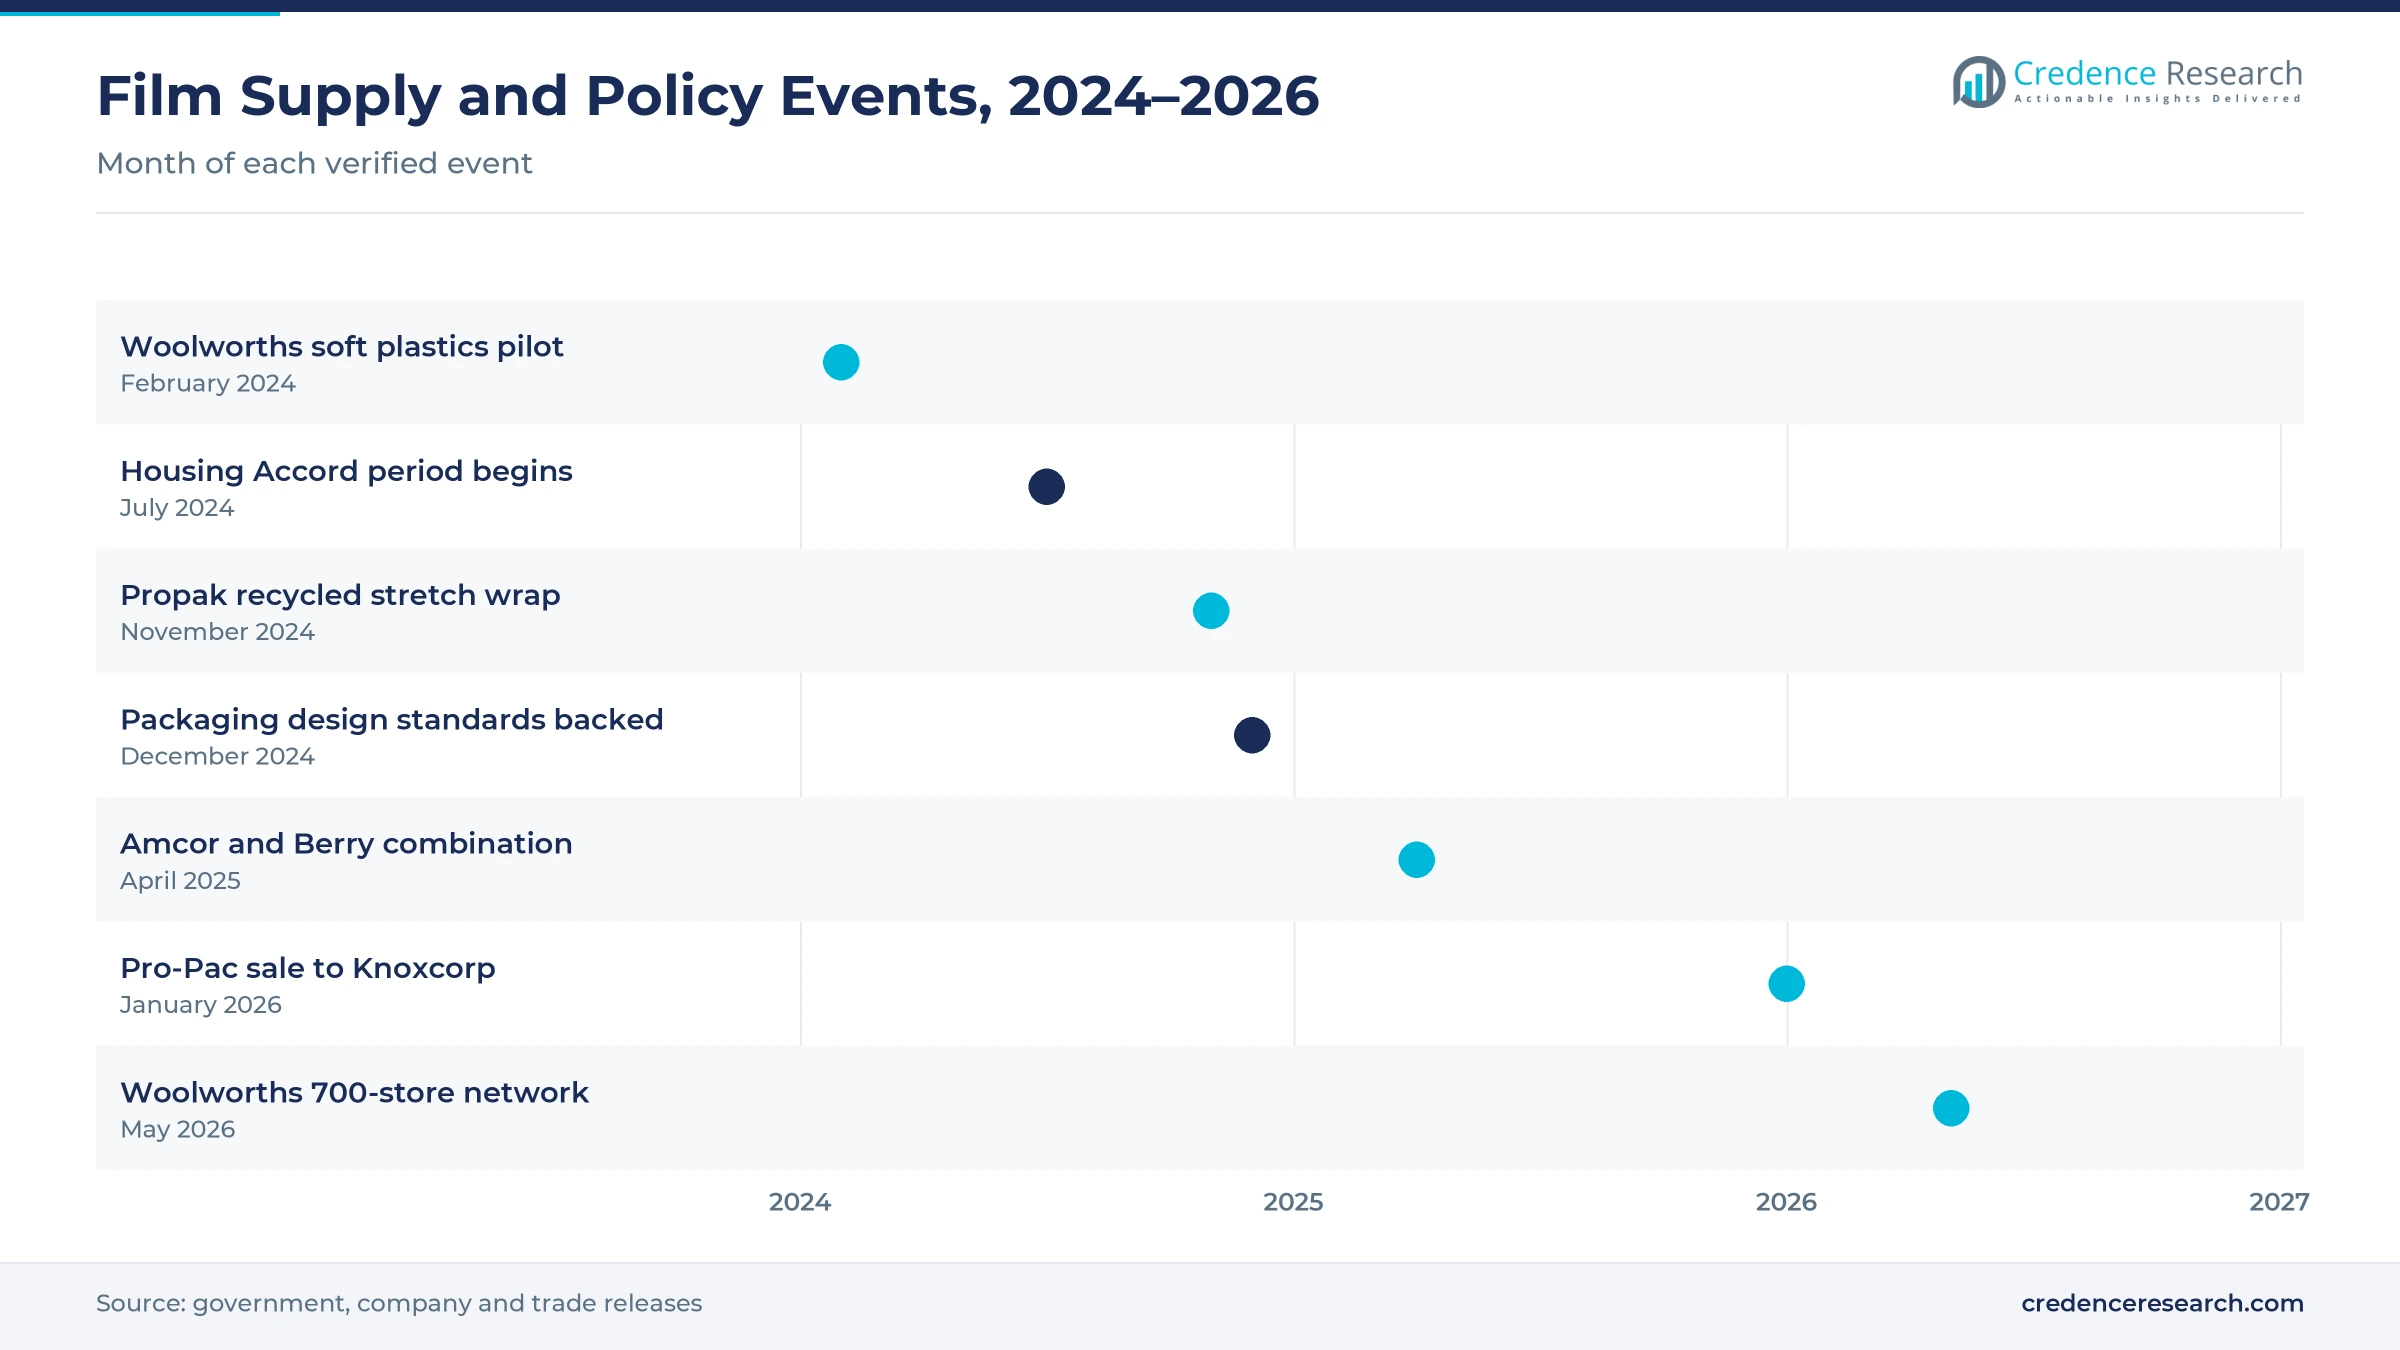
The rise of recycled-content wrap is reshaping product ranges, because large shippers want lower virgin resin use without losing load strength. Propak Industries announced what it called Australia's first 100% post-consumer recycled stretch wrap in November 2024, according to Packaging News. Each box carries a QR code that traces the soft plastics used, and full commercial supply was planned from January 2025. Amcor's Earth Sense Pro hand film, a 28-gauge pallet wrap, contains 30% post-consumer and 5% post-industrial recycled resin. Signode also offers Mimalite oriented film for hand and machine use. Consequently, load containment films are shifting toward thinner, recycled grades that cut virgin resin use per pallet.
Why is supplier consolidation rising among converters?
Supplier consolidation is rising, because global groups and local investors are reshaping who makes and sells film in Australia. Amcor completed its all-stock combination with Berry Global effective April 30, 2025, which joined two large film portfolios. CD&R completed its acquisition of Sealed Air on April 9, 2026, which took the Cryovac and Bubble Wrap owner private. Pro-Pac Packaging entered voluntary administration in October 2025, and Knoxcorp agreed in January 2026 to buy its Australian and New Zealand businesses as going concerns. Knoxcorp plans to keep local manufacturing and invest in machinery. As a result, buyers are reviewing supply contracts and dual sourcing, because load containment films alone held 42.0% of 2025 value.
Can closed-loop soft plastics collection open new supply?
Closed-loop soft plastics collection opens a clear supply opportunity, because recovered film can return as recycled resin for new wraps. Woolworths confirmed in May 2026 that more than 700 supermarkets now collect soft plastics, after a five-store pilot in Victoria began in February 2024. Partner iQRenew has opened a New South Wales facility able to process 14,000 metric tons a year. Soft Plastics Stewardship Australia states that in-store collection now serves almost 70% of Australians. Propak also offers large users a service that turns their own film waste back into stretch wrap. Consequently, converters that secure recovered feedstock can sell recycled-content films to major retailers and their logistics partners.
Is there room to grow in fast-growing western and northern states?
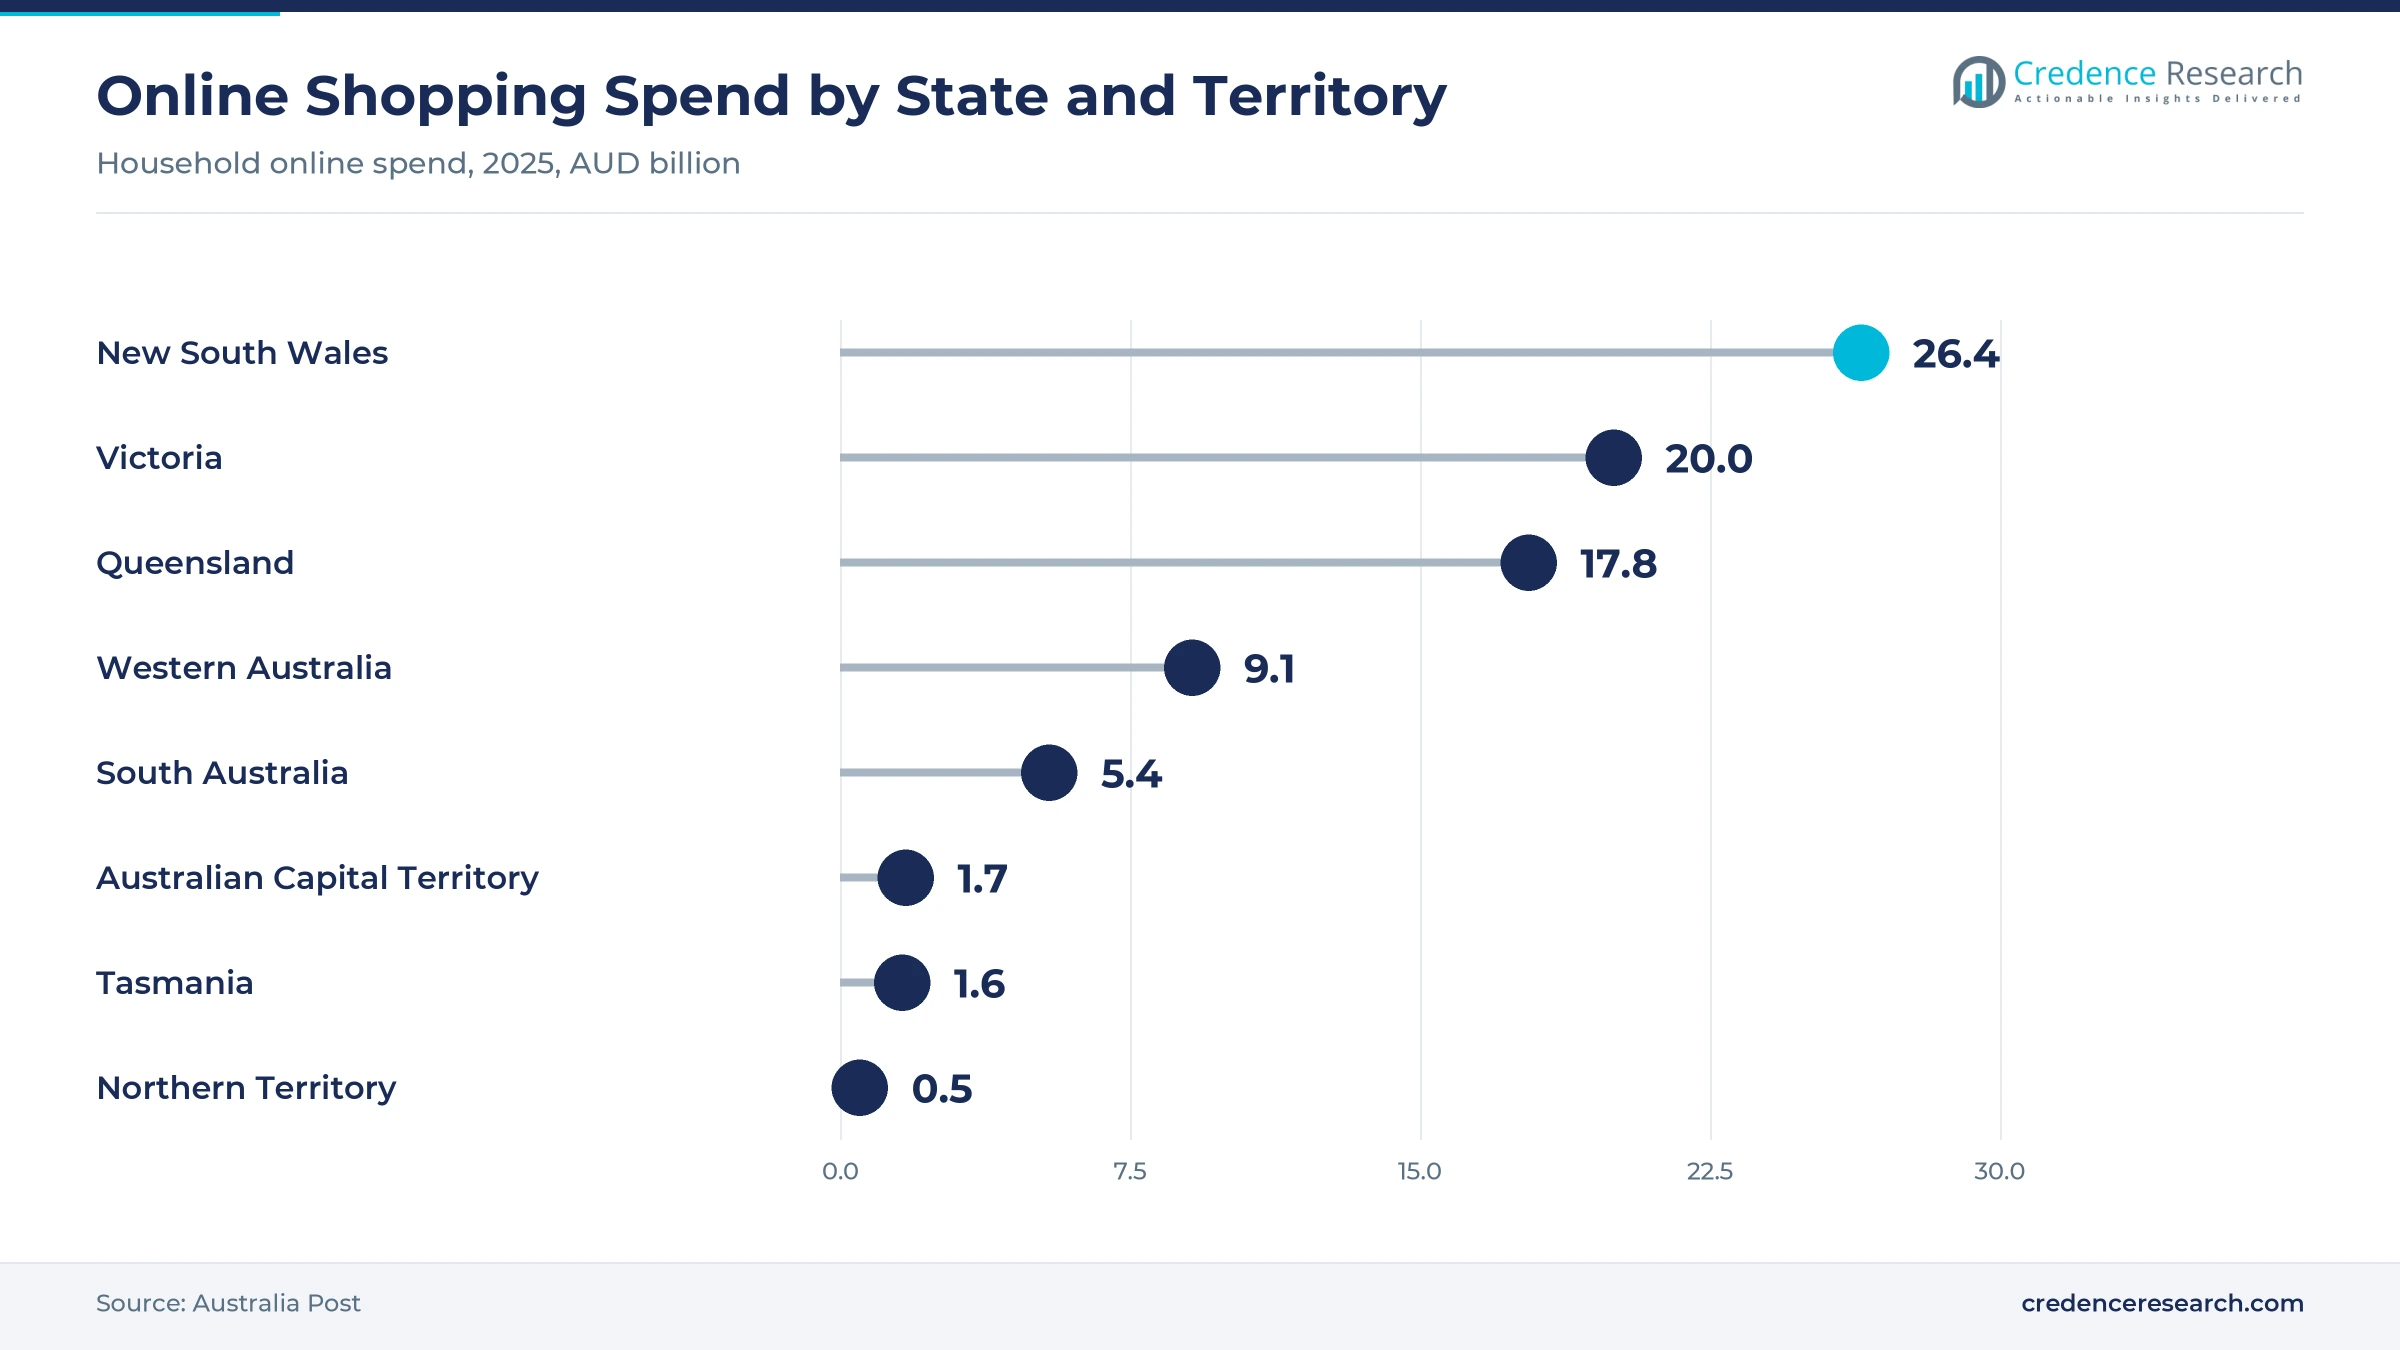
Fast-growing western and northern states offer a growth opening, because new residents need more freight, warehousing and housing. Western Australia grew fastest at 2.1% in the year to March 2026, while Queensland grew 1.6% to 5.74 million residents. Queenslanders spent AUD 17.8 billion online in 2025, and Western Australians spent AUD 9.1 billion, according to Australia Post data. Signet distributes nationally from despatch centers in Brisbane, Perth, Townsville and Mount Isa, which brings stock close to regional buyers. As a result, the two northern and western zones gain share of national film demand through 2035, led by freight and housing work.
Resin costs, weak recyclate demand and farm cycles weigh
How does weak demand for recycled resin slow upgrades?
Weak demand for recycled resin slows upgrades, because cheaper imported virgin resin competes with locally recycled plastic that can cost much more. The packaging covenant body has said that weak demand, not processing capacity, is the main problem. As a result, converters hesitate to invest in recycling lines without firm orders. Industry groups are asking for clear recycled-content rules that give recyclers and film makers steady long-term demand.
Why do resin and energy costs squeeze converters?
Resin and energy costs squeeze converters, because polyethylene and electricity make up most of the cost of each roll. Pro-Pac Packaging entered voluntary administration in October 2025, which showed the pressure on local makers. Consequently, smaller converters may cut ranges or close plants such as the Perfection Packaging site in Dandenong. Firms respond with thinner gauges, energy-efficient lines and pass-through pricing clauses in supply contracts.
How do farm cycles make demand uneven?
Farm cycles make demand uneven, because silage and crop cover use rises and falls with seasons and prices. ABARES expects the gross value of farm production to fall 6% to AUD 95 billion in 2026-27, after a strong 2025-26. As a result, agricultural film sales can swing by state and season. Suppliers manage this by holding regional stock, offering flexible pack sizes and selling through rural distributors.
Will gaps in film recycling limit circular claims?
Gaps in film recycling can limit circular claims, because earlier store collection schemes were suspended and farm film recovery remains patchy. Woolworths rebuilt its in-store network only from 2024 onward, and rural sites have fewer collection points. In turn, recycled-content resin supply stays tight for some film grades. Converters respond by joining stewardship programs, running take-back services and designing single-polymer films that local recyclers can process.
NSW and ACT lead while Queensland and NT grow fastest
| Region | Value, 2025 (USD million) | Share, 2025 | CAGR, 2026–2035 |
|---|---|---|---|
| New South Wales and Australian Capital Territory | 223.6 | 33.7% | 4.19% |
| Victoria and Tasmania | 163.2 | 24.6% | 4.14% |
| Western Australia and South Australia | 142.7 | 21.5% | 4.54% |
| Queensland and Northern Territory | 134.0 | 20.2% | 4.69% |
Why do New South Wales and the ACT lead film demand?
New South Wales and Australian Capital Territory held 33.7% of 2025 value and grows at 4.19% a year. New South Wales had 8.67 million residents at March 2026, while its households spent AUD 26.4 billion online in 2025. iQRenew has also opened a New South Wales plant for recovered soft plastics. As a result, the zone keeps the largest share of pallet wrap, packaging film and site film purchases through 2035, led by Sydney freight hubs and housing work.
How do Victoria and Tasmania support freight and farm use?
Victoria and Tasmania held 24.6% of 2025 value and grow at 4.14% a year. Victoria added 109,500 residents in the year to March 2026, the largest increase of any state. Signode serves the market from Truganina, in Melbourne's western freight belt, and Victorian shoppers spent AUD 20 billion online in 2025. Consequently, demand comes from distribution centers, food processors and dairy farms that wrap silage, while Tasmanian farms and processors add steady seasonal orders.
Why is Queensland and the Northern Territory the fastest zone?
Queensland and Northern Territory held 20.2% of 2025 value and grows fastest at 4.69% a year. Queensland added 90,100 residents in the year to March 2026, while the Northern Territory grew 1.5%. Signet stocks film at despatch centers in Brisbane, Townsville and Mount Isa. In turn, freight, horticulture, cattle and housing work in the north add steady new demand for pallet wrap, silage film and site protection, which keeps the zone ahead of the national growth rate.
What role do western Australia and South Australia play?
Western Australia and South Australia held 21.5% of 2025 value and grow at 4.54% a year. Western Australia grew fastest in population, at 2.1% in the year to March 2026, while South Australia reached 1.92 million residents. As a result, mining supply, grain storage, wine and city warehouses keep film demand rising in both states.
Mergers, recycled wraps and collection points, 2024–2026
| Development | Status and market relevance |
|---|---|
| In November 2024, Propak Industries announced a 100% post-consumer recycled stretch wrap with traceable soft plastic content. | Adds recycled-content pallet wrap |
| In December 2024, environment ministers backed national packaging design standards and a recyclability grading framework. | Sets the direction for recyclable film design |
| In April 2025, Amcor completed its all-stock combination with Berry Global, joining two large film portfolios. | Consolidates global film supply |
| In January 2026, Knoxcorp agreed to buy the Australian and New Zealand businesses of Pro-Pac Packaging from administration. | Keeps local film manufacturing running |
| In May 2026, Woolworths confirmed soft plastics collection at more than 700 supermarkets nationally. | Widens recovered film supply |
Coextrusion and cast lines shape film performance
- Monolayer blown extrusion remains the low-cost route for covers, liners and general-purpose sheeting sold in large rolls.
- Multilayer blown coextrusion combines several polyethylene layers, which keeps puncture strength while gauges become thinner.
- Cast extrusion produces clear, high-cling machine stretch film with steady stretch ratios on automatic wrappers.
- Coating and lamination add tack, UV resistance or barrier layers, which suits surface protection and outdoor farm uses.
Need a Custom Version of This Report?
Tailor the scope, geography, or segments to your exact requirements.
- Custom geography or segment scope
- Direct access to our analyst team
Converters compete on gauge, recycled content and reach
Competition combines global packaging groups, local converters and national distributors. Amcor sells recycled-content hand film and widened its film range through the Berry Global combination in April 2025. Signode supplies stretch film, silage wrap, stretch hood film and wrapping machines from Victoria, which lets it sell film with equipment and service. Sealed Air, now privately held, supplies protective packaging, while POLIFILM Australia focuses on temporary surface protection. Pro-Pac Packaging is moving to Knoxcorp ownership, and Filton Packaging makes films locally as an Australian-owned firm. Signet distributes film nationally from six despatch centers across the mainland states. The wider supplier field covered in this report also includes Pakaflex, Dolphin Plastics & Packaging and Plastics 2000. Companies compete on film gauge, load strength, recycled content, local stock, machine support and delivery reach across states.
Companies profiled and their roles in this market
| Company | Type | Role in the market |
|---|---|---|
| Amcor | Global converter | Earth Sense Pro recycled-content hand film; Berry Global combination in April 2025 |
| Signode | Film and equipment supplier | Stretch film, silage wrap and wrappers from Truganina, Victoria |
| Pro-Pac Packaging | Local converter | Sale to Knoxcorp agreed in January 2026 after administration |
| Sealed Air | Global converter | Protective packaging; taken private by CD&R in April 2026 |
| POLIFILM Australia | Specialist supplier | Temporary surface protection films; service center near Sydney |
| Signet | National distributor | Despatch centers in Brisbane, Sydney, Melbourne, Perth, Townsville and Mount Isa |
| Filton Packaging | Local converter | Australian-owned maker of perforated, printed and laminated films |
Credence Research sees freight and reform setting pace
Credence Research's view is that Australian demand for industrial films will grow steadily through 2035, as online freight, farm output and housing work keep pallets, crops and sites wrapped. Load containment films should keep the largest share, while construction and technical films gain most from the housing target. New South Wales and the ACT will remain the largest zone, although Queensland and the Northern Territory adds demand fastest. However, weak demand for recycled resin and pressure on local converters will reward suppliers that offer thinner, recyclable films with secure feedstock.
Freight, farm and building activity anchor the film model
The report uses 2025 as the base year, with values in USD million at current prices. Market values come from the Credence Research model, which combines freight activity, farm output, building work, film use per application and price levels. Regional shares follow the client data set, while regional growth and segment splits by product type, end-use industry, application and sales channel are Credence Research estimates. Sources used are official statistics, government releases, company releases and trade news, and no interviews or surveys were used.
Freight growth and recyclable design shape demand to 2035
The market is expected to reach USD 1.02 billion by 2035, a 4.36% CAGR during 2026–2035, as freight, farm and building demand keeps film use rising. Growth should be strongest in construction and technical films, digital business stores and Queensland and the Northern Territory, while New South Wales and the ACT keeps the largest share. Packaging design standards and wider soft plastics collection will lift recycled-content film sales after 2026. In contrast, weak farm seasons or high resin costs could slow spending in some years.
Frequently Asked Questions
How big is the Australia industrial films market?
Which region leads film demand?
Which region grows fastest?
Which product type holds the largest share?
Why are buyers moving to recycled-content wrap?
Which product type grows fastest?
Who are the leading companies in this market?
What are the main risks to growth?
Table of Content
Chapter 1 Market Segmentation
- 1.1 Segmentation Framework
- 1.1.1 Product and Service Classification
- 1.1.2 Application and End-Use Classification
- 1.1.3 Technology and Solution Classification
- 1.1.4 Customer and Distribution Channel Classification
- 1.1.5 Geographic Segmentation
- 1.1.6 Market Segment Definitions and Boundaries
- 1.2 By Product Type
- 1.2.1 Load Containment Films
- 1.2.2 Agricultural Films
- 1.2.3 Industrial Packaging Films
- 1.2.4 Construction and Technical Films
- 1.3 By End-Use Industry
- 1.3.1 Distribution and Warehousing
- 1.3.2 Agriculture and Horticulture
- 1.3.3 Food and Industrial Manufacturing
- 1.3.4 Building and Civil Engineering
- 1.4 By Application
- 1.4.1 Load Unitization
- 1.4.2 Crop and Forage Protection
- 1.4.3 Bulk Goods Containment
- 1.4.4 Surface and Moisture Protection
- 1.5 By Sales Channel
- 1.5.1 Manufacturer Direct
- 1.5.2 Technical Distributors
- 1.5.3 Packaging Integrators
- 1.5.4 Digital B2B Stores
Chapter 2 Introduction
- 2.1 Report Objectives and Scope
- 2.2 Product Definition and Industry Terminology
- 2.3 Market Inclusions and Exclusions
- 2.4 Research Process
- 2.4.1 Primary Research and Expert Interviews
- 2.4.2 Secondary Research and Source Review
- 2.4.3 Top-Down and Bottom-Up Estimation
- 2.4.4 Data Triangulation and Verification
- 2.5 Market Size Measurement Basis
- 2.5.1 2025: USD 663.5 million → 2035: USD 1.02 billion
- 2.6 Historical and Forecast Reference Periods
- 2.6.1 Historical Period: 2018-2025
- 2.6.2 Base Year: 2025
- 2.6.3 Forecast Period: 2025-2035
- 2.7 Research Assumptions and Limitations
Chapter 3 Executive Summary
- 3.1 Market Snapshot and Key Findings
- 3.2 Base-Year Market Size, 2025
- 3.3 Forecast Market Size, 2035
- 3.4 Revenue and Volume Growth Outlook
- 3.5 Key Demand and Supply Indicators
- 3.6 Leading Market Segments
- 3.7 Fastest-Growing Market Opportunities
- 3.8 Regional Performance Highlights
- 3.9 Technology and Industry Transformation
- 3.10 Competitive Landscape Summary
- 3.11 Analyst View and Strategic Implications
Chapter 4 Australia Industrial Films Market Trends and Developments
- 4.1 Historical Industry Development, 2018-2025
- 4.2 Recent Market Trends and Developments
- 4.3 Demand and Customer Behavior Trends
- 4.4 Technology and Product Innovation
- 4.5 Artificial Intelligence, Automation and Digitalization
- 4.6 Local Manufacturing and Supply Chain Realignment
- 4.7 Industry Partnerships, Mergers and Acquisitions
- 4.8 Sustainability and Circular Economy Developments
- 4.9 Government and Private Sector Investment Trends
- 4.10 Emerging Business Models and Commercialization
- 4.11 Industry Developments and Announcements
Chapter 5 Australia Industrial Films Market Production, Supply and Demand Analysis
- 5.1 Demand Trend and Consumption Analysis, 2018-2025
- 5.2 Demand Forecast, 2025-2035
- 5.3 Production and Output Trend, 2018-2025
- 5.4 Production and Output Forecast, 2025-2035
- 5.5 Installed Capacity and Capacity Utilization
- 5.6 Company-Wise Production Plants and Statistics
- 5.6.1 Installed Production Capacity
- 5.6.2 Actual Production
- 5.6.3 Planned Capacity and Expansion Targets
- 5.7 Supply Chain Structure and Procurement Trends
- 5.8 Supply-Demand Gap and Bottlenecks
- 5.9 Import Dependence and Sourcing Structure
- 5.10 Contract Manufacturing and Outsourcing
- 5.11 Regional Supply and Demand Concentration
Chapter 6 Australia Industrial Films Market Pricing Analysis
- 6.1 Pricing Structure and Measurement
- 6.2 Historical Pricing Trends, 2018-2025
- 6.3 Pricing Outlook, 2025-2035
- 6.4 Average Selling Price and Unit Economics
- 6.5 Pricing by Product and Market Segment
- 6.6 Geographic Pricing Differences
- 6.7 Key Input, Energy, Labor and Logistics Costs
- 6.8 Contract Pricing and Purchasing Models
- 6.9 Pricing Sensitivity and Competitive Positioning
- 6.10 Price, Margin and Profitability Implications
Chapter 7 Australia Industrial Films Market Dynamics
- 7.1 Market Growth Drivers
- 7.1.1 Demand-Side Drivers
- 7.1.2 Technology and Innovation Drivers
- 7.1.3 Infrastructure and Investment Drivers
- 7.1.4 Regulatory and Policy Drivers
- 7.2 Market Restraints
- 7.2.1 Cost and Affordability Constraints
- 7.2.2 Technology and Adoption Barriers
- 7.2.3 Supply Chain and Operational Constraints
- 7.3 Market Challenges
- 7.3.1 Competitive Pressure and Margin Erosion
- 7.3.2 Skills, Infrastructure and Implementation Gaps
- 7.4 Emerging Market Opportunities
- 7.5 Market Dynamics Impact and Time-Horizon Assessment
Chapter 8 Australia Industrial Films Value Chain Analysis
- 8.1 Industry Value Chain Overview
- 8.2 Upstream Suppliers and Critical Inputs
- 8.3 Technology and Component Providers
- 8.4 Manufacturing or Service Delivery
- 8.5 Distribution, Channel Partners and Integrators
- 8.6 Downstream Applications and End Users
- 8.7 Value Addition and Profit Pools
- 8.8 Vertical Integration and Outsourcing
- 8.9 Supplier Concentration and Risk
- 8.10 Supply Chain Localization and Resilience
Chapter 9 Australia Industrial Films Market Regulations and Policies
- 9.1 Relevant Laws, Standards and Compliance Frameworks
- 9.2 Product, Service, Safety and Quality Requirements
- 9.3 Government Policies, Incentives and Subsidies
- 9.4 Imports, Exports and Trade Barriers
- 9.5 Public Procurement and Local Content Requirements
- 9.6 Environmental and Sustainability Compliance
- 9.7 Upcoming Policy Changes and Market Implications
Chapter 10 Australia Industrial Films Market Hotspots and Opportunities
- 10.1 Market Opportunity Mapping and Growth Hotspots
- 10.2 High-Growth Applications and Customer Groups
- 10.3 Underserved Markets and White-Space Opportunities
- 10.4 Emerging Technology and Product Opportunities
- 10.5 New Capacity and Investment Hotspots
- 10.6 Market Entry and Expansion Opportunities
- 10.7 Distribution and Partnership Opportunities
- 10.8 Near-Term and Long-Term Commercial Potential
- 10.9 Opportunity Attractiveness and Execution Risks
Chapter 11 Australia Industrial Films Market Outlook, 2025-2035
- 11.1 Market Size and Analysis
- 11.1.1 Revenue (Market Measurement: 2025: USD 663.5 million → 2035: USD 1.02 billion)
- 11.1.2 Market Volume and Quantity Sold
- 11.1.3 Historical Market Size, 2018-2025
- 11.1.4 Base-Year Market Size, 2025
- 11.2 Market Forecast, 2025-2035
- 11.2.1 Revenue Forecast to 2035
- 11.2.2 Volume Forecast to 2035
- 11.2.3 CAGR and Year-on-Year Growth
- 11.2.4 Incremental Revenue Opportunity
- 11.3 Forecast Assumptions and Scenario Analysis
- 11.3.1 Base-Case Forecast
- 11.3.2 Optimistic and Conservative Scenarios
- 11.3.3 Technology, Pricing and Policy Sensitivities
- 11.4 Market Attractiveness and Growth Outlook
Chapter 12 Australia Industrial Films Market Segmentation and Outlook
- 12.1 Segmentation Summary and Market Shares, 2025
- 12.2 Largest and Fastest-Growing Segments
- 12.3 By Product Type - Market Size and Forecast, 2025-2035
- 12.3.1 Segment Definition and Scope
- 12.3.2 Historical Market Size, 2018-2025
- 12.3.3 Revenue Forecast, 2025-2035
- 12.3.4 Volume Forecast, 2025-2035
- 12.3.5 Base-Year Market Share, 2025
- 12.3.6 Segment CAGR and Growth Drivers
- 12.3.7 Subsegment Market Size and Forecast
- 12.3.7.1 Load Containment Films
- 12.3.7.2 Agricultural Films
- 12.3.7.3 Industrial Packaging Films
- 12.3.7.4 Construction and Technical Films
- 12.3.8 Subsegment Pricing and Adoption Trends
- 12.3.9 Leading Suppliers and Competition
- 12.3.10 Regional Demand and Opportunities
- 12.4 By End-Use Industry - Market Size and Forecast, 2025-2035
- 12.4.1 Segment Definition and Scope
- 12.4.2 Historical Market Size, 2018-2025
- 12.4.3 Revenue Forecast, 2025-2035
- 12.4.4 Volume Forecast, 2025-2035
- 12.4.5 Base-Year Market Share, 2025
- 12.4.6 Segment CAGR and Growth Drivers
- 12.4.7 Subsegment Market Size and Forecast
- 12.4.7.1 Distribution and Warehousing
- 12.4.7.2 Agriculture and Horticulture
- 12.4.7.3 Food and Industrial Manufacturing
- 12.4.7.4 Building and Civil Engineering
- 12.4.8 Subsegment Pricing and Adoption Trends
- 12.4.9 Leading Suppliers and Competition
- 12.4.10 Regional Demand and Opportunities
- 12.5 By Application - Market Size and Forecast, 2025-2035
- 12.5.1 Segment Definition and Scope
- 12.5.2 Historical Market Size, 2018-2025
- 12.5.3 Revenue Forecast, 2025-2035
- 12.5.4 Volume Forecast, 2025-2035
- 12.5.5 Base-Year Market Share, 2025
- 12.5.6 Segment CAGR and Growth Drivers
- 12.5.7 Subsegment Market Size and Forecast
- 12.5.7.1 Load Unitization
- 12.5.7.2 Crop and Forage Protection
- 12.5.7.3 Bulk Goods Containment
- 12.5.7.4 Surface and Moisture Protection
- 12.5.8 Subsegment Pricing and Adoption Trends
- 12.5.9 Leading Suppliers and Competition
- 12.5.10 Regional Demand and Opportunities
- 12.6 By Sales Channel - Market Size and Forecast, 2025-2035
- 12.6.1 Segment Definition and Scope
- 12.6.2 Historical Market Size, 2018-2025
- 12.6.3 Revenue Forecast, 2025-2035
- 12.6.4 Volume Forecast, 2025-2035
- 12.6.5 Base-Year Market Share, 2025
- 12.6.6 Segment CAGR and Growth Drivers
- 12.6.7 Subsegment Market Size and Forecast
- 12.6.7.1 Manufacturer Direct
- 12.6.7.2 Technical Distributors
- 12.6.7.3 Packaging Integrators
- 12.6.7.4 Digital B2B Stores
- 12.6.8 Subsegment Pricing and Adoption Trends
- 12.6.9 Leading Suppliers and Competition
- 12.6.10 Regional Demand and Opportunities
- 12.7 Segment Growth Comparison
- 12.8 Segment Attractiveness and Priority Matrix
Chapter 13 Australia Industrial Films End-Use and Application Market Outlook
- 13.1 End-Use Industry and Customer Demand Structure
- 13.2 Leading Applications and Customer Groups
- 13.3 End-Use Market Size, Share and Forecast
- 13.4 Major End-Use Industry Deep Dives
- 13.4.1 Customer Requirements and Use Cases
- 13.4.2 Demand and Replacement Cycles
- 13.4.3 Technical and Regulatory Considerations
- 13.4.4 Purchasing and Procurement Models
- 13.4.5 Leading Vendors and Distribution Channels
- 13.4.6 Forecast and Commercial Opportunities
- 13.5 Emerging Applications and Cross-Segment Demand
- 13.6 End-Use Industry Investment Priorities
Chapter 14 Australia Industrial Films Geographic Market Outlook, 2025-2035
- 14.1 Domestic Market Distribution and Demand Clusters
- 14.2 State- or Province-Wise Market Size and Forecast, 2025-2035
- 14.3 City and Metropolitan Market Outlook
- 14.4 Industrial, Manufacturing and Commercial Clusters
- 14.5 Geographic Concentration of Key End Users
- 14.6 Local Pricing and Purchasing Differences
- 14.7 Domestic Production Facilities and Capacity Map
- 14.8 Local Infrastructure and Project Pipeline
- 14.9 State-Level Policy and Incentive Differences
- 14.10 Subnational Investment Hotspots and Opportunities
- 14.11 Distribution and Logistics Networks
- 14.12 Domestic Competitive Footprint
Chapter 15 Australia Industrial Films Technology, Innovation and Sustainability Outlook
- 15.1 Technology Landscape and Maturity
- 15.2 Product, Process and Service Innovation
- 15.3 AI, Automation and Digital Tools in the Industry
- 15.4 Technology Adoption and Performance Benchmarking
- 15.5 Innovation Pipeline and R&D Investment
- 15.6 Patent and Intellectual Property Trends
- 15.7 Energy Efficiency and Resource Management
- 15.8 Sustainability, Recycling and Circularity
- 15.9 Technology Roadmap, 2025-2035
- 15.10 Risks of Obsolescence and Technology Substitution
Chapter 16 Australia Industrial Films Market Key Strategic Imperatives
- 16.1 Growth and Market Entry Priorities
- 16.2 High-Return Products and Segments
- 16.3 Pricing, Profitability and Cost Optimization
- 16.4 Technology Investment and Product Differentiation
- 16.5 Supply Chain Localization and Resilience
- 16.6 Distribution and Customer Acquisition
- 16.7 Partnership, Acquisition and Capacity Strategy
- 16.8 Regional Expansion Priorities
- 16.9 Short-, Medium- and Long-Term Actions
Chapter 17 Competition Outlook
- 17.1 Industry Competition Characteristics
- 17.2 Market Structure and Concentration
- 17.3 Market Share and Competitive Positioning, 2025
- 17.4 Company-Wise Revenue and Product Benchmarking
- 17.5 Production and Service Capacity Benchmarking
- 17.6 Technology, Pricing and Differentiation
- 17.7 Regional Footprint and Distribution Strength
- 17.8 Mergers, Acquisitions and Strategic Alliances
- 17.9 New Entrants and Competitive Threats
- 17.10 Porter's Five Forces and Industry Attractiveness
- 17.11 Competitive Outlook, 2025-2035
Chapter 18 Company Profiles
- 18.1 Company Coverage and Selection Criteria
- 18.2 Pro-Pac Packaging
- 18.2.1 Business Description
- 18.2.2 Company Ownership and Geographic Presence
- 18.2.3 Product and Service Portfolio
- 18.2.4 Manufacturing and Operating Footprint
- 18.2.5 Production Capacity and Expansion Plans
- 18.2.6 Financial Performance and Investment
- 18.2.7 Market Share and Competitive Position
- 18.2.8 Technology and Innovation Capabilities
- 18.2.9 Strategic Alliances or Partnerships
- 18.2.10 Recent Developments
- 18.2.11 Growth Strategy and Outlook
- 18.3 Amcor
- 18.4 Sealed Air
- 18.5 Signode
- 18.6 Signet
- 18.7 POLIFILM Australia
- 18.8 Filton Packaging
- 18.9 Pakaflex
- 18.10 Dolphin Plastics & Packaging
- 18.11 Plastics 2000
- 18.12 Other Relevant Market Participants
Note: Every listed company is profiled on the structure shown under the first company. The company list is preliminary and may change based on research findings, market developments, data availability and client requirements.
Chapter 19 Disclaimer
- 19.1 Research and Forecast Disclaimer
- 19.2 Data Source and Estimation Limitations
Note: The depth of individual sections depends on data availability for this market. Volume, capacity, trade and other unit-based metrics are included where applicable.

