
Digital upgrades and 3D planning reshape practice spending
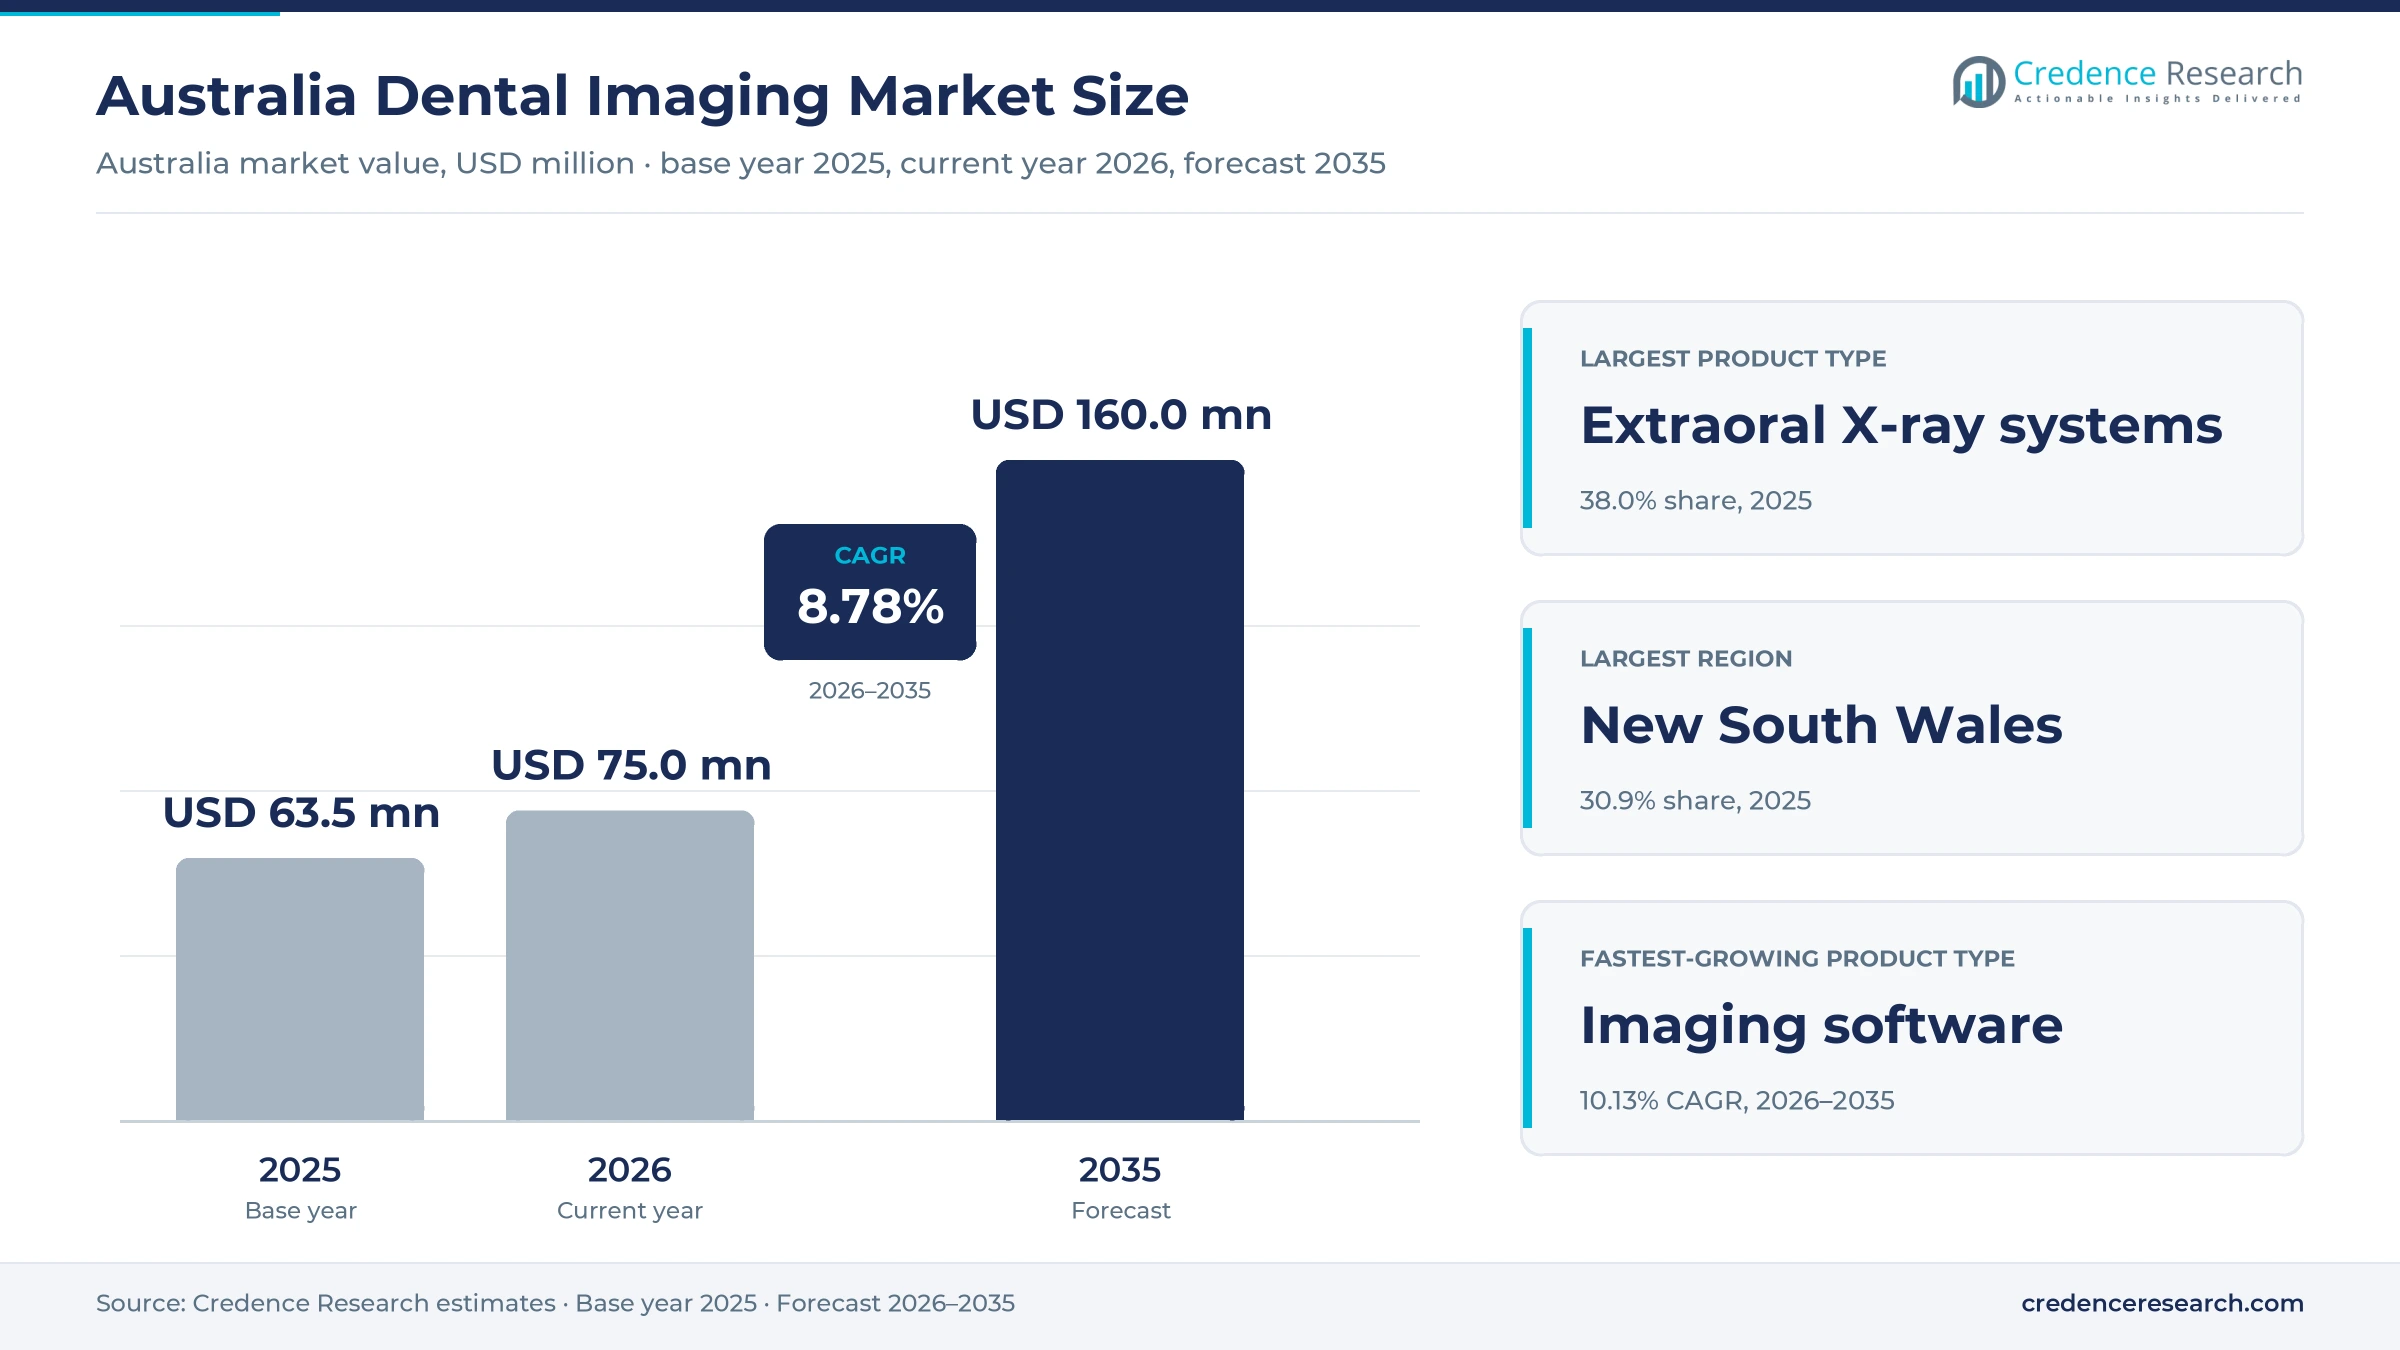
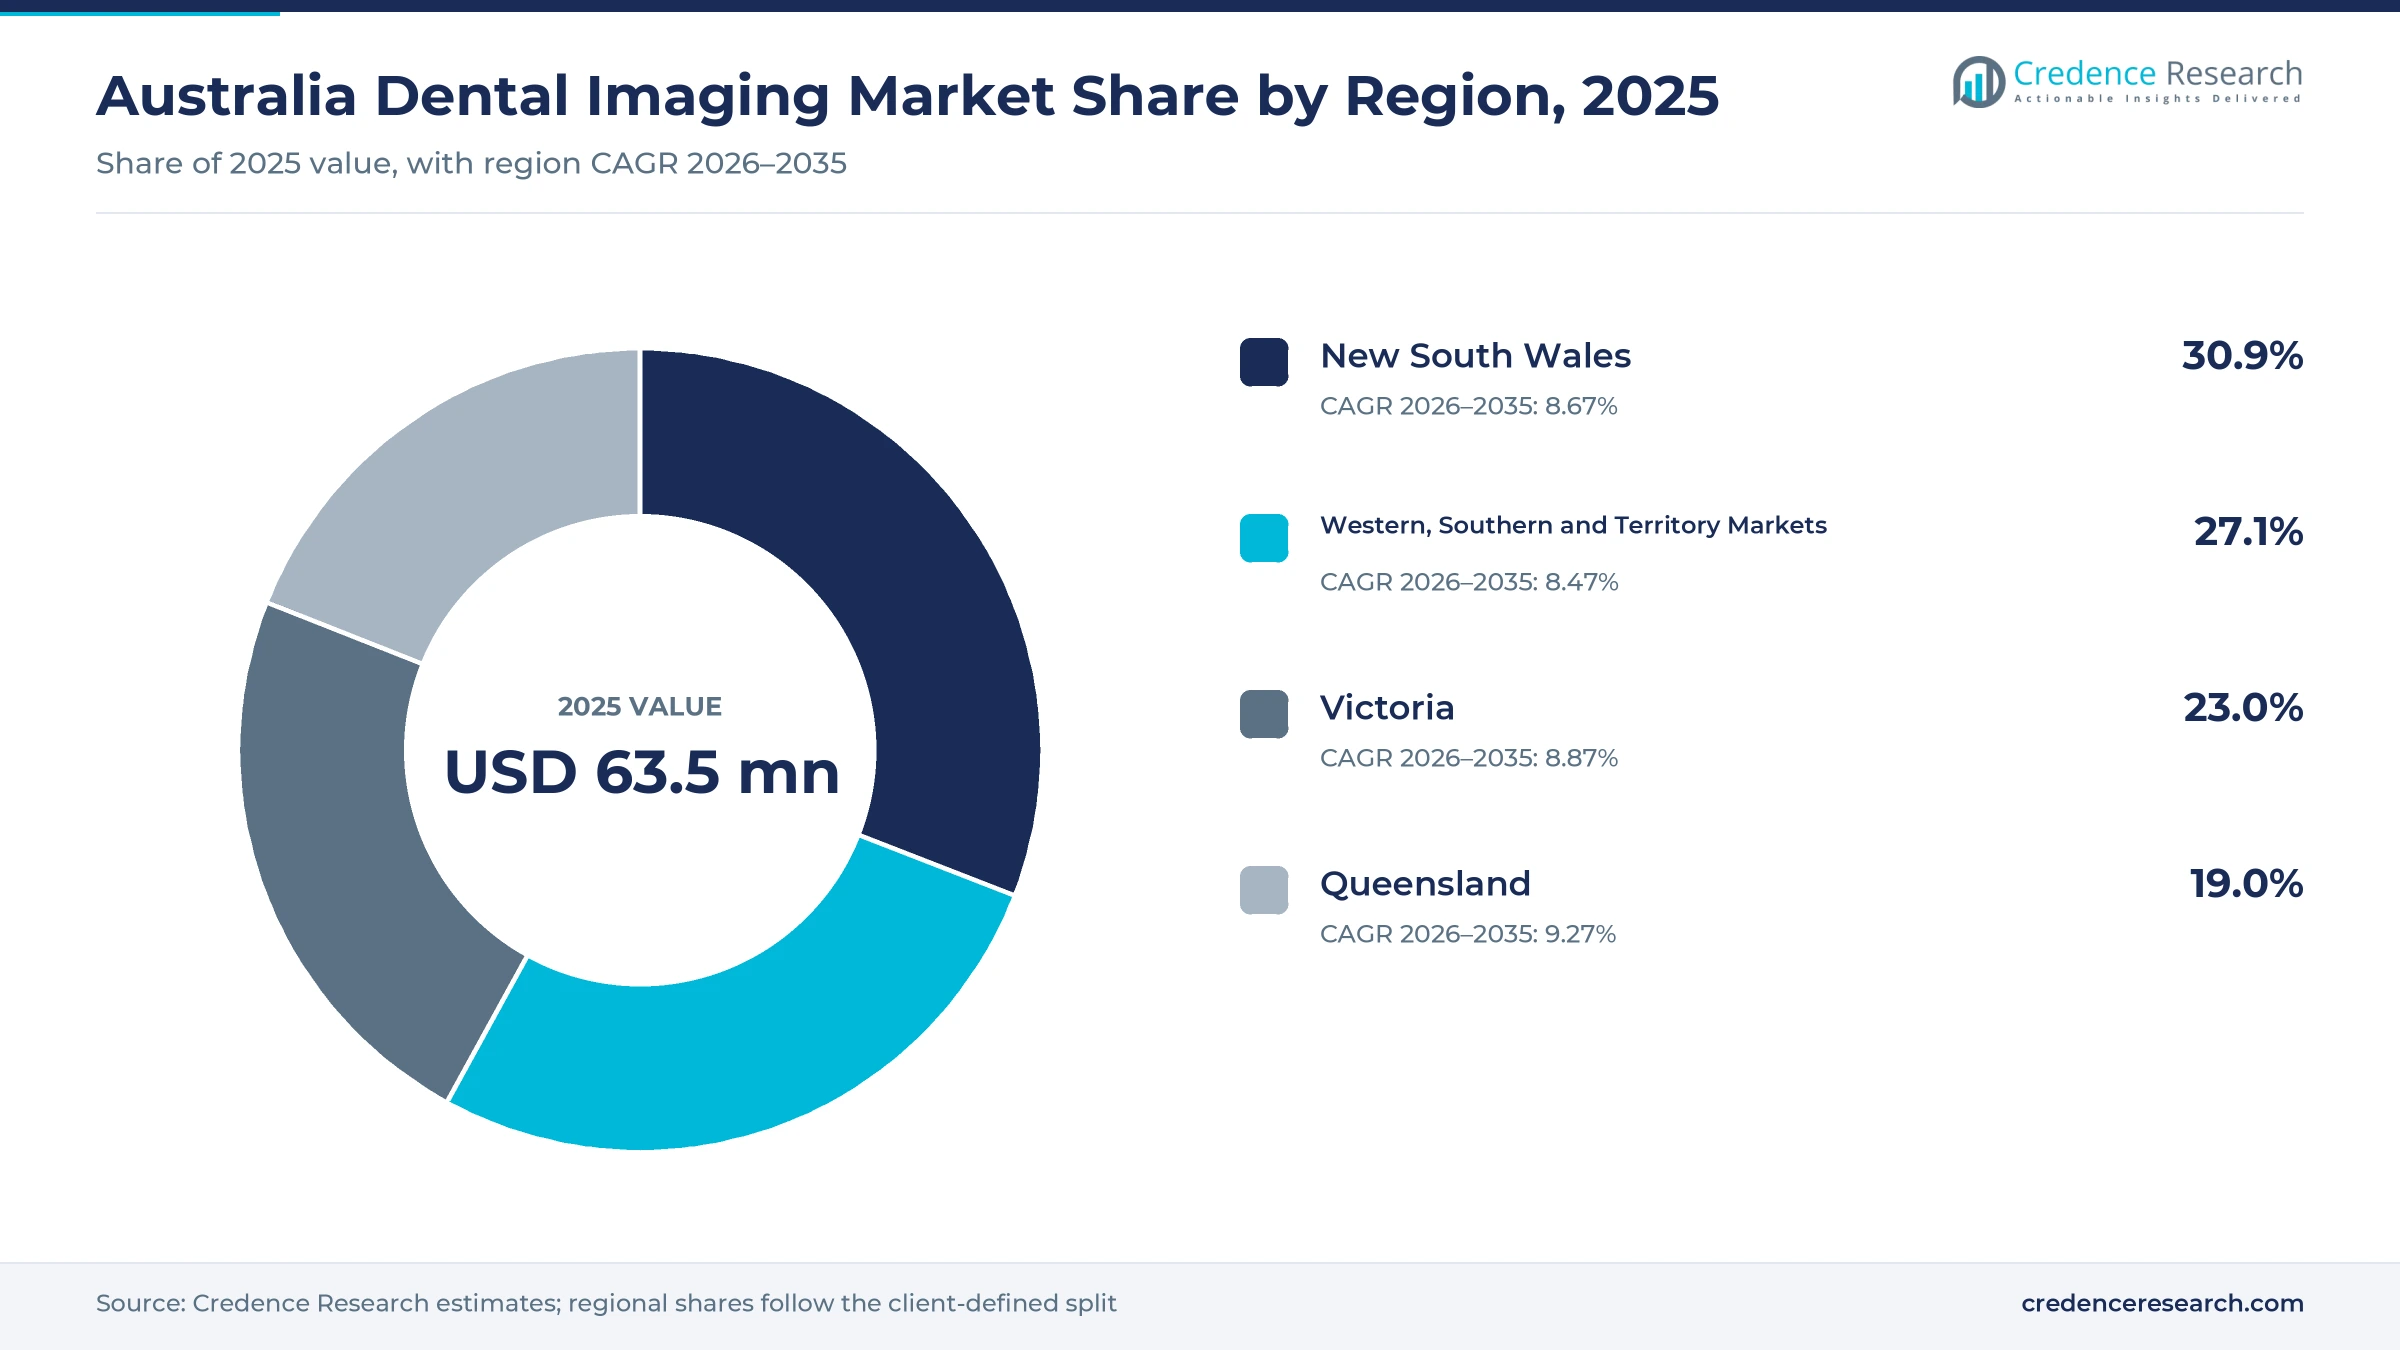
The Australia dental imaging market was valued at USD 63.5 million in 2025 and is projected to increase from USD 75.0 million in 2026 to USD 160.0 million by 2035, registering a CAGR of 8.78% during 2026–2035. Demand comes from general practices replacing film and older digital units, from specialists who plan implants and orthodontic care on three-dimensional scans, and from public clinics and teaching hospitals that serve children and low-income adults. New South Wales held the largest regional share, 30.9% in 2025, because it has the most registered practitioners and the densest network of private clinics. Queensland is the fastest-growing region at 9.27% a year, as new suburbs add practices. In turn, the national radiation regulator published a new code for dental exposure in April 2025, while cloud-based software is changing how clinics store and share scans.
Which X-ray systems, cameras and software does the estimate cover?
The estimate measures the value of intraoral X-ray units and sensors, extraoral panoramic, cephalometric and cone beam systems, intraoral cameras and the software used to capture, view and plan from these images. It counts sales and subscriptions paid by private practices, corporate groups, public dental services and university clinics.
The estimate excludes service contracts sold on their own, radiology centers that bill for scans, and chairs, lights and other surgery equipment. The value chain runs from equipment makers in Europe, Asia and North America through national distributors and specialist suppliers to clinics in every state and territory.
Australia Dental Imaging Market Insights
- The Australia dental imaging market was valued at USD 63.5 million in 2025 and is projected to reach USD 160.0 million by 2035, registering a CAGR of 8.78% during 2026–2035.
- New South Wales held a 30.9% share of 2025 value, because the state has the largest number of registered dental practitioners.
- Extraoral X-ray systems led with a 38.0% share of 2025 value, because panoramic and cone beam units carry the highest unit prices.
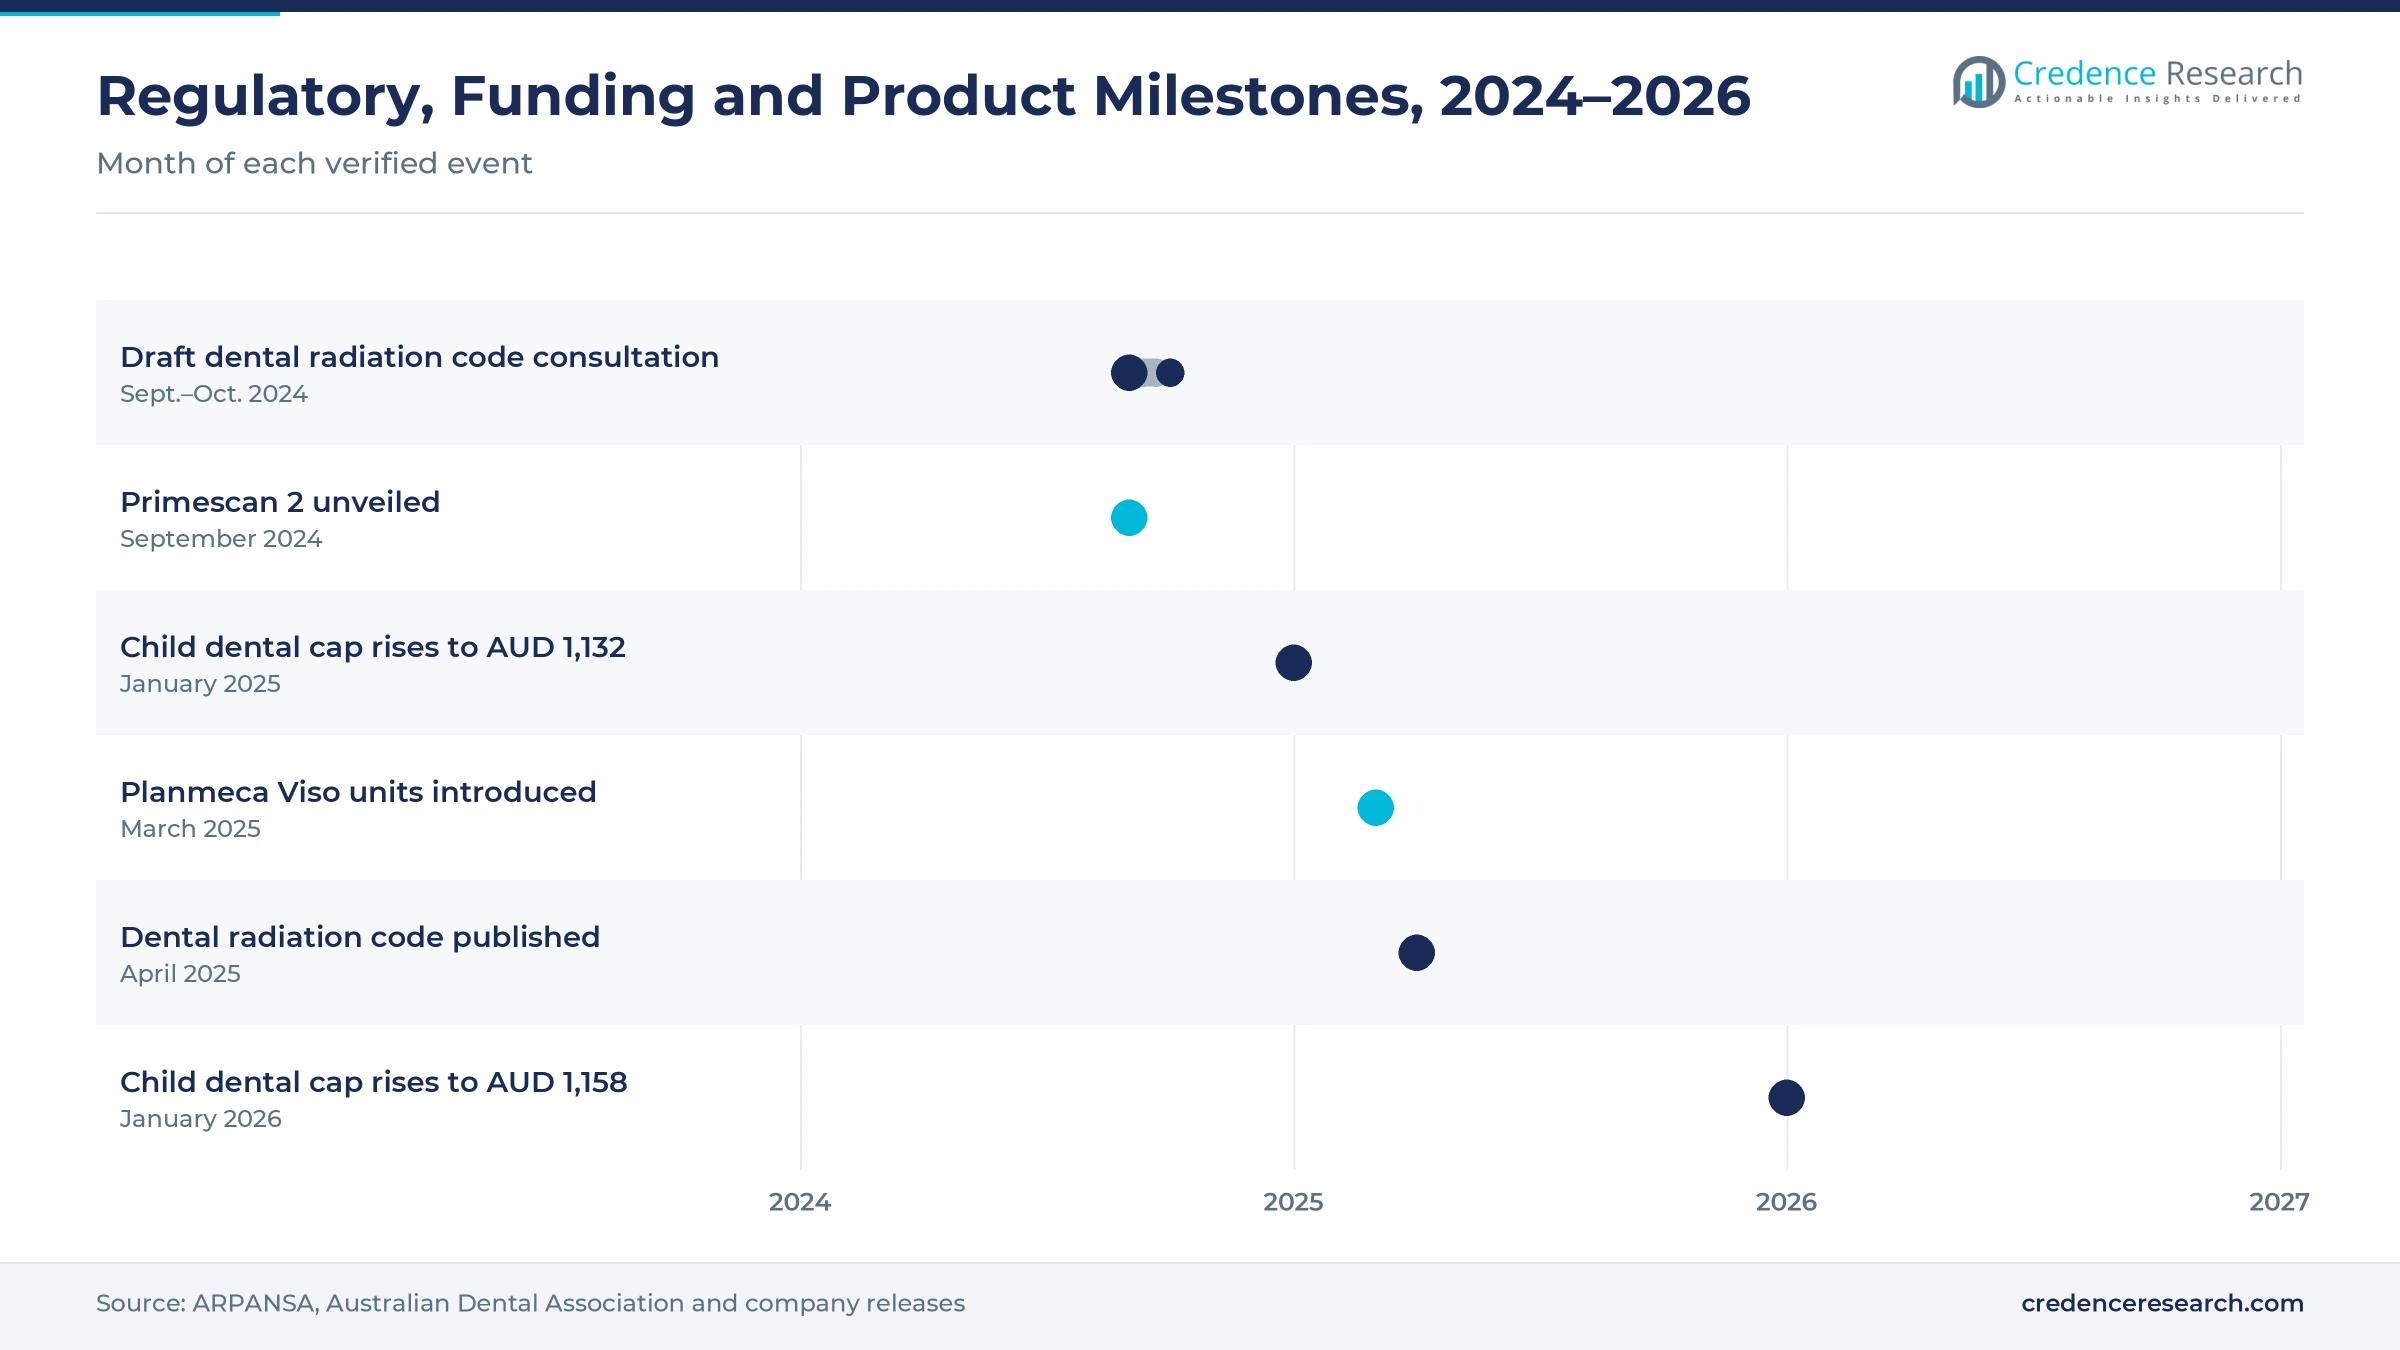
- The national radiation regulator published a new code for dental exposure in April 2025, after public consultation in late 2024.
- Imaging software grows fastest at 10.13% a year during 2026–2035, as cloud platforms and subscriptions change how clinics pay for tools.
Extraoral systems lead while imaging software grows fastest
Why do extraoral systems lead equipment value?
Based on product type, the market is categorized into intraoral X-ray systems, extraoral X-ray systems, dental imaging software and intraoral cameras. Extraoral X-ray systems led with a 38.0% share of 2025 value, because panoramic and cone beam units cost far more than sensors or cameras. Dental imaging software grows fastest at 10.13% a year, as clinics pay for cloud storage, viewing and planning tools by subscription.
How do routine checks and implant planning split use?
Based on application, the market is categorized into caries and periodontal assessment, implant and surgical planning, orthodontic assessment and endodontic and restorative assessment. Caries and periodontal assessment led with a 36.0% share of 2025 value, because bitewing and periapical images are taken at most checkups. Implant and surgical planning grows fastest at 9.66% a year, as more practices place implants after a three-dimensional scan.
Why do independent owners still buy the most equipment?
Based on end user, the market is categorized into independent practice owners, corporate dental groups, public dental providers and university purchasers. Independent practice owners led with a 52.0% share of 2025 value, because most Australian clinics remain owner-run. Corporate dental groups grow fastest at 9.75% a year, as multi-site groups standardize sensors, cone beam units and shared software across their clinics.
How do distributors and software sellers reach clinics?
Based on sales channel, the market is categorized into direct manufacturer sales, full-service dental distributors, specialist imaging suppliers and software-direct subscriptions. Full-service dental distributors led with 46.0% of 2025 value, because they bundle installation, training and service. Software-direct subscriptions grow fastest at 10.74% a year, as vendors sell cloud platforms, storage and artificial intelligence tools straight to clinics without a distributor in between.
| Segment Group | Leading Sub-segment | Share, 2025 | Fastest-growing Sub-segment | CAGR, 2026–2035 |
|---|---|---|---|---|
| By Product Type | Extraoral X-ray systems | 38.0% | Dental imaging software | 10.13% |
| By Application | Caries and periodontal assessment | 36.0% | Implant and surgical planning | 9.66% |
| By End User | Independent practice owners | 52.0% | Corporate dental groups | 9.75% |
| By Sales Channel | Full-service dental distributors | 46.0% | Software-direct subscriptions | 10.74% |
Request a Free Sample
Fill in your details and we'll send you a free sample report.
- Sample data tables & charts
- Research methodology
Replacement cycles, 3D workflows and software lift demand
How do digital replacement cycles keep equipment spending steady?
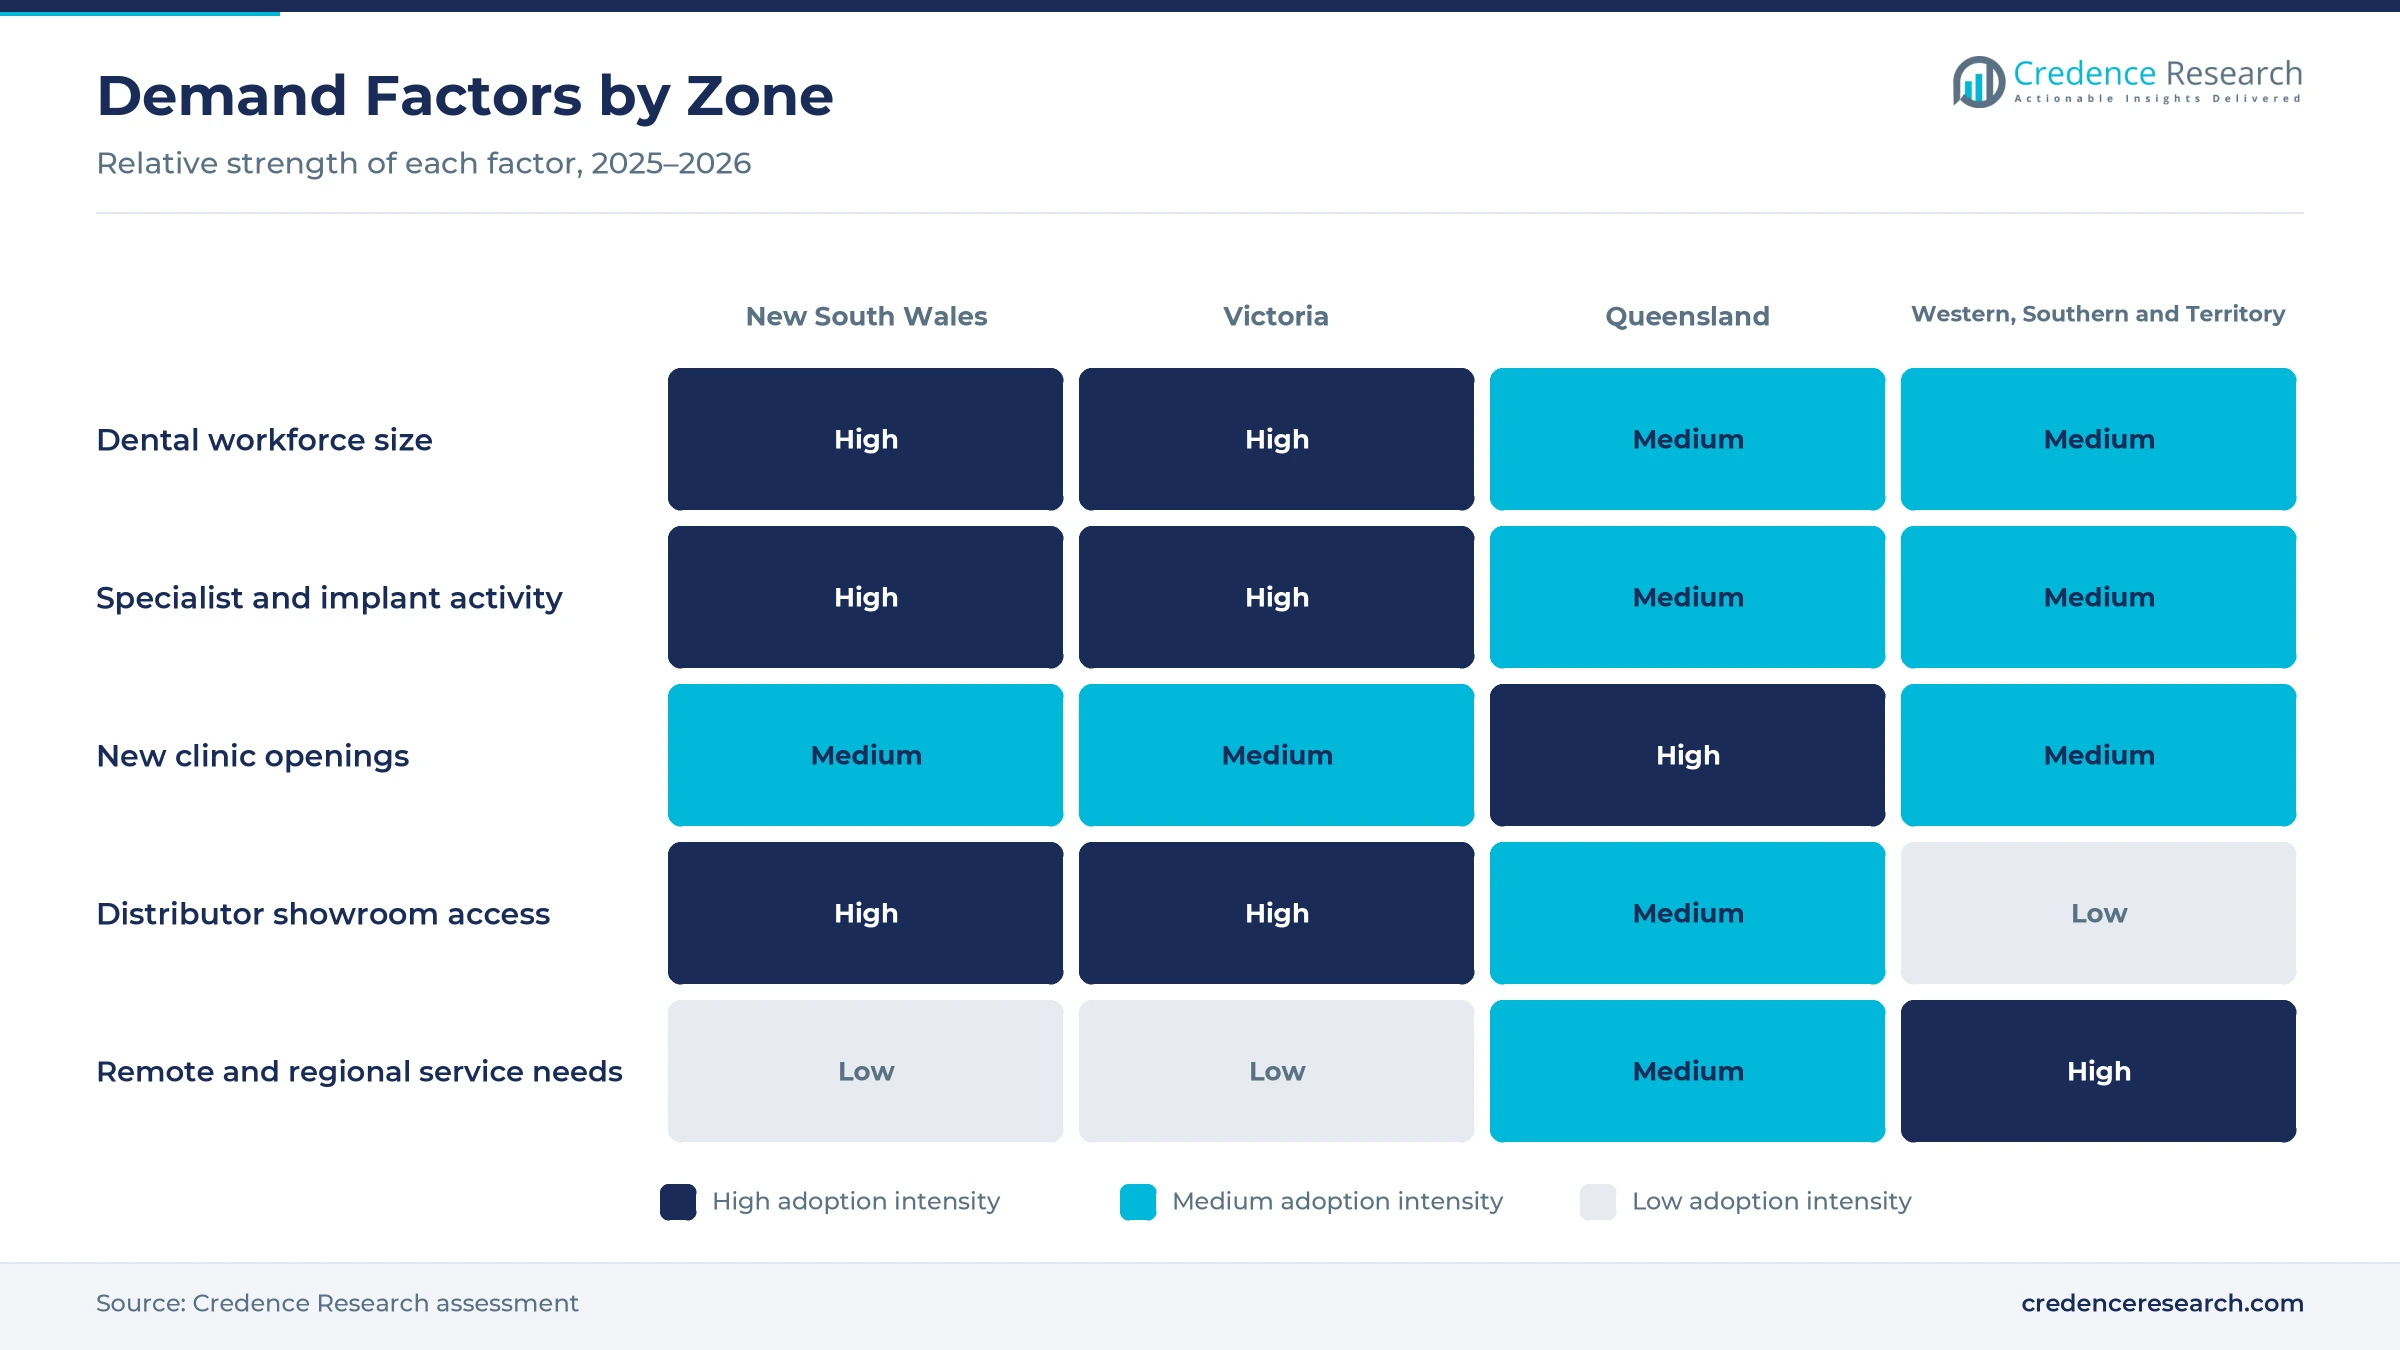
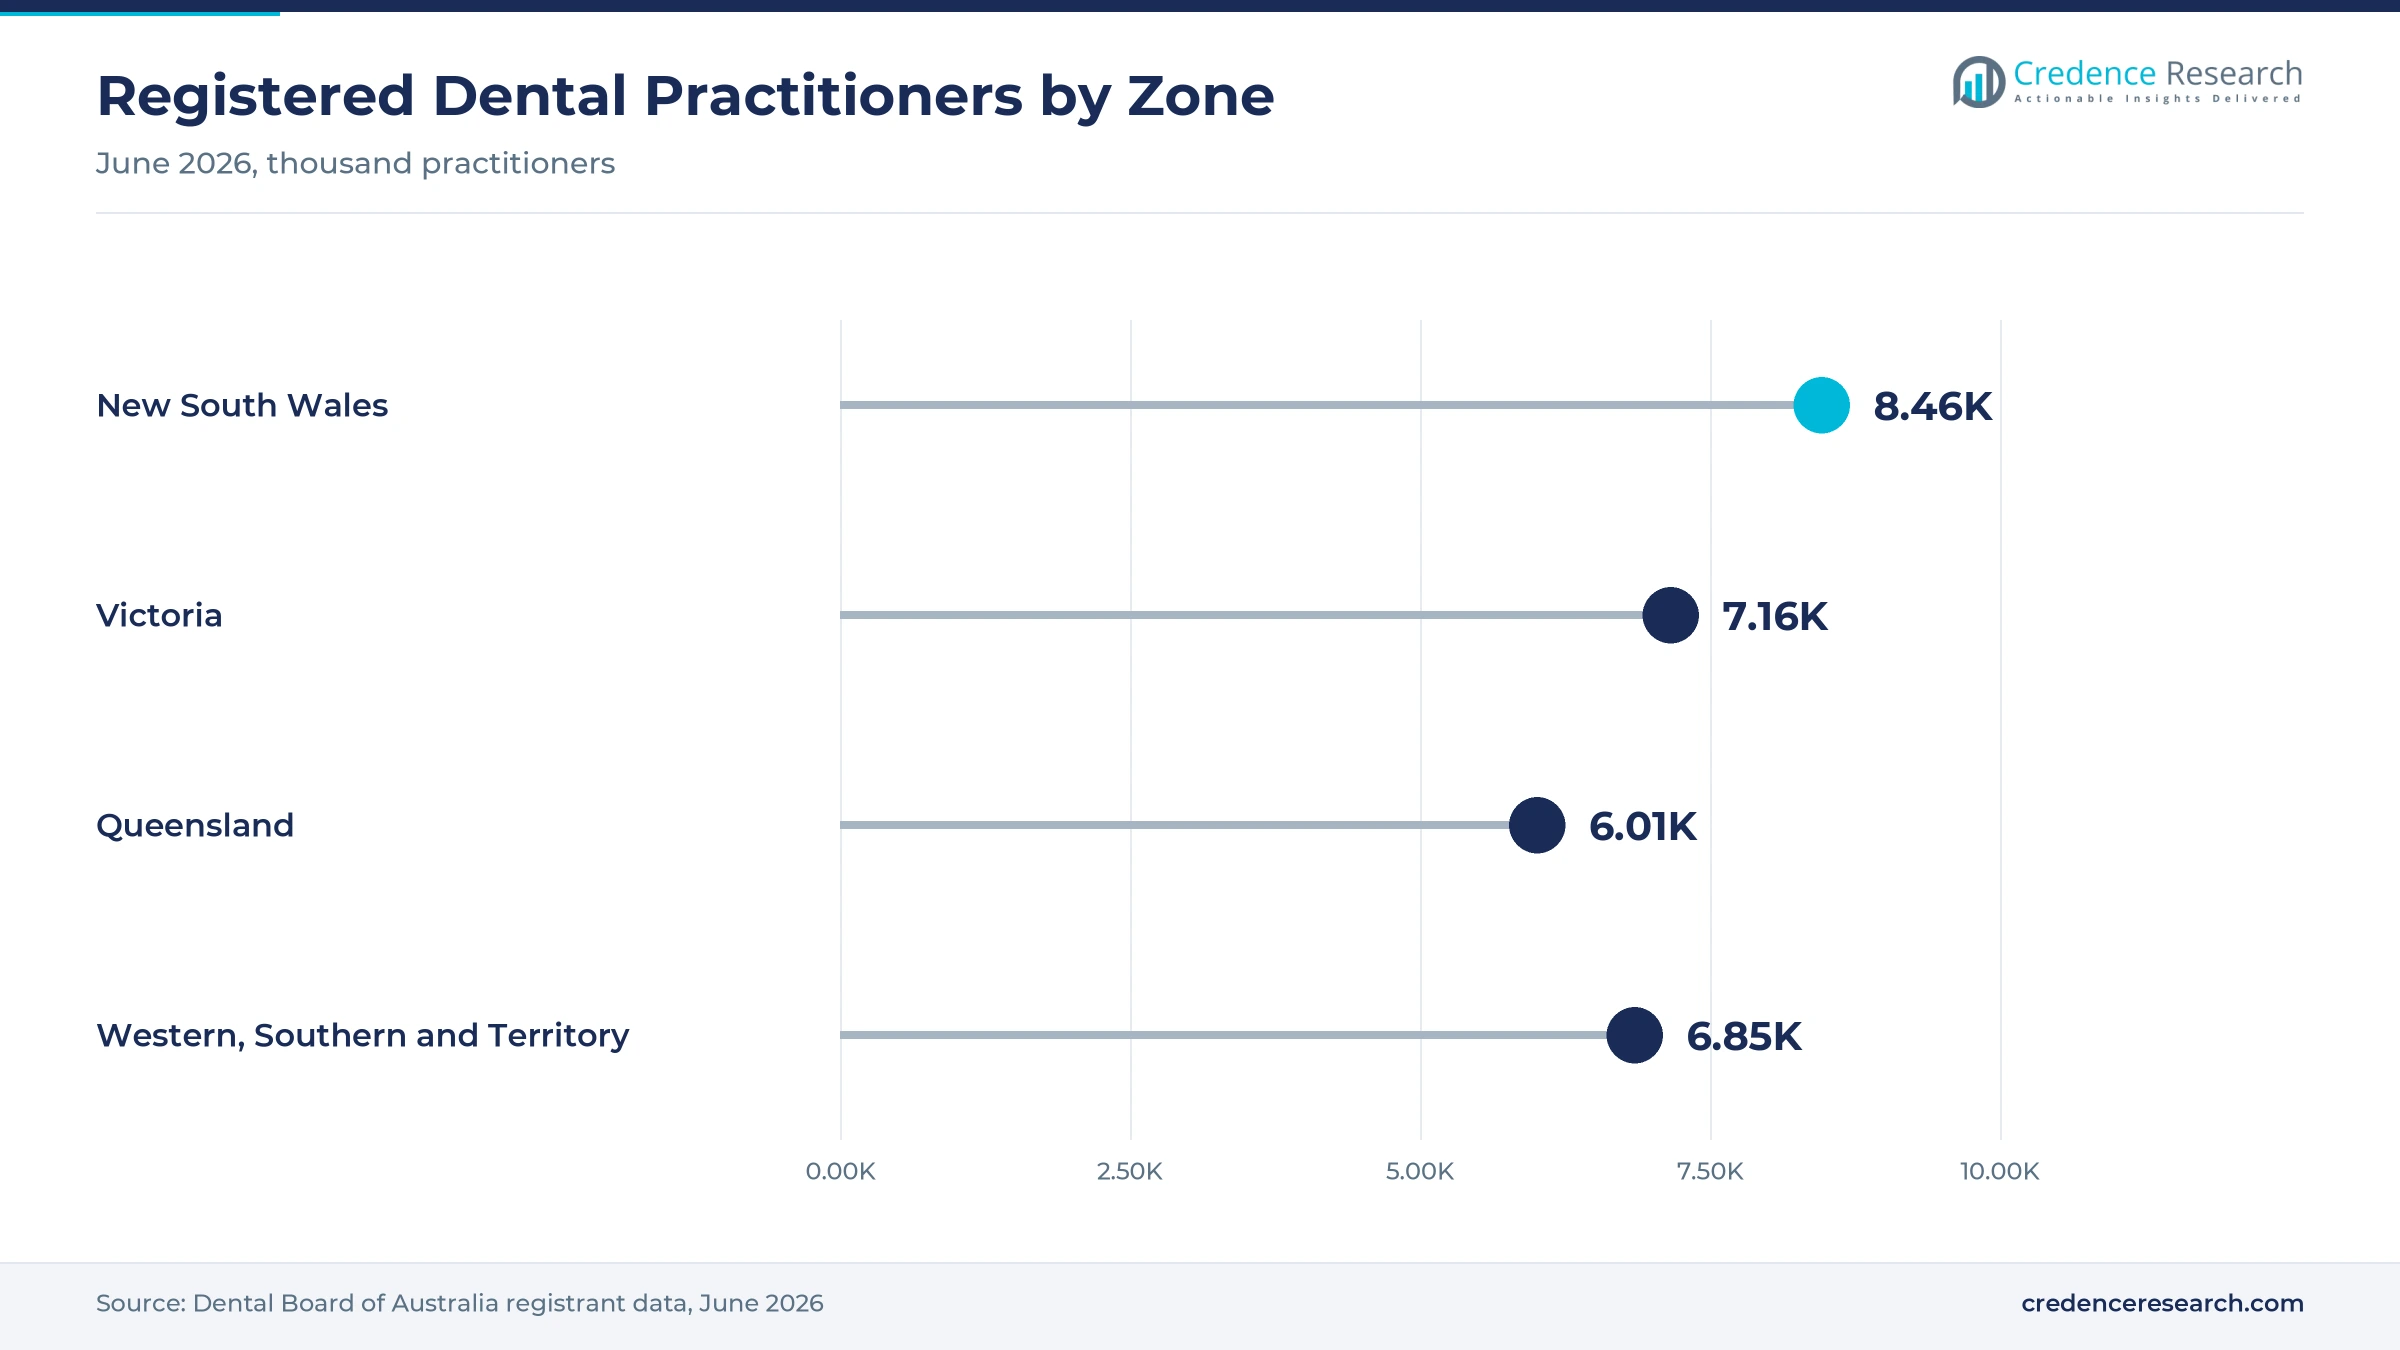
Digital replacement cycles keep equipment spending steady, because clinics that moved from film to sensors and plates a decade ago now replace aging units with faster, lower-dose models. The national workforce is large, with 29,351 registered dental practitioners and 21,840 dentists in June 2026, according to the Dental Board of Australia. Henry Schein Australia lists Dürr Dental VistaScan image plate scanners alongside Planmeca, Carestream, Acteon, KaVo and Gendex equipment, which gives practices several upgrade paths. Some 53.9% of people aged 15 years and over saw a dental professional in 2024-25, which keeps chairs busy and wears equipment. As a result, intraoral X-ray systems remain a core purchase even as their share slowly falls.
Why does cone beam use widen clinical workflows?
Cone beam use widens clinical workflows, because three-dimensional scans let general dentists plan implants, extractions and root canal care without referring every patient out. Planmeca introduced its Viso G1 cone beam unit and two new two-dimensional units in March 2025, with an ultra-low-dose protocol for lower patient exposure. IntegraDent distributes the Vatech range of intraoral, panoramic, cephalometric and cone beam systems in Australia, including small-field units priced under AUD 140,000. Specialists also hold 2,064 specialty registrations nationwide, which sustains demand for large-field scans. In turn, implant and surgical planning grows at 9.66% a year, the fastest application rate, as more general practices add cone beam computed tomography.
How does separately licensed software raise practice spending?
Separately licensed software raises practice spending, because vendors now charge for viewing, storage and planning tools on top of the hardware. Dentsply Sirona unveiled Primescan 2 on Sept. 5, 2024, as a cloud-native intraoral scanner that requires a paid DS Core subscription to operate. Planmeca also connects its new imaging units to Romexis software and its Insights platform, which ties hardware to ongoing software use. Pearl has received clearance from the national regulator for its Second Opinion artificial intelligence tool, which reads radiographs for decay and other findings. As a result, imaging software grows at 10.13% a year, the fastest product rate, while software-direct subscriptions grow at 10.74% a year.
How do public and child dental schemes support image volumes?
Public and child dental schemes support image volumes, because funded checkups for children and low-income adults usually include radiographs. The Child Dental Benefits Schedule cap rose to AUD 1,158 for treatment periods that begin in 2026, up from AUD 1,132 in 2025, according to the Australian Dental Association. A federal schedule for public dental services for adults also provides AUD 107.76 million for 2025-26 across all states and territories. Children aged 0 to 17 qualify when their parents receive Family Tax Benefit Part A or another relevant payment. In turn, public dental providers keep a steady share of equipment value, while caries and periodontal assessment holds 36.0% of 2025 value.
Cloud workflows, lower doses and AI review shape buying
How is the shift to cloud-connected imaging changing purchases?
The shift to cloud-connected imaging is changing purchases, because clinics now weigh data access and sharing as heavily as image quality. Primescan 2 stores and processes scan data automatically on DS Core, so clinicians can review cases and send lab orders from any connected device. Planmeca designed its 2025 imaging units to run with Romexis and the Insights connected-device platform, which tracks equipment use across sites. Corporate dental groups grow at 9.75% a year, the fastest end-user rate, because shared platforms suit multi-site networks. As a result, vendors that link sensors, panoramic units and intraoral scanners to one cloud record are gaining an edge in tenders and upgrades.
Why is the rise of lower-dose protocols notable for buyers?
The rise of lower-dose protocols is notable, because a new national code has renewed attention on how much radiation each scan delivers. The national radiation regulator ran public consultation on a draft dental code from Sept. 2 to Oct. 12, 2024, and published the final code in April 2025. Planmeca markets an ultra-low-dose cone beam protocol that it states lowers effective patient dose without a statistical loss of image quality. Severe periodontal diseases affect more than 1 billion cases worldwide, according to the World Health Organization, which keeps imaging central to diagnosis. In turn, clinics favor units with small fields of view and dose settings that suit children and repeat scans.
Can AI-supported radiograph review open new software revenue?
AI-supported radiograph review can open new software revenue, because it adds a paid layer on top of images that clinics already take. Pearl has secured regulatory clearance in Australia and New Zealand for Second Opinion, which flags decay, calculus and other findings on radiographs. Some 53.9% of Australians aged 15 years and over saw a dental professional in 2024-25, which shows how many visits could include an automated read. Oral diseases affect nearly 3.7 billion people worldwide, which gives detection tools a large clinical base. Australia also has 21,840 registered dentists who review radiographs at most visits, which creates a wide user base for automated second reads. As a result, software vendors and distributors that bundle AI review with practice management software can lift subscription value per clinic.
Is there room to reach patients who delay care?
Clinics have room to reach patients who delay care, because many Australians still put off visits due to cost. Some 25% of people delayed or did not see a dental professional when needed in 2024-25, the lowest share in five years, according to the Australian Bureau of Statistics. Some 16% cited cost as a barrier, while people in outer regional and remote areas were more likely to delay care than city residents. Public adult dental funding of AUD 107.76 million for 2025-26 also supports state clinics that treat low-income patients. In turn, suppliers that offer compact, lower-cost sensors and portable units for regional and public clinics can widen their customer base beyond the main capital cities.
Capital costs, radiation rules and patient costs test sales
How do high capital costs slow three-dimensional upgrades?
High capital costs slow three-dimensional upgrades, because even small-field cone beam units can cost well over AUD 100,000 before installation and shielding. Independent owners must finance these units from practice income or bank loans. As a result, many smaller clinics delay purchases or refer patients to radiology centers. Suppliers respond with leasing, trade-in offers and upgradeable panoramic units that add cone beam capability later, which spreads the cost over several years.
Why do radiation rules add work for every installation?
Radiation rules add work for every installation, because each state and territory licenses dental X-ray units and operators under its own laws. The new national code for dental exposure also sets requirements for protecting patients and workers. In turn, clinics face shielding checks, quality tests and record keeping. Distributors respond by bundling compliance support, physics testing and staff training with new equipment, which shortens approval times for buyers.
How do patient cost barriers limit image volumes?
Patient cost barriers limit image volumes, because most adult dental care in Australia is paid privately. Some 16% of people cited cost as a barrier to seeing a dental professional in 2024-25. As a result, fewer checkups mean fewer routine radiographs in lower-income areas. Clinics respond with payment plans, while public schemes cover children and some low-income adults through capped benefits and state clinics with waiting lists.
Why do software integration and data security worry clinics?
Software integration and data security worry clinics, because images from different brands often need separate viewers and storage. Cloud platforms also move patient records off site, which raises privacy and access questions for practice owners. In turn, clinics hesitate to switch systems or mix brands. Vendors respond with standard image formats, local support teams and clear data handling terms that explain where patient images are stored.
New South Wales leads as Queensland grows fastest
| Region | Value, 2025 (USD million) | Share, 2025 | CAGR, 2026–2035 |
|---|---|---|---|
| New South Wales | 19.6 | 30.9% | 8.67% |
| Western, Southern and Territory Markets | 17.2 | 27.1% | 8.47% |
| Victoria | 14.6 | 23.0% | 8.87% |
| Queensland | 12.1 | 19.0% | 9.27% |
Why does new South Wales hold the top share?
New South Wales held a 30.9% share of 2025 value and grows at 8.67% a year, because the state has the largest dental workforce in Australia. It counted 8,459 registered dental practitioners in June 2026, including 6,400 dentists. Sydney also hosts dental schools, specialist groups and the main showrooms of several distributors, which keeps demand for cone beam units and software high. As a result, the state leads both replacement purchases and new three-dimensional installations.
How does Victoria support equipment demand?
Victoria held a 23.0% share of 2025 value and grows at 8.87% a year, because Melbourne has a dense network of private and corporate clinics. The state counted 7,158 registered dental practitioners in June 2026, including 5,355 dentists. Henry Schein Halas runs a Victorian headquarters with showrooms and training facilities, which helps practices compare equipment before buying. In turn, Victoria remains the second-largest zone for sensors, panoramic units and imaging software.
Why is Queensland growing fastest?
Queensland held a 19.0% share of 2025 value and grows fastest at 9.27% a year, because population growth in south-east Queensland keeps adding new suburbs and clinics. The state counted 6,013 registered dental practitioners in June 2026, including 4,632 dentists. As a result, new practices fit out with digital sensors and panoramic units from the start. Regional centers along the coast also add demand for compact units that suit smaller clinics.
What shapes demand in the western, southern and territory markets?
Western, southern and territory markets held a 27.1% share of 2025 value and grow at 8.47% a year, because the zone combines large cities with remote areas. Western Australia counted 3,366 registered dental practitioners in June 2026 and South Australia counted 2,298. As a result, Perth and Adelaide drive most purchases, while remote clinics rely on compact units and regional service visits.
Radiation code, funding caps and launches, 2024–2026
| Development | Status and market relevance |
|---|---|
| In September 2024, the national radiation regulator opened public consultation on a draft code for radiation protection in dental exposure. | Consultation ran from Sept. 2 to Oct. 12, 2024 |
| In September 2024, Dentsply Sirona unveiled Primescan 2, a cloud-native intraoral scanner that runs on a paid DS Core subscription. | Ties scanning hardware to recurring software fees |
| In January 2025, the Child Dental Benefits Schedule cap rose to AUD 1,132 for treatment periods starting that year. | Supports funded checkups and radiographs for eligible children |
| In March 2025, Planmeca introduced the Viso G1 cone beam unit and the Viso 2D Pro and 2D Classic units. | Adds an ultra-low-dose protocol and motion correction |
| In April 2025, the national radiation regulator published its new code for radiation protection in dental exposure. | Sets national requirements for patients and workers |
Sensors, cone beam scans and cloud software change care
- Digital sensors and image plates replace film for bitewing and periapical views, which cuts processing time and lets clinics store images in practice software.
- Cone beam computed tomography creates three-dimensional views of bone and nerves, which supports implant placement, surgical planning and complex root canal care.
- Cloud imaging platforms store and process scans off site, which lets clinicians share cases with labs and specialists and plan implant treatment from any device.
Need a Custom Version of This Report?
Tailor the scope, geography, or segments to your exact requirements.
- Custom geography or segment scope
- Direct access to our analyst team
Global equipment makers and national distributors compete
Competition is split between global equipment makers and the national distributors that install and service their units. Dentsply Sirona markets Primescan 2 and its cloud platform to Australian clinics through a local website. Henry Schein Halas runs state showrooms and sells Dürr Dental image plate scanners alongside Planmeca, Carestream, Acteon, KaVo and Gendex equipment. IntegraDent distributes the Vatech range of intraoral, panoramic, cephalometric and cone beam systems from a Sydney showroom. Ray Australia supplies Ray scanners and X-ray units to local practices. Rivals compete on image quality, dose, field of view, software links, service response and price. Because most clinics rely on distributors for installation and compliance testing, brands with strong local service teams win more replacement orders.
Which companies supply imaging equipment in Australia?
| Company | Type | Role in the market |
|---|---|---|
| Dentsply Sirona | Global equipment maker | Markets Primescan 2 and DS Core cloud software to Australian clinics |
| Henry Schein Australia | National distributor | Sells Dürr Dental, Planmeca, Carestream and Acteon imaging equipment |
| VATECH | Global equipment maker | Intraoral, panoramic and cone beam range distributed by IntegraDent |
| Planmeca | Global equipment maker | Launched Viso cone beam and two-dimensional units in March 2025 |
| DÜRR DENTAL | Global equipment maker | VistaScan image plate scanners sold through national distributors |
Credence Research view on oral radiography demand
Credence Research's view is that Australian demand for oral radiography equipment will grow steadily because clinics keep replacing older digital units and add three-dimensional scans for implant and surgical care. Extraoral systems remain the largest value pool, while software adds the fastest growth as vendors move to cloud subscriptions. A new national radiation code is likely to favor lower-dose units. Suppliers that combine strong local service, clear software pricing and financing options should gain share fastest, while patient cost barriers will keep some smaller clinics from upgrading.
How the national oral radiography estimate was built
The report uses 2025 as the base year on a calendar basis, and market values come from the Credence Research model. That model combines dental workforce registrations, national health service use statistics, public dental funding schedules, regulator publications and company product announcements. Segment splits and zone growth rates are Credence Research estimates, while zone shares follow the client-defined split. Sources used are official statistics, government releases, professional association updates and company releases, and no interviews or surveys were used.
3D planning and software subscriptions carry growth to 2035
Equipment and software value is expected to reach USD 160.0 million by 2035, an 8.78% CAGR during 2026–2035, as clinics upgrade sensors, add cone beam units and pay for cloud tools. Growth should stay strong through 2030 while corporate groups standardize their fleets. After that, software subscriptions and replacement cycles will carry more of the value. Stronger public funding would lift image volumes, while tighter practice budgets would delay large purchases. Suppliers with local service and lower-dose units are expected to gain the most.
Frequently Asked Questions
How big is the Australia dental imaging market?
Which product type leads Australian equipment value?
Which region leads the Australian market?
How many dental practitioners are registered in Australia?
How did the radiation rules change for dental X-rays?
Which application is growing fastest?
Who are the leading companies in the Australian market?
What are the main challenges for suppliers?
Table of Content
Chapter 1 Market Segmentation
- 1.1 Segmentation Framework
- 1.1.1 Product and Service Classification
- 1.1.2 Application and End-Use Classification
- 1.1.3 Technology and Solution Classification
- 1.1.4 Customer and Distribution Channel Classification
- 1.1.5 Geographic Segmentation
- 1.1.6 Market Segment Definitions and Boundaries
- 1.2 By Product Type
- 1.2.1 Extraoral X-ray systems
- 1.2.2 Intraoral X-ray systems
- 1.2.3 Dental imaging software
- 1.2.4 Intraoral cameras
- 1.3 By Application
- 1.3.1 Caries and periodontal assessment
- 1.3.2 Implant and surgical planning
- 1.3.3 Orthodontic assessment
- 1.3.4 Endodontic and restorative assessment
- 1.4 By End User
- 1.4.1 Independent practice owners
- 1.4.2 Corporate dental groups
- 1.4.3 Public dental providers
- 1.4.4 University purchasers
- 1.5 By Sales Channel
- 1.5.1 Full-service dental distributors
- 1.5.2 Direct manufacturer sales
- 1.5.3 Specialist imaging suppliers
- 1.5.4 Software-direct subscriptions
Chapter 2 Introduction
- 2.1 Report Objectives and Scope
- 2.2 Product Definition and Industry Terminology
- 2.3 Market Inclusions and Exclusions
- 2.4 Research Process
- 2.4.1 Primary Research and Expert Interviews
- 2.4.2 Secondary Research and Source Review
- 2.4.3 Top-Down and Bottom-Up Estimation
- 2.4.4 Data Triangulation and Verification
- 2.5 Market Size Measurement Basis
- 2.5.1 2025: USD 63.5 million → 2035: USD 160.0 million
- 2.6 Historical and Forecast Reference Periods
- 2.6.1 Historical Period: 2018-2025
- 2.6.2 Base Year: 2025
- 2.6.3 Forecast Period: 2025-2035
- 2.7 Research Assumptions and Limitations
Chapter 3 Executive Summary
- 3.1 Market Snapshot and Key Findings
- 3.2 Base-Year Market Size, 2025
- 3.3 Forecast Market Size, 2035
- 3.4 Revenue and Volume Growth Outlook
- 3.5 Key Demand and Supply Indicators
- 3.6 Leading Market Segments
- 3.7 Fastest-Growing Market Opportunities
- 3.8 Regional Performance Highlights
- 3.9 Technology and Industry Transformation
- 3.10 Competitive Landscape Summary
- 3.11 Analyst View and Strategic Implications
Chapter 4 Australia Dental Imaging Market Trends and Developments
- 4.1 Historical Industry Development, 2018-2025
- 4.2 Recent Market Trends and Developments
- 4.3 Demand and Customer Behavior Trends
- 4.4 Technology and Product Innovation
- 4.5 Artificial Intelligence, Automation and Digitalization
- 4.6 Local Manufacturing and Supply Chain Realignment
- 4.7 Industry Partnerships, Mergers and Acquisitions
- 4.8 Sustainability and Circular Economy Developments
- 4.9 Government and Private Sector Investment Trends
- 4.10 Emerging Business Models and Commercialization
- 4.11 Industry Developments and Announcements
Chapter 5 Australia Dental Imaging Market Production, Supply and Demand Analysis
- 5.1 Demand Trend and Consumption Analysis, 2018-2025
- 5.2 Demand Forecast, 2025-2035
- 5.3 Production and Output Trend, 2018-2025
- 5.4 Production and Output Forecast, 2025-2035
- 5.5 Installed Capacity and Capacity Utilization
- 5.6 Company-Wise Production Plants and Statistics
- 5.6.1 Installed Production Capacity
- 5.6.2 Actual Production
- 5.6.3 Planned Capacity and Expansion Targets
- 5.7 Supply Chain Structure and Procurement Trends
- 5.8 Supply-Demand Gap and Bottlenecks
- 5.9 Import Dependence and Sourcing Structure
- 5.10 Contract Manufacturing and Outsourcing
- 5.11 Regional Supply and Demand Concentration
Chapter 6 Australia Dental Imaging Market Pricing Analysis
- 6.1 Pricing Structure and Measurement
- 6.2 Historical Pricing Trends, 2018-2025
- 6.3 Pricing Outlook, 2025-2035
- 6.4 Average Selling Price and Unit Economics
- 6.5 Pricing by Product and Market Segment
- 6.6 Geographic Pricing Differences
- 6.7 Key Input, Energy, Labor and Logistics Costs
- 6.8 Contract Pricing and Purchasing Models
- 6.9 Pricing Sensitivity and Competitive Positioning
- 6.10 Price, Margin and Profitability Implications
Chapter 7 Australia Dental Imaging Market Dynamics
- 7.1 Market Growth Drivers
- 7.1.1 Demand-Side Drivers
- 7.1.2 Technology and Innovation Drivers
- 7.1.3 Infrastructure and Investment Drivers
- 7.1.4 Regulatory and Policy Drivers
- 7.2 Market Restraints
- 7.2.1 Cost and Affordability Constraints
- 7.2.2 Technology and Adoption Barriers
- 7.2.3 Supply Chain and Operational Constraints
- 7.3 Market Challenges
- 7.3.1 Competitive Pressure and Margin Erosion
- 7.3.2 Skills, Infrastructure and Implementation Gaps
- 7.4 Emerging Market Opportunities
- 7.5 Market Dynamics Impact and Time-Horizon Assessment
Chapter 8 Australia Dental Imaging Value Chain Analysis
- 8.1 Industry Value Chain Overview
- 8.2 Upstream Suppliers and Critical Inputs
- 8.3 Technology and Component Providers
- 8.4 Manufacturing or Service Delivery
- 8.5 Distribution, Channel Partners and Integrators
- 8.6 Downstream Applications and End Users
- 8.7 Value Addition and Profit Pools
- 8.8 Vertical Integration and Outsourcing
- 8.9 Supplier Concentration and Risk
- 8.10 Supply Chain Localization and Resilience
Chapter 9 Australia Dental Imaging Market Regulations and Policies
- 9.1 Relevant Laws, Standards and Compliance Frameworks
- 9.2 Product, Service, Safety and Quality Requirements
- 9.3 Government Policies, Incentives and Subsidies
- 9.4 Imports, Exports and Trade Barriers
- 9.5 Public Procurement and Local Content Requirements
- 9.6 Environmental and Sustainability Compliance
- 9.7 Upcoming Policy Changes and Market Implications
Chapter 10 Australia Dental Imaging Market Hotspots and Opportunities
- 10.1 Market Opportunity Mapping and Growth Hotspots
- 10.2 High-Growth Applications and Customer Groups
- 10.3 Underserved Markets and White-Space Opportunities
- 10.4 Emerging Technology and Product Opportunities
- 10.5 New Capacity and Investment Hotspots
- 10.6 Market Entry and Expansion Opportunities
- 10.7 Distribution and Partnership Opportunities
- 10.8 Near-Term and Long-Term Commercial Potential
- 10.9 Opportunity Attractiveness and Execution Risks
Chapter 11 Australia Dental Imaging Market Outlook, 2025-2035
- 11.1 Market Size and Analysis
- 11.1.1 Revenue (Market Measurement: 2025: USD 63.5 million → 2035: USD 160.0 million)
- 11.1.2 Market Volume and Quantity Sold
- 11.1.3 Historical Market Size, 2018-2025
- 11.1.4 Base-Year Market Size, 2025
- 11.2 Market Forecast, 2025-2035
- 11.2.1 Revenue Forecast to 2035
- 11.2.2 Volume Forecast to 2035
- 11.2.3 CAGR and Year-on-Year Growth
- 11.2.4 Incremental Revenue Opportunity
- 11.3 Forecast Assumptions and Scenario Analysis
- 11.3.1 Base-Case Forecast
- 11.3.2 Optimistic and Conservative Scenarios
- 11.3.3 Technology, Pricing and Policy Sensitivities
- 11.4 Market Attractiveness and Growth Outlook
Chapter 12 Australia Dental Imaging Market Segmentation and Outlook
- 12.1 Segmentation Summary and Market Shares, 2025
- 12.2 Largest and Fastest-Growing Segments
- 12.3 By Product Type - Market Size and Forecast, 2025-2035
- 12.3.1 Segment Definition and Scope
- 12.3.2 Historical Market Size, 2018-2025
- 12.3.3 Revenue Forecast, 2025-2035
- 12.3.4 Volume Forecast, 2025-2035
- 12.3.5 Base-Year Market Share, 2025
- 12.3.6 Segment CAGR and Growth Drivers
- 12.3.7 Subsegment Market Size and Forecast
- 12.3.7.1 Extraoral X-ray systems
- 12.3.7.2 Intraoral X-ray systems
- 12.3.7.3 Dental imaging software
- 12.3.7.4 Intraoral cameras
- 12.3.8 Subsegment Pricing and Adoption Trends
- 12.3.9 Leading Suppliers and Competition
- 12.3.10 Regional Demand and Opportunities
- 12.4 By Application - Market Size and Forecast, 2025-2035
- 12.4.1 Segment Definition and Scope
- 12.4.2 Historical Market Size, 2018-2025
- 12.4.3 Revenue Forecast, 2025-2035
- 12.4.4 Volume Forecast, 2025-2035
- 12.4.5 Base-Year Market Share, 2025
- 12.4.6 Segment CAGR and Growth Drivers
- 12.4.7 Subsegment Market Size and Forecast
- 12.4.7.1 Caries and periodontal assessment
- 12.4.7.2 Implant and surgical planning
- 12.4.7.3 Orthodontic assessment
- 12.4.7.4 Endodontic and restorative assessment
- 12.4.8 Subsegment Pricing and Adoption Trends
- 12.4.9 Leading Suppliers and Competition
- 12.4.10 Regional Demand and Opportunities
- 12.5 By End User - Market Size and Forecast, 2025-2035
- 12.5.1 Segment Definition and Scope
- 12.5.2 Historical Market Size, 2018-2025
- 12.5.3 Revenue Forecast, 2025-2035
- 12.5.4 Volume Forecast, 2025-2035
- 12.5.5 Base-Year Market Share, 2025
- 12.5.6 Segment CAGR and Growth Drivers
- 12.5.7 Subsegment Market Size and Forecast
- 12.5.7.1 Independent practice owners
- 12.5.7.2 Corporate dental groups
- 12.5.7.3 Public dental providers
- 12.5.7.4 University purchasers
- 12.5.8 Subsegment Pricing and Adoption Trends
- 12.5.9 Leading Suppliers and Competition
- 12.5.10 Regional Demand and Opportunities
- 12.6 By Sales Channel - Market Size and Forecast, 2025-2035
- 12.6.1 Segment Definition and Scope
- 12.6.2 Historical Market Size, 2018-2025
- 12.6.3 Revenue Forecast, 2025-2035
- 12.6.4 Volume Forecast, 2025-2035
- 12.6.5 Base-Year Market Share, 2025
- 12.6.6 Segment CAGR and Growth Drivers
- 12.6.7 Subsegment Market Size and Forecast
- 12.6.7.1 Full-service dental distributors
- 12.6.7.2 Direct manufacturer sales
- 12.6.7.3 Specialist imaging suppliers
- 12.6.7.4 Software-direct subscriptions
- 12.6.8 Subsegment Pricing and Adoption Trends
- 12.6.9 Leading Suppliers and Competition
- 12.6.10 Regional Demand and Opportunities
- 12.7 Segment Growth Comparison
- 12.8 Segment Attractiveness and Priority Matrix
Chapter 13 Australia Dental Imaging End-Use and Application Market Outlook
- 13.1 End-Use Industry and Customer Demand Structure
- 13.2 Leading Applications and Customer Groups
- 13.3 End-Use Market Size, Share and Forecast
- 13.4 Major End-Use Industry Deep Dives
- 13.4.1 Customer Requirements and Use Cases
- 13.4.2 Demand and Replacement Cycles
- 13.4.3 Technical and Regulatory Considerations
- 13.4.4 Purchasing and Procurement Models
- 13.4.5 Leading Vendors and Distribution Channels
- 13.4.6 Forecast and Commercial Opportunities
- 13.5 Emerging Applications and Cross-Segment Demand
- 13.6 End-Use Industry Investment Priorities
Chapter 14 Australia Dental Imaging Geographic Market Outlook, 2025-2035
- 14.1 Domestic Market Distribution and Demand Clusters
- 14.2 State- or Province-Wise Market Size and Forecast, 2025-2035
- 14.3 City and Metropolitan Market Outlook
- 14.4 Industrial, Manufacturing and Commercial Clusters
- 14.5 Geographic Concentration of Key End Users
- 14.6 Local Pricing and Purchasing Differences
- 14.7 Domestic Production Facilities and Capacity Map
- 14.8 Local Infrastructure and Project Pipeline
- 14.9 State-Level Policy and Incentive Differences
- 14.10 Subnational Investment Hotspots and Opportunities
- 14.11 Distribution and Logistics Networks
- 14.12 Domestic Competitive Footprint
Chapter 15 Australia Dental Imaging Technology, Innovation and Sustainability Outlook
- 15.1 Technology Landscape and Maturity
- 15.2 Product, Process and Service Innovation
- 15.3 AI, Automation and Digital Tools in the Industry
- 15.4 Technology Adoption and Performance Benchmarking
- 15.5 Innovation Pipeline and R&D Investment
- 15.6 Patent and Intellectual Property Trends
- 15.7 Energy Efficiency and Resource Management
- 15.8 Sustainability, Recycling and Circularity
- 15.9 Technology Roadmap, 2025-2035
- 15.10 Risks of Obsolescence and Technology Substitution
Chapter 16 Australia Dental Imaging Market Key Strategic Imperatives
- 16.1 Growth and Market Entry Priorities
- 16.2 High-Return Products and Segments
- 16.3 Pricing, Profitability and Cost Optimization
- 16.4 Technology Investment and Product Differentiation
- 16.5 Supply Chain Localization and Resilience
- 16.6 Distribution and Customer Acquisition
- 16.7 Partnership, Acquisition and Capacity Strategy
- 16.8 Regional Expansion Priorities
- 16.9 Short-, Medium- and Long-Term Actions
Chapter 17 Competition Outlook
- 17.1 Industry Competition Characteristics
- 17.2 Market Structure and Concentration
- 17.3 Market Share and Competitive Positioning, 2025
- 17.4 Company-Wise Revenue and Product Benchmarking
- 17.5 Production and Service Capacity Benchmarking
- 17.6 Technology, Pricing and Differentiation
- 17.7 Regional Footprint and Distribution Strength
- 17.8 Mergers, Acquisitions and Strategic Alliances
- 17.9 New Entrants and Competitive Threats
- 17.10 Porter's Five Forces and Industry Attractiveness
- 17.11 Competitive Outlook, 2025-2035
Chapter 18 Company Profiles
- 18.1 Company Coverage and Selection Criteria
- 18.2 Dentsply Sirona
- 18.2.1 Business Description
- 18.2.2 Company Ownership and Geographic Presence
- 18.2.3 Product and Service Portfolio
- 18.2.4 Manufacturing and Operating Footprint
- 18.2.5 Production Capacity and Expansion Plans
- 18.2.6 Financial Performance and Investment
- 18.2.7 Market Share and Competitive Position
- 18.2.8 Technology and Innovation Capabilities
- 18.2.9 Strategic Alliances or Partnerships
- 18.2.10 Recent Developments
- 18.2.11 Growth Strategy and Outlook
- 18.3 Henry Schein Australia
- 18.4 DEXIS
- 18.5 Carestream Dental
- 18.6 VATECH
- 18.7 Ray Australia
- 18.8 ACTEON
- 18.9 Planmeca
- 18.10 DÜRR DENTAL
- 18.11 Shimadzu Oceania
- 18.12 Other Relevant Market Participants
Note: Every listed company is profiled on the structure shown under the first company. The company list is preliminary and may change based on research findings, market developments, data availability and client requirements.
Chapter 19 Disclaimer
- 19.1 Research and Forecast Disclaimer
- 19.2 Data Source and Estimation Limitations
Note: The depth of individual sections depends on data availability for this market. Volume, capacity, trade and other unit-based metrics are included where applicable.

