
Steelmaking needs and import supply shape alloy demand
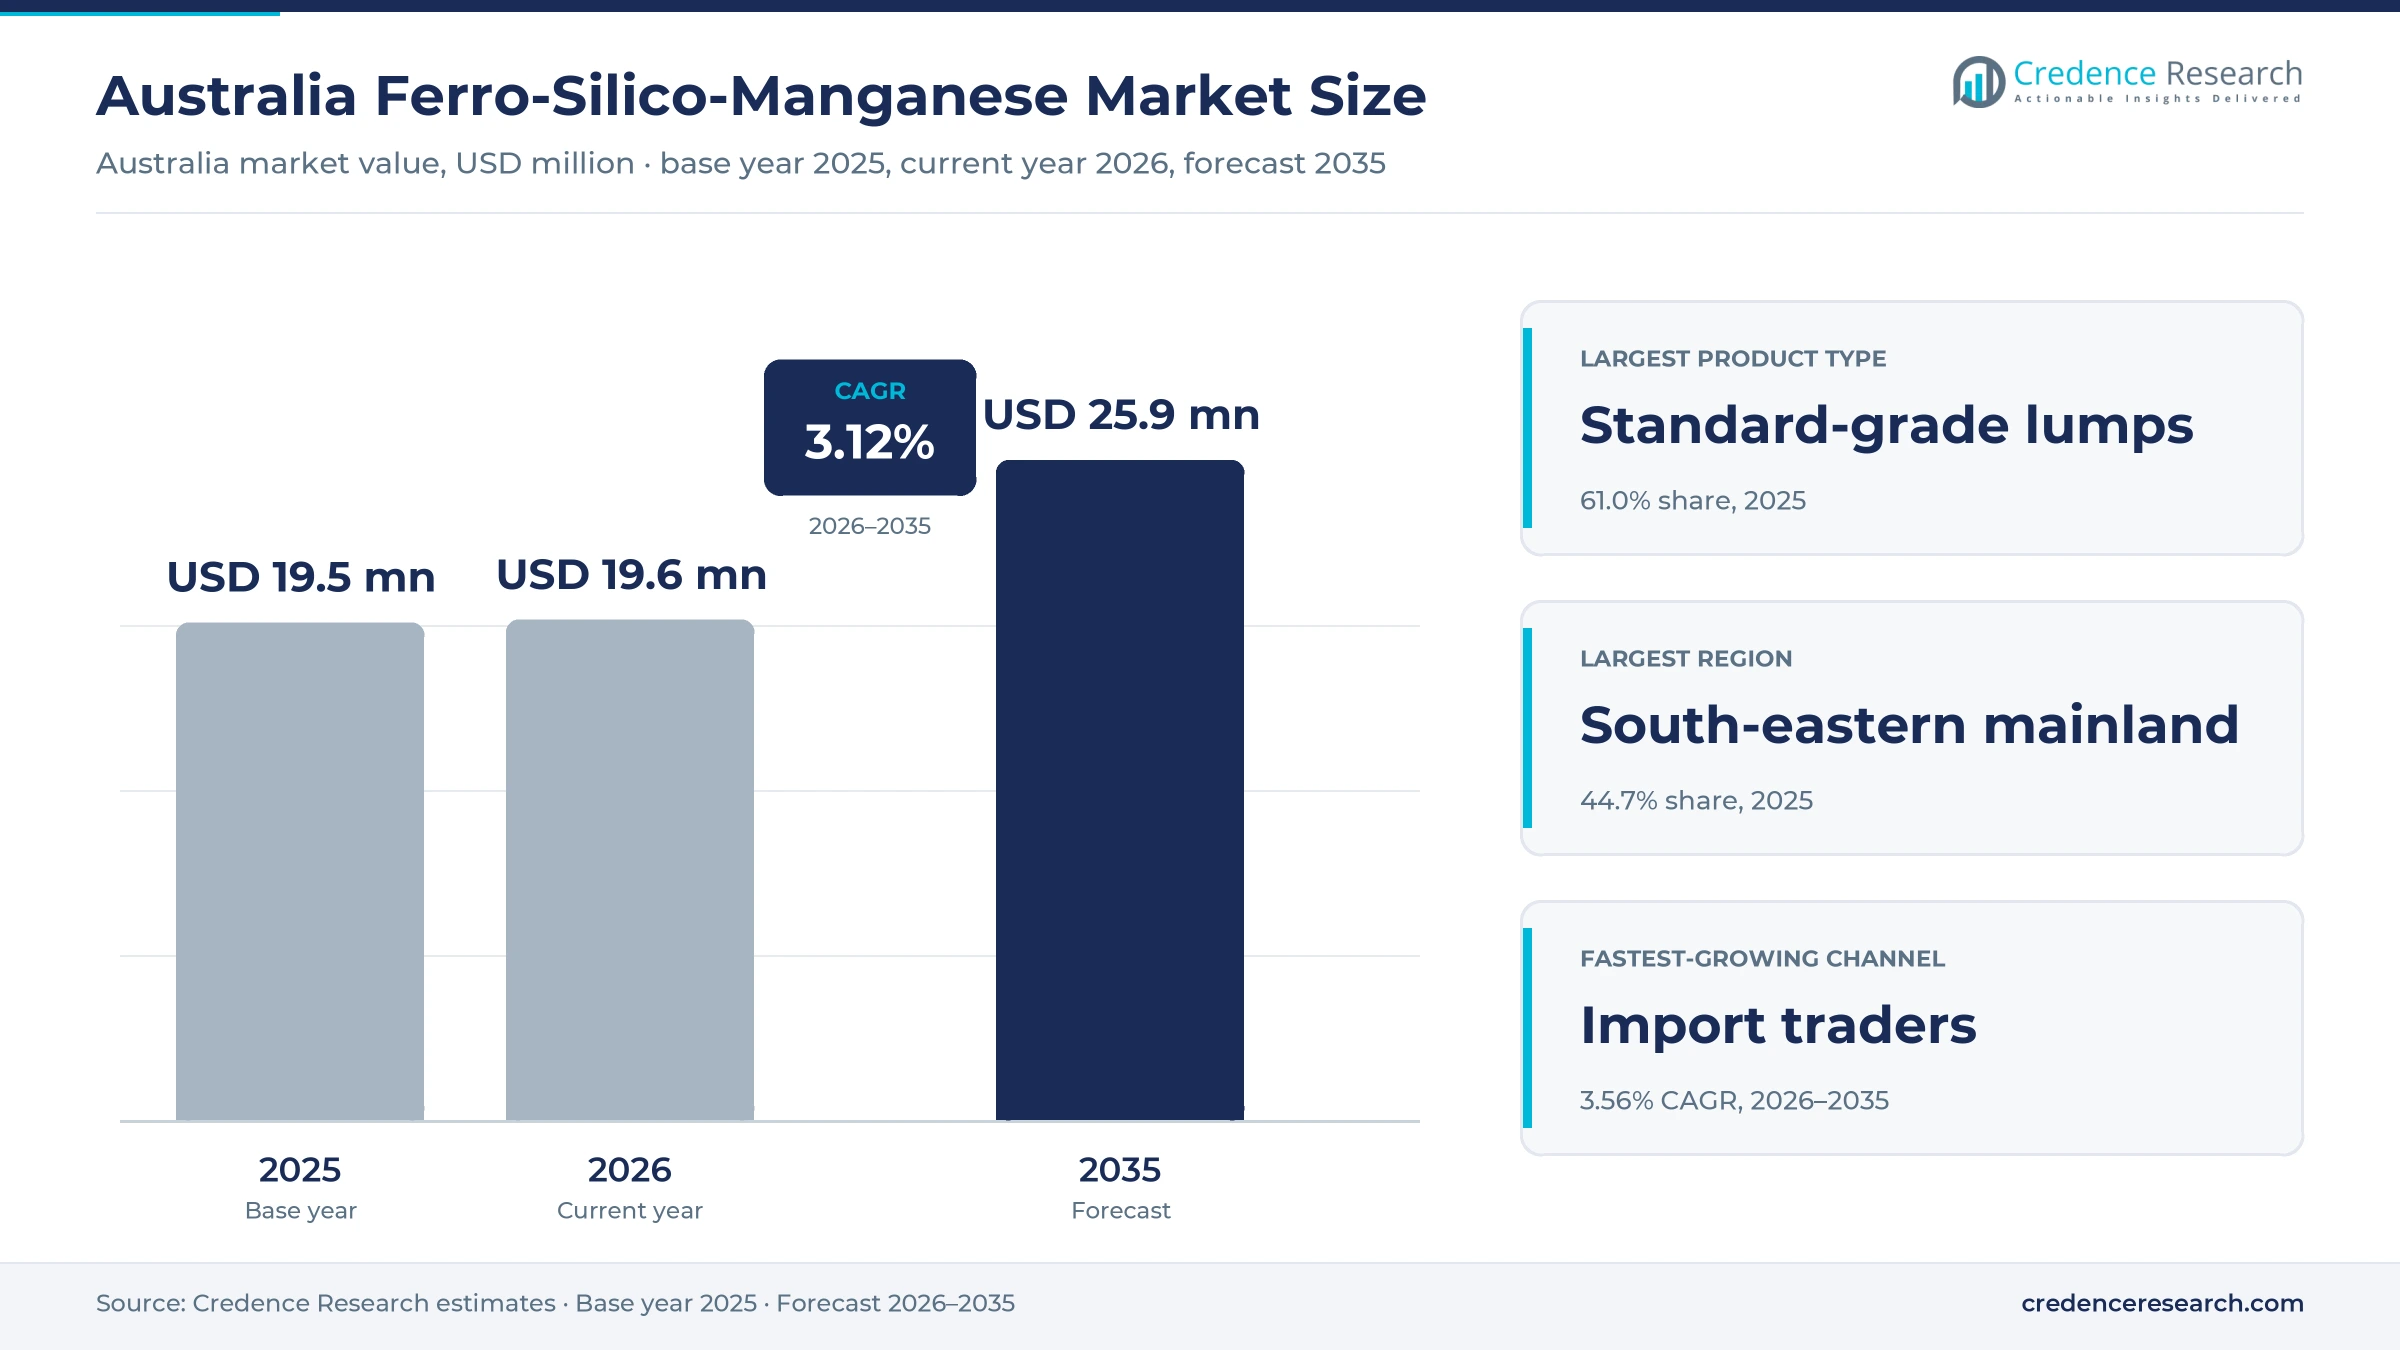
The Australia ferro-silico-manganese market was valued at USD 19.5 million in 2025 and is projected to increase from USD 19.6 million in 2026 to USD 25.9 million by 2035, registering a CAGR of 3.12% during 2026–2035. Demand comes from steelmakers and foundries that add the alloy to molten steel to remove oxygen and to set manganese and silicon levels in carbon and alloy grades. The south-eastern mainland held the largest regional share, 44.7% in 2025, because Victoria and South Australia host large electric arc and integrated steel operations. New South Wales is the fastest-growing region at 3.38% a year, as electric furnace capacity in Sydney expands. In turn, the country lost its only domestic manganese alloy smelter output after Liberty Bell Bay in Tasmania stopped production in mid-2025, which shifted most purchases to imported material from India and other Asian suppliers.
Which manganese alloy products does the estimate cover?
The estimate measures the value of ferro-silico-manganese sold to Australian steelmakers, foundries and stockholding distributors as standard-grade lumps, higher-manganese lumps and fines. It counts both domestic smelter sales and imported material that traders bring in under annual offtake, quarterly tenders and spot purchases.
The estimate excludes ferromanganese, ferrosilicon, manganese ore and electrolytic manganese metal. The value chain runs from manganese ore and quartz through smelters in Tasmania and Asia to import traders, distributors and the steel and foundry plants that add the alloy during melting and refining.
Australia Ferro-Silico-Manganese Market Insights
- The Australia ferro-silico-manganese market was valued at USD 19.5 million in 2025 and is projected to reach USD 25.9 million by 2035, registering a CAGR of 3.12% during 2026–2035.
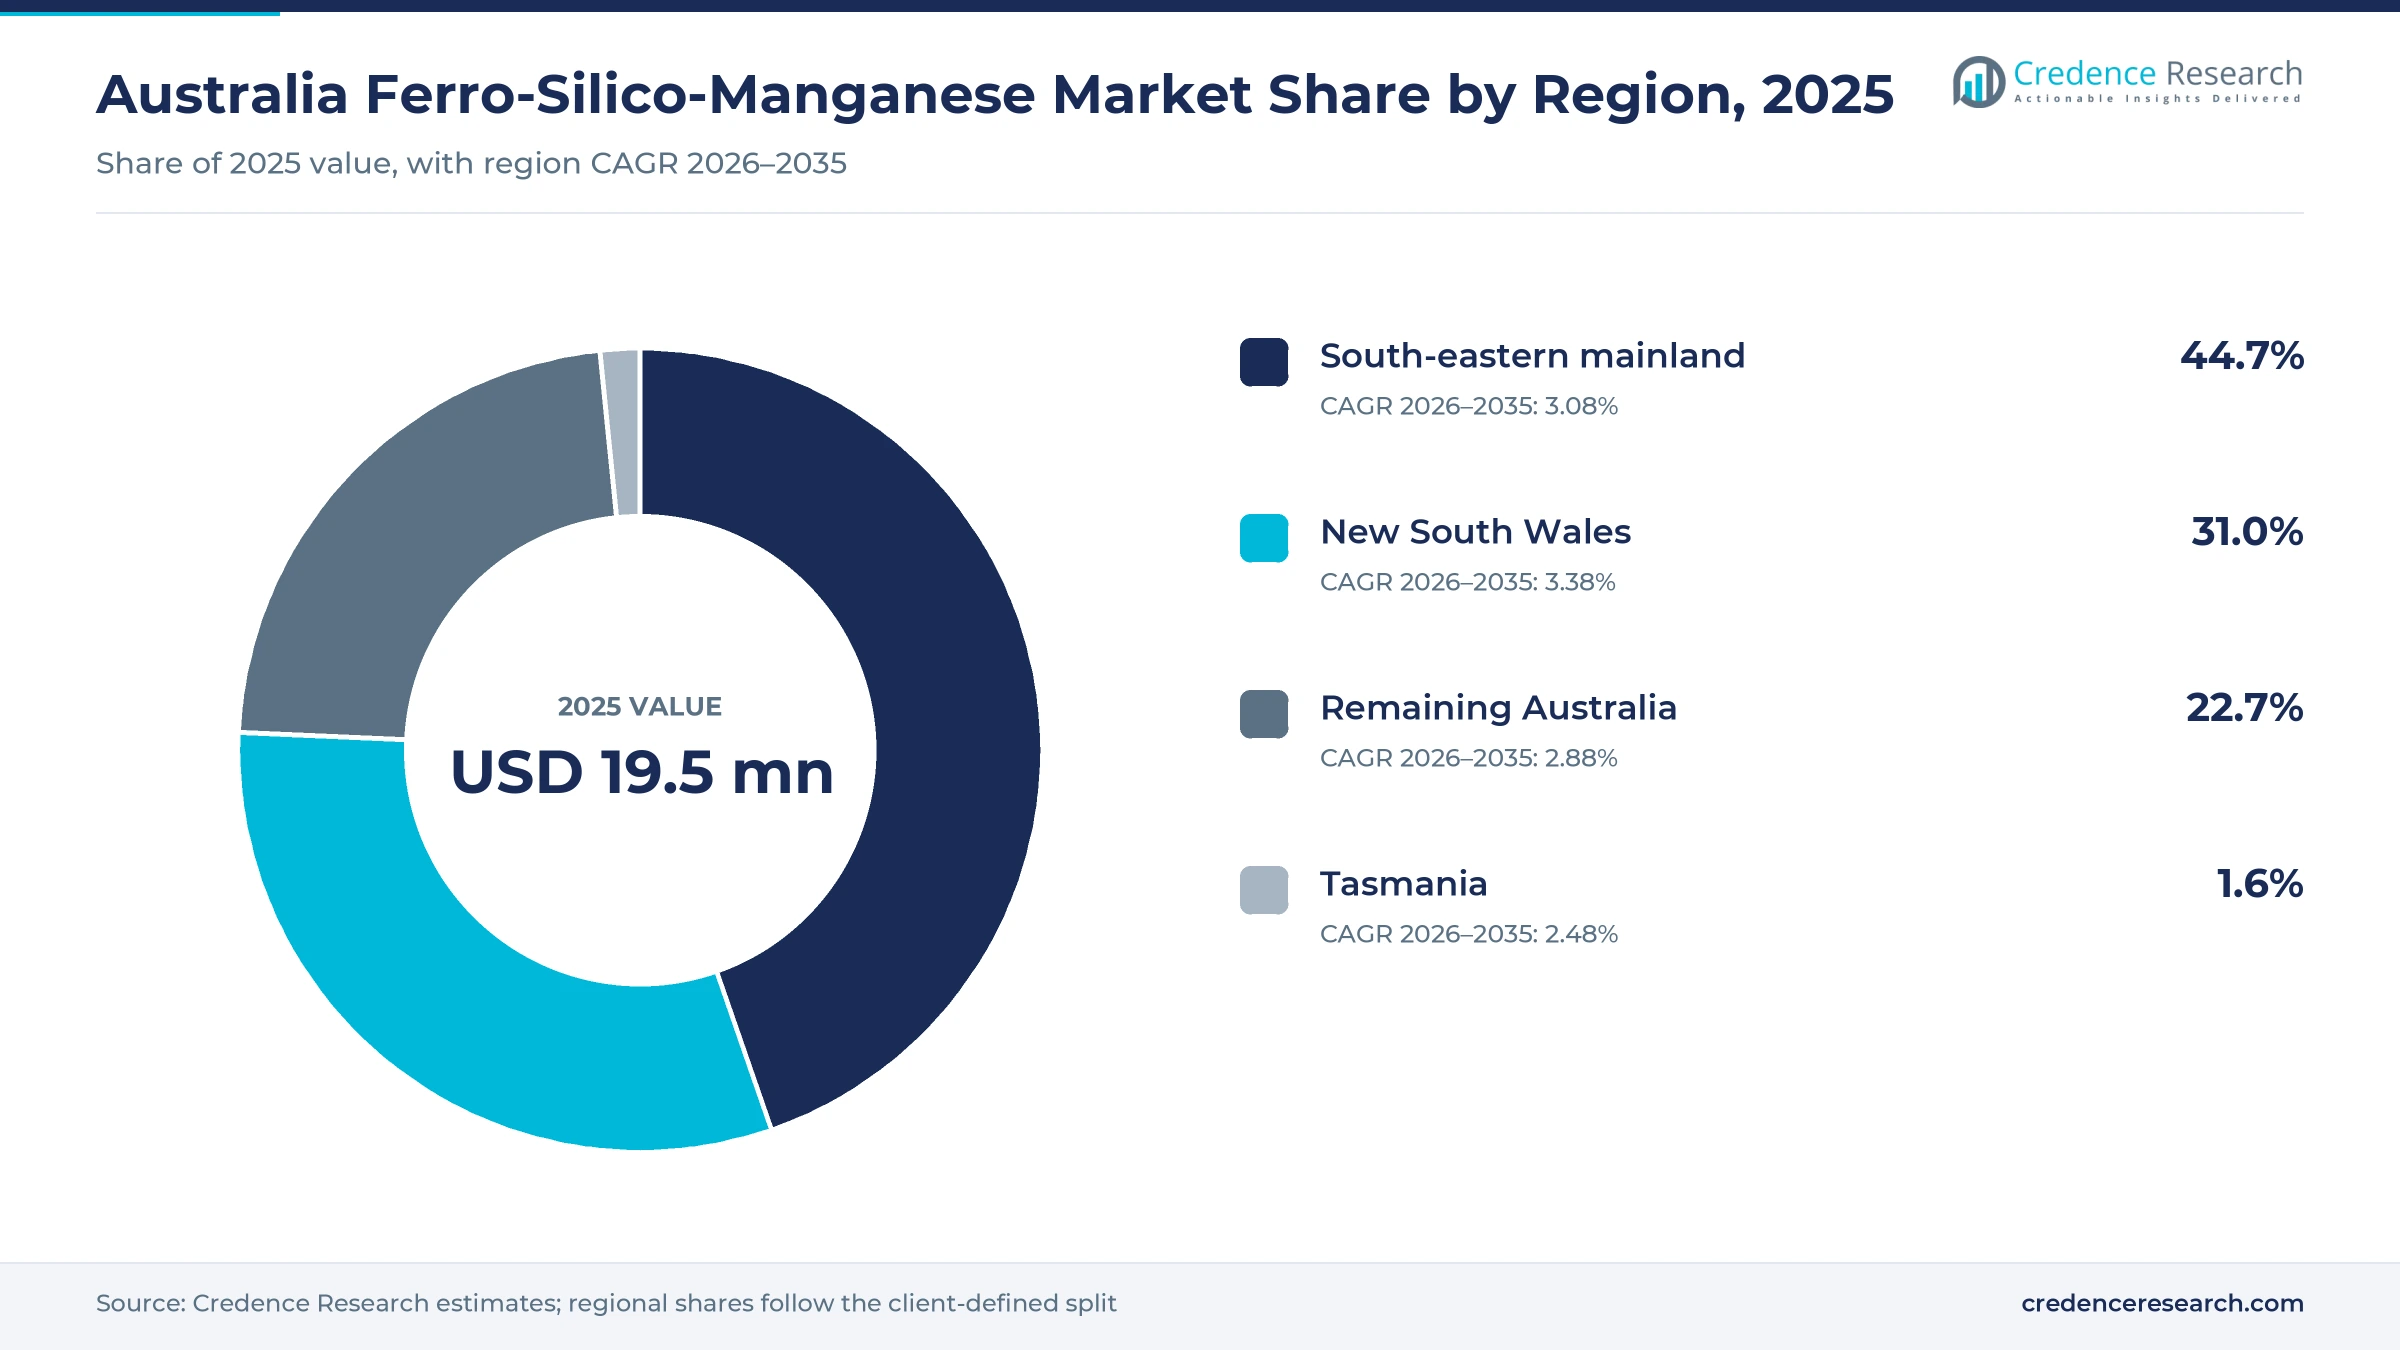
- The south-eastern mainland held a 44.7% share of 2025 value, because Victoria and South Australia host large steel plants and foundries.
- Standard-grade lumps led with a 61.0% share of 2025 value, because most carbon steel melts use them for routine deoxidation.
- Australian imports of silico-manganese reached 14,422 metric tons in 2025, up from 4,681 metric tons in 2024, after the Bell Bay smelter stopped production.
- Import traders grow fastest at 3.56% a year during 2026–2035, as steelmakers rely on Indian and other Asian smelters for supply.
Standard lumps lead as scrap-based steelmakers gain
Why do standard-grade lumps lead value?
Based on product type, the market is categorized into standard-grade lumps, higher-manganese lumps and fines. Standard-grade Lumps led with a 61.0% share of 2025 value, because most carbon steel melts use them for routine deoxidation in the ladle. Higher-manganese Lumps grow fastest at 3.53% a year, as steelmakers seek tighter chemistry with smaller additions and less silicon carryover.
How does carbon steel shape alloy use?
Based on end-use industry, the market is categorized into carbon steel, alloy steel and foundry castings. Carbon Steel led with a 72.0% share of 2025 value, because reinforcing bar, structural sections and flat products make up most Australian output. Alloy Steel grows fastest at 3.63% a year, as mining, defense and plate users ask for higher-strength grades.
Why are scrap-based steelmakers gaining?
Based on customer type, the market is categorized into integrated steelmakers, scrap-based steelmakers and foundry operators. Integrated Steelmakers led with a 57.0% share of 2025 value, because blast furnace plants at Port Kembla and Whyalla produce most crude steel. Scrap-based Steelmakers grow fastest at 3.71% a year, as electric arc furnace capacity rises in Melbourne and Sydney.
How are import traders replacing local supply?
Based on sales channel, the market is categorized into domestic smelter sales, import traders and stockholding distributors. Import Traders led with a 56.0% share of 2025 value, because the Bell Bay smelter stopped production in mid-2025. Import Traders grow fastest at 3.56% a year, as steelmakers sign offtake deals with overseas smelters and keep buffer stock in Australian ports.
| Segment Group | Leading Sub-segment | Share, 2025 | Fastest-growing Sub-segment | CAGR, 2026–2035 |
|---|---|---|---|---|
| By Product Type | Standard-grade Lumps | 61.0% | Higher-manganese Lumps | 3.53% |
| By End-Use Industry | Carbon Steel | 72.0% | Alloy Steel | 3.63% |
| By Customer Type | Integrated Steelmakers | 57.0% | Scrap-based Steelmakers | 3.71% |
| By Sales Channel | Import Traders | 56.0% | Import Traders | 3.56% |
Request a Free Sample
Fill in your details and we'll send you a free sample report.
- Sample data tables & charts
- Research methodology
Steel output, import sourcing and specifications lift demand
How do steelmaking alloy needs sustain demand?
Continuing steelmaking alloy requirements sustain demand, because every metric ton of carbon steel needs manganese and silicon for deoxidation and strength. Australia produced 5.2 million metric tons of crude steel in 2025, up from 4.7 million metric tons in 2024, according to worldsteel data. Basic oxygen furnaces made 75.6% of that output, while electric furnaces made 24.4%. BlueScope refers to about 3 million metric tons of flat steel production at Port Kembla each year. As a result, carbon steel holds 72.0% of 2025 alloy value, and each furnace heat in Port Kembla, Whyalla, Melbourne and Sydney consumes alloy in proportion to tapped steel weight.
Why are imports replacing domestic alloy supply?
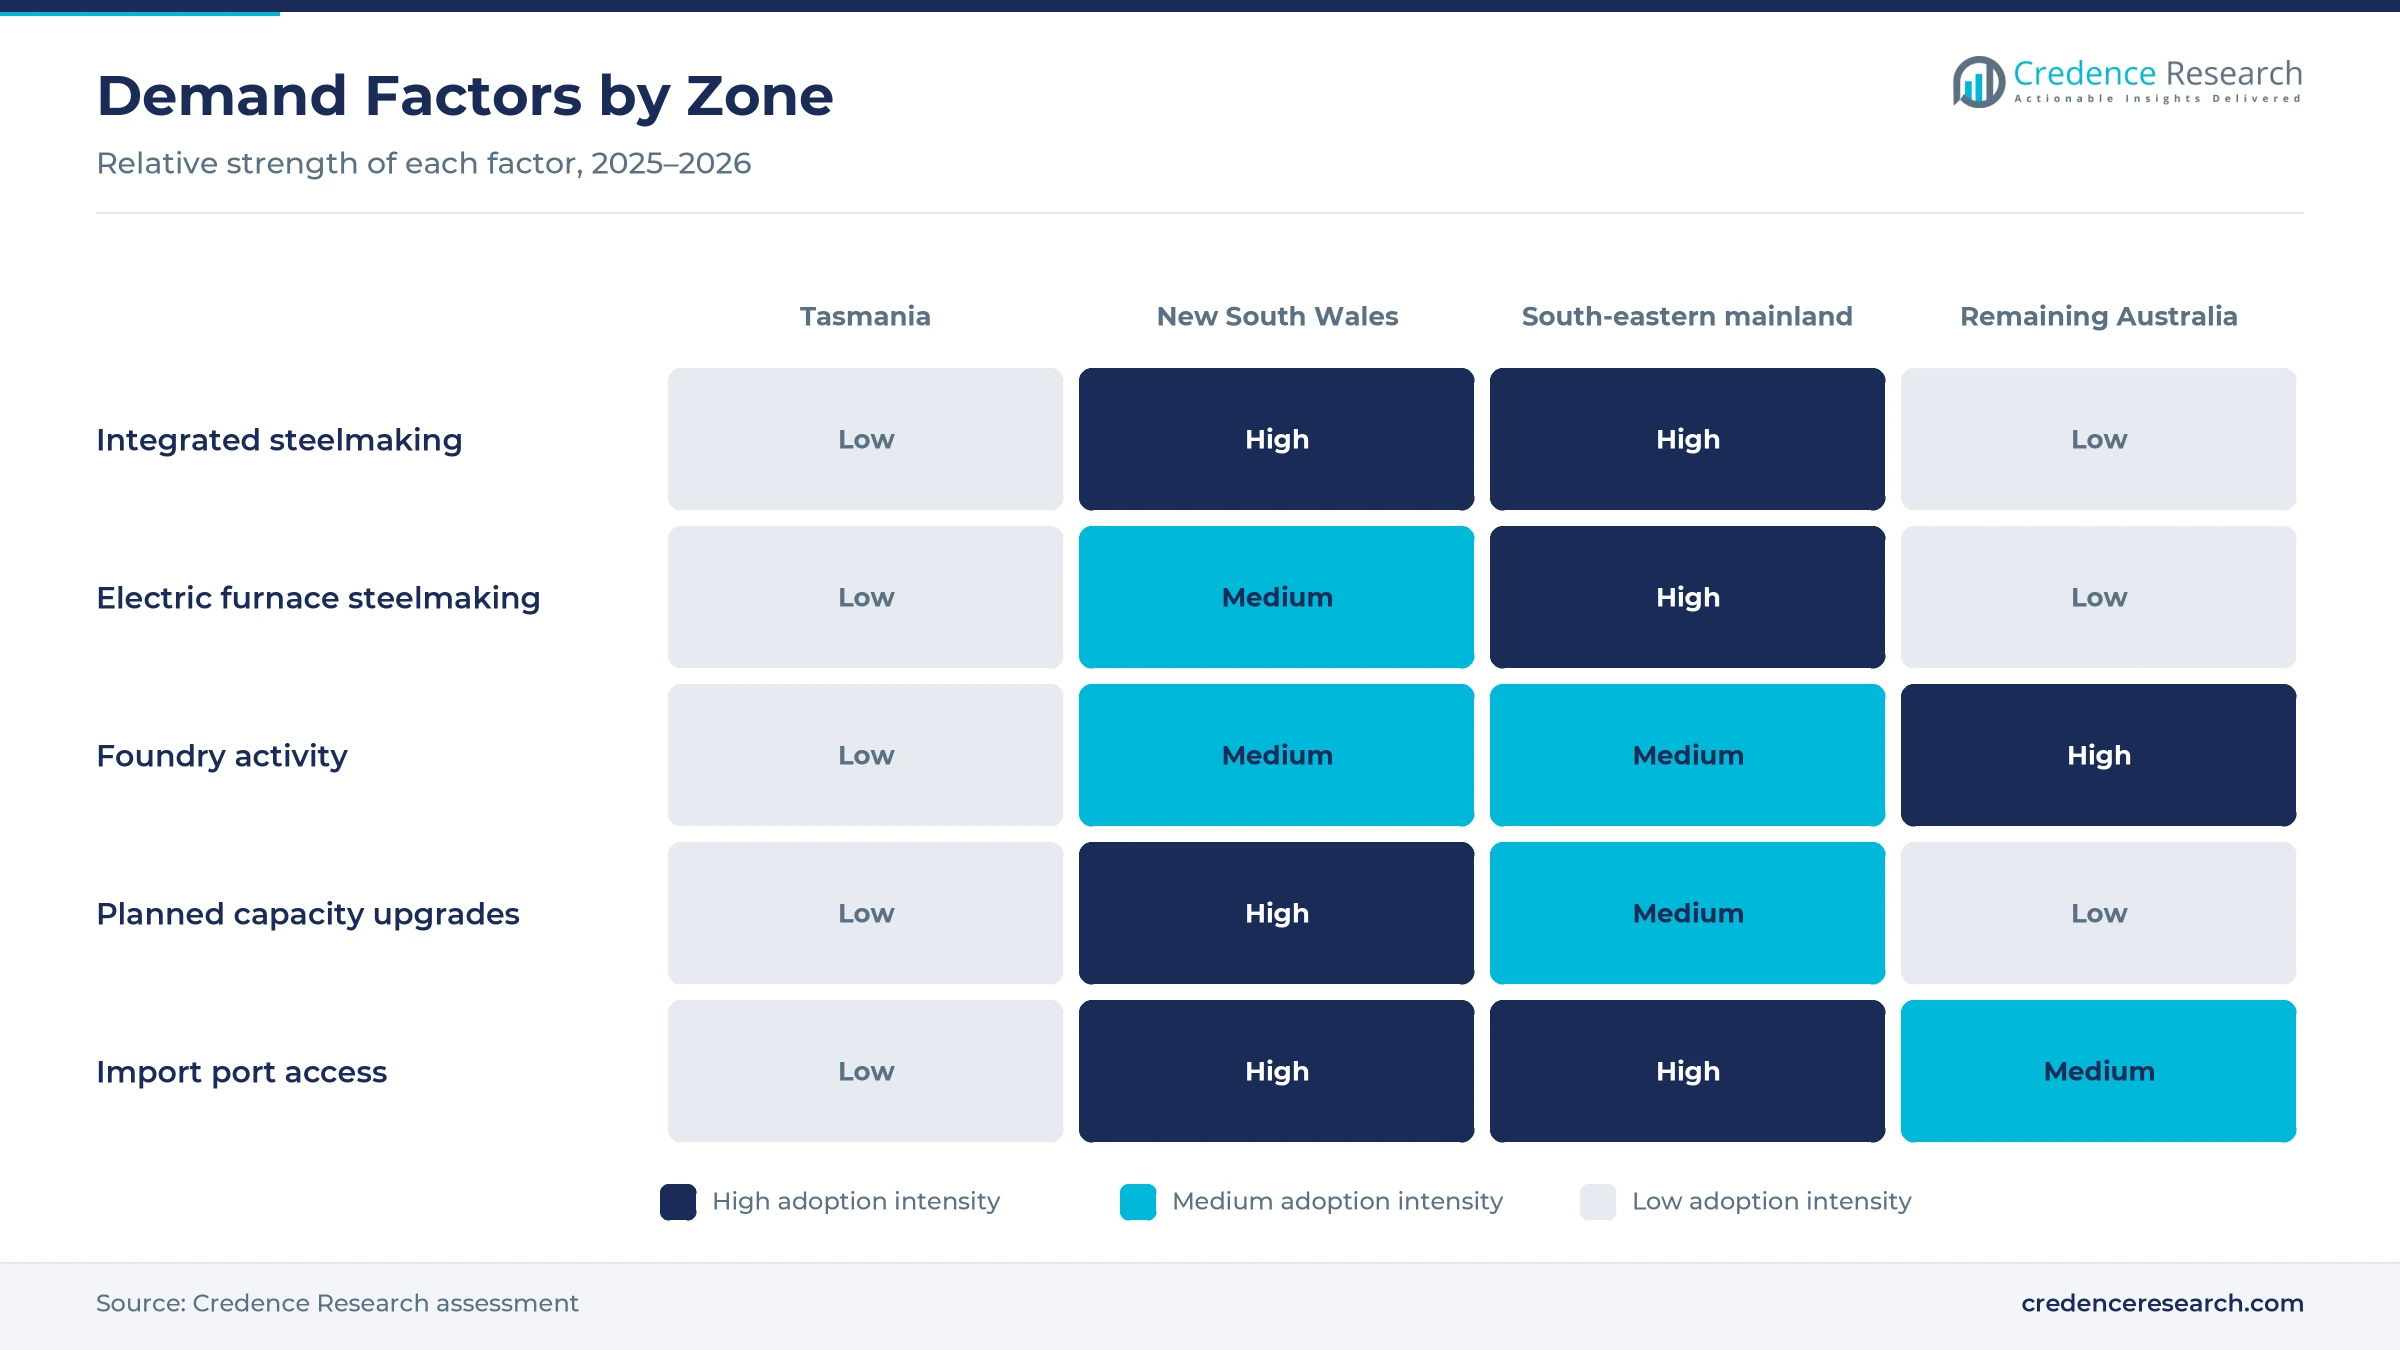
Replacement of domestic supply through imports drives purchasing, because Australia lost its only manganese alloy smelter output when Liberty Bell Bay stopped production in mid-2025. The federal government described the Tasmanian plant as the country's only domestic producer of manganese alloy in an April 24, 2026, media release. Imports of silico-manganese rose to 14,422 metric tons in 2025 from 4,681 metric tons in 2024, according to UN Comtrade data. India supplied 12,836 metric tons of the 2025 total, while China, Malaysia, Indonesia and Vietnam supplied smaller lots. In turn, import traders grow fastest at 3.56% a year, while domestic smelter sales shrink.
How does specification-based purchasing shape alloy choice?
Specification and traceability-based purchasing shapes alloy choice, because steel products sold in Australia must meet AS/NZS standards for chemistry and strength. The ACRS certification scheme uses on-site assessments, quarterly testing and certificates that expire after 12 months. Whyalla produces 75% of Australian structural steel and is the only local producer of long products, according to the South Australian government. Electric furnaces also produce a growing part of national crude steel, and scrap-based melts need closer control of residual elements. As a result, buyers ask for certified manganese, silicon, carbon and phosphorus ranges, which favors higher-manganese lumps growing at 3.53% a year.
How does electric furnace expansion add alloy volume?
Electric furnace expansion adds alloy volume, because each new metric ton of scrap-based steel needs silico-manganese to reach rebar and merchant bar grades. InfraBuild announced in October 2025 that new furnace bowls would lift Laverton production by 25% to 1 million metric tons a year. The company also planned to raise its Sydney melt shop to 680,000 metric tons a year, with studies under way toward 1 million metric tons. A second Laverton furnace bowl was scheduled to enter service in January 2026, allowing one bowl to be relined every six weeks. In turn, scrap-based steelmakers grow at 3.71% a year, and New South Wales gains share as Sydney output rises.
Electric furnaces, Indian supply and smelter restarts
How is the shift to electric furnace steel changing demand?
The shift to electric furnace steel is changing demand, because scrap-based plants add alloy in smaller, more frequent ladle doses. InfraBuild installed a new lower shell furnace bowl at Laverton in late 2025 to allow a larger tap mass. InfraBuild cited data showing scrap-based furnace production emits about 70% less carbon dioxide per metric ton than blast furnace routes. The Laverton and Sydney melt shops together target about 1.68 million metric tons of capacity after the 2025 upgrades. As a result, interest in green steel supports steady alloy demand from electric furnace plants, and scrap-based steelmakers grow faster than integrated mills through 2035.
Why is the rise of Indian supply notable?
The rise of Indian supply is notable, because India became the main source of imported silico-manganese after the Bell Bay shutdown. Indian smelters shipped 12,836 metric tons to Australia in 2025, or about 89% of total import volume. In 2023, by contrast, Malaysia supplied 2,004 metric tons and India supplied 1,482 metric tons. OM Holdings produced 311,791 metric tons of manganese alloys at its Sarawak smelter in 2025, which keeps a Malaysian option open for Australian buyers. In turn, import traders hold 56.0% of 2025 value, and buyers compare Indian prices with Malaysian, Chinese and Indonesian offers in each quarterly tender.
Can a Bell Bay restart open new domestic supply?
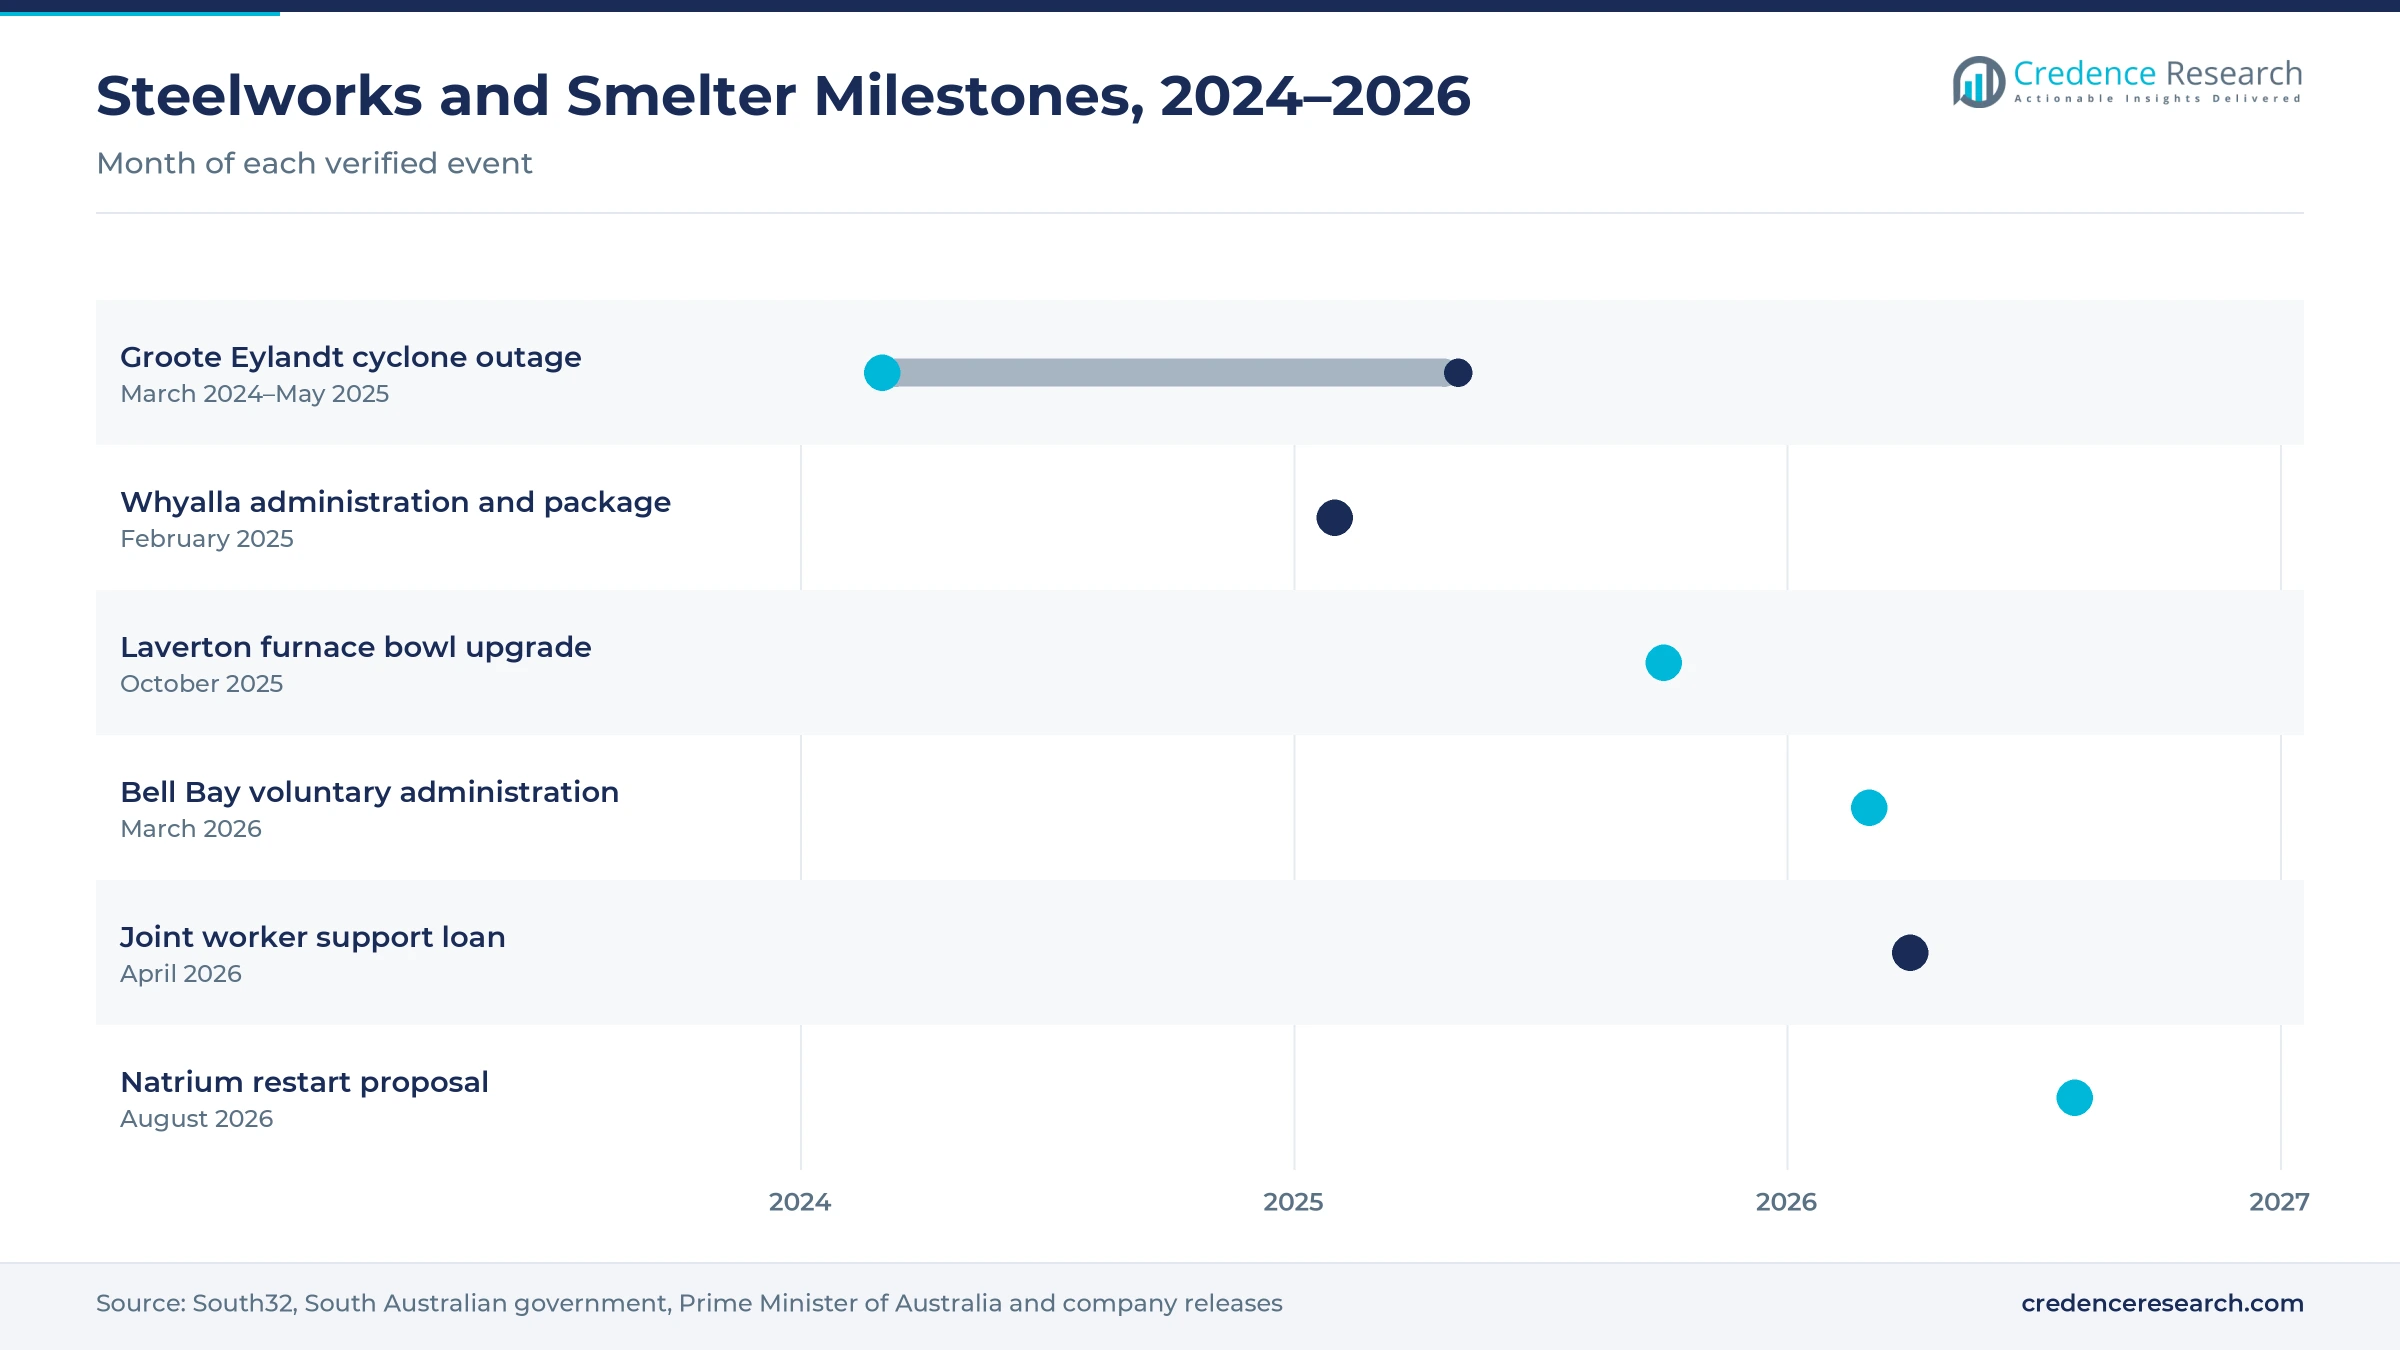
A Bell Bay restart can open new domestic supply, because the Tasmanian site still has furnaces, a power contract and a skilled local workforce. The smelter entered voluntary administration on March 23, 2026, and a proposed sale collapsed in July 2026. British company Natrium Redox Technologies made a restart proposal on Aug. 24, 2026, seeking shared funding of up to A$15 million for a 16-week restart. The company said its process would add 20% to 40% to site production and reprocess an A$210 million slag liability. As a result, domestic smelter sales could recover share, although liquidators control any sale decision.
Is there room to grow as steelworks are modernized?
Steelworks modernization creates room to grow, because upgraded mills run longer campaigns and need steady alloy contracts. The South Australian government set out an A$2.4 billion package for Whyalla on Feb. 20, 2025, including A$1.9 billion for future investment with a new owner. The federal Green Iron fund also earmarked up to A$500 million for the steelworks. In New South Wales, BlueScope's A$650 million plate mill investment received approval in June 2024, lifting capacity from 430,000 to 600,000 metric tons a year. In turn, suppliers that offer long-term offtake can lock in volume with these steelmakers.
Ore shocks, smelter failure and weak steel output weigh
How do ore supply shocks disrupt alloy output?
Ore supply shocks disrupt alloy output, because smelters need regular manganese ore shipments to keep furnaces running. Tropical Cyclone Megan flooded the Groote Eylandt pits in March 2024, and South32 only resumed export sales in May 2025. As a result, local smelting lost a steady ore base during a weak price period. Buyers respond with import contracts from several countries, which spread the risk of a single mine or port outage.
Why does the smelter failure raise supply risk?
The smelter failure raises supply risk, because Australian steelmakers now depend on shipping lanes and overseas smelter schedules. In turn, freight delays or export limits in India can leave mills short of alloy during peak production months. Steelmakers respond with larger port stocks, dual sourcing and quarterly tenders, which add working capital but keep furnaces supplied when a cargo arrives late or a supplier changes its shipping plan.
How does weak steel output limit volume growth?
Weak steel output limits volume growth, because alloy demand rises and falls with crude steel tonnage. Australian crude steel production fell to 4.7 million metric tons in 2024 before recovering in 2025. As a result, alloy suppliers face uneven orders when blast furnaces undergo repairs or reline work. Suppliers respond with flexible contract volumes and stockholding services, which help mills adjust purchases to actual furnace schedules and avoid holding excess stock.
Why does steelworks financial stress affect buying?
Steelworks financial stress affects buying, because plants under administration often cut stock levels and shorten payment terms. Whyalla entered administration on Feb. 19, 2025, while the Bell Bay smelter entered liquidation in August 2026. In turn, alloy traders face higher credit risk and shorter contracts with some customers. Suppliers respond with credit insurance and secured payment terms, which protect margins while keeping supply open to struggling plants and protecting long customer relationships.
South-eastern mainland leads while New South Wales rises
| Region | Value, 2025 (USD million) | Share, 2025 | CAGR, 2026–2035 |
|---|---|---|---|
| South-eastern mainland | 8.7 | 44.7% | 3.08% |
| New South Wales | 6.0 | 31.0% | 3.38% |
| Remaining Australia | 4.4 | 22.7% | 2.88% |
| Tasmania | 0.3 | 1.6% | 2.48% |
Why does the south-eastern mainland hold the top share?
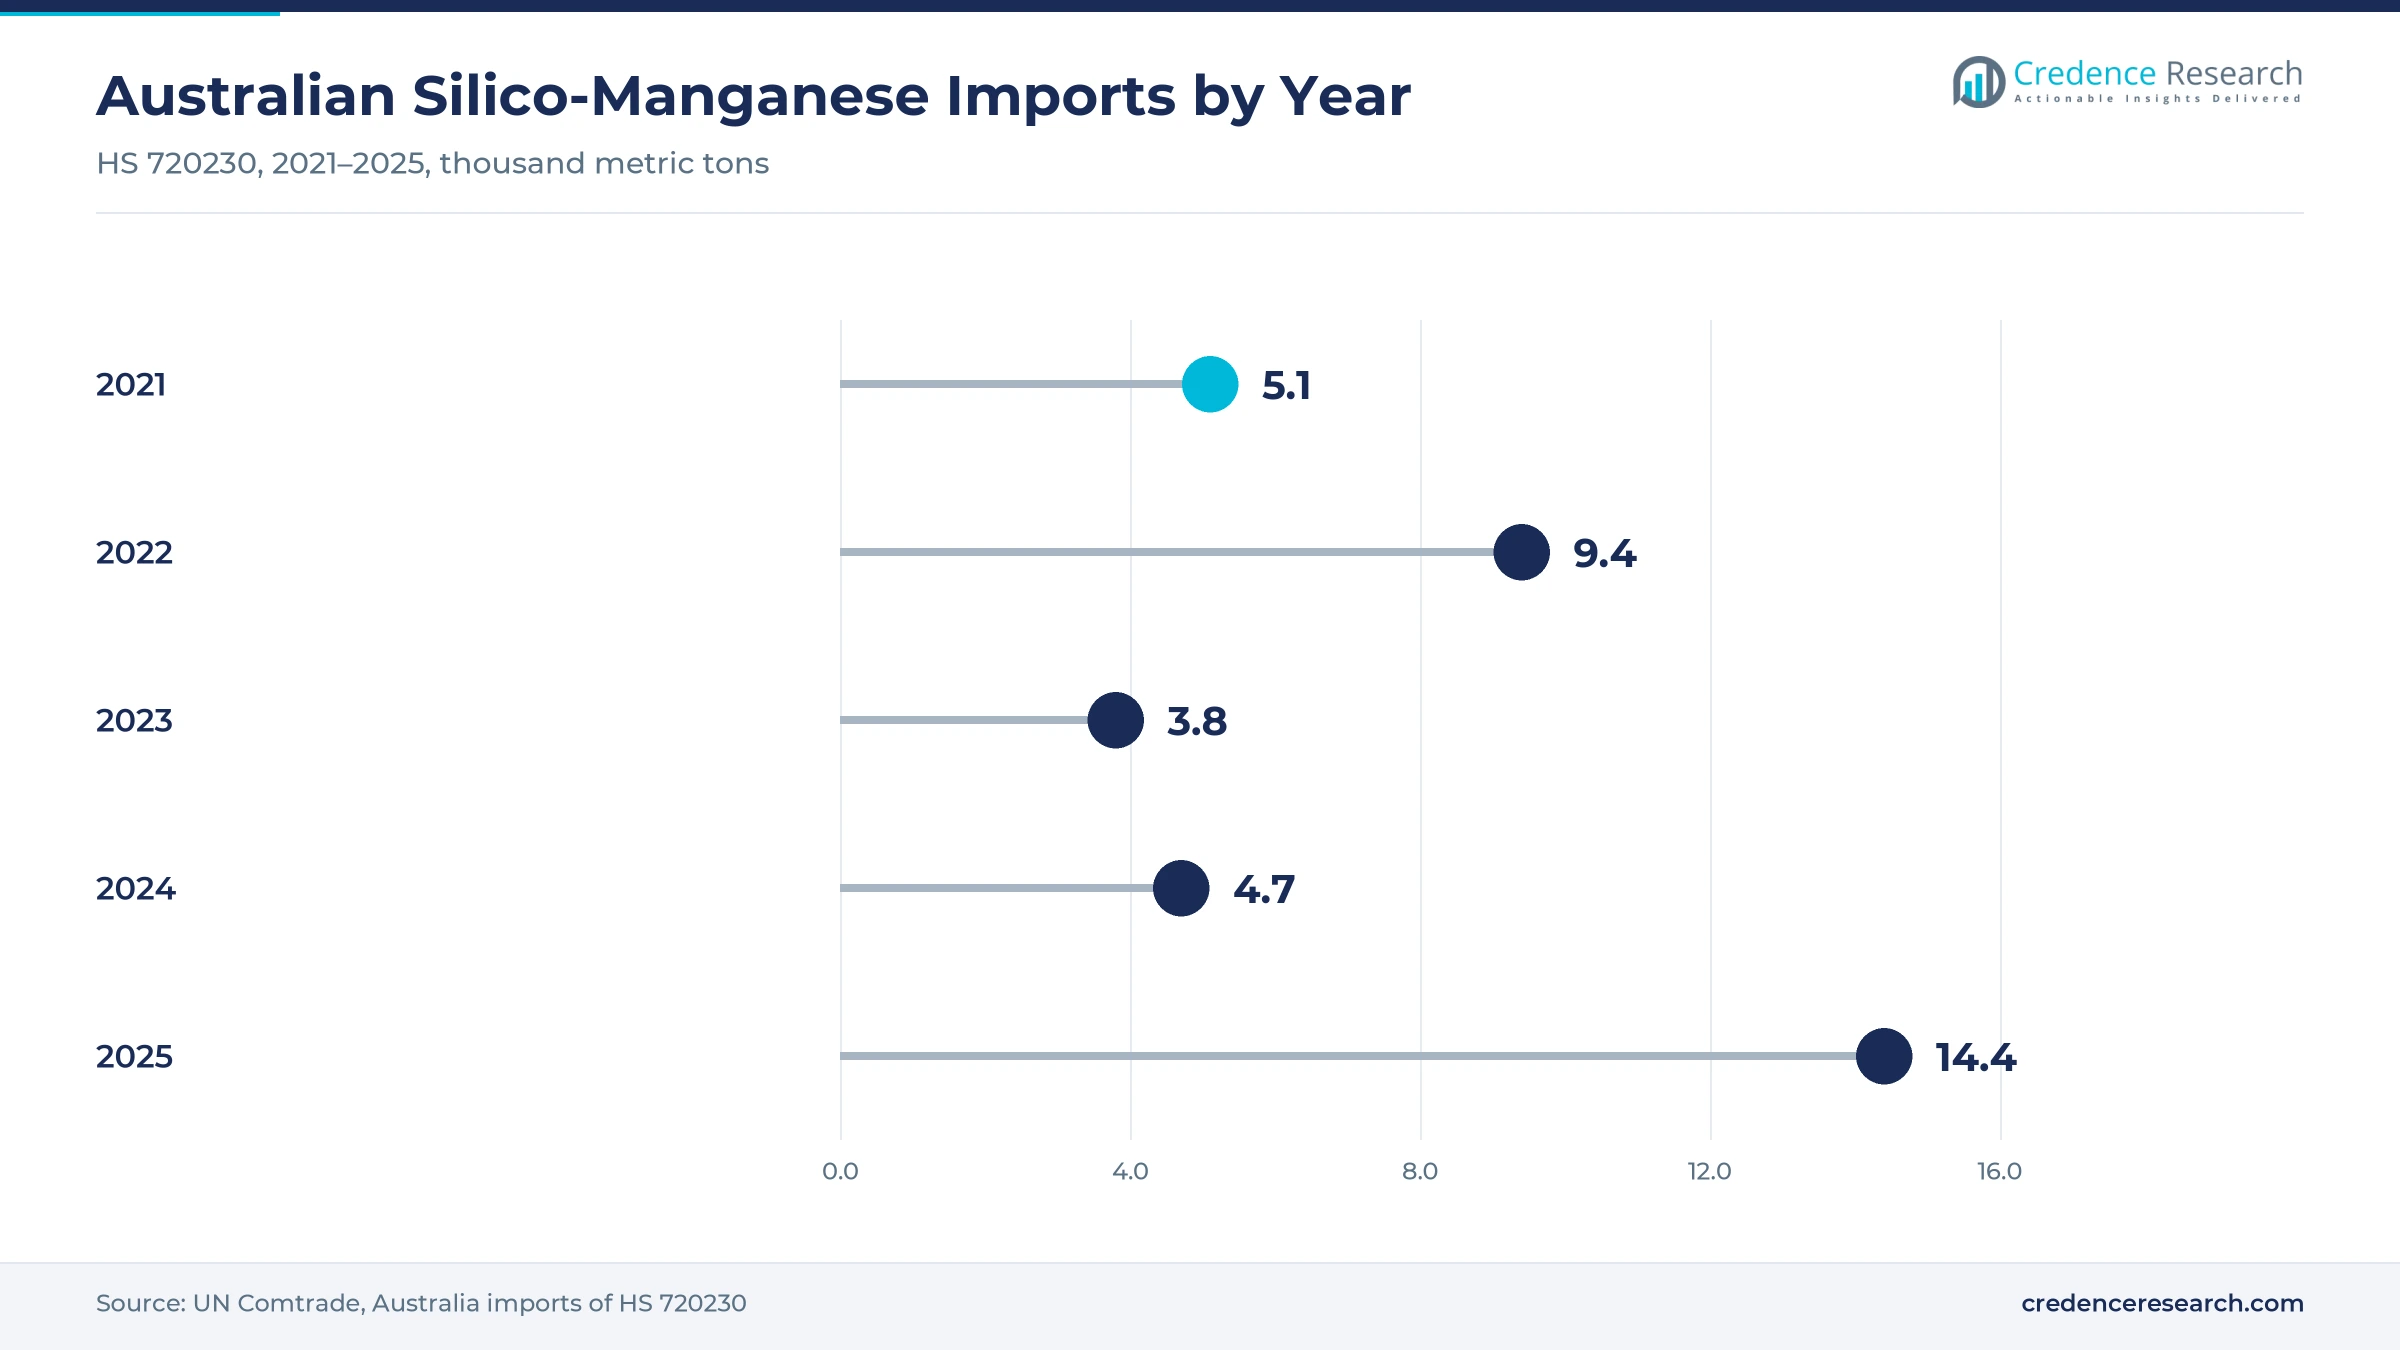
The south-eastern mainland held a 44.7% share of 2025 value and grows at 3.08% a year, because the zone, which covers Victoria and South Australia in this report, hosts Whyalla and the Laverton melt shop. Whyalla employs 1,100 workers directly and produces most Australian long products. Laverton production was set to rise by 25% to 1 million metric tons a year after new furnace bowls arrived in 2025. As a result, the zone buys the largest volumes of both import cargoes and stockholder material.
How is New South Wales gaining share?
New South Wales held a 31.0% share of 2025 value and grows fastest at 3.38% a year, because the state has both an integrated steelworks and an electric furnace mill. BlueScope refers to about 3 million metric tons of flat steel production at Port Kembla. The Sydney melt shop is also moving toward 680,000 metric tons a year. In turn, the state draws regular import cargoes through Port Kembla and Sydney, and plate mill upgrades add demand for higher-strength grades.
What shapes demand in remaining Australia?
Remaining Australia held a 22.7% share of 2025 value and grows at 2.88% a year, because Queensland, Western Australia and the Northern Territory rely on foundries and steel processors rather than large steelworks. Foundries cast wear parts, pump bodies and mining equipment for resource projects in these states. Western Australia also had the fastest population growth of any state, at 2.1%, in the year to March 2026. As a result, demand comes mainly from foundry operators and stockholding distributors.
Why is Tasmania a small but strategic zone?
Tasmania held a 1.6% share of 2025 value and grows at 2.48% a year, because the state has few steel or foundry users of its own. However, the Bell Bay smelter near George Town made the state the center of domestic supply. The smelter employed about 200 people before it entered administration in March 2026.
Steelworks rescues and smelter milestones, 2025–2026
| Development | Status and market relevance |
|---|---|
| In February 2025, the South Australian government placed the Whyalla steelworks into administration and announced an A$2.4 billion support package with the federal government. | Keeps Australia's long products steelmaking running |
| In May 2025, South32 resumed manganese ore export sales from Groote Eylandt after Tropical Cyclone Megan damaged the site in March 2024. | Restores a major ore source for alloy smelters |
| In March 2026, Liberty Bell Bay, the country's only manganese alloy smelter, entered voluntary administration with EY as administrator. | Confirms reliance on imported alloy |
| In April 2026, the federal and Tasmanian governments offered an A$3 million loan to support Bell Bay workers during an expedited sale. | Keeps skilled staff available for a restart |
| In August 2026, Natrium Redox Technologies proposed a 16-week restart of the Bell Bay smelter with up to A$15 million of shared funding. | Possible return of domestic supply |
Lump sizing and ladle practice drive alloy efficiency
- Graded lump sizing limits fines and oversize pieces, which helps the alloy dissolve evenly in the ladle and keeps manganese recovery high.
- Automated ladle additions use weigh hoppers and process models to calculate each charge, which cuts alloy waste and keeps silicon within tight grade limits.
- Fines recovery turns small particles into briquettes or cored wire, which lets foundries and steelmakers use material that would otherwise be lost as dust.
Need a Custom Version of This Report?
Tailor the scope, geography, or segments to your exact requirements.
- Custom geography or segment scope
- Direct access to our analyst team
Importers and one idle smelter compete on secure supply
Competition is shaped by one idle domestic smelter and a group of overseas producers and import traders. Liberty Bell Bay in Tasmania was the only domestic manganese alloy producer until production stopped in mid-2025. OM Holdings, listed on the Australian Securities Exchange with an office in South Perth, produced 311,791 metric tons of manganese alloys at its Sarawak complex in 2025, which also makes ferrosilicon and silicon metal. Maithan Alloys, an Indian maker and exporter of silico-manganese, ferromanganese and ferrosilicon, competes in the Indian supply that now dominates imports. Eramet makes silicomanganese at plants in Norway, France, Gabon and the United States. Rivals compete on reliable delivery, certified chemistry, lump sizing and price. Because steelmakers buy through annual offtake and quarterly tenders, suppliers with steady shipping schedules and local stock win the largest contracts.
Which suppliers serve Australian buyers?
| Company | Type | Role in the market |
|---|---|---|
| Liberty Bell Bay | Domestic smelter | Only domestic manganese alloy producer, idle since mid-2025 |
| OM Holdings | Overseas smelter group | Manganese alloys from Sarawak, Australian office in South Perth |
| Maithan Alloys | Indian alloy producer | Makes and exports silico-manganese, ferromanganese and ferrosilicon |
| Eramet | Global alloy producer | Silicomanganese plants in Norway, France, Gabon and the United States |
Credence Research view on manganese alloy supply
Credence Research's view is that Australian demand for ferro-silico-manganese will grow slowly because crude steel output is stable and furnace upgrades add only gradual volume. The larger change is in supply, as imports from India and other Asian smelters have replaced output from Bell Bay. Standard-grade lumps remain the largest value pool, while scrap-based steelmakers add the fastest growth. Suppliers with certified chemistry, port stock and long-term offtake contracts should gain the most, while any Bell Bay restart would shift some volume back to domestic sales.
How the national manganese alloy estimate was built
The report uses 2025 as the base year on a calendar basis, and market values come from the Credence Research model. That model combines crude steel production statistics, customs import data, government releases, company annual reports and certification scheme information. Segment splits and zone growth rates are Credence Research estimates, while zone shares follow the client-defined split. Sources used are official trade statistics, industry association data, government publications and company filings, and no interviews or surveys were used.
Import supply and furnace upgrades carry demand to 2035
The Australia ferro-silico-manganese market is expected to reach USD 25.9 million by 2035, a 3.12% CAGR during 2026–2035, as Australian steelmakers keep adding manganese and silicon to every heat. Growth should be strongest in import trading, higher-manganese lumps and scrap-based steelmaking, because electric furnace capacity rises and buyers ask for tighter chemistry. The future of Bell Bay will decide how much supply returns to domestic smelting. A stable Whyalla ownership would support integrated mill demand, while weak steel output could slow growth.
Frequently Asked Questions
How big is the Australia ferro-silico-manganese market?
Which product type leads Australian value?
Which region leads the Australian market?
How much silico-manganese does Australia import?
What happened to the Bell Bay smelter?
Which sales channel is growing fastest?
Who are the leading companies in the Australian market?
What are the main challenges for suppliers?
Table of Content
Chapter 1 Market Segmentation
- 1.1 Segmentation Framework
- 1.1.1 Product and Service Classification
- 1.1.2 Application and End-Use Classification
- 1.1.3 Technology and Solution Classification
- 1.1.4 Customer and Distribution Channel Classification
- 1.1.5 Geographic Segmentation
- 1.1.6 Market Segment Definitions and Boundaries
- 1.2 By Product Type
- 1.2.1 Standard-grade Lumps
- 1.2.2 Higher-manganese Lumps
- 1.2.3 Fines
- 1.3 By End-Use Industry
- 1.3.1 Carbon Steel
- 1.3.2 Alloy Steel
- 1.3.3 Foundry Castings
- 1.4 By Customer Type
- 1.4.1 Integrated Steelmakers
- 1.4.2 Scrap-based Steelmakers
- 1.4.3 Foundry Operators
- 1.5 By Sales Channel
- 1.5.1 Domestic Smelter Sales
- 1.5.2 Import Traders
- 1.5.3 Stockholding Distributors
Chapter 2 Introduction
- 2.1 Report Objectives and Scope
- 2.2 Product Definition and Industry Terminology
- 2.3 Market Inclusions and Exclusions
- 2.4 Research Process
- 2.4.1 Primary Research and Expert Interviews
- 2.4.2 Secondary Research and Source Review
- 2.4.3 Top-Down and Bottom-Up Estimation
- 2.4.4 Data Triangulation and Verification
- 2.5 Market Size Measurement Basis
- 2.5.1 2025: USD 19.5 million → 2035: USD 25.9 million
- 2.6 Historical and Forecast Reference Periods
- 2.6.1 Historical Period: 2018-2025
- 2.6.2 Base Year: 2025
- 2.6.3 Forecast Period: 2025-2035
- 2.7 Research Assumptions and Limitations
Chapter 3 Executive Summary
- 3.1 Market Snapshot and Key Findings
- 3.2 Base-Year Market Size, 2025
- 3.3 Forecast Market Size, 2035
- 3.4 Revenue and Volume Growth Outlook
- 3.5 Key Demand and Supply Indicators
- 3.6 Leading Market Segments
- 3.7 Fastest-Growing Market Opportunities
- 3.8 Regional Performance Highlights
- 3.9 Technology and Industry Transformation
- 3.10 Competitive Landscape Summary
- 3.11 Analyst View and Strategic Implications
Chapter 4 Australia Ferro-Silico-Manganese Market Trends and Developments
- 4.1 Historical Industry Development, 2018-2025
- 4.2 Recent Market Trends and Developments
- 4.3 Demand and Customer Behavior Trends
- 4.4 Technology and Product Innovation
- 4.5 Artificial Intelligence, Automation and Digitalization
- 4.6 Local Manufacturing and Supply Chain Realignment
- 4.7 Industry Partnerships, Mergers and Acquisitions
- 4.8 Sustainability and Circular Economy Developments
- 4.9 Government and Private Sector Investment Trends
- 4.10 Emerging Business Models and Commercialization
- 4.11 Industry Developments and Announcements
Chapter 5 Australia Ferro-Silico-Manganese Market Production, Supply and Demand Analysis
- 5.1 Demand Trend and Consumption Analysis, 2018-2025
- 5.2 Demand Forecast, 2025-2035
- 5.3 Production and Output Trend, 2018-2025
- 5.4 Production and Output Forecast, 2025-2035
- 5.5 Installed Capacity and Capacity Utilization
- 5.6 Company-Wise Production Plants and Statistics
- 5.6.1 Installed Production Capacity
- 5.6.2 Actual Production
- 5.6.3 Planned Capacity and Expansion Targets
- 5.7 Supply Chain Structure and Procurement Trends
- 5.8 Supply-Demand Gap and Bottlenecks
- 5.9 Import Dependence and Sourcing Structure
- 5.10 Contract Manufacturing and Outsourcing
- 5.11 Regional Supply and Demand Concentration
Chapter 6 Australia Ferro-Silico-Manganese Market Pricing Analysis
- 6.1 Pricing Structure and Measurement
- 6.2 Historical Pricing Trends, 2018-2025
- 6.3 Pricing Outlook, 2025-2035
- 6.4 Average Selling Price and Unit Economics
- 6.5 Pricing by Product and Market Segment
- 6.6 Geographic Pricing Differences
- 6.7 Key Input, Energy, Labor and Logistics Costs
- 6.8 Contract Pricing and Purchasing Models
- 6.9 Pricing Sensitivity and Competitive Positioning
- 6.10 Price, Margin and Profitability Implications
Chapter 7 Australia Ferro-Silico-Manganese Market Dynamics
- 7.1 Market Growth Drivers
- 7.1.1 Demand-Side Drivers
- 7.1.2 Technology and Innovation Drivers
- 7.1.3 Infrastructure and Investment Drivers
- 7.1.4 Regulatory and Policy Drivers
- 7.2 Market Restraints
- 7.2.1 Cost and Affordability Constraints
- 7.2.2 Technology and Adoption Barriers
- 7.2.3 Supply Chain and Operational Constraints
- 7.3 Market Challenges
- 7.3.1 Competitive Pressure and Margin Erosion
- 7.3.2 Skills, Infrastructure and Implementation Gaps
- 7.4 Emerging Market Opportunities
- 7.5 Market Dynamics Impact and Time-Horizon Assessment
Chapter 8 Australia Ferro-Silico-Manganese Value Chain Analysis
- 8.1 Industry Value Chain Overview
- 8.2 Upstream Suppliers and Critical Inputs
- 8.3 Technology and Component Providers
- 8.4 Manufacturing or Service Delivery
- 8.5 Distribution, Channel Partners and Integrators
- 8.6 Downstream Applications and End Users
- 8.7 Value Addition and Profit Pools
- 8.8 Vertical Integration and Outsourcing
- 8.9 Supplier Concentration and Risk
- 8.10 Supply Chain Localization and Resilience
Chapter 9 Australia Ferro-Silico-Manganese Market Regulations and Policies
- 9.1 Relevant Laws, Standards and Compliance Frameworks
- 9.2 Product, Service, Safety and Quality Requirements
- 9.3 Government Policies, Incentives and Subsidies
- 9.4 Imports, Exports and Trade Barriers
- 9.5 Public Procurement and Local Content Requirements
- 9.6 Environmental and Sustainability Compliance
- 9.7 Upcoming Policy Changes and Market Implications
Chapter 10 Australia Ferro-Silico-Manganese Market Hotspots and Opportunities
- 10.1 Market Opportunity Mapping and Growth Hotspots
- 10.2 High-Growth Applications and Customer Groups
- 10.3 Underserved Markets and White-Space Opportunities
- 10.4 Emerging Technology and Product Opportunities
- 10.5 New Capacity and Investment Hotspots
- 10.6 Market Entry and Expansion Opportunities
- 10.7 Distribution and Partnership Opportunities
- 10.8 Near-Term and Long-Term Commercial Potential
- 10.9 Opportunity Attractiveness and Execution Risks
Chapter 11 Australia Ferro-Silico-Manganese Market Outlook, 2025-2035
- 11.1 Market Size and Analysis
- 11.1.1 Revenue (Market Measurement: 2025: USD 19.5 million → 2035: USD 25.9 million)
- 11.1.2 Market Volume and Quantity Sold
- 11.1.3 Historical Market Size, 2018-2025
- 11.1.4 Base-Year Market Size, 2025
- 11.2 Market Forecast, 2025-2035
- 11.2.1 Revenue Forecast to 2035
- 11.2.2 Volume Forecast to 2035
- 11.2.3 CAGR and Year-on-Year Growth
- 11.2.4 Incremental Revenue Opportunity
- 11.3 Forecast Assumptions and Scenario Analysis
- 11.3.1 Base-Case Forecast
- 11.3.2 Optimistic and Conservative Scenarios
- 11.3.3 Technology, Pricing and Policy Sensitivities
- 11.4 Market Attractiveness and Growth Outlook
Chapter 12 Australia Ferro-Silico-Manganese Market Segmentation and Outlook
- 12.1 Segmentation Summary and Market Shares, 2025
- 12.2 Largest and Fastest-Growing Segments
- 12.3 By Product Type - Market Size and Forecast, 2025-2035
- 12.3.1 Segment Definition and Scope
- 12.3.2 Historical Market Size, 2018-2025
- 12.3.3 Revenue Forecast, 2025-2035
- 12.3.4 Volume Forecast, 2025-2035
- 12.3.5 Base-Year Market Share, 2025
- 12.3.6 Segment CAGR and Growth Drivers
- 12.3.7 Subsegment Market Size and Forecast
- 12.3.7.1 Standard-grade Lumps
- 12.3.7.2 Higher-manganese Lumps
- 12.3.7.3 Fines
- 12.3.8 Subsegment Pricing and Adoption Trends
- 12.3.9 Leading Suppliers and Competition
- 12.3.10 Regional Demand and Opportunities
- 12.4 By End-Use Industry - Market Size and Forecast, 2025-2035
- 12.4.1 Segment Definition and Scope
- 12.4.2 Historical Market Size, 2018-2025
- 12.4.3 Revenue Forecast, 2025-2035
- 12.4.4 Volume Forecast, 2025-2035
- 12.4.5 Base-Year Market Share, 2025
- 12.4.6 Segment CAGR and Growth Drivers
- 12.4.7 Subsegment Market Size and Forecast
- 12.4.7.1 Carbon Steel
- 12.4.7.2 Alloy Steel
- 12.4.7.3 Foundry Castings
- 12.4.8 Subsegment Pricing and Adoption Trends
- 12.4.9 Leading Suppliers and Competition
- 12.4.10 Regional Demand and Opportunities
- 12.5 By Customer Type - Market Size and Forecast, 2025-2035
- 12.5.1 Segment Definition and Scope
- 12.5.2 Historical Market Size, 2018-2025
- 12.5.3 Revenue Forecast, 2025-2035
- 12.5.4 Volume Forecast, 2025-2035
- 12.5.5 Base-Year Market Share, 2025
- 12.5.6 Segment CAGR and Growth Drivers
- 12.5.7 Subsegment Market Size and Forecast
- 12.5.7.1 Integrated Steelmakers
- 12.5.7.2 Scrap-based Steelmakers
- 12.5.7.3 Foundry Operators
- 12.5.8 Subsegment Pricing and Adoption Trends
- 12.5.9 Leading Suppliers and Competition
- 12.5.10 Regional Demand and Opportunities
- 12.6 By Sales Channel - Market Size and Forecast, 2025-2035
- 12.6.1 Segment Definition and Scope
- 12.6.2 Historical Market Size, 2018-2025
- 12.6.3 Revenue Forecast, 2025-2035
- 12.6.4 Volume Forecast, 2025-2035
- 12.6.5 Base-Year Market Share, 2025
- 12.6.6 Segment CAGR and Growth Drivers
- 12.6.7 Subsegment Market Size and Forecast
- 12.6.7.1 Domestic Smelter Sales
- 12.6.7.2 Import Traders
- 12.6.7.3 Stockholding Distributors
- 12.6.8 Subsegment Pricing and Adoption Trends
- 12.6.9 Leading Suppliers and Competition
- 12.6.10 Regional Demand and Opportunities
- 12.7 Segment Growth Comparison
- 12.8 Segment Attractiveness and Priority Matrix
Chapter 13 Australia Ferro-Silico-Manganese End-Use and Application Market Outlook
- 13.1 End-Use Industry and Customer Demand Structure
- 13.2 Leading Applications and Customer Groups
- 13.3 End-Use Market Size, Share and Forecast
- 13.4 Major End-Use Industry Deep Dives
- 13.4.1 Customer Requirements and Use Cases
- 13.4.2 Demand and Replacement Cycles
- 13.4.3 Technical and Regulatory Considerations
- 13.4.4 Purchasing and Procurement Models
- 13.4.5 Leading Vendors and Distribution Channels
- 13.4.6 Forecast and Commercial Opportunities
- 13.5 Emerging Applications and Cross-Segment Demand
- 13.6 End-Use Industry Investment Priorities
Chapter 14 Australia Ferro-Silico-Manganese Geographic Market Outlook, 2025-2035
- 14.1 Domestic Market Distribution and Demand Clusters
- 14.2 State- or Province-Wise Market Size and Forecast, 2025-2035
- 14.3 City and Metropolitan Market Outlook
- 14.4 Industrial, Manufacturing and Commercial Clusters
- 14.5 Geographic Concentration of Key End Users
- 14.6 Local Pricing and Purchasing Differences
- 14.7 Domestic Production Facilities and Capacity Map
- 14.8 Local Infrastructure and Project Pipeline
- 14.9 State-Level Policy and Incentive Differences
- 14.10 Subnational Investment Hotspots and Opportunities
- 14.11 Distribution and Logistics Networks
- 14.12 Domestic Competitive Footprint
Chapter 15 Australia Ferro-Silico-Manganese Technology, Innovation and Sustainability Outlook
- 15.1 Technology Landscape and Maturity
- 15.2 Product, Process and Service Innovation
- 15.3 AI, Automation and Digital Tools in the Industry
- 15.4 Technology Adoption and Performance Benchmarking
- 15.5 Innovation Pipeline and R&D Investment
- 15.6 Patent and Intellectual Property Trends
- 15.7 Energy Efficiency and Resource Management
- 15.8 Sustainability, Recycling and Circularity
- 15.9 Technology Roadmap, 2025-2035
- 15.10 Risks of Obsolescence and Technology Substitution
Chapter 16 Australia Ferro-Silico-Manganese Market Key Strategic Imperatives
- 16.1 Growth and Market Entry Priorities
- 16.2 High-Return Products and Segments
- 16.3 Pricing, Profitability and Cost Optimization
- 16.4 Technology Investment and Product Differentiation
- 16.5 Supply Chain Localization and Resilience
- 16.6 Distribution and Customer Acquisition
- 16.7 Partnership, Acquisition and Capacity Strategy
- 16.8 Regional Expansion Priorities
- 16.9 Short-, Medium- and Long-Term Actions
Chapter 17 Competition Outlook
- 17.1 Industry Competition Characteristics
- 17.2 Market Structure and Concentration
- 17.3 Market Share and Competitive Positioning, 2025
- 17.4 Company-Wise Revenue and Product Benchmarking
- 17.5 Production and Service Capacity Benchmarking
- 17.6 Technology, Pricing and Differentiation
- 17.7 Regional Footprint and Distribution Strength
- 17.8 Mergers, Acquisitions and Strategic Alliances
- 17.9 New Entrants and Competitive Threats
- 17.10 Porter's Five Forces and Industry Attractiveness
- 17.11 Competitive Outlook, 2025-2035
Chapter 18 Company Profiles
- 18.1 Company Coverage and Selection Criteria
- 18.2 Liberty Bell Bay
- 18.2.1 Business Description
- 18.2.2 Company Ownership and Geographic Presence
- 18.2.3 Product and Service Portfolio
- 18.2.4 Manufacturing and Operating Footprint
- 18.2.5 Production Capacity and Expansion Plans
- 18.2.6 Financial Performance and Investment
- 18.2.7 Market Share and Competitive Position
- 18.2.8 Technology and Innovation Capabilities
- 18.2.9 Strategic Alliances or Partnerships
- 18.2.10 Recent Developments
- 18.2.11 Growth Strategy and Outlook
- 18.3 OM Holdings
- 18.4 Vibgyor Resources
- 18.5 Oceania Impex Australia
- 18.6 DB Machine Tools
- 18.7 Hira Ferro Alloys
- 18.8 Eramet
- 18.9 Maithan Alloys
- 18.10 Tennant Metals
- 18.11 Westbrook Resources
- 18.12 Other Relevant Market Participants
Note: Every listed company is profiled on the structure shown under the first company. The company list is preliminary and may change based on research findings, market developments, data availability and client requirements.
Chapter 19 Disclaimer
- 19.1 Research and Forecast Disclaimer
- 19.2 Data Source and Estimation Limitations
Note: The depth of individual sections depends on data availability for this market. Volume, capacity, trade and other unit-based metrics are included where applicable.

