
Case systems move from pandemic tools to standing capacity
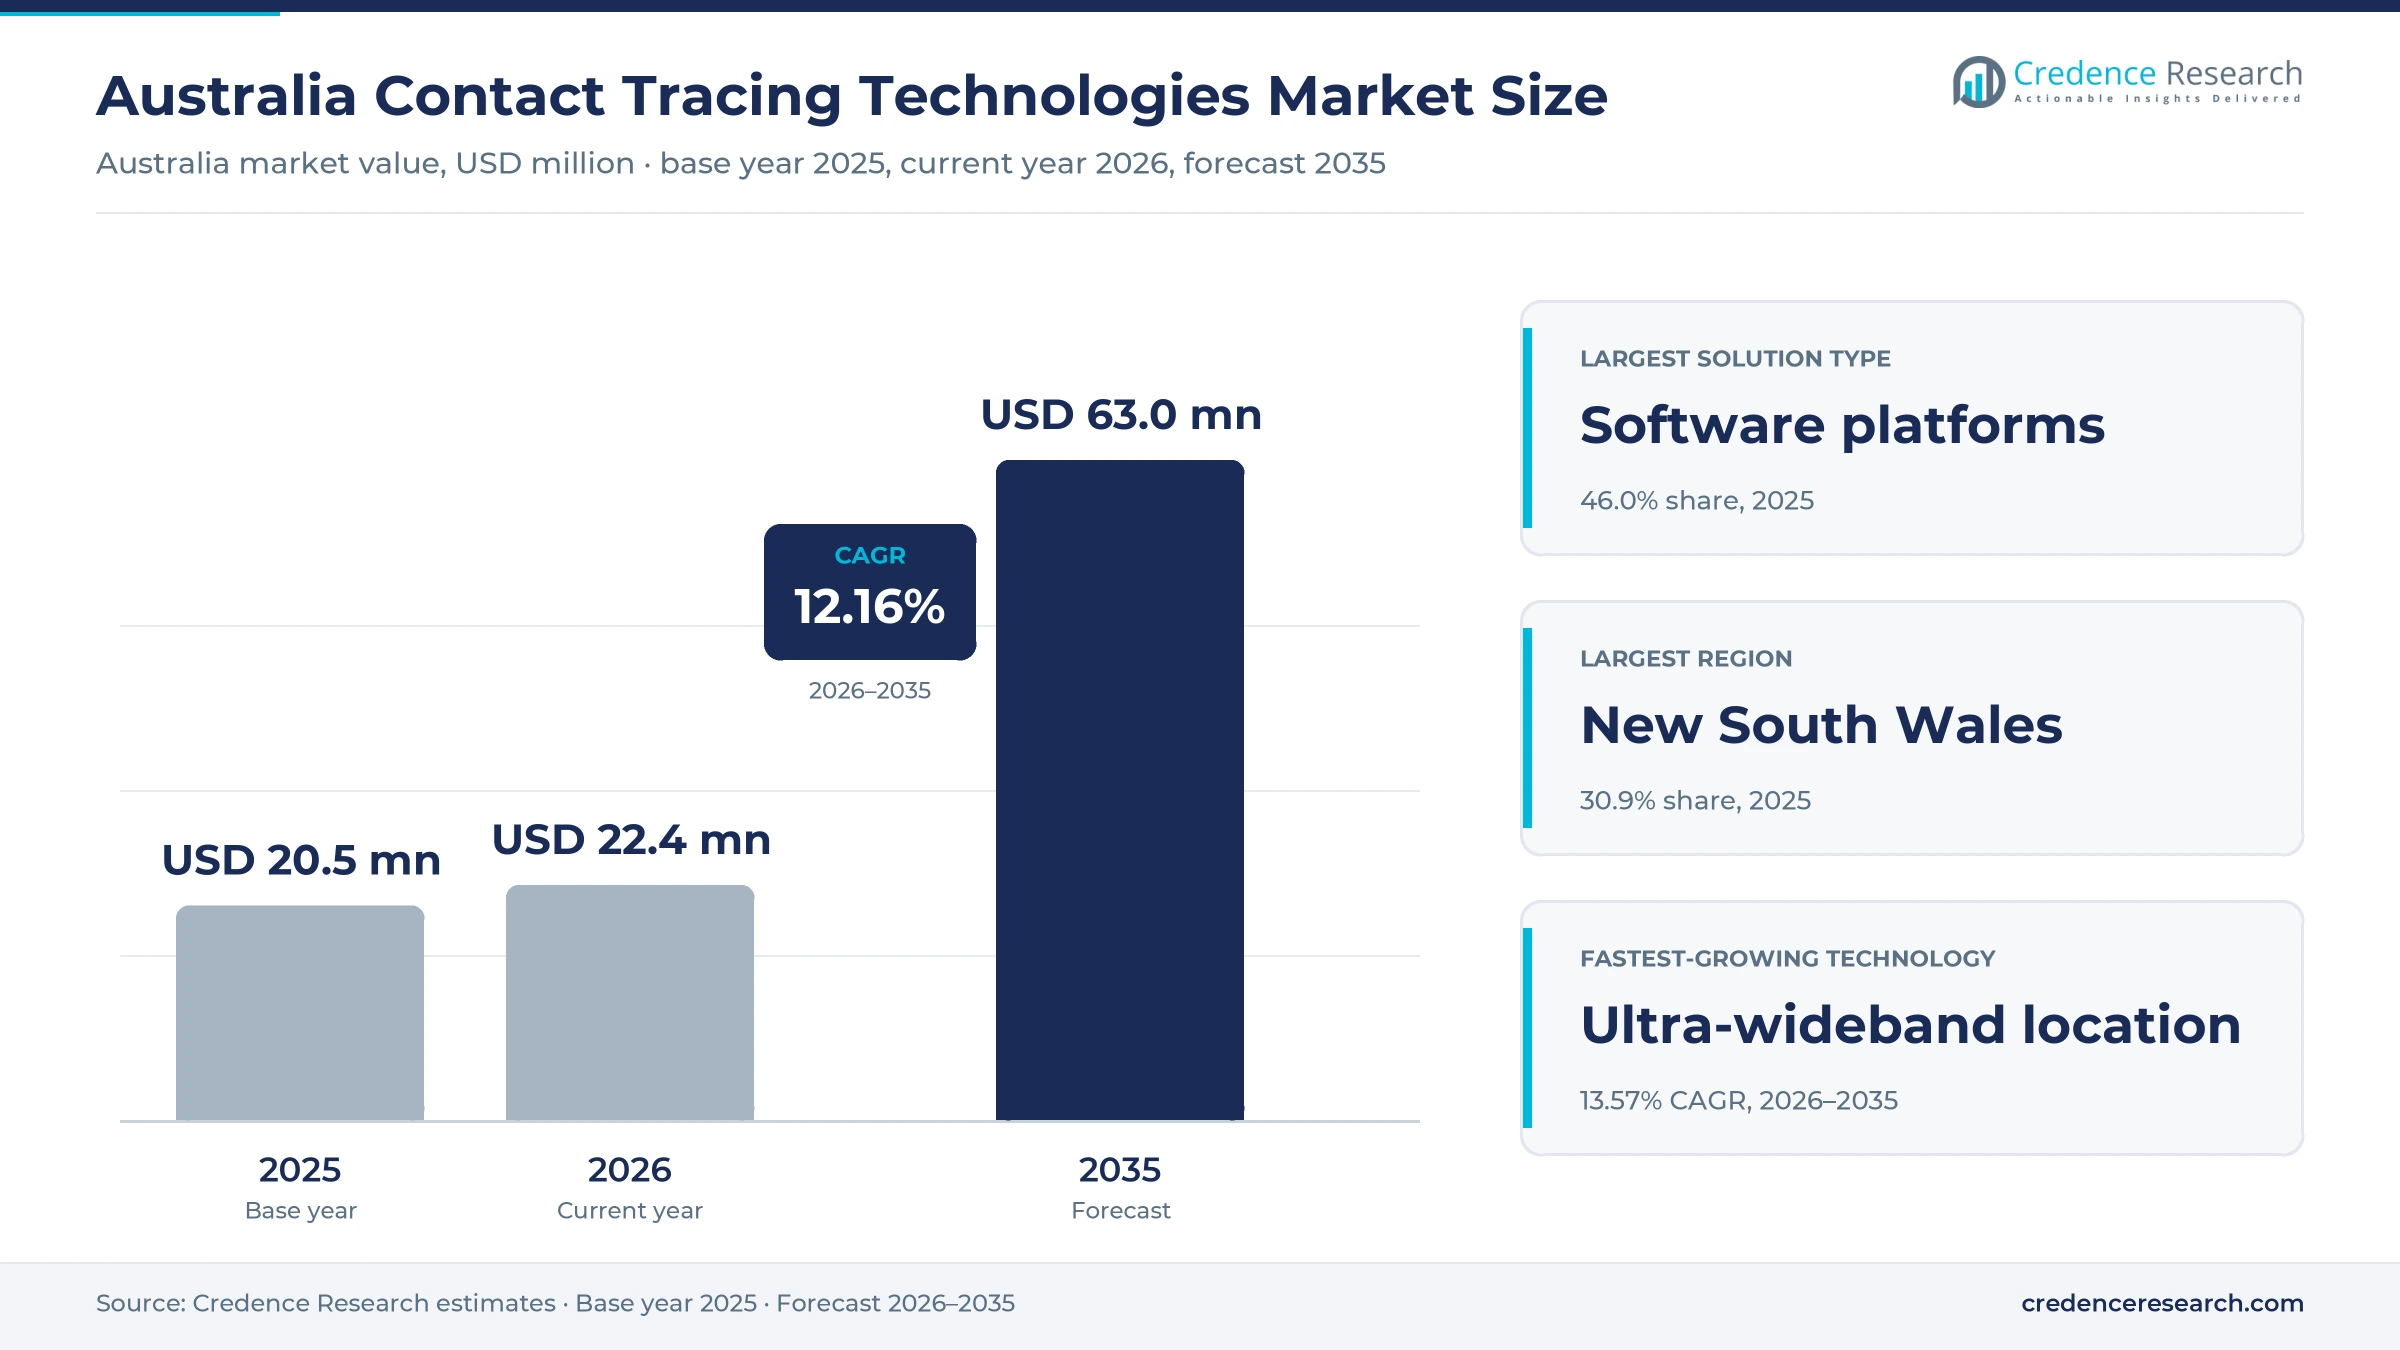
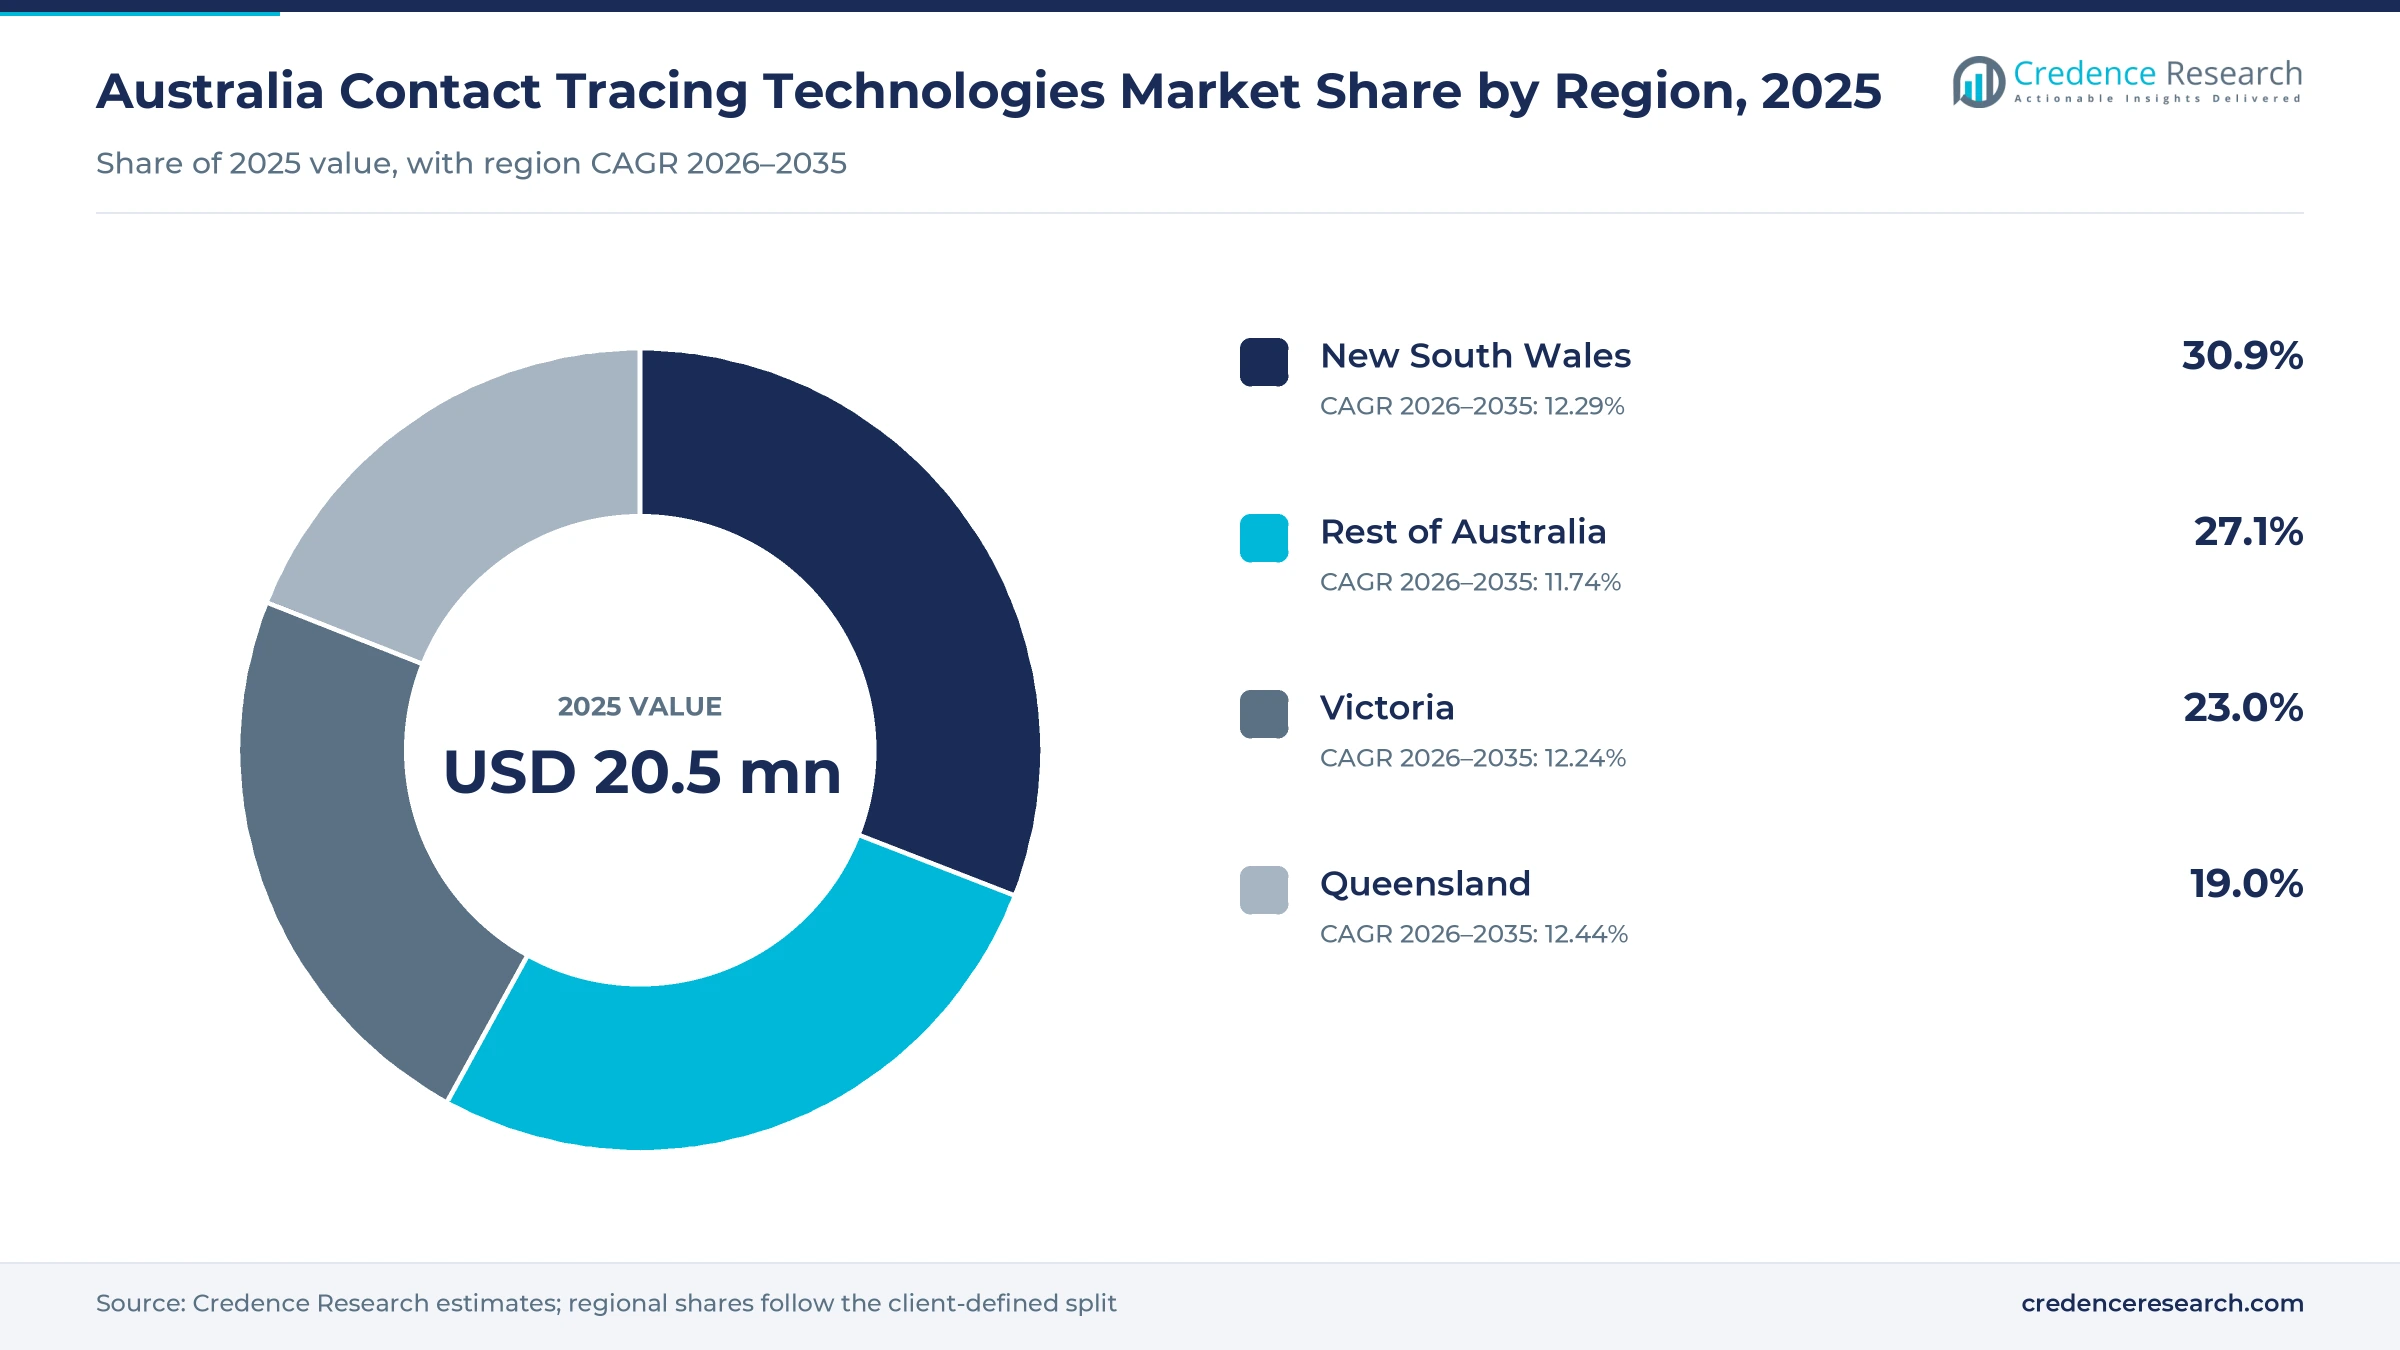
The Australia contact tracing technologies market was valued at USD 20.5 million in 2025 and is projected to increase from USD 22.4 million in 2026 to USD 63.0 million by 2035, registering a CAGR of 12.16% during 2026–2035. Demand now comes from state public health units that run measles, mpox and other notifiable disease investigations on case-record platforms, from hospitals that must trace contacts of patients with resistant organisms, and from aged care homes that need faster outbreak response. New South Wales held the largest regional share, 30.9% in 2025, because NSW Health runs the largest public health and hospital network in the country. Queensland is the fastest-growing region at 12.44% a year as population growth adds hospitals and care homes. In turn, the Australian Centre for Disease Control became an independent agency on Jan. 1, 2026, which gives national outbreak data and preparedness a permanent home and a long funding horizon.
Which tracing tools and services does the estimate count?
The estimate measures spending by Australian public health agencies, hospital providers, workplace operators and residential aged care providers on systems that find, record and follow up people exposed to an infection. It counts software platforms, proximity hardware such as badges and wristbands, implementation services and managed services delivered through direct vendor, systems integrator and specialist partner contracts.
The estimate excludes laboratory testing, vaccines, staff wages for contact tracers employed by health departments and general hospital record systems that are not used for exposure work. The value chain runs from cloud platform vendors and location hardware makers through integrators and specialist partners to state health departments, hospital infection prevention teams, aged care operators and large employers.
Australia Contact Tracing Technologies Market Insights
- The Australia contact tracing technologies market was valued at USD 20.5 million in 2025 and is projected to reach USD 63.0 million by 2035, registering a CAGR of 12.16% during 2026–2035.
- New South Wales held a 30.9% share of 2025 value, because the state runs the largest public health network and hospital system in Australia.
- Software Platforms led with a 46.0% share of 2025 value, as state health departments keep case-record systems in use for notifiable diseases.
- The Australian Centre for Disease Control began work as an independent agency on Jan. 1, 2026, backed by AUD 251.7 million over four years.
- Ultra-Wideband Location Systems grow fastest at 13.57% a year during 2026–2035, as hospitals seek precise, automatic records of patient and staff contact.
Software platforms lead while location systems grow fastest
Why do software platforms hold the largest share?
Based on solution type, the market is categorized into Software Platforms, Proximity Hardware, Implementation Services and Managed Services. Software Platforms led with a 46.0% share of 2025 value, because state health departments pay recurring subscriptions for case-record and outbreak management systems. Proximity Hardware grows fastest at 13.04% a year, as hospitals and aged care homes buy badges, wristbands and gateways for automatic contact capture.
Which customers fund most tracing purchases?
Based on customer type, the market is categorized into Public Health Agencies, Hospital Providers, Workplace Operators and Residential Aged Care Providers. Public Health Agencies led with a 48.0% share of 2025 value, because state public health units investigate every notifiable disease case. Residential Aged Care Providers grow fastest at 13.13% a year, as strengthened quality standards require each home to plan for outbreaks and name a trained infection control lead.
How do case management and hospital investigations split demand?
Based on application, the market is categorized into Public Health Case Management, Workplace Exposure Management and Healthcare Infection Investigation. Public Health Case Management led with a 55.0% share of 2025 value, because health departments track contacts for measles, mpox and dozens of other notifiable conditions. Healthcare Infection Investigation grows fastest at 13.03% a year, as hospitals face resistant organisms that need room and ward contact screening.
Why do location systems grow faster than case records?
Based on technology, the market is categorized into Case-Record Workflow Systems, Bluetooth Proximity Systems, Ultra-Wideband Location Systems and Access-Record Investigation Systems. Case-Record Workflow Systems led with a 52.0% share of 2025 value, because every investigation starts with a case record. Ultra-Wideband Location Systems grow fastest at 13.57% a year, as hospitals adopt real-time location systems that log distance and duration automatically.
| Segment Group | Leading Sub-segment | Share, 2025 | Fastest-growing Sub-segment | CAGR, 2026–2035 |
|---|---|---|---|---|
| By Solution Type | Software Platforms | 46.0% | Proximity Hardware | 13.04% |
| By Customer Type | Public Health Agencies | 48.0% | Residential Aged Care Providers | 13.13% |
| By Application | Public Health Case Management | 55.0% | Healthcare Infection Investigation | 13.03% |
| By Technology | Case-Record Workflow Systems | 52.0% | Ultra-Wideband Location Systems | 13.57% |
Request a Free Sample
Fill in your details and we'll send you a free sample report.
- Sample data tables & charts
- Research methodology
CDC, hospital infections and aged care rules drive demand
How does surveillance modernization lift platform spending?
Australia is turning pandemic-era tracing into permanent institutional capacity, which keeps case and outbreak platforms funded after the emergency ended. The Australian Centre for Disease Control began as an independent agency on Jan. 1, 2026, after the government committed AUD 251.7 million over four years and AUD 73.3 million a year from 2028-29, according to a Parliamentary Library bills digest. The same digest notes that the national notifiable disease system covers more than 70 diseases but is not interoperable with state systems. The new law also lets the agency direct entities to provide information, with civil penalties of 60 penalty units for failures. As a result, public health agencies hold 48.0% of 2025 value as states upgrade systems to share cleaner data.
Why do hospital infection investigations need tracing tools?
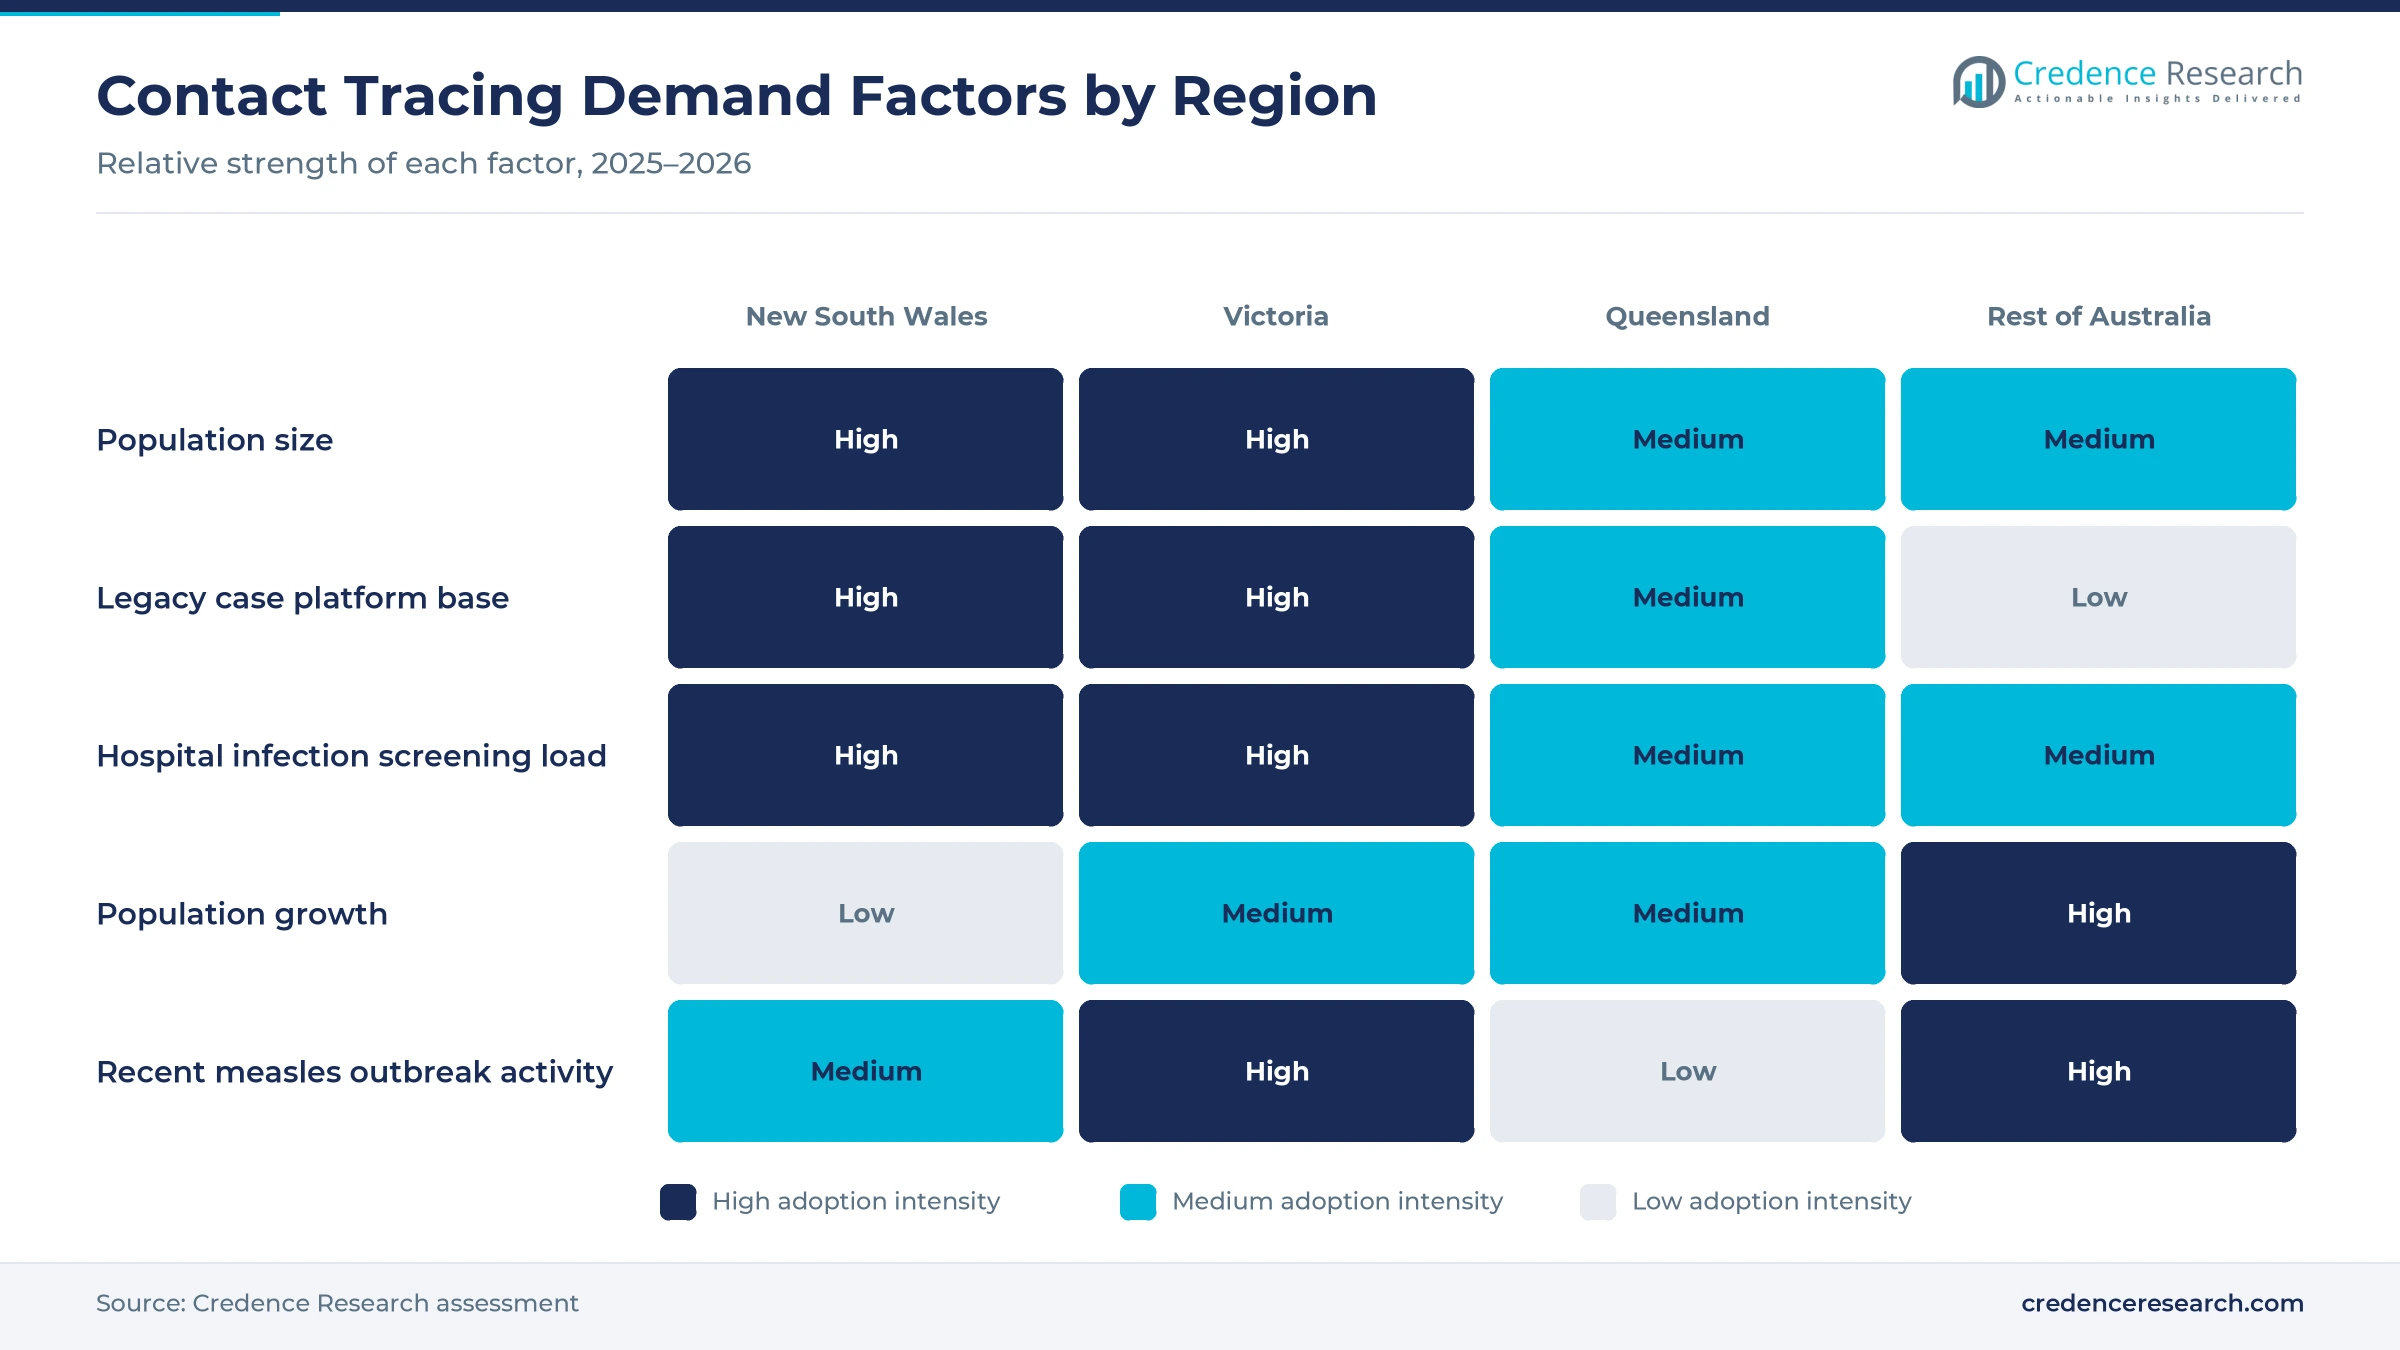
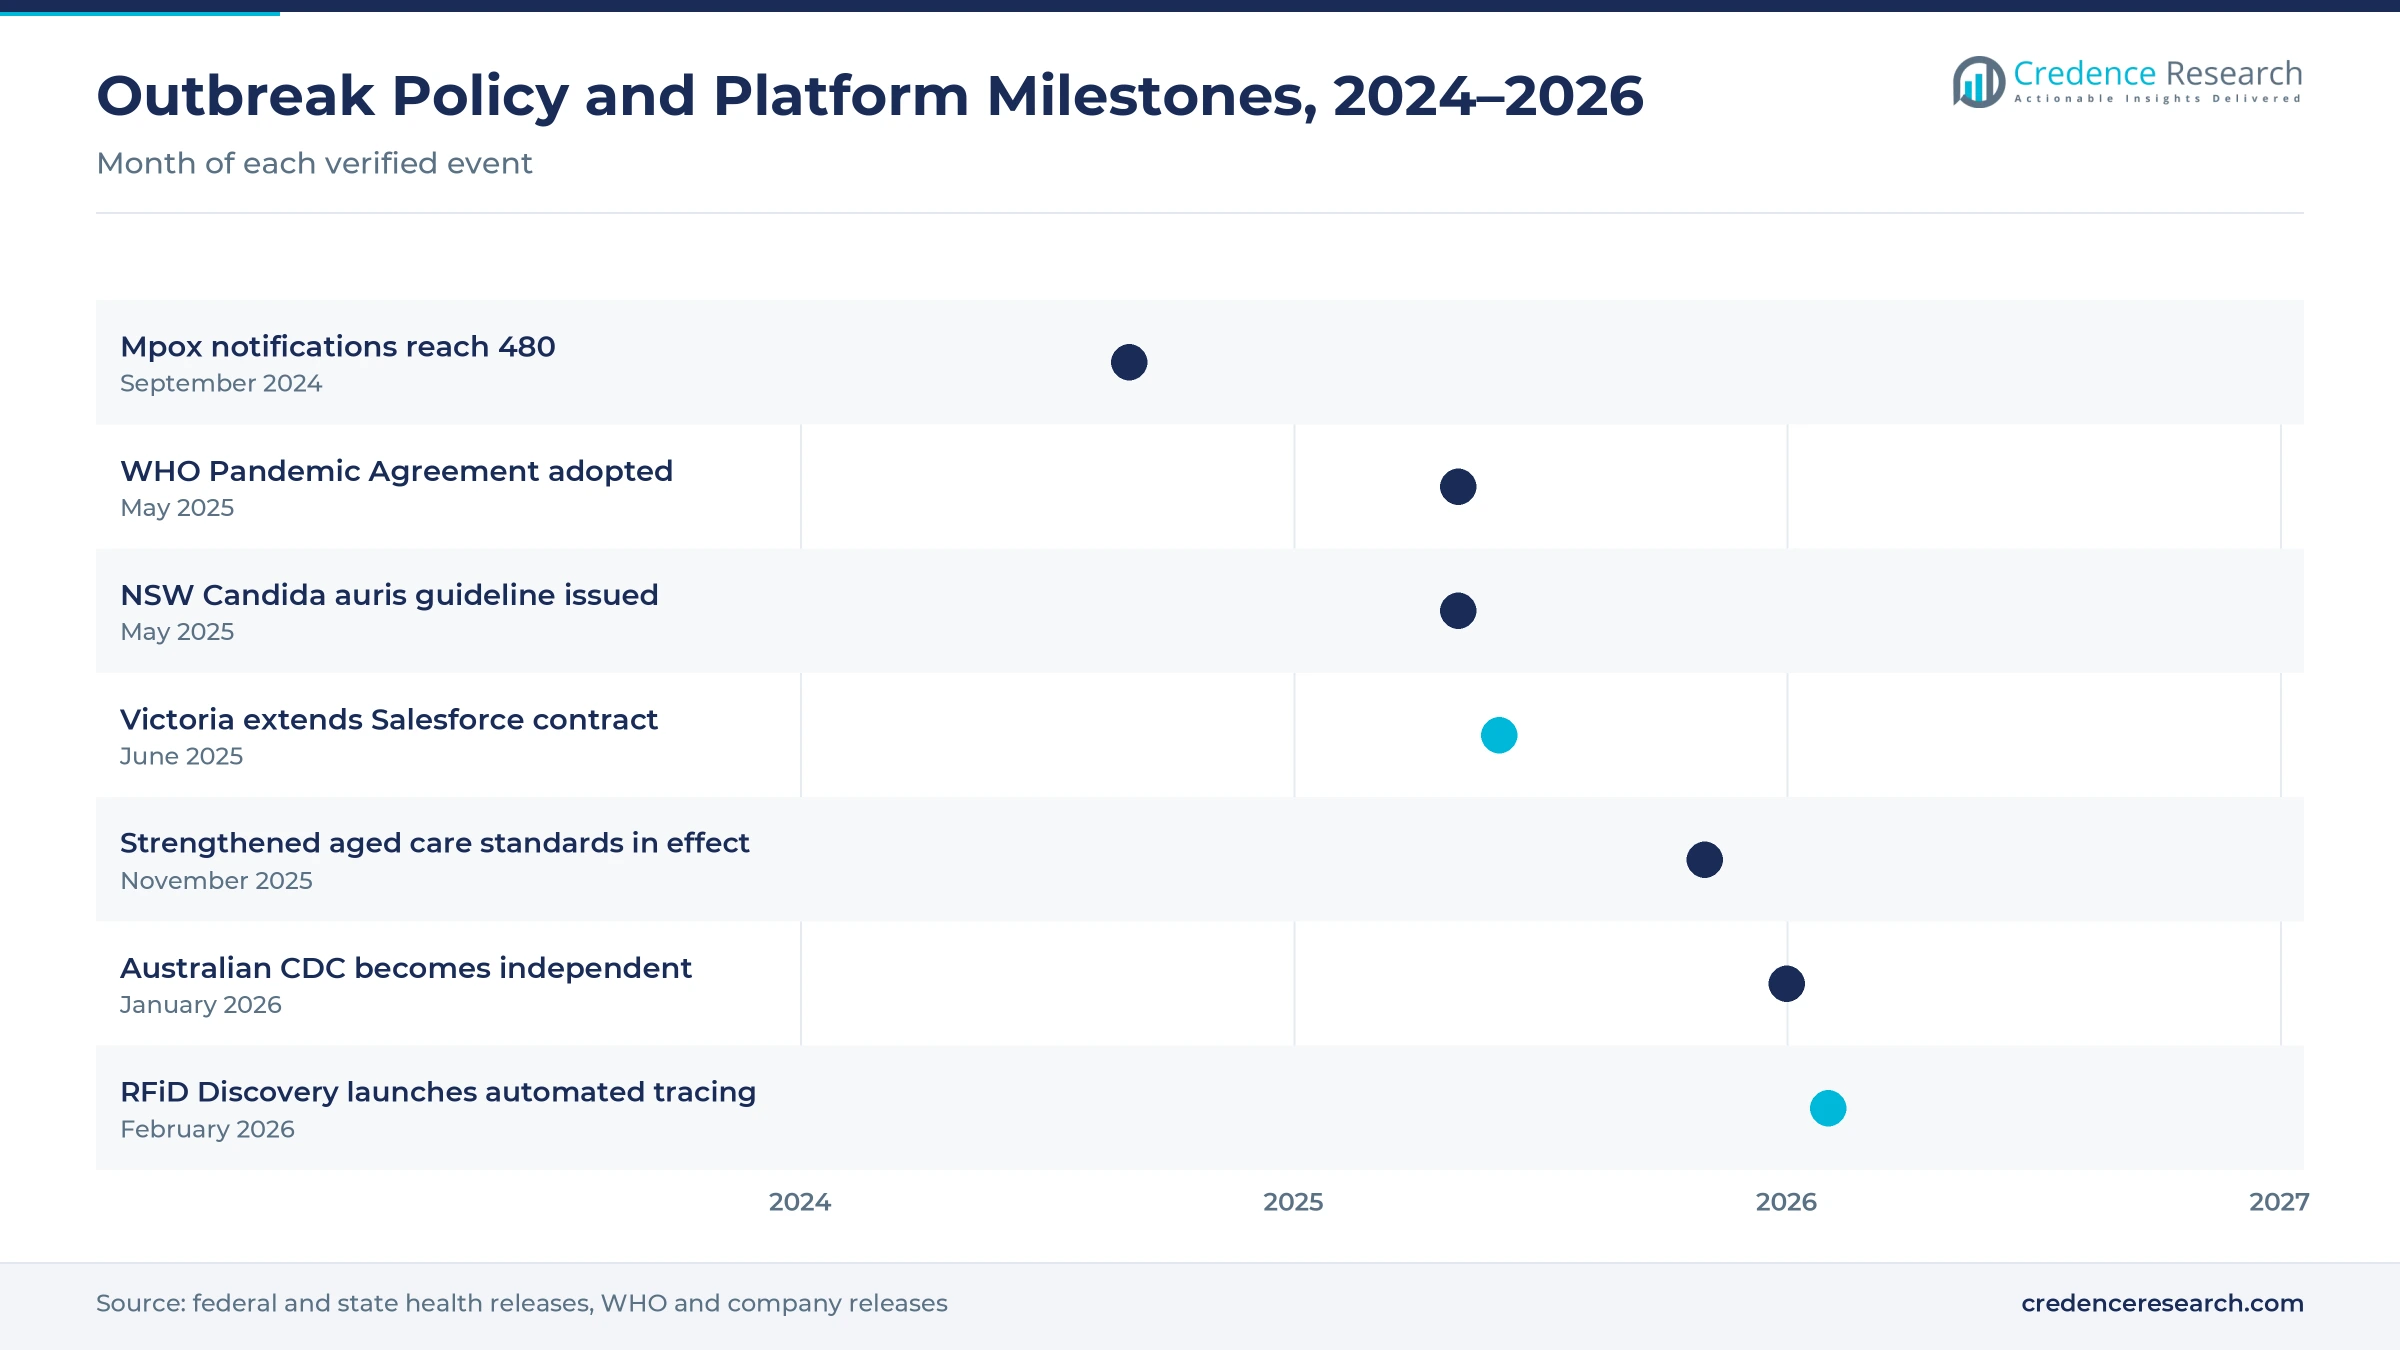
Hospitals must find every patient and worker exposed to a resistant organism, which turns contact tracing into a daily infection prevention task. Around 165,000 healthcare-associated infections occur in Australian health facilities each year and account for about two million bed days, according to the NSW Clinical Excellence Commission. NSW Health issued its Candida auris guideline on May 21, 2025, requiring up to three screening sets for higher-risk room contacts and alerts on the records of discharged contacts. Manual tracing struggles with that workload, because staff must rebuild movements from notes and rosters. In turn, healthcare infection investigation grows fastest among applications at 13.03% a year, and hospital providers buy more proximity tools.
How do aged care outbreak rules create new buyers?
Residential aged care homes carry the highest outbreak risk, and new national standards now require them to prove they can respond fast. The strengthened Aged Care Quality Standards took effect on Nov. 1, 2025, and require a trained infection prevention lead and precautions to respond promptly to outbreaks, according to the federal health department. The same standards ask providers to use infection and immunization rates of residents and workers to inform their systems. The Weekly Source, citing federal data, reported 104 active COVID-19 outbreaks in homes on March 6, 2025, and 7,318 resident deaths over the pandemic. As a result, residential aged care providers grow fastest at 13.13% a year.
Why do measles and mpox outbreaks keep tracing teams busy?
Measles and mpox have returned as regular outbreak work, which keeps state teams using case-record and exposure-site tools every week. Australia recorded 181 measles cases in 2025, according to The New Daily, citing national surveillance data. South Australia reached nine cases in September 2026, its highest total in 10 years, with 24 exposure sites including a public hospital, according to The Nightly. Mpox notifications reached 480 by Sept. 10, 2024, with 237 in New South Wales, according to MJA InSight+. Each case requires contacts to be listed, notified and followed for up to 18 days. In turn, public health case management holds 55.0% of 2025 value as outbreak caseloads stay high.
Automated badges and shared outbreak data reshape tracing
How is the shift away from consumer apps changing buyers?
Buyers are shifting from national smartphone apps toward institutional systems that sit inside health departments, hospitals and care homes. The federal COVIDSafe app cost about AUD 21 million and found only two positive cases and 17 close contacts that manual tracing missed before it was decommissioned on Aug. 10, 2022, according to SBS News. A New South Wales study cited in that report found the app detected 17 extra contacts among about 25,300 close contacts. The experience left governments wary of exposure notification apps for the general public. As a result, case-record workflow systems keep 52.0% of 2025 value while consumer app spending stays minimal.
Why are automated badge systems rising in hospital wards?
Hospitals and care homes are moving from manual recall to automatic capture of who was near an infectious patient. RFiD Discovery launched an automated contact tracing system that uses Bluetooth wristbands and staff badges to log duration, distance, time and location, according to RFID Journal in March 2026. The company reported deployments in more than 200 hospitals across the United Kingdom, Europe and beyond. Alfred Health and Monash University trialed Bluetooth tags and room beacons with health workers in Melbourne in December 2021, according to ChannelNews. In turn, Bluetooth proximity systems and proximity hardware gain share as hospitals replace manual recall with timed records.
Can shared national outbreak data open a platform opportunity?
National reform creates an opening for vendors that can connect state case systems to a single outbreak picture. The Parliamentary Library digest notes that the national surveillance system holds no identifiable data and does not interoperate with state systems. The new law allows data sharing declarations of up to 12 months during a severe public health threat. The World Health Assembly adopted the World Health Organization Pandemic Agreement on May 20, 2025, after a committee vote of 124 in favor with none against, which adds pressure for faster outbreak preparedness. As a result, integrators and infection surveillance software vendors can win interface and data projects.
Is there room for reusable cloud outbreak platforms?
Governments that bought cloud platforms during the pandemic can reuse them for new outbreaks, which opens recurring subscription and managed service work. Victoria selected Salesforce for its contact tracing system on Aug. 28, 2020, and a build team peaked at more than 200 people, according to department answers to a Victorian parliamentary inquiry. NSW Health configured its ServiceNow vaccination platform in 10 business days under a AUD 6.3 million deal, according to iTnews. The Victorian government extended its whole-of-state Salesforce purchase contract for three years on June 25, 2025, according to Salesforce. In turn, managed services keep a steady place in state budgets as health departments keep platforms ready for new outbreaks.
Privacy, app distrust and fragmented systems slow buyers
How does privacy concern limit location tracking?
Location and proximity data about patients and staff is sensitive, which makes unions, clinicians and families wary of any system that looks like surveillance. Aged care operator Goodwin stressed that its 2021 Smart Badge trial in Ainslie used Bluetooth proximity rather than location tracking, which helped staff accept it. As a result, vendors must design consent, retention limits and clear purposes into every deployment. Providers respond by limiting data use to infection investigations and deleting records on short schedules.
Why does the COVIDSafe record still weigh on buyers?
The low yield of the national app left many decision makers skeptical that digital tracing delivers value for money. Health Minister Mark Butler called the app a waste of taxpayer money when it was shut down in August 2022. In turn, business cases for new tracing tools face closer review from finance teams and boards. Vendors respond by tying proposals to measurable infection outcomes, such as fewer bed days lost to hospital-acquired infections.
How do fragmented state systems raise integration costs?
Each state and territory runs its own notifiable disease system, which forces vendors to build separate interfaces for every jurisdiction. Department answers to a Victorian parliamentary inquiry said Conduent Maven software ran the public health surveillance system in both New South Wales and Victoria. As a result, national data projects require custom mapping, testing and governance work. Integrators respond by offering reusable connectors that link outbreak data to e-health platforms, while the national agency works toward common standards.
Why do workplace exposure programs struggle to scale?
Most employers dropped formal tracing after pandemic rules eased, which leaves workplace exposure management as a small and uneven segment. WorkSafe Queensland says employers must still minimize COVID-19 risks as far as reasonably practicable under work health and safety laws. In turn, only high-risk sites such as hospitals, laboratories and large campuses fund dedicated tools. Vendors respond by bundling exposure features into access control and visitor management systems that employers already use.
New South Wales leads as outbreak work stays state-run
| Region | Value, 2025 (USD million) | Share, 2025 | CAGR, 2026–2035 |
|---|---|---|---|
| New South Wales | 6.3 | 30.9% | 12.29% |
| Rest of Australia | 5.6 | 27.1% | 11.74% |
| Victoria | 4.7 | 23.0% | 12.24% |
| Queensland | 3.9 | 19.0% | 12.44% |
Why does New South Wales lead tracing spending?
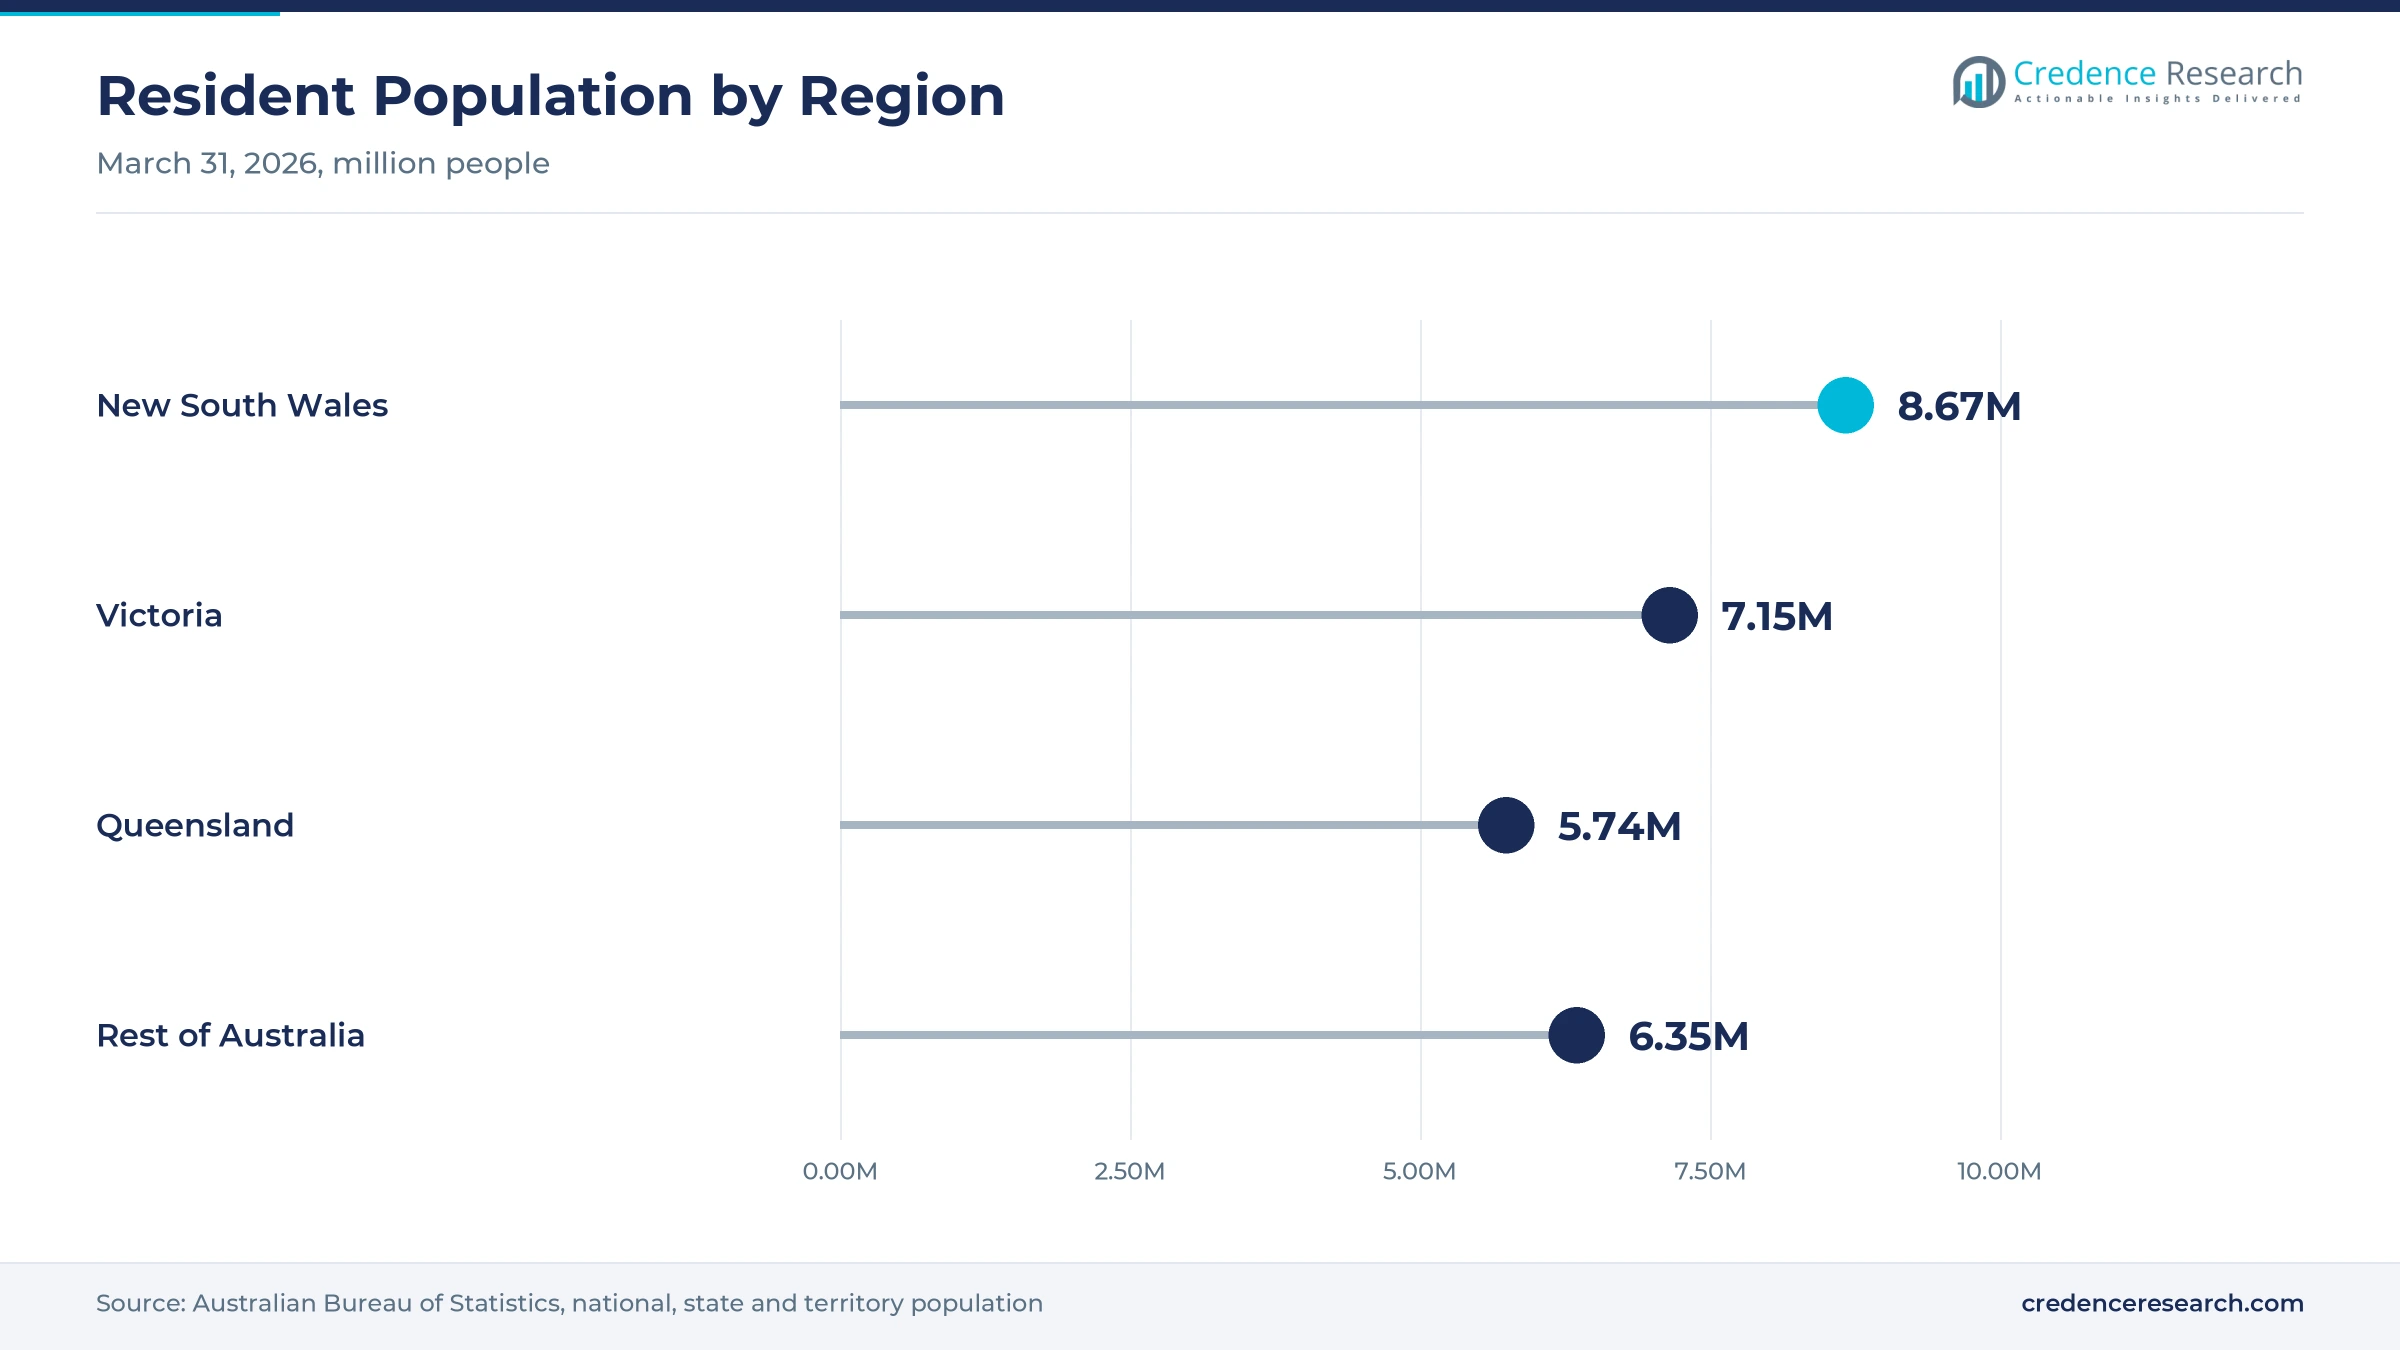
New South Wales held a 30.9% share of 2025 value and grows at 12.29% a year, because it has the largest population and public hospital network in Australia. The state had about 8.67 million residents on March 31, 2026, according to the Australian Bureau of Statistics. NSW Health also issued a statewide Candida auris guideline in May 2025 that sets contact screening rules for every facility. As a result, hospital infection investigation and public health case management both draw strong budgets in this region.
How do legacy pandemic platforms shape Victoria?
Victoria held a 23.0% share of 2025 value and grows at 12.24% a year, because the state built large case management systems during its 2020 outbreaks. Its Salesforce tracing platform and Conduent Maven surveillance system remain the base for later investigations, and the state renewed its Salesforce purchase contract in June 2025. The Department of Health reported local measles transmission in Melbourne in February 2026. In turn, upgrade and managed service work keeps this region the second largest.
Why is Queensland the fastest-growing region?
Queensland held a 19.0% share of 2025 value and grows fastest at 12.44% a year, because its population and care network are expanding quickly. The state had about 5.74 million residents on March 31, 2026, after growth of 1.6% over the year, according to the Australian Bureau of Statistics. Large distances between regional hospitals make automatic contact records more useful than manual recall. As a result, hospital providers and aged care homes add proximity tools faster than in older networks.
How do smaller states shape demand across the rest of Australia?
Rest of Australia held a 27.1% share of 2025 value and grows at 11.74% a year, as Western Australia, South Australia, Tasmania and the two territories buy in smaller lots. Western Australia grew 2.1% in the year to March 2026, the fastest of any state. South Australia traced contacts at the Queen Elizabeth Hospital during a nine-case measles cluster in September 2026. In turn, shared services and partner contracts suit buyers across this region.
Outbreak rules, platform deals and launches, 2025–2026
| Development | Status and market relevance |
|---|---|
| In May 2025, NSW Health issued its guideline for the management and control of Candida auris in NSW Health facilities. | Sets room and ward contact screening rules for every public facility |
| In June 2025, the Victorian government extended its whole-of-state purchase contract with Salesforce for three years. | Keeps cloud case platforms available to health agencies |
| In November 2025, the strengthened Aged Care Quality Standards took effect alongside the Aged Care Act 2024. | Requires an infection prevention lead and prompt outbreak response in every home |
| In January 2026, the Australian Centre for Disease Control began operating as an independent statutory agency. | Gives national outbreak data and preparedness a permanent home |
| In March 2026, RFID Journal reported that RFiD Discovery launched automated contact tracing using Bluetooth wristbands and staff badges. | Brings automatic exposure records to hospital infection teams |
Case records, badges and location data speed investigations
- Case-record workflow systems assign cases, list contacts and send isolation and testing messages, which lets a public health unit run several outbreaks at once from one queue.
- Bluetooth proximity systems use wristbands, badges and room beacons to log who was near whom and for how long, which replaces staff recall with timed records.
- Ultra-wideband location systems measure position to within a short distance indoors, which helps hospitals separate a true bedside contact from a person in the next room.
- Access-record investigation systems reuse door, visitor and roster logs to rebuild movements, which suits workplaces and campuses that do not want new wearables.
Need a Custom Version of This Report?
Tailor the scope, geography, or segments to your exact requirements.
- Custom geography or segment scope
- Direct access to our analyst team
Cloud case platforms and location specialists split work
Competition is split between cloud platform vendors that supply case-record systems to state health departments and specialist firms that sell proximity and location tools to hospitals and aged care homes. Salesforce built the Victorian contact tracing platform in 2020 and holds a whole-of-state purchase contract, while Conduent supplies the Maven surveillance software used in New South Wales and Victoria. ServiceNow supplied the NSW Health vaccination management platform, which shows how general workflow vendors reach public health buyers. RFiD Discovery sells Bluetooth wristband and badge tracing for hospital infection teams, and Aspen Medical distributed the Australian-developed Smart Badge used in aged care trials. Rivals compete on speed of configuration, integration with state systems, privacy design and local support, which favors vendors with existing government panels.
Which companies supply contact tracing tools in Australia?
| Company | Type | Role in the market |
|---|---|---|
| Salesforce | Cloud platform vendor | Victorian contact tracing platform and whole-of-state contract |
| Conduent | Surveillance software vendor | Maven system behind NSW and Victorian disease surveillance |
| ServiceNow | Workflow platform vendor | NSW Health vaccination administration platform |
| RFiD Discovery | Location specialist | Bluetooth wristband and badge contact tracing for hospitals |
| Aspen Medical | Distributor | Distributed Smart Badge for proximity tracing in aged care |
Institutional systems replace consumer tracing apps
Credence Research's view is that the Australia contact tracing technologies market will grow because tracing has moved from a public smartphone app into the daily systems of health departments, hospitals and aged care homes. Software platforms remain the largest value pool, while ultra-wideband location systems and residential aged care buyers add the fastest growth. Vendors that connect cleanly to state surveillance systems and to the new national agency should gain share. Privacy concerns, the poor record of the national app and fragmented state systems will slow some purchases.
Model built from public health and procurement records
The report uses 2025 as the base year on a calendar basis, and market values come from the Credence Research model. That model draws on federal and state health releases, parliamentary records, national quality standards, population statistics and company releases on platforms, contracts and launches. Segment splits and region growth rates are Credence Research estimates, while region shares follow the client-defined split. Sources used are official statistics, government and parliamentary documents, regulator guidance, trade press and company releases, and no interviews or surveys were used.
Hospital and aged care tracing carries growth to 2035
The Australia contact tracing technologies market is expected to reach USD 63.0 million by 2035, a 12.16% CAGR during 2026–2035, as outbreak response becomes standing capacity rather than an emergency project. Growth should be strongest while the national agency builds shared data links and aged care homes upgrade outbreak systems under the new standards. After that, automatic proximity and location tools in hospitals will carry more of the value. A new pandemic would lift demand sharply, while stricter privacy rules would slow wearable deployments.
Frequently Asked Questions
How big is the Australia contact tracing technologies market?
Which solution type leads Australian contact tracing spending?
Which region leads Australian contact tracing spending?
What role does the Australian Centre for Disease Control play?
Why are aged care homes investing in outbreak tools?
Which technology is growing fastest?
Who are the leading companies in Australian contact tracing?
What are the main challenges for contact tracing buyers?
Table of Content
Chapter 1 Market Segmentation
- 1.1 Segmentation Framework
- 1.1.1 Product and Service Classification
- 1.1.2 Application and End-Use Classification
- 1.1.3 Technology and Solution Classification
- 1.1.4 Customer and Distribution Channel Classification
- 1.1.5 Geographic Segmentation
- 1.1.6 Market Segment Definitions and Boundaries
- 1.2 By Solution Type
- 1.2.1 Software Platforms
- 1.2.2 Proximity Hardware
- 1.2.3 Implementation Services
- 1.2.4 Managed Services
- 1.3 By Customer Type
- 1.3.1 Public Health Agencies
- 1.3.2 Hospital Providers
- 1.3.3 Workplace Operators
- 1.3.4 Residential Aged Care Providers
- 1.4 By Application
- 1.4.1 Public Health Case Management
- 1.4.2 Workplace Exposure Management
- 1.4.3 Healthcare Infection Investigation
- 1.5 By Technology
- 1.5.1 Case-Record Workflow Systems
- 1.5.2 Bluetooth Proximity Systems
- 1.5.3 Ultra-Wideband Location Systems
- 1.5.4 Access-Record Investigation Systems
Chapter 2 Introduction
- 2.1 Report Objectives and Scope
- 2.2 Product Definition and Industry Terminology
- 2.3 Market Inclusions and Exclusions
- 2.4 Research Process
- 2.4.1 Primary Research and Expert Interviews
- 2.4.2 Secondary Research and Source Review
- 2.4.3 Top-Down and Bottom-Up Estimation
- 2.4.4 Data Triangulation and Verification
- 2.5 Market Size Measurement Basis
- 2.5.1 2025: USD 20.5 million → 2035: USD 63.0 million
- 2.6 Historical and Forecast Reference Periods
- 2.6.1 Historical Period: 2018-2025
- 2.6.2 Base Year: 2025
- 2.6.3 Forecast Period: 2025-2035
- 2.7 Research Assumptions and Limitations
Chapter 3 Executive Summary
- 3.1 Market Snapshot and Key Findings
- 3.2 Base-Year Market Size, 2025
- 3.3 Forecast Market Size, 2035
- 3.4 Revenue and Volume Growth Outlook
- 3.5 Key Demand and Supply Indicators
- 3.6 Leading Market Segments
- 3.7 Fastest-Growing Market Opportunities
- 3.8 Regional Performance Highlights
- 3.9 Technology and Industry Transformation
- 3.10 Competitive Landscape Summary
- 3.11 Analyst View and Strategic Implications
Chapter 4 Australia Contact Tracing Technologies Market Trends and Developments
- 4.1 Historical Industry Development, 2018-2025
- 4.2 Recent Market Trends and Developments
- 4.3 Demand and Customer Behavior Trends
- 4.4 Technology and Product Innovation
- 4.5 Artificial Intelligence, Automation and Digitalization
- 4.6 Local Manufacturing and Supply Chain Realignment
- 4.7 Industry Partnerships, Mergers and Acquisitions
- 4.8 Sustainability and Circular Economy Developments
- 4.9 Government and Private Sector Investment Trends
- 4.10 Emerging Business Models and Commercialization
- 4.11 Industry Developments and Announcements
Chapter 5 Australia Contact Tracing Technologies Market Production, Supply and Demand Analysis
- 5.1 Demand Trend and Consumption Analysis, 2018-2025
- 5.2 Demand Forecast, 2025-2035
- 5.3 Production and Output Trend, 2018-2025
- 5.4 Production and Output Forecast, 2025-2035
- 5.5 Installed Capacity and Capacity Utilization
- 5.6 Company-Wise Production Plants and Statistics
- 5.6.1 Installed Production Capacity
- 5.6.2 Actual Production
- 5.6.3 Planned Capacity and Expansion Targets
- 5.7 Supply Chain Structure and Procurement Trends
- 5.8 Supply-Demand Gap and Bottlenecks
- 5.9 Import Dependence and Sourcing Structure
- 5.10 Contract Manufacturing and Outsourcing
- 5.11 Regional Supply and Demand Concentration
Chapter 6 Australia Contact Tracing Technologies Market Pricing Analysis
- 6.1 Pricing Structure and Measurement
- 6.2 Historical Pricing Trends, 2018-2025
- 6.3 Pricing Outlook, 2025-2035
- 6.4 Average Selling Price and Unit Economics
- 6.5 Pricing by Product and Market Segment
- 6.6 Geographic Pricing Differences
- 6.7 Key Input, Energy, Labor and Logistics Costs
- 6.8 Contract Pricing and Purchasing Models
- 6.9 Pricing Sensitivity and Competitive Positioning
- 6.10 Price, Margin and Profitability Implications
Chapter 7 Australia Contact Tracing Technologies Market Dynamics
- 7.1 Market Growth Drivers
- 7.1.1 Demand-Side Drivers
- 7.1.2 Technology and Innovation Drivers
- 7.1.3 Infrastructure and Investment Drivers
- 7.1.4 Regulatory and Policy Drivers
- 7.2 Market Restraints
- 7.2.1 Cost and Affordability Constraints
- 7.2.2 Technology and Adoption Barriers
- 7.2.3 Supply Chain and Operational Constraints
- 7.3 Market Challenges
- 7.3.1 Competitive Pressure and Margin Erosion
- 7.3.2 Skills, Infrastructure and Implementation Gaps
- 7.4 Emerging Market Opportunities
- 7.5 Market Dynamics Impact and Time-Horizon Assessment
Chapter 8 Australia Contact Tracing Technologies Value Chain Analysis
- 8.1 Industry Value Chain Overview
- 8.2 Upstream Suppliers and Critical Inputs
- 8.3 Technology and Component Providers
- 8.4 Manufacturing or Service Delivery
- 8.5 Distribution, Channel Partners and Integrators
- 8.6 Downstream Applications and End Users
- 8.7 Value Addition and Profit Pools
- 8.8 Vertical Integration and Outsourcing
- 8.9 Supplier Concentration and Risk
- 8.10 Supply Chain Localization and Resilience
Chapter 9 Australia Contact Tracing Technologies Market Regulations and Policies
- 9.1 Relevant Laws, Standards and Compliance Frameworks
- 9.2 Product, Service, Safety and Quality Requirements
- 9.3 Government Policies, Incentives and Subsidies
- 9.4 Imports, Exports and Trade Barriers
- 9.5 Public Procurement and Local Content Requirements
- 9.6 Environmental and Sustainability Compliance
- 9.7 Upcoming Policy Changes and Market Implications
Chapter 10 Australia Contact Tracing Technologies Market Hotspots and Opportunities
- 10.1 Market Opportunity Mapping and Growth Hotspots
- 10.2 High-Growth Applications and Customer Groups
- 10.3 Underserved Markets and White-Space Opportunities
- 10.4 Emerging Technology and Product Opportunities
- 10.5 New Capacity and Investment Hotspots
- 10.6 Market Entry and Expansion Opportunities
- 10.7 Distribution and Partnership Opportunities
- 10.8 Near-Term and Long-Term Commercial Potential
- 10.9 Opportunity Attractiveness and Execution Risks
Chapter 11 Australia Contact Tracing Technologies Market Outlook, 2025-2035
- 11.1 Market Size and Analysis
- 11.1.1 Revenue (Market Measurement: 2025: USD 20.5 million → 2035: USD 63.0 million)
- 11.1.2 Market Volume and Quantity Sold
- 11.1.3 Historical Market Size, 2018-2025
- 11.1.4 Base-Year Market Size, 2025
- 11.2 Market Forecast, 2025-2035
- 11.2.1 Revenue Forecast to 2035
- 11.2.2 Volume Forecast to 2035
- 11.2.3 CAGR and Year-on-Year Growth
- 11.2.4 Incremental Revenue Opportunity
- 11.3 Forecast Assumptions and Scenario Analysis
- 11.3.1 Base-Case Forecast
- 11.3.2 Optimistic and Conservative Scenarios
- 11.3.3 Technology, Pricing and Policy Sensitivities
- 11.4 Market Attractiveness and Growth Outlook
Chapter 12 Australia Contact Tracing Technologies Market Segmentation and Outlook
- 12.1 Segmentation Summary and Market Shares, 2025
- 12.2 Largest and Fastest-Growing Segments
- 12.3 By Solution Type - Market Size and Forecast, 2025-2035
- 12.3.1 Segment Definition and Scope
- 12.3.2 Historical Market Size, 2018-2025
- 12.3.3 Revenue Forecast, 2025-2035
- 12.3.4 Volume Forecast, 2025-2035
- 12.3.5 Base-Year Market Share, 2025
- 12.3.6 Segment CAGR and Growth Drivers
- 12.3.7 Subsegment Market Size and Forecast
- 12.3.7.1 Software Platforms
- 12.3.7.2 Proximity Hardware
- 12.3.7.3 Implementation Services
- 12.3.7.4 Managed Services
- 12.3.8 Subsegment Pricing and Adoption Trends
- 12.3.9 Leading Suppliers and Competition
- 12.3.10 Regional Demand and Opportunities
- 12.4 By Customer Type - Market Size and Forecast, 2025-2035
- 12.4.1 Segment Definition and Scope
- 12.4.2 Historical Market Size, 2018-2025
- 12.4.3 Revenue Forecast, 2025-2035
- 12.4.4 Volume Forecast, 2025-2035
- 12.4.5 Base-Year Market Share, 2025
- 12.4.6 Segment CAGR and Growth Drivers
- 12.4.7 Subsegment Market Size and Forecast
- 12.4.7.1 Public Health Agencies
- 12.4.7.2 Hospital Providers
- 12.4.7.3 Workplace Operators
- 12.4.7.4 Residential Aged Care Providers
- 12.4.8 Subsegment Pricing and Adoption Trends
- 12.4.9 Leading Suppliers and Competition
- 12.4.10 Regional Demand and Opportunities
- 12.5 By Application - Market Size and Forecast, 2025-2035
- 12.5.1 Segment Definition and Scope
- 12.5.2 Historical Market Size, 2018-2025
- 12.5.3 Revenue Forecast, 2025-2035
- 12.5.4 Volume Forecast, 2025-2035
- 12.5.5 Base-Year Market Share, 2025
- 12.5.6 Segment CAGR and Growth Drivers
- 12.5.7 Subsegment Market Size and Forecast
- 12.5.7.1 Public Health Case Management
- 12.5.7.2 Workplace Exposure Management
- 12.5.7.3 Healthcare Infection Investigation
- 12.5.8 Subsegment Pricing and Adoption Trends
- 12.5.9 Leading Suppliers and Competition
- 12.5.10 Regional Demand and Opportunities
- 12.6 By Technology - Market Size and Forecast, 2025-2035
- 12.6.1 Segment Definition and Scope
- 12.6.2 Historical Market Size, 2018-2025
- 12.6.3 Revenue Forecast, 2025-2035
- 12.6.4 Volume Forecast, 2025-2035
- 12.6.5 Base-Year Market Share, 2025
- 12.6.6 Segment CAGR and Growth Drivers
- 12.6.7 Subsegment Market Size and Forecast
- 12.6.7.1 Case-Record Workflow Systems
- 12.6.7.2 Bluetooth Proximity Systems
- 12.6.7.3 Ultra-Wideband Location Systems
- 12.6.7.4 Access-Record Investigation Systems
- 12.6.8 Subsegment Pricing and Adoption Trends
- 12.6.9 Leading Suppliers and Competition
- 12.6.10 Regional Demand and Opportunities
- 12.7 Segment Growth Comparison
- 12.8 Segment Attractiveness and Priority Matrix
Chapter 13 Australia Contact Tracing Technologies End-Use and Application Market Outlook
- 13.1 End-Use Industry and Customer Demand Structure
- 13.2 Leading Applications and Customer Groups
- 13.3 End-Use Market Size, Share and Forecast
- 13.4 Major End-Use Industry Deep Dives
- 13.4.1 Customer Requirements and Use Cases
- 13.4.2 Demand and Replacement Cycles
- 13.4.3 Technical and Regulatory Considerations
- 13.4.4 Purchasing and Procurement Models
- 13.4.5 Leading Vendors and Distribution Channels
- 13.4.6 Forecast and Commercial Opportunities
- 13.5 Emerging Applications and Cross-Segment Demand
- 13.6 End-Use Industry Investment Priorities
Chapter 14 Australia Contact Tracing Technologies Geographic Market Outlook, 2025-2035
- 14.1 Domestic Market Distribution and Demand Clusters
- 14.2 State- or Province-Wise Market Size and Forecast, 2025-2035
- 14.3 City and Metropolitan Market Outlook
- 14.4 Industrial, Manufacturing and Commercial Clusters
- 14.5 Geographic Concentration of Key End Users
- 14.6 Local Pricing and Purchasing Differences
- 14.7 Domestic Production Facilities and Capacity Map
- 14.8 Local Infrastructure and Project Pipeline
- 14.9 State-Level Policy and Incentive Differences
- 14.10 Subnational Investment Hotspots and Opportunities
- 14.11 Distribution and Logistics Networks
- 14.12 Domestic Competitive Footprint
Chapter 15 Australia Contact Tracing Technologies Technology, Innovation and Sustainability Outlook
- 15.1 Technology Landscape and Maturity
- 15.2 Product, Process and Service Innovation
- 15.3 AI, Automation and Digital Tools in the Industry
- 15.4 Technology Adoption and Performance Benchmarking
- 15.5 Innovation Pipeline and R&D Investment
- 15.6 Patent and Intellectual Property Trends
- 15.7 Energy Efficiency and Resource Management
- 15.8 Sustainability, Recycling and Circularity
- 15.9 Technology Roadmap, 2025-2035
- 15.10 Risks of Obsolescence and Technology Substitution
Chapter 16 Australia Contact Tracing Technologies Market Key Strategic Imperatives
- 16.1 Growth and Market Entry Priorities
- 16.2 High-Return Products and Segments
- 16.3 Pricing, Profitability and Cost Optimization
- 16.4 Technology Investment and Product Differentiation
- 16.5 Supply Chain Localization and Resilience
- 16.6 Distribution and Customer Acquisition
- 16.7 Partnership, Acquisition and Capacity Strategy
- 16.8 Regional Expansion Priorities
- 16.9 Short-, Medium- and Long-Term Actions
Chapter 17 Competition Outlook
- 17.1 Industry Competition Characteristics
- 17.2 Market Structure and Concentration
- 17.3 Market Share and Competitive Positioning, 2025
- 17.4 Company-Wise Revenue and Product Benchmarking
- 17.5 Production and Service Capacity Benchmarking
- 17.6 Technology, Pricing and Differentiation
- 17.7 Regional Footprint and Distribution Strength
- 17.8 Mergers, Acquisitions and Strategic Alliances
- 17.9 New Entrants and Competitive Threats
- 17.10 Porter's Five Forces and Industry Attractiveness
- 17.11 Competitive Outlook, 2025-2035
Chapter 18 Company Profiles
- 18.1 Company Coverage and Selection Criteria
- 18.2 Salesforce
- 18.2.1 Business Description
- 18.2.2 Company Ownership and Geographic Presence
- 18.2.3 Product and Service Portfolio
- 18.2.4 Manufacturing and Operating Footprint
- 18.2.5 Production Capacity and Expansion Plans
- 18.2.6 Financial Performance and Investment
- 18.2.7 Market Share and Competitive Position
- 18.2.8 Technology and Innovation Capabilities
- 18.2.9 Strategic Alliances or Partnerships
- 18.2.10 Recent Developments
- 18.2.11 Growth Strategy and Outlook
- 18.3 Conduent
- 18.4 ServiceNow
- 18.5 RFiD Discovery
- 18.6 Intelligent RFID Solutions
- 18.7 Aspen Medical
- 18.8 Other Relevant Market Participants
Note: Every listed company is profiled on the structure shown under the first company. The company list is preliminary and may change based on research findings, market developments, data availability and client requirements.
Chapter 19 Disclaimer
- 19.1 Research and Forecast Disclaimer
- 19.2 Data Source and Estimation Limitations
Note: The depth of individual sections depends on data availability for this market. Volume, capacity, trade and other unit-based metrics are included where applicable.

