
Telehealth, booking apps and hospital portals meet patients
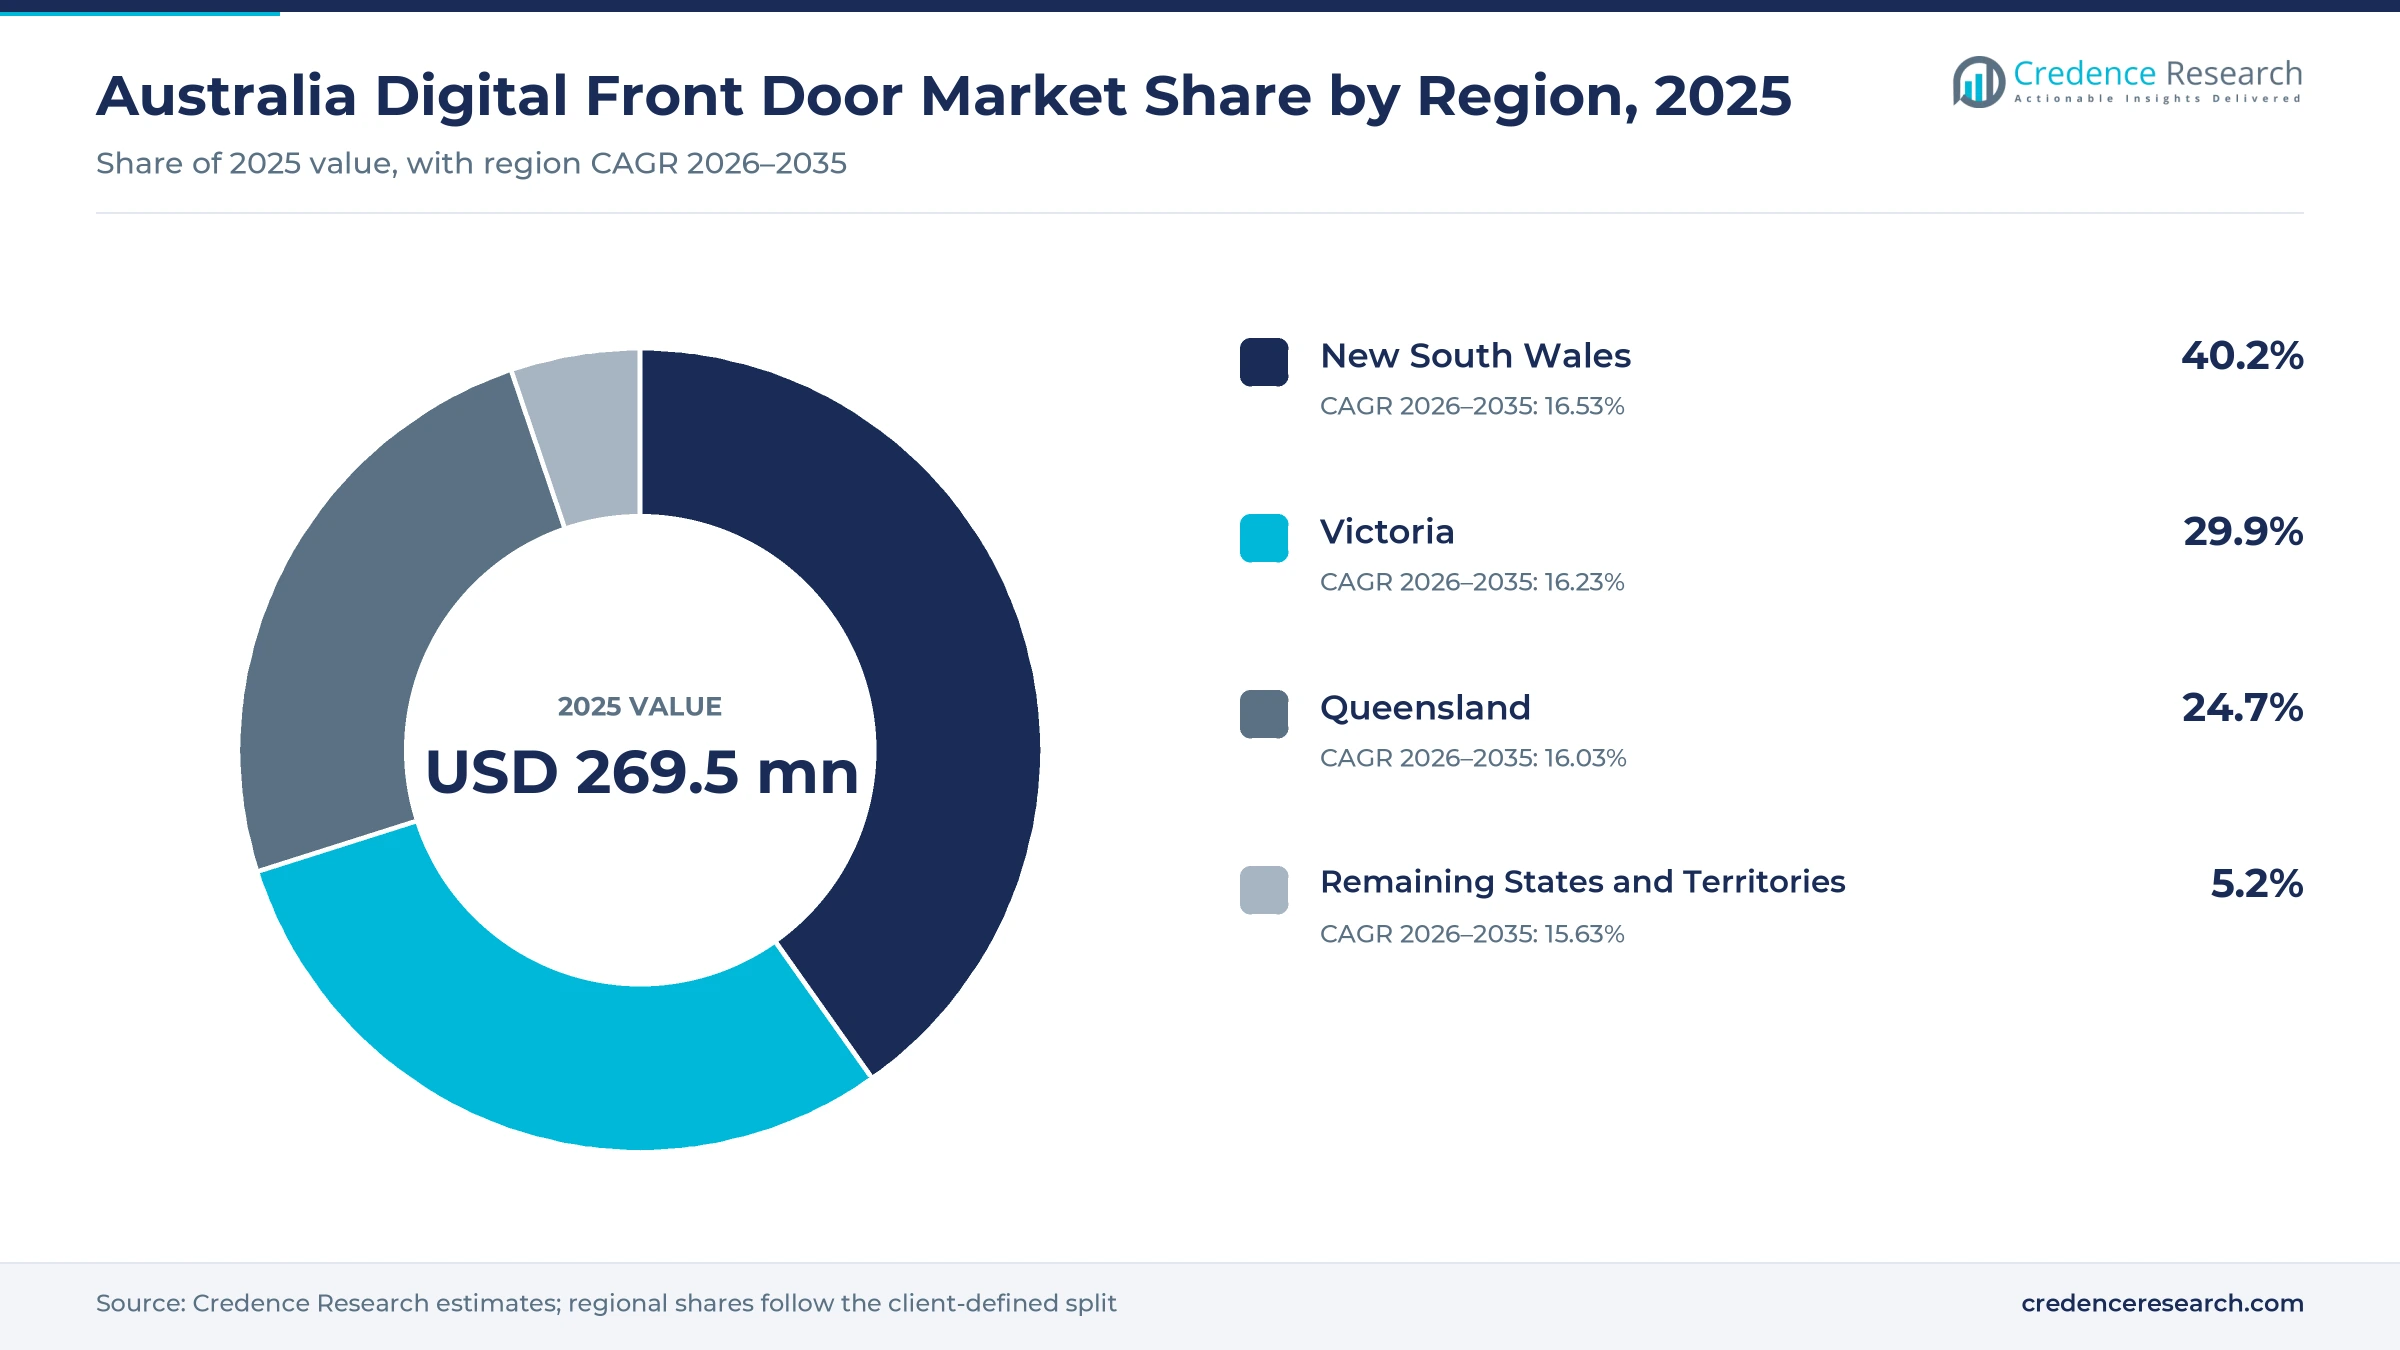
The Australia digital front door market was valued at USD 269.5 million in 2025 and is projected to increase from USD 320.0 million in 2026 to USD 1.24 billion by 2035, registering a CAGR of 16.27% during 2026–2035. Demand comes from general practices that fill appointments through booking apps, from consumer telehealth brands that sell prescriptions and chronic care online, and from state health services that want patients to check in, see results and reach virtual emergency care before they arrive at a hospital. New South Wales held the largest regional share, 40.2% in 2025, because it has the largest population and is moving every public hospital onto one statewide patient record. New South Wales is also the fastest-growing region at 16.53% a year as that record reaches more districts. In turn, public access is widening, because the national 1800MEDICARE line began on Jan. 1, 2026, and offers after-hours nurse triage and virtual GP care.
Which online access tools does the estimate cover?
The estimate measures what Australian hospitals, practices, care brands, governments and insurers spend on the tools patients use to find, book, start and follow up care online. It counts subscription, usage, service and implementation fees for hospital patient portals, virtual care platforms, appointment booking platforms and patient engagement platforms such as reminders, digital forms and check-in.
The estimate excludes Medicare benefits paid to clinicians for consultations, medicines sold through online pharmacies, and hospital record systems bought for clinical use. The value chain runs from software companies and telehealth operators through practice and hospital software integrators to the public health services, general practices, pharmacies and patients who use the tools every day.
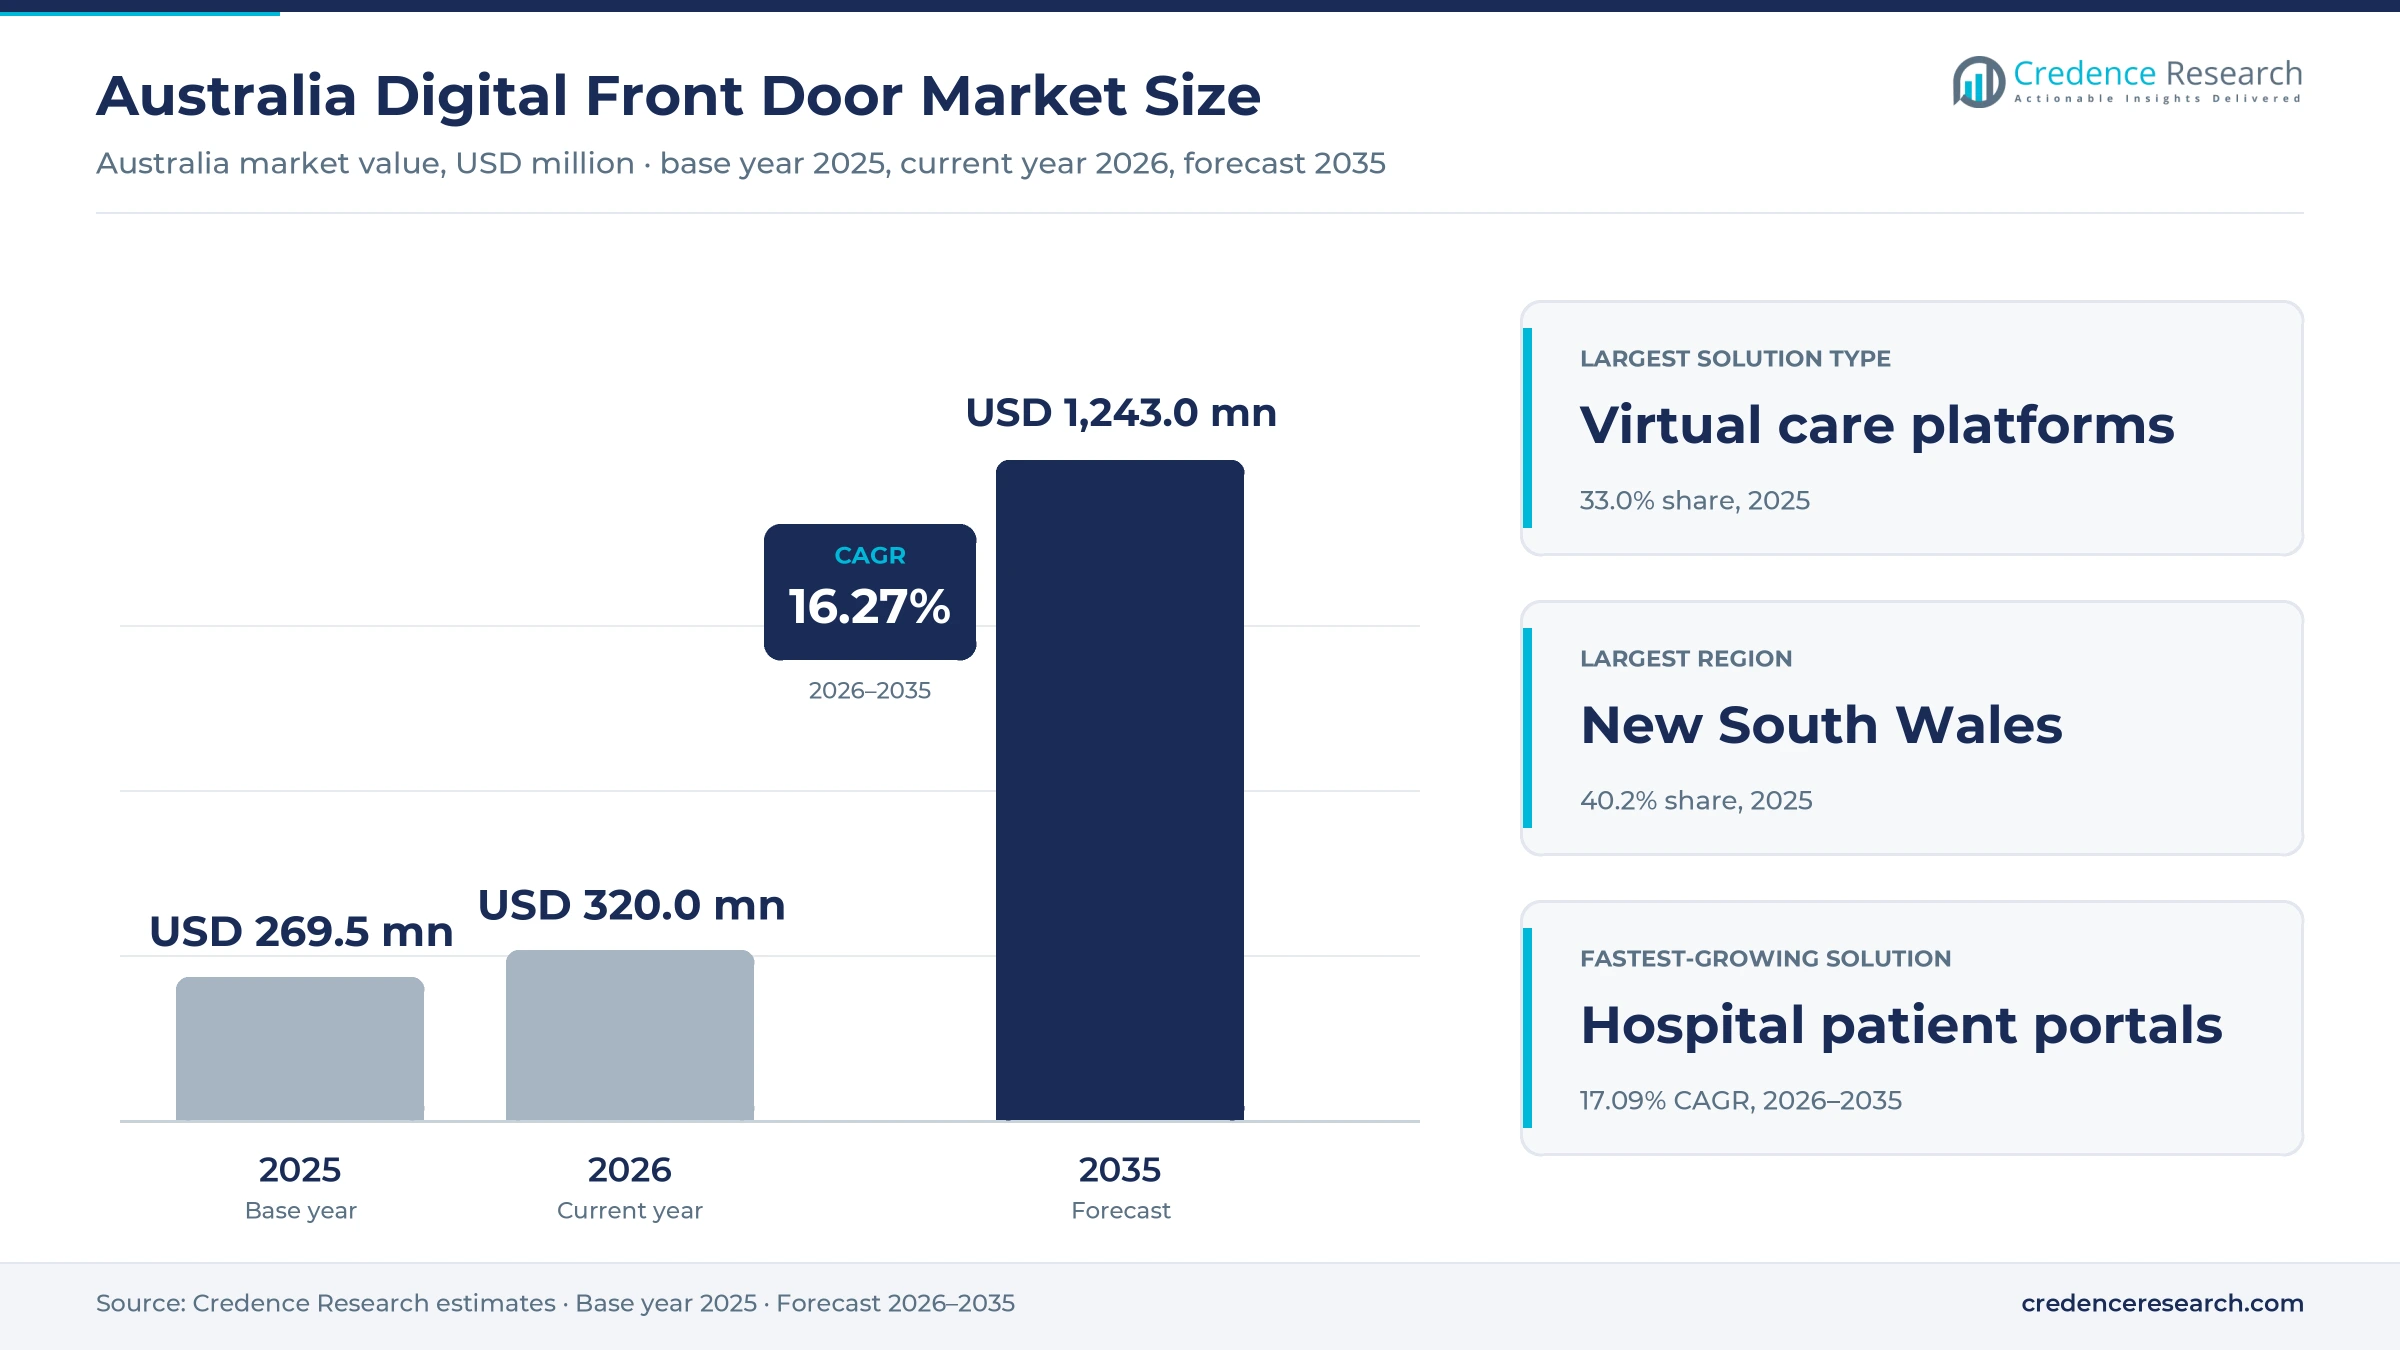
Australia Digital Front Door Market Insights
- The Australia digital front door market was valued at USD 269.5 million in 2025 and is projected to reach USD 1.24 billion by 2035, registering a CAGR of 16.27% during 2026–2035.
- New South Wales held a 40.2% share of 2025 value, because the state has the largest population and is rolling out a single statewide patient record.
- Virtual care platforms led with a 33.0% share of 2025 value, because Medicare telehealth items and state virtual emergency services rely on video and triage tools.
- The national 1800MEDICARE line began on Jan. 1, 2026, with after-hours nurse triage and virtual GP care run by Healthdirect Australia across the country.
- Hims & Hers Health agreed in February 2026 to buy Eucalyptus, the Sydney company behind the Pilot, Juniper and Kin online clinics.
Virtual care platforms lead as hospital portals grow fastest
Why do virtual care platforms hold the largest share?
Based on solution type, the market is categorized into Hospital Patient Portals, Virtual Care Platforms, Appointment Booking Platforms and Patient Engagement Platforms. Virtual Care Platforms led with a 33.0% share of 2025 value, because Medicare telehealth items and state virtual emergency services run on video, triage and messaging tools. Hospital Patient Portals grow fastest at 17.09% a year, as statewide hospital records let patients see appointments and results in one place.
How do cloud and on-premises models split spending?
Based on deployment model, the market is categorized into Multi-tenant Cloud, Dedicated Cloud and On-premises Deployment. Multi-tenant Cloud led with a 58.0% share of 2025 value, because booking apps and telehealth brands serve thousands of practices and patients from shared platforms. Multi-tenant Cloud grows fastest at 16.62% a year, as practices add AI receptionists and hospitals move portals off their own servers.
Which buyers pay for online patient access?
Based on customer type, the market is categorized into Hospital Networks, Ambulatory Care Providers, Consumer Care Operators and Government and Insurer Purchasers. Hospital Networks led with a 34.0% share of 2025 value, because public and private hospitals buy portals, check-in and outpatient reminder tools at scale. Government and Insurer Purchasers grow fastest at 17.01% a year, as public funds pay for after-hours virtual GP and virtual emergency care.
How do pre-care, care and post-care uses differ?
Based on application, the market is categorized into Pre-care Access, Care Delivery Access and Post-care Engagement. Pre-care Access led with a 44.0% share of 2025 value, because search, triage, booking and digital forms touch almost every visit. Post-care Engagement grows fastest at 17.26% a year, as clinics automate recalls, repeat scripts and follow-up messages, often through patient communication software.
| Segment Group | Leading Sub-segment | Share, 2025 | Fastest-growing Sub-segment | CAGR, 2026–2035 |
|---|---|---|---|---|
| By Solution Type | Virtual Care Platforms | 33.0% | Hospital Patient Portals | 17.09% |
| By Deployment Model | Multi-tenant Cloud | 58.0% | Multi-tenant Cloud | 16.62% |
| By Customer Type | Hospital Networks | 34.0% | Government and Insurer Purchasers | 17.01% |
| By Application | Pre-care Access | 44.0% | Post-care Engagement | 17.26% |
Request a Free Sample
Fill in your details and we'll send you a free sample report.
- Sample data tables & charts
- Research methodology
Medicare telehealth, hospital records and apps lift demand
How does permanent telehealth access widen online demand?
Australians have claimed video and phone consultations as standard Medicare items since Jan. 1, 2022, which turned online access from a pandemic measure into a routine way to reach a clinician. Telehealth made up 20% of GP services in 2022-23, according to a Department of Health review of the items. However, GPs ran less than 5% of those telehealth consultations by video, which leaves room for video tools to grow. A 2024 HotDoc patient survey found that one in four patients use online-only healthcare providers, according to the Royal Australian College of General Practitioners. Because practices, specialists and consumer brands all need a reliable way to see patients remotely, Virtual Care Platforms hold 33.0% of 2025 value.
Why do connected hospital records open patient portals?
Public hospitals can only offer a useful patient portal once appointments, results and letters sit in one record, and state programs are now building that base. NSW Health said on May 27, 2026, that its Single Digital Patient Record was live across Hunter New England, after more than 12 million patient records were transferred and more than 23,000 staff were trained across 26 hospitals. The system will replace nine electronic medical records and 10 patient administration systems, and it should reach every local health district by the end of 2028. Five Faces already runs outpatient reminder and check-in tools for Sydney Local Health District, Alfred Health and Peninsula Health, according to the Australian Health Journal. In turn, Hospital Patient Portals grow fastest at 17.09% a year.
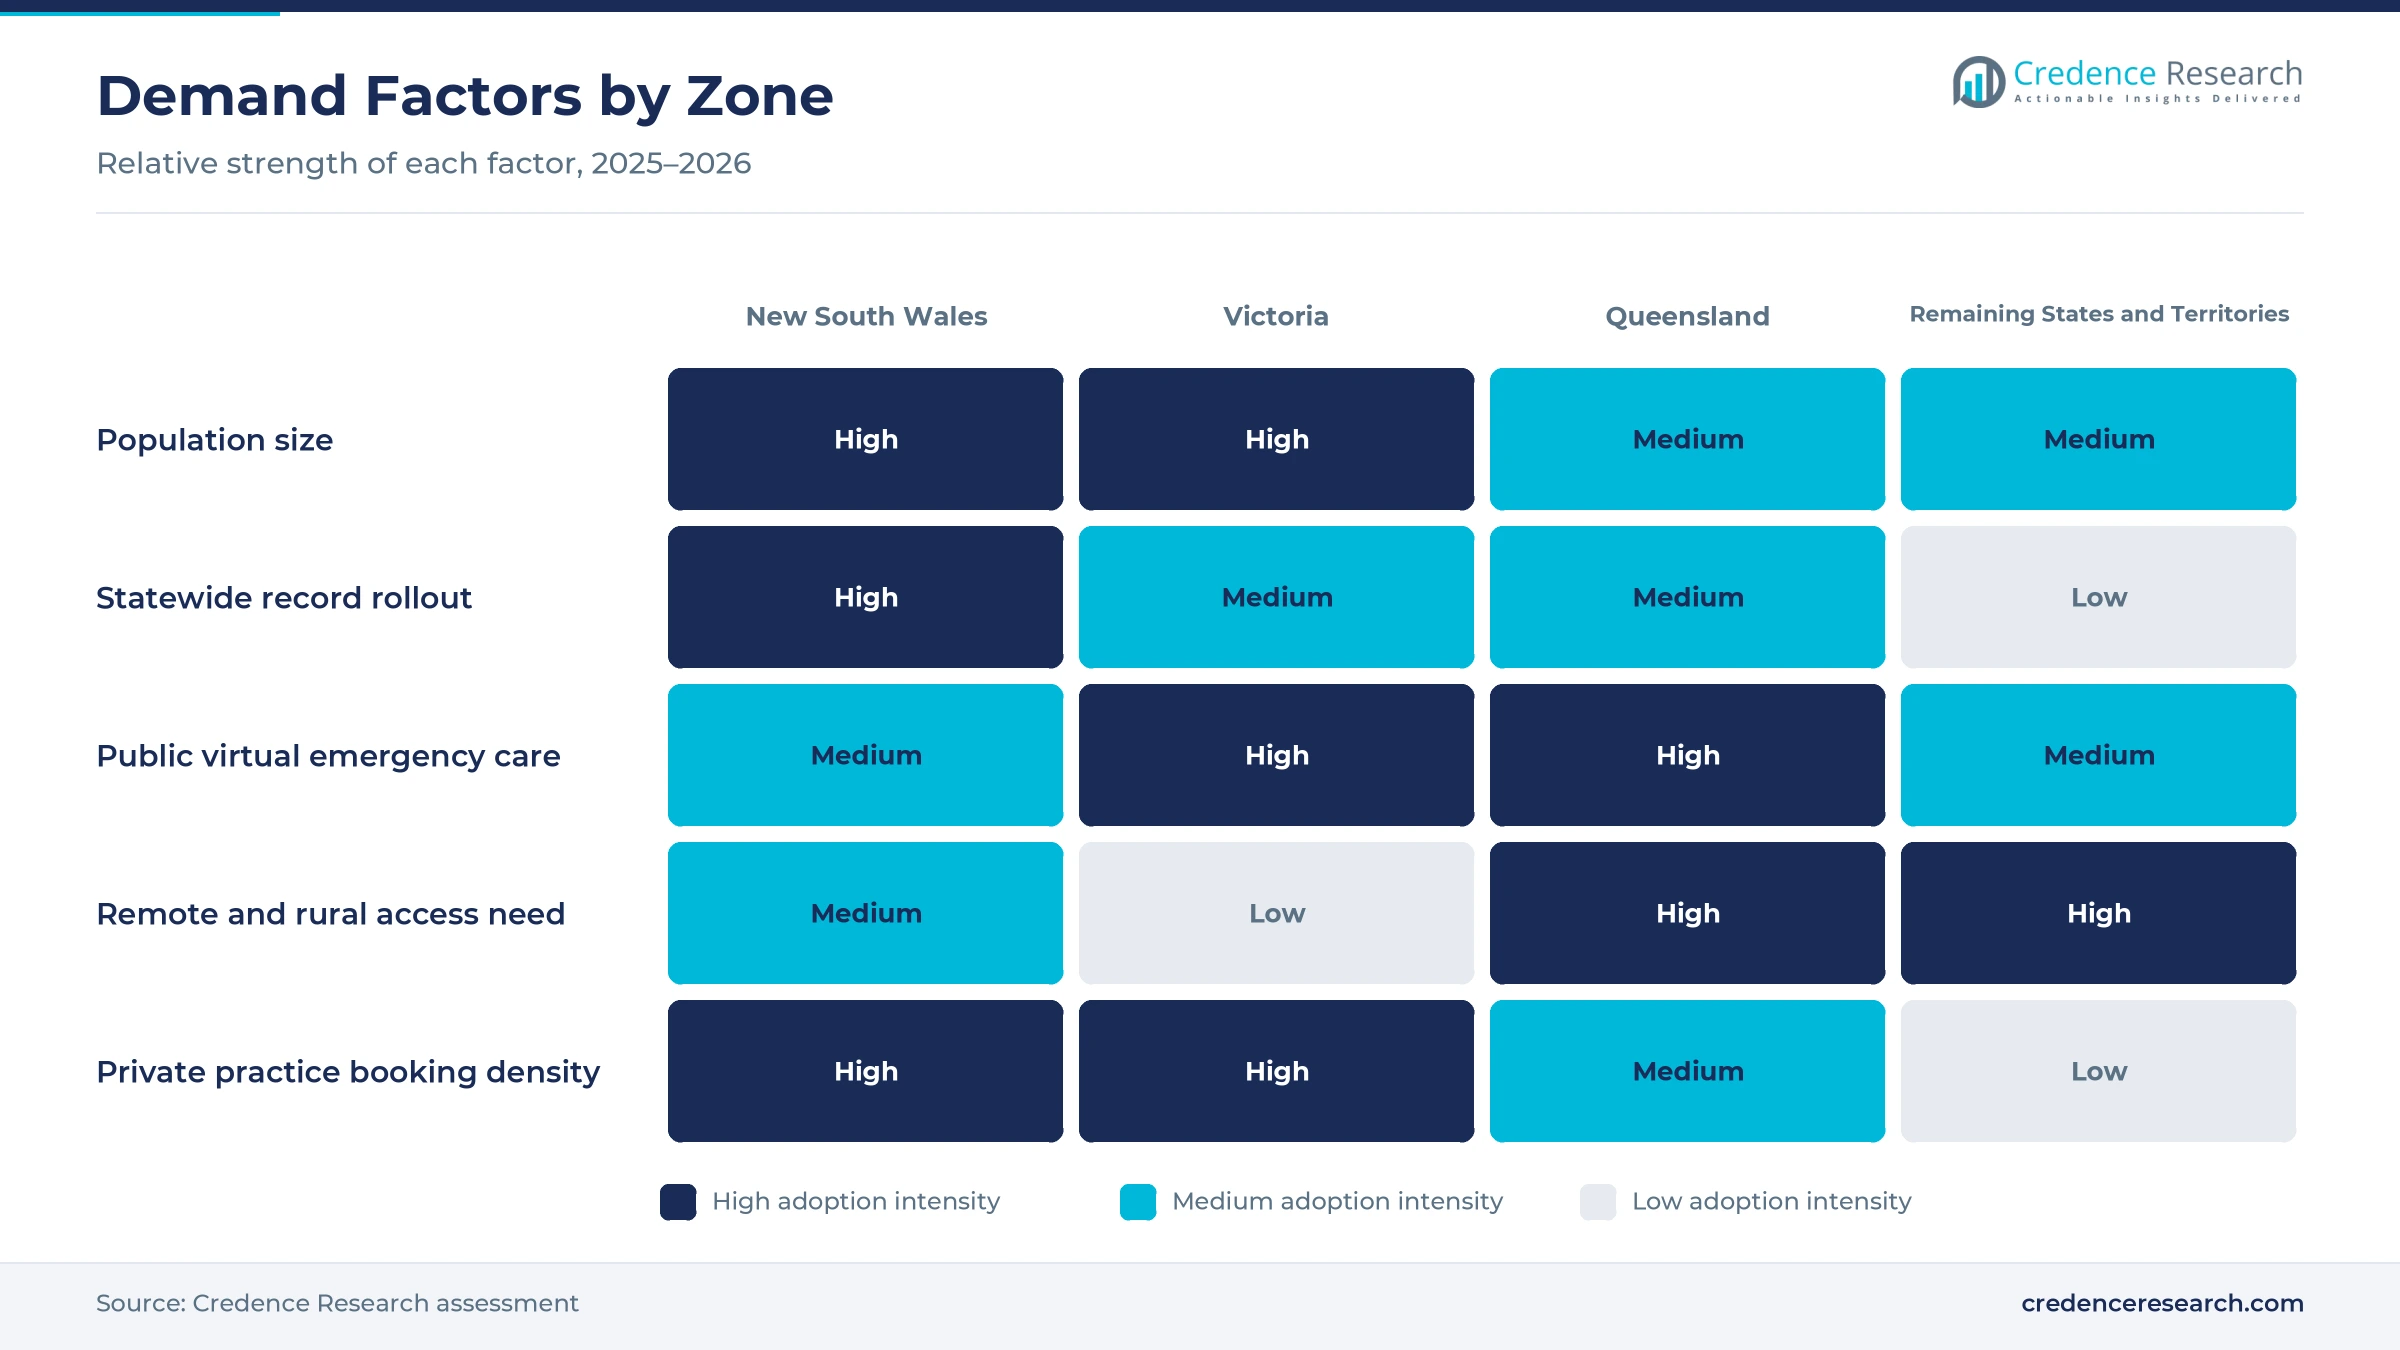
How does established consumer distribution reach patients?
Patients already reach care through a few large consumer channels, which lowers the cost for any clinic or brand that wants to fill appointments online. HotDoc serves about 4,500 GP practices, while Healthengine serves about 10,000 practices across general practice, dental, allied health and specialists, according to Medical Republic. InstantScripts had served 3 million individual patients and delivered 10 million health services by March 2026, according to Pharmacy Daily. Hims & Hers Health also agreed in February 2026 to buy Eucalyptus, the Sydney company behind the Pilot, Juniper and Kin online clinics, according to Startup Daily. Since these channels compete mainly on search, triage and booking, Pre-care Access leads with 44.0% of 2025 value.
Why do e-prescriptions tie online visits to pharmacies?
Every online consultation that ends in a prescription needs a link to a pharmacy, which turns script exchanges and pharmacy apps into part of the patient journey. Fred IT, owned by Telstra Health, runs the eRx Script Exchange and began charging 15 cents on each eligible private prescription from July 1, 2025, according to Medical Republic. The same publisher reported that private scripts grew about 60% in 18 months and counted more than 40 private telehealth platforms. MedAdvisor said in January 2025 that its pharmacy software was used by more than 95% of Australian pharmacies and had connected nearly 4 million patients. In turn, Post-care Engagement grows fastest at 17.26% a year as repeat scripts move into online pharmacy orders.
Virtual emergency care and AI receptionists reshape access
Why are state services moving urgent care onto video?
Public health services now send many urgent but non-life-threatening cases to a video clinician first, which needs triage and booking tools that link patients to emergency departments. The Victorian government committed AUD 437 million in May 2025 to make its virtual emergency department permanent, after more than half a million consultations and with plans to serve more than 1,750 people a day by 2028-29. Healthdirect Australia reported 230,387 virtual emergency consultations in Victoria, South Australia and Western Australia between April 2023 and March 2024. In Queensland, about 73% of Symptom Checker users told to go to an emergency department are now offered the Virtual Emergency Care Service instead. As a result, Victoria, which holds 29.9% of 2025 value, leads demand for virtual triage and video tools.
Why is AI rising at the practice front desk?
General practices are shifting routine phone work to AI agents, because staff spend much of the day answering booking calls. Healthengine launched Helen, an AI receptionist that books, moves and cancels appointments 24 hours a day, nationally in August 2025, according to IT Brief Australia. Its own research found that at least half of incoming calls at most practices relate to bookings, and the company later said its AI voice tool deflects about 50% of incoming calls. Best Practice, which holds about 80% of GP practice software, works with the AI scribe company Lyrebird, according to Medical Republic. Because these agents are sold as shared cloud services, Multi-tenant Cloud already holds 58.0% of 2025 value.
Can national record data power richer patient portals?
A growing pool of national health data gives portal and app vendors a clear opening to show patients results and documents without waiting for a letter. My Health Record held 25.16 million records in July 2026, with about 2.4 billion documents uploaded, according to the Australian Digital Health Agency. Pathology uploads reached 874 million that month, up 35% over the year, while diagnostic imaging uploads rose 39% to 80 million. This national build-out sits within a wider push, as the World Health Assembly extended the global digital health strategy to 2027 in May 2025, a decision taken by member states including Australia. Hospitals that link electronic health records to portals can show results faster.
Is there an opening in after-hours and urgent care?
Many patients look for care when practices are closed, which creates an opening for services that triage, book and treat online at night and on weekends. Healthdirect Australia took more than 1.4 million calls in 2024-25, and almost two-thirds came after hours, according to the Royal Australian College of General Practitioners. The same report showed urgent care clinic referrals rising to 112,671 from 1,771 in 2022-23, while 1800MEDICARE received AUD 219.8 million over four years from 2025-26. Medmate also moved its telehealth service to 24-hour coverage in August 2025, according to Pulse+IT. With public money now paying for after-hours triage and virtual GP care, Government and Insurer Purchasers grow fastest at 17.01% a year.
Privacy rulings, platform fees and prescribing limits bite
How do privacy rulings limit online patient marketing?
Online access brands depend on digital advertising to reach patients, yet health data collected on a website counts as sensitive information under Australian privacy law. The Privacy Commissioner found in June 2026 that Medmate and Monash IVF interfered with privacy through third-party tracking pixels, and separately inspected 50 health provider websites. As a result, telehealth brands must review tracking tools and seek consent, which raises marketing costs. Vendors respond by moving analytics into consent-based tools that keep health data away from social media platforms.
Why do platform fees strain practice relationships?
Practices rely on booking platforms to fill their books, but new fees and features can turn partners into competitors in the eyes of GPs. HotDoc paused its Telehealth on Demand pilot from July 11, 2025, after criticism from GPs and the college that represents them, according to newsGP. The company later announced a fee of AUD 2.45 for its payments product from Oct. 1, 2026. In turn, some practices weigh rival apps, and vendors respond with tools that keep bookings inside the practice.
Why do medicine restrictions expose online clinics?
Consumer telehealth brands often build programs around one medicine, which leaves them exposed when regulators restrict supply or prescribing. The federal government banned pharmacists from compounding GLP-1 receptor agonists from Oct. 1, 2024, after about 20,000 patients were using off-label compounded semaglutide, according to AusDoc. As a result, online weight loss clinics such as Juniper moved patients to approved brand medicines. Operators respond by adding clinical oversight and widening programs beyond a single treatment.
Why do cyber breaches raise the cost of connected access?
Each new link between patients, practices and pharmacies creates another path that attackers can use to reach health data. The 2024 MediSecure hack affected data for about 13 million patients, according to Medical Republic. As a result, buyers add security reviews, testing and monitoring to every contract, which slows go-lives and lifts costs. Health services respond by funding cyber defense for hospital networks alongside new patient tools.
New South Wales leads as its statewide record goes live
| Region | Value, 2025 (USD million) | Share, 2025 | CAGR, 2026–2035 |
|---|---|---|---|
| New South Wales | 108.3 | 40.2% | 16.53% |
| Victoria | 80.6 | 29.9% | 16.23% |
| Queensland | 66.6 | 24.7% | 16.03% |
| Remaining States and Territories | 14.0 | 5.2% | 15.63% |
How does one statewide record shape access in NSW?
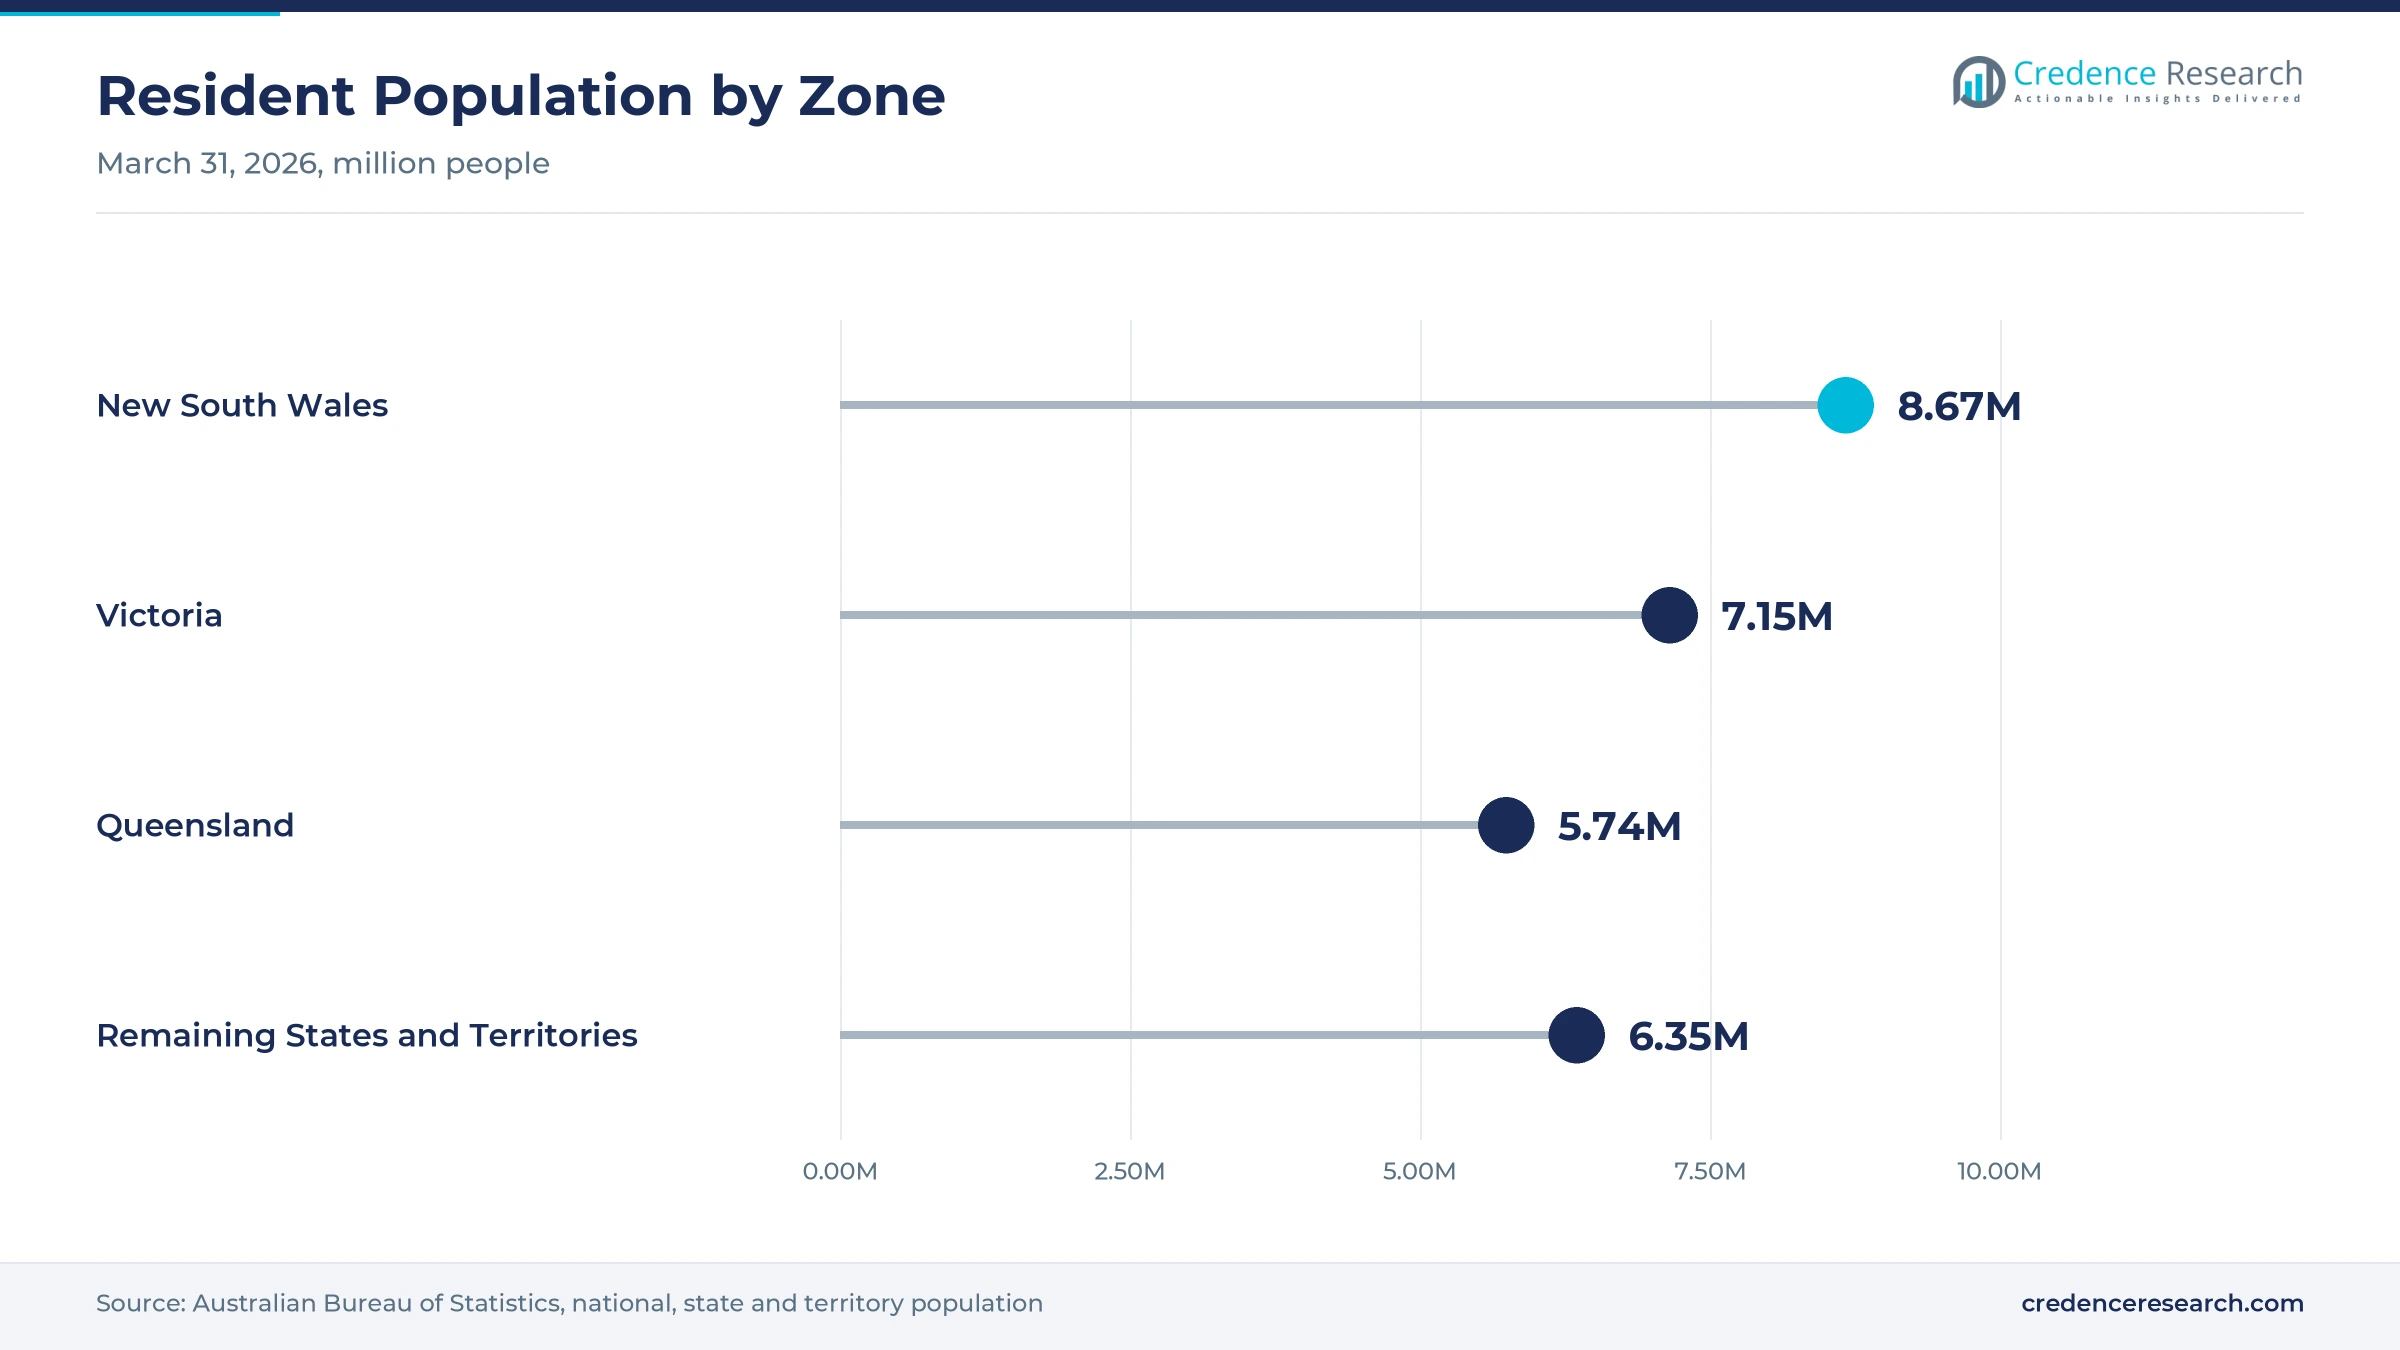
New South Wales held a 40.2% share of 2025 value and grows fastest at 16.53% a year, because the state is moving every public hospital onto one patient record. Hunter New England, which serves nearly 1 million people, became the first district to go live in May 2026, and the rest should follow by the end of 2028. The state also had 8.67 million residents on March 31, 2026, the largest population nationally. As a result, portal and outpatient reminder spending stays high through the forecast.
How does Victoria build on virtual emergency care?
Victoria held a 29.9% share of 2025 value and grows at 16.23% a year, because the state funds a permanent virtual emergency department that patients reach by video. The service began its statewide rollout in April 2022 and had served more than 600 callers a day before the 2025-26 budget expansion. Victoria had 7.15 million residents on March 31, 2026, after growth of 1.6% over the year. In turn, Victoria remains the second-largest zone for online patient access spending.
What shapes online access demand in Queensland?
Queensland held a 24.7% share of 2025 value and grows at 16.03% a year, because its patients are spread across many regional towns that depend on remote triage. About 25,000 Queensland residents use the healthdirect Symptom Checker each month, and more than 7,000 have been offered the Virtual Emergency Care Service. Queensland had 5.74 million residents on March 31, 2026, according to the ABS. As a result, demand centers on triage, video care and booking tools that link remote patients to hospital services.
Why do public programs lead in the smaller states?
Remaining States and Territories held a 5.2% share of 2025 value and grow at 15.63% a year, because Western Australia, South Australia, Tasmania and the two territories hold a smaller share of private practice and consumer telehealth demand. NT, SA and WA Health all help fund healthdirect Video Call, while SA and WA run virtual emergency services. In turn, public video programs rather than private booking apps drive most new demand across this zone.
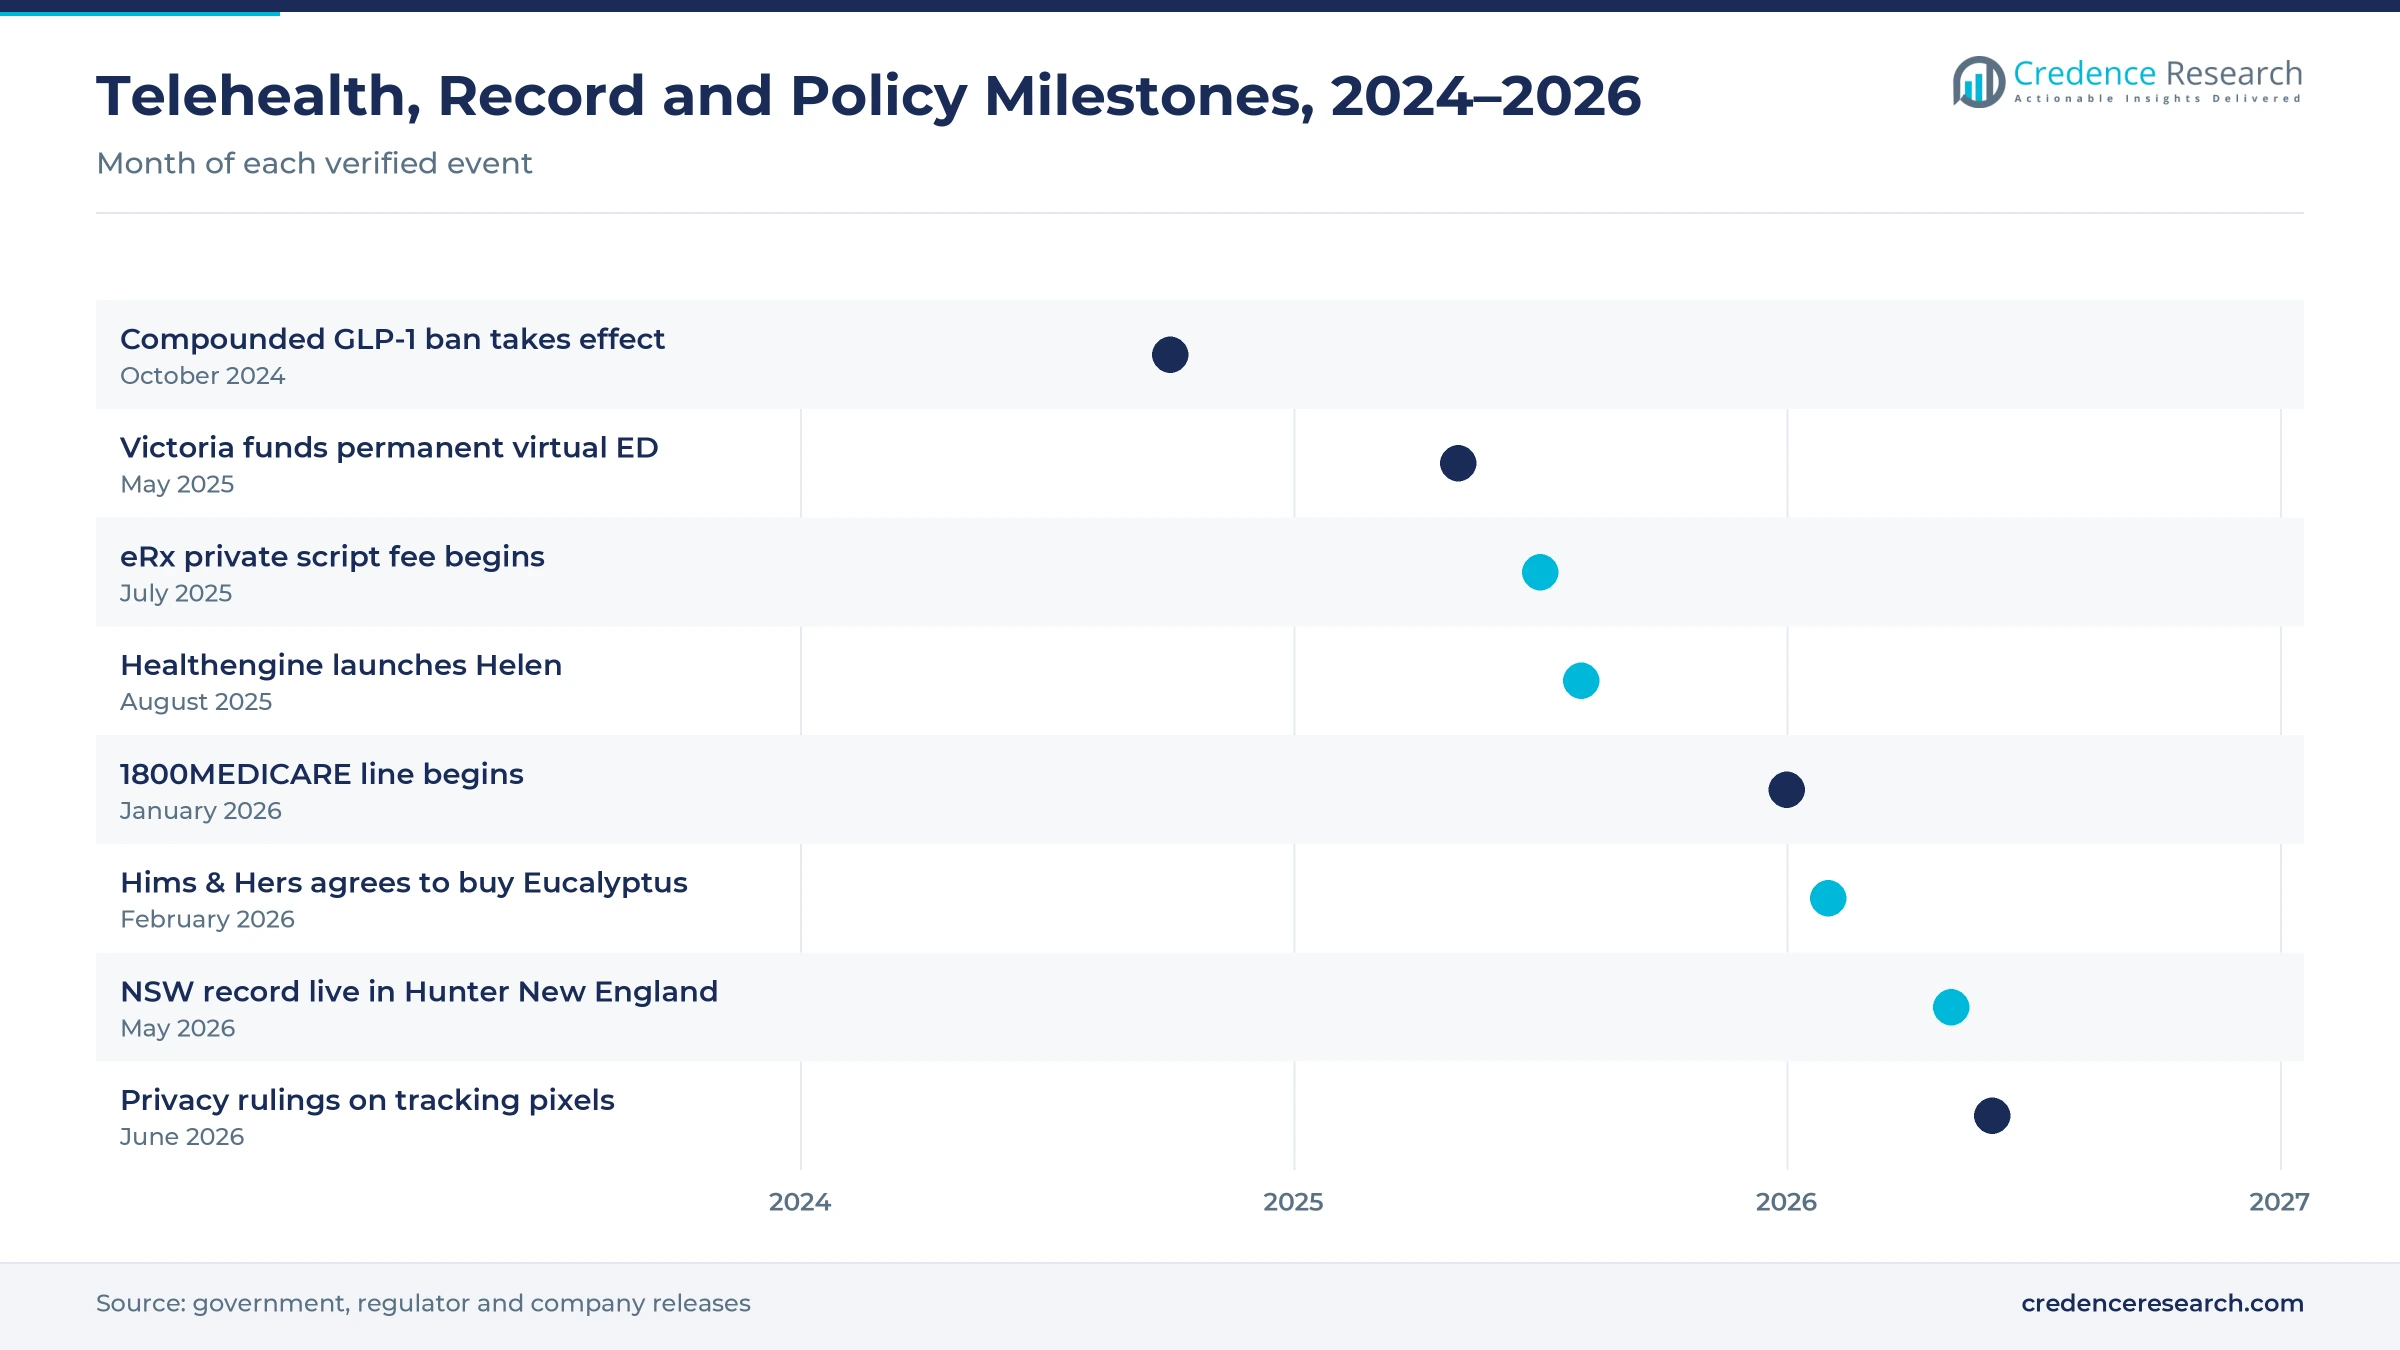
Telehealth policy, record go-lives and deals, 2024–2026
| Development | Status and market relevance |
|---|---|
| In October 2024, a federal ban on pharmacists compounding GLP-1 receptor agonists took effect. | Pushed online weight loss clinics toward approved brand medicines |
| In May 2025, Victoria committed AUD 437 million to make its virtual emergency department permanent. | Lifts planned capacity to more than 1,750 people a day by 2028-29 |
| In August 2025, Healthengine launched Helen, an AI receptionist for general practice clinics. | Handles bookings, changes and cancellations 24 hours a day |
| In January 2026, Healthdirect Australia began running the 1800MEDICARE after-hours virtual GP line. | Funded with AUD 219.8 million over four years |
| In May 2026, NSW Health took its Single Digital Patient Record live across Hunter New England. | First district on a record that reaches every district by 2028 |
Portals, triage tools and AI agents change first contact
- Hospital patient portals show appointments, preparation steps and messages from one record, which lets outpatient services cut missed visits and lets patients check in from a phone instead of a queue.
- Symptom checkers and triage tools steer patients to the right level of care, which lets public services send people with urgent but minor problems to virtual emergency care instead of a hospital.
- AI receptionists and recall agents answer booking calls and send follow-up prompts around the clock, which frees practice staff but requires careful identity checks and privacy controls.
Need a Custom Version of This Report?
Tailor the scope, geography, or segments to your exact requirements.
- Custom geography or segment scope
- Direct access to our analyst team
Booking apps, telehealth brands and a navigator compete
Competition is split between consumer booking apps, telehealth brands that sell care directly, a public navigator and software companies that serve hospitals and pharmacies. HotDoc and Healthengine compete for GP practices, with Healthengine adding an AI receptionist in 2025. Eucalyptus and InstantScripts sell online consultations and prescriptions directly to patients, while Medmate runs a round-the-clock telehealth service. Healthdirect Australia runs the public helpline, the Symptom Checker, healthdirect Video Call and 1800MEDICARE. Telstra Health, through Fred IT, operates the eRx Script Exchange that links online prescriptions to pharmacies, and MedAdvisor supplies pharmacy reminder software. Five Faces sells outpatient check-in and patient journey tools to public hospitals, while Coviu supplied the video software behind healthdirect Video Call from 2019. Rivals compete on practice reach, links to practice and hospital software, privacy controls and fees.
Which companies run online patient access in Australia?
| Company | Type | Role in the market |
|---|---|---|
| Healthdirect Australia | Public navigator | Runs the helpline, Symptom Checker, Video Call and 1800MEDICARE |
| HotDoc | Booking platform | Booking app serving about 4,500 GP practices |
| Healthengine | Booking platform | Practice booking and the Helen AI receptionist |
| InstantScripts | Consumer telehealth operator | Online consultations, scripts and pharmacy health hubs |
| Eucalyptus | Consumer telehealth operator | Pilot, Juniper and Kin clinics; sale to Hims & Hers agreed |
| Medmate | Consumer telehealth operator | Telehealth service with 24-hour coverage since 2025 |
| Telstra Health | Health software group | Owns Fred IT, operator of the eRx Script Exchange |
| MedAdvisor | Pharmacy engagement software | Pharmacy app; Australian business sold to Jonas Software in 2025 |
| Five Faces | Hospital patient platform | Outpatient check-in and journey tools for public hospitals |
| Coviu | Video platform | Supplied the software behind healthdirect Video Call from 2019 |
Credence Research view on online patient access
Credence Research's view is that the Australian digital front door will grow strongly because public money now funds virtual GP and virtual emergency care, while state hospital records finally give portals the data they need. Virtual care platforms remain the largest value pool, while hospital patient portals add the fastest growth. Vendors that integrate cleanly with practice software and state records should gain share, while privacy rulings, platform fee disputes and prescribing limits will slow some consumer brands.
How the national online patient access estimate was built
The report uses 2025 as the base year on a calendar basis, and market values come from the Credence Research model. That model combines Medicare telehealth reviews, state budget papers and program releases, Healthdirect Australia service data, My Health Record statistics, population data, regulator decisions and company releases on launches and deals. Segment splits and zone growth rates are Credence Research estimates, while zone shares follow the client-defined split. Sources used are official statistics, government releases, regulator decisions, trade press and company releases, and no interviews or surveys were used.
Public virtual care and hospital portals carry growth
Value across the Australian digital front door is expected to reach USD 1.24 billion by 2035, a 16.27% CAGR during 2026–2035, as public virtual care becomes a normal first stop and hospitals open portals on new statewide records. Growth should be strongest through 2030 while New South Wales completes its record rollout and Victoria lifts virtual emergency capacity. After that, AI receptionists, recall tools and follow-up messaging will carry more of the value. Stricter privacy rules would raise costs, while wider use of national record data would lift demand for portals.
Frequently Asked Questions
How big is the Australia digital front door market?
Which solution type leads the Australian market?
Which region leads the Australian market?
How common is telehealth in Australian general practice?
What is 1800MEDICARE?
Which customer type is growing fastest?
Who are the leading companies in the Australian market?
What are the main challenges for online access providers?
Table of Content
Chapter 1 Market Segmentation
- 1.1 Segmentation Framework
- 1.1.1 Product and Service Classification
- 1.1.2 Application and End-Use Classification
- 1.1.3 Technology and Solution Classification
- 1.1.4 Customer and Distribution Channel Classification
- 1.1.5 Geographic Segmentation
- 1.1.6 Market Segment Definitions and Boundaries
- 1.2 By Solution Type
- 1.2.1 Hospital Patient Portals
- 1.2.2 Virtual Care Platforms
- 1.2.3 Appointment Booking Platforms
- 1.2.4 Patient Engagement Platforms
- 1.3 By Deployment Model
- 1.3.1 Multi-tenant Cloud
- 1.3.2 Dedicated Cloud
- 1.3.3 On-premises Deployment
- 1.4 By Customer Type
- 1.4.1 Hospital Networks
- 1.4.2 Ambulatory Care Providers
- 1.4.3 Consumer Care Operators
- 1.4.4 Government and Insurer Purchasers
- 1.5 By Application
- 1.5.1 Pre-care Access
- 1.5.2 Care Delivery Access
- 1.5.3 Post-care Engagement
Chapter 2 Introduction
- 2.1 Report Objectives and Scope
- 2.2 Product Definition and Industry Terminology
- 2.3 Market Inclusions and Exclusions
- 2.4 Research Process
- 2.4.1 Primary Research and Expert Interviews
- 2.4.2 Secondary Research and Source Review
- 2.4.3 Top-Down and Bottom-Up Estimation
- 2.4.4 Data Triangulation and Verification
- 2.5 Market Size Measurement Basis
- 2.5.1 2025: USD 269.5 million → 2035: USD 1.24 billion
- 2.6 Historical and Forecast Reference Periods
- 2.6.1 Historical Period: 2018-2025
- 2.6.2 Base Year: 2025
- 2.6.3 Forecast Period: 2025-2035
- 2.7 Research Assumptions and Limitations
Chapter 3 Executive Summary
- 3.1 Market Snapshot and Key Findings
- 3.2 Base-Year Market Size, 2025
- 3.3 Forecast Market Size, 2035
- 3.4 Revenue and Volume Growth Outlook
- 3.5 Key Demand and Supply Indicators
- 3.6 Leading Market Segments
- 3.7 Fastest-Growing Market Opportunities
- 3.8 Regional Performance Highlights
- 3.9 Technology and Industry Transformation
- 3.10 Competitive Landscape Summary
- 3.11 Analyst View and Strategic Implications
Chapter 4 Australia Digital Front Door Market Trends and Developments
- 4.1 Historical Industry Development, 2018-2025
- 4.2 Recent Market Trends and Developments
- 4.3 Demand and Customer Behavior Trends
- 4.4 Technology and Product Innovation
- 4.5 Artificial Intelligence, Automation and Digitalization
- 4.6 Local Manufacturing and Supply Chain Realignment
- 4.7 Industry Partnerships, Mergers and Acquisitions
- 4.8 Sustainability and Circular Economy Developments
- 4.9 Government and Private Sector Investment Trends
- 4.10 Emerging Business Models and Commercialization
- 4.11 Industry Developments and Announcements
Chapter 5 Australia Digital Front Door Market Production, Supply and Demand Analysis
- 5.1 Demand Trend and Consumption Analysis, 2018-2025
- 5.2 Demand Forecast, 2025-2035
- 5.3 Production and Output Trend, 2018-2025
- 5.4 Production and Output Forecast, 2025-2035
- 5.5 Installed Capacity and Capacity Utilization
- 5.6 Company-Wise Production Plants and Statistics
- 5.6.1 Installed Production Capacity
- 5.6.2 Actual Production
- 5.6.3 Planned Capacity and Expansion Targets
- 5.7 Supply Chain Structure and Procurement Trends
- 5.8 Supply-Demand Gap and Bottlenecks
- 5.9 Import Dependence and Sourcing Structure
- 5.10 Contract Manufacturing and Outsourcing
- 5.11 Regional Supply and Demand Concentration
Chapter 6 Australia Digital Front Door Market Pricing Analysis
- 6.1 Pricing Structure and Measurement
- 6.2 Historical Pricing Trends, 2018-2025
- 6.3 Pricing Outlook, 2025-2035
- 6.4 Average Selling Price and Unit Economics
- 6.5 Pricing by Product and Market Segment
- 6.6 Geographic Pricing Differences
- 6.7 Key Input, Energy, Labor and Logistics Costs
- 6.8 Contract Pricing and Purchasing Models
- 6.9 Pricing Sensitivity and Competitive Positioning
- 6.10 Price, Margin and Profitability Implications
Chapter 7 Australia Digital Front Door Market Dynamics
- 7.1 Market Growth Drivers
- 7.1.1 Demand-Side Drivers
- 7.1.2 Technology and Innovation Drivers
- 7.1.3 Infrastructure and Investment Drivers
- 7.1.4 Regulatory and Policy Drivers
- 7.2 Market Restraints
- 7.2.1 Cost and Affordability Constraints
- 7.2.2 Technology and Adoption Barriers
- 7.2.3 Supply Chain and Operational Constraints
- 7.3 Market Challenges
- 7.3.1 Competitive Pressure and Margin Erosion
- 7.3.2 Skills, Infrastructure and Implementation Gaps
- 7.4 Emerging Market Opportunities
- 7.5 Market Dynamics Impact and Time-Horizon Assessment
Chapter 8 Australia Digital Front Door Value Chain Analysis
- 8.1 Industry Value Chain Overview
- 8.2 Upstream Suppliers and Critical Inputs
- 8.3 Technology and Component Providers
- 8.4 Manufacturing or Service Delivery
- 8.5 Distribution, Channel Partners and Integrators
- 8.6 Downstream Applications and End Users
- 8.7 Value Addition and Profit Pools
- 8.8 Vertical Integration and Outsourcing
- 8.9 Supplier Concentration and Risk
- 8.10 Supply Chain Localization and Resilience
Chapter 9 Australia Digital Front Door Market Regulations and Policies
- 9.1 Relevant Laws, Standards and Compliance Frameworks
- 9.2 Product, Service, Safety and Quality Requirements
- 9.3 Government Policies, Incentives and Subsidies
- 9.4 Imports, Exports and Trade Barriers
- 9.5 Public Procurement and Local Content Requirements
- 9.6 Environmental and Sustainability Compliance
- 9.7 Upcoming Policy Changes and Market Implications
Chapter 10 Australia Digital Front Door Market Hotspots and Opportunities
- 10.1 Market Opportunity Mapping and Growth Hotspots
- 10.2 High-Growth Applications and Customer Groups
- 10.3 Underserved Markets and White-Space Opportunities
- 10.4 Emerging Technology and Product Opportunities
- 10.5 New Capacity and Investment Hotspots
- 10.6 Market Entry and Expansion Opportunities
- 10.7 Distribution and Partnership Opportunities
- 10.8 Near-Term and Long-Term Commercial Potential
- 10.9 Opportunity Attractiveness and Execution Risks
Chapter 11 Australia Digital Front Door Market Outlook, 2025-2035
- 11.1 Market Size and Analysis
- 11.1.1 Revenue (Market Measurement: 2025: USD 269.5 million → 2035: USD 1.24 billion)
- 11.1.2 Market Volume and Quantity Sold
- 11.1.3 Historical Market Size, 2018-2025
- 11.1.4 Base-Year Market Size, 2025
- 11.2 Market Forecast, 2025-2035
- 11.2.1 Revenue Forecast to 2035
- 11.2.2 Volume Forecast to 2035
- 11.2.3 CAGR and Year-on-Year Growth
- 11.2.4 Incremental Revenue Opportunity
- 11.3 Forecast Assumptions and Scenario Analysis
- 11.3.1 Base-Case Forecast
- 11.3.2 Optimistic and Conservative Scenarios
- 11.3.3 Technology, Pricing and Policy Sensitivities
- 11.4 Market Attractiveness and Growth Outlook
Chapter 12 Australia Digital Front Door Market Segmentation and Outlook
- 12.1 Segmentation Summary and Market Shares, 2025
- 12.2 Largest and Fastest-Growing Segments
- 12.3 By Solution Type - Market Size and Forecast, 2025-2035
- 12.3.1 Segment Definition and Scope
- 12.3.2 Historical Market Size, 2018-2025
- 12.3.3 Revenue Forecast, 2025-2035
- 12.3.4 Volume Forecast, 2025-2035
- 12.3.5 Base-Year Market Share, 2025
- 12.3.6 Segment CAGR and Growth Drivers
- 12.3.7 Subsegment Market Size and Forecast
- 12.3.7.1 Hospital Patient Portals
- 12.3.7.2 Virtual Care Platforms
- 12.3.7.3 Appointment Booking Platforms
- 12.3.7.4 Patient Engagement Platforms
- 12.3.8 Subsegment Pricing and Adoption Trends
- 12.3.9 Leading Suppliers and Competition
- 12.3.10 Regional Demand and Opportunities
- 12.4 By Deployment Model - Market Size and Forecast, 2025-2035
- 12.4.1 Segment Definition and Scope
- 12.4.2 Historical Market Size, 2018-2025
- 12.4.3 Revenue Forecast, 2025-2035
- 12.4.4 Volume Forecast, 2025-2035
- 12.4.5 Base-Year Market Share, 2025
- 12.4.6 Segment CAGR and Growth Drivers
- 12.4.7 Subsegment Market Size and Forecast
- 12.4.7.1 Multi-tenant Cloud
- 12.4.7.2 Dedicated Cloud
- 12.4.7.3 On-premises Deployment
- 12.4.8 Subsegment Pricing and Adoption Trends
- 12.4.9 Leading Suppliers and Competition
- 12.4.10 Regional Demand and Opportunities
- 12.5 By Customer Type - Market Size and Forecast, 2025-2035
- 12.5.1 Segment Definition and Scope
- 12.5.2 Historical Market Size, 2018-2025
- 12.5.3 Revenue Forecast, 2025-2035
- 12.5.4 Volume Forecast, 2025-2035
- 12.5.5 Base-Year Market Share, 2025
- 12.5.6 Segment CAGR and Growth Drivers
- 12.5.7 Subsegment Market Size and Forecast
- 12.5.7.1 Hospital Networks
- 12.5.7.2 Ambulatory Care Providers
- 12.5.7.3 Consumer Care Operators
- 12.5.7.4 Government and Insurer Purchasers
- 12.5.8 Subsegment Pricing and Adoption Trends
- 12.5.9 Leading Suppliers and Competition
- 12.5.10 Regional Demand and Opportunities
- 12.6 By Application - Market Size and Forecast, 2025-2035
- 12.6.1 Segment Definition and Scope
- 12.6.2 Historical Market Size, 2018-2025
- 12.6.3 Revenue Forecast, 2025-2035
- 12.6.4 Volume Forecast, 2025-2035
- 12.6.5 Base-Year Market Share, 2025
- 12.6.6 Segment CAGR and Growth Drivers
- 12.6.7 Subsegment Market Size and Forecast
- 12.6.7.1 Pre-care Access
- 12.6.7.2 Care Delivery Access
- 12.6.7.3 Post-care Engagement
- 12.6.8 Subsegment Pricing and Adoption Trends
- 12.6.9 Leading Suppliers and Competition
- 12.6.10 Regional Demand and Opportunities
- 12.7 Segment Growth Comparison
- 12.8 Segment Attractiveness and Priority Matrix
Chapter 13 Australia Digital Front Door End-Use and Application Market Outlook
- 13.1 End-Use Industry and Customer Demand Structure
- 13.2 Leading Applications and Customer Groups
- 13.3 End-Use Market Size, Share and Forecast
- 13.4 Major End-Use Industry Deep Dives
- 13.4.1 Customer Requirements and Use Cases
- 13.4.2 Demand and Replacement Cycles
- 13.4.3 Technical and Regulatory Considerations
- 13.4.4 Purchasing and Procurement Models
- 13.4.5 Leading Vendors and Distribution Channels
- 13.4.6 Forecast and Commercial Opportunities
- 13.5 Emerging Applications and Cross-Segment Demand
- 13.6 End-Use Industry Investment Priorities
Chapter 14 Australia Digital Front Door Geographic Market Outlook, 2025-2035
- 14.1 Domestic Market Distribution and Demand Clusters
- 14.2 State- or Province-Wise Market Size and Forecast, 2025-2035
- 14.3 City and Metropolitan Market Outlook
- 14.4 Industrial, Manufacturing and Commercial Clusters
- 14.5 Geographic Concentration of Key End Users
- 14.6 Local Pricing and Purchasing Differences
- 14.7 Domestic Production Facilities and Capacity Map
- 14.8 Local Infrastructure and Project Pipeline
- 14.9 State-Level Policy and Incentive Differences
- 14.10 Subnational Investment Hotspots and Opportunities
- 14.11 Distribution and Logistics Networks
- 14.12 Domestic Competitive Footprint
Chapter 15 Australia Digital Front Door Technology, Innovation and Sustainability Outlook
- 15.1 Technology Landscape and Maturity
- 15.2 Product, Process and Service Innovation
- 15.3 AI, Automation and Digital Tools in the Industry
- 15.4 Technology Adoption and Performance Benchmarking
- 15.5 Innovation Pipeline and R&D Investment
- 15.6 Patent and Intellectual Property Trends
- 15.7 Energy Efficiency and Resource Management
- 15.8 Sustainability, Recycling and Circularity
- 15.9 Technology Roadmap, 2025-2035
- 15.10 Risks of Obsolescence and Technology Substitution
Chapter 16 Australia Digital Front Door Market Key Strategic Imperatives
- 16.1 Growth and Market Entry Priorities
- 16.2 High-Return Products and Segments
- 16.3 Pricing, Profitability and Cost Optimization
- 16.4 Technology Investment and Product Differentiation
- 16.5 Supply Chain Localization and Resilience
- 16.6 Distribution and Customer Acquisition
- 16.7 Partnership, Acquisition and Capacity Strategy
- 16.8 Regional Expansion Priorities
- 16.9 Short-, Medium- and Long-Term Actions
Chapter 17 Competition Outlook
- 17.1 Industry Competition Characteristics
- 17.2 Market Structure and Concentration
- 17.3 Market Share and Competitive Positioning, 2025
- 17.4 Company-Wise Revenue and Product Benchmarking
- 17.5 Production and Service Capacity Benchmarking
- 17.6 Technology, Pricing and Differentiation
- 17.7 Regional Footprint and Distribution Strength
- 17.8 Mergers, Acquisitions and Strategic Alliances
- 17.9 New Entrants and Competitive Threats
- 17.10 Porter's Five Forces and Industry Attractiveness
- 17.11 Competitive Outlook, 2025-2035
Chapter 18 Company Profiles
- 18.1 Company Coverage and Selection Criteria
- 18.2 Healthdirect Australia
- 18.2.1 Business Description
- 18.2.2 Company Ownership and Geographic Presence
- 18.2.3 Product and Service Portfolio
- 18.2.4 Manufacturing and Operating Footprint
- 18.2.5 Production Capacity and Expansion Plans
- 18.2.6 Financial Performance and Investment
- 18.2.7 Market Share and Competitive Position
- 18.2.8 Technology and Innovation Capabilities
- 18.2.9 Strategic Alliances or Partnerships
- 18.2.10 Recent Developments
- 18.2.11 Growth Strategy and Outlook
- 18.3 Eucalyptus
- 18.4 Telstra Health
- 18.5 InstantScripts
- 18.6 HotDoc
- 18.7 MedAdvisor
- 18.8 Healthengine
- 18.9 Coviu
- 18.10 Five Faces
- 18.11 Medmate
- 18.12 Other Relevant Market Participants
Note: Every listed company is profiled on the structure shown under the first company. The company list is preliminary and may change based on research findings, market developments, data availability and client requirements.
Chapter 19 Disclaimer
- 19.1 Research and Forecast Disclaimer
- 19.2 Data Source and Estimation Limitations
Note: The depth of individual sections depends on data availability for this market. Volume, capacity, trade and other unit-based metrics are included where applicable.

