
Animal data limits and sunscreen reviews reshape skin safety
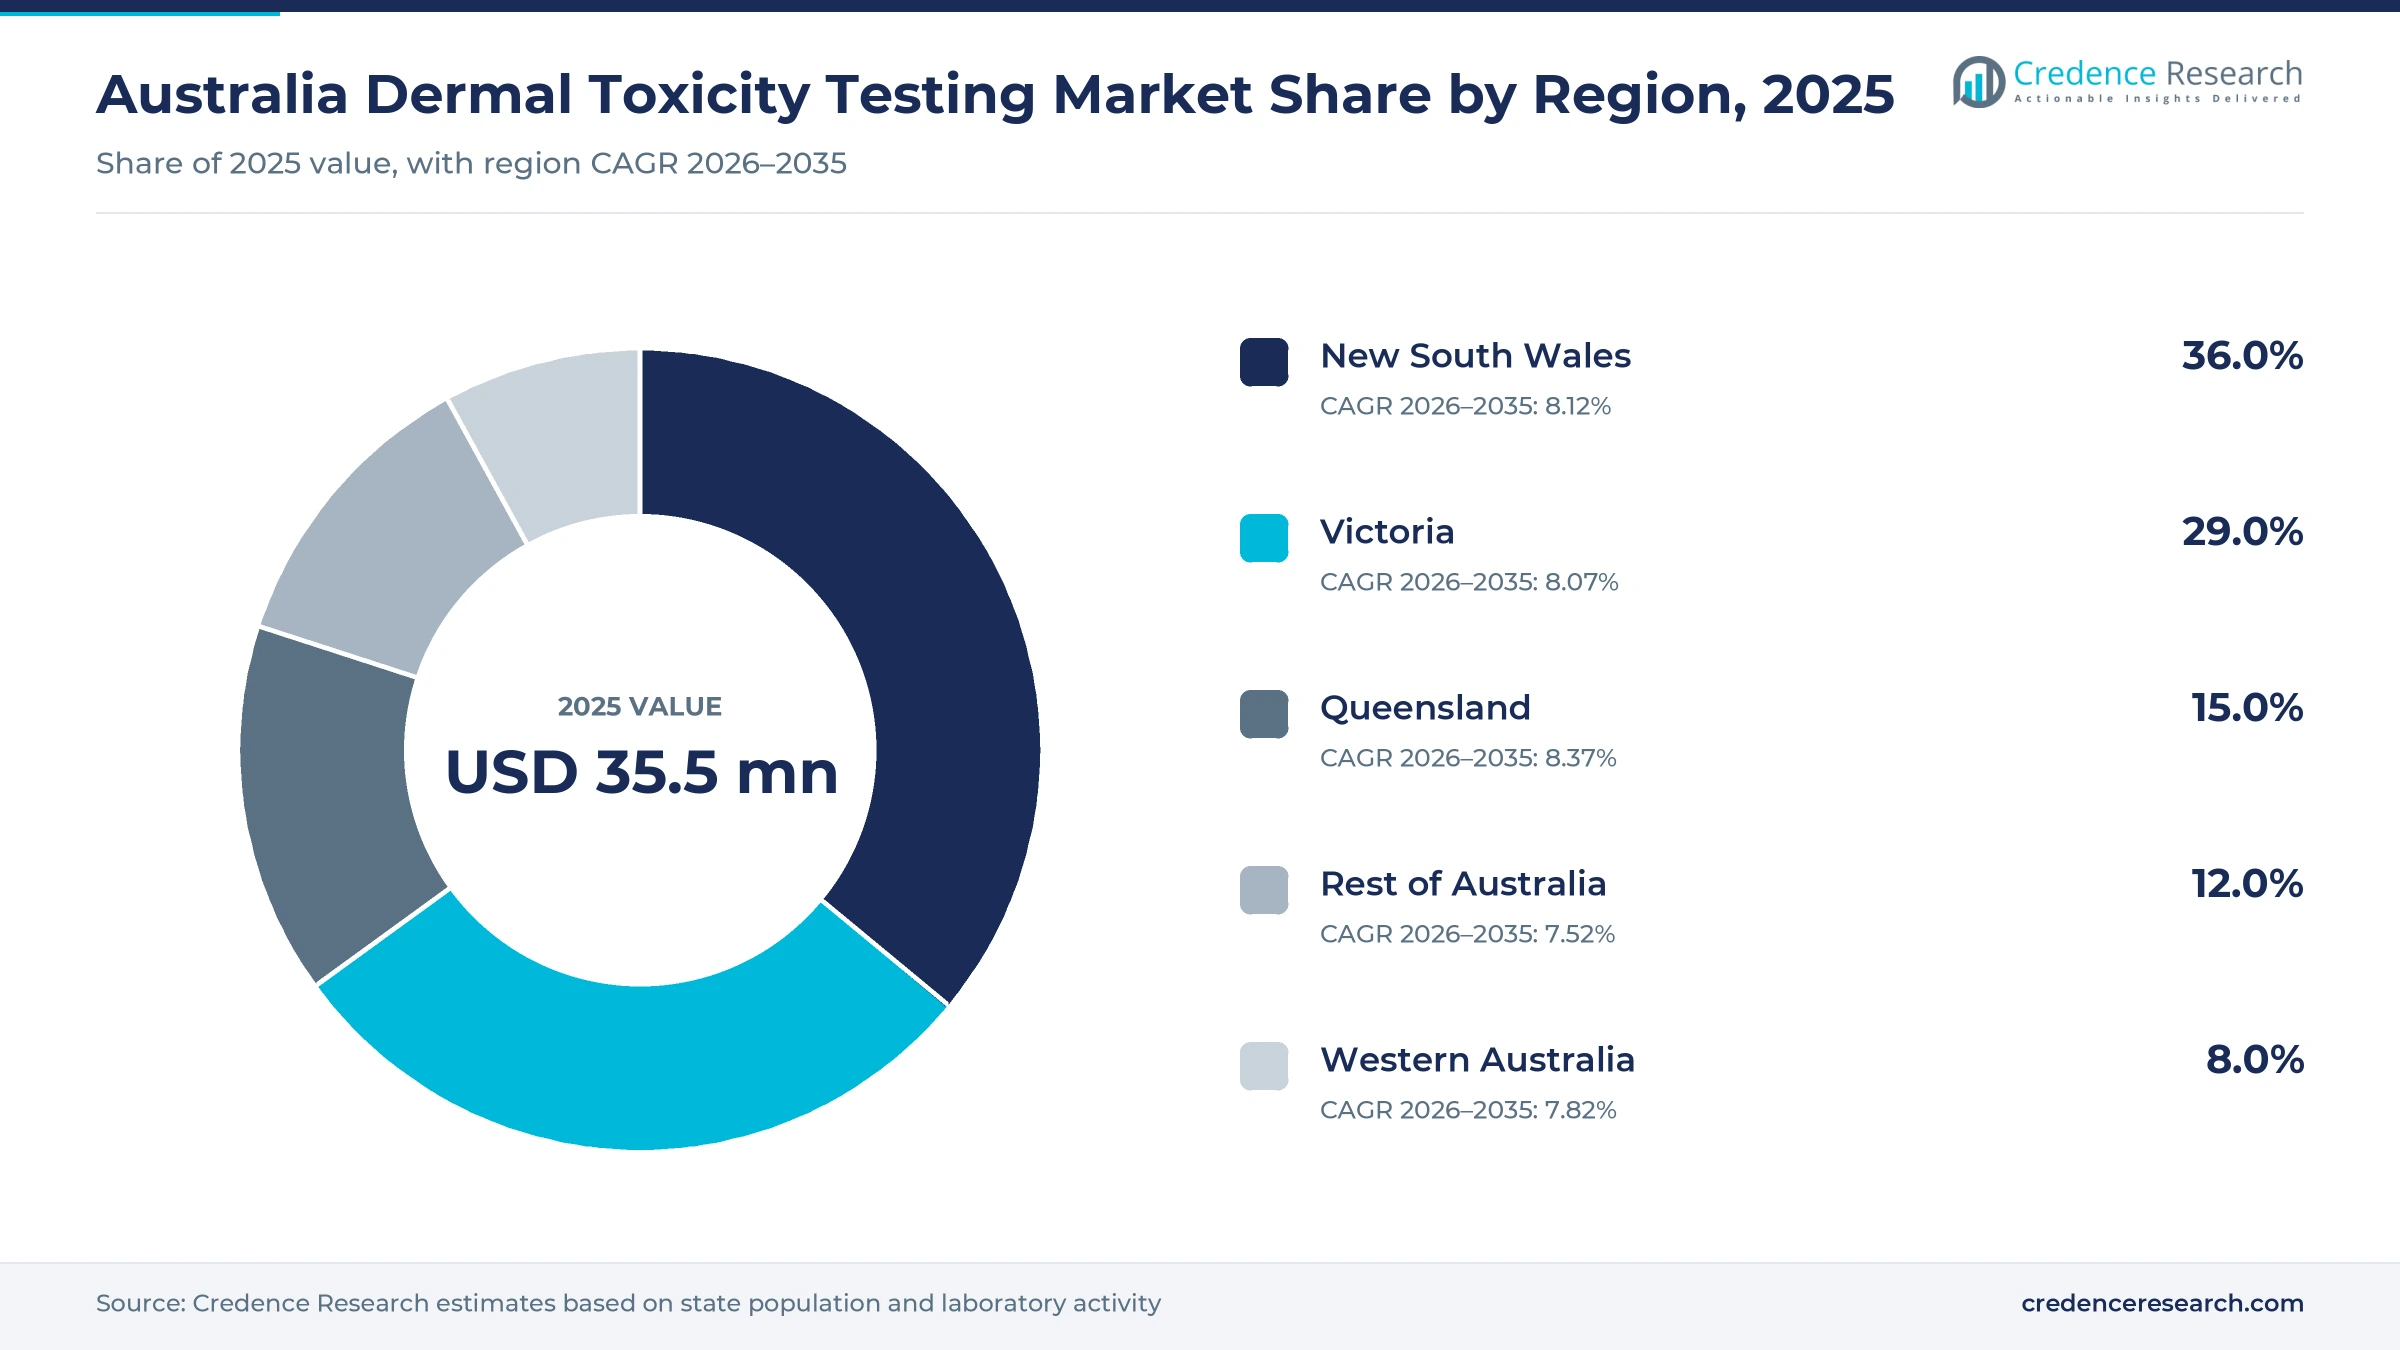
The Australia dermal toxicity testing market was valued at USD 35.5 million in 2025 and is projected to increase from USD 44.0 million in 2026 to USD 88.3 million by 2035, registering a CAGR of 8.05% during 2026–2035. Demand comes from cosmetic brands that must prove ingredient safety without new animal data, from pharmaceutical and medical device sponsors that need skin irritation and sensitization evidence, and from sunscreen sponsors facing closer scrutiny of their claims. New South Wales held the largest regional share, 36.0% in 2025, because it has the largest population and hosts a specialist sun care and skin study laboratory. Queensland is the fastest-growing region at 8.37% a year, as population growth and a Brisbane-based testing group widen local capacity. In turn, sunscreen regulation is changing, after the national therapeutic goods regulator released a consultation paper in March 2026 on laboratory oversight and in vitro sun protection testing.
Which skin safety studies does the estimate cover?
The estimate measures the value of studies that show whether a chemical, ingredient or finished product irritates, corrodes, sensitizes or passes through human skin, or reacts with light on the skin. It counts study fees paid to contract laboratories, the internal cost of captive laboratory work, sales of assay kits and skin models, and fees for software and expert interpretation of results.
The estimate excludes eye irritation, systemic toxicity, genetic toxicity and efficacy work such as sun protection factor measurement when no skin safety endpoint is involved. The value chain runs from skin model and assay suppliers through contract and in-house laboratories to the sponsors, ingredient introducers and research teams that file the results with national regulators.
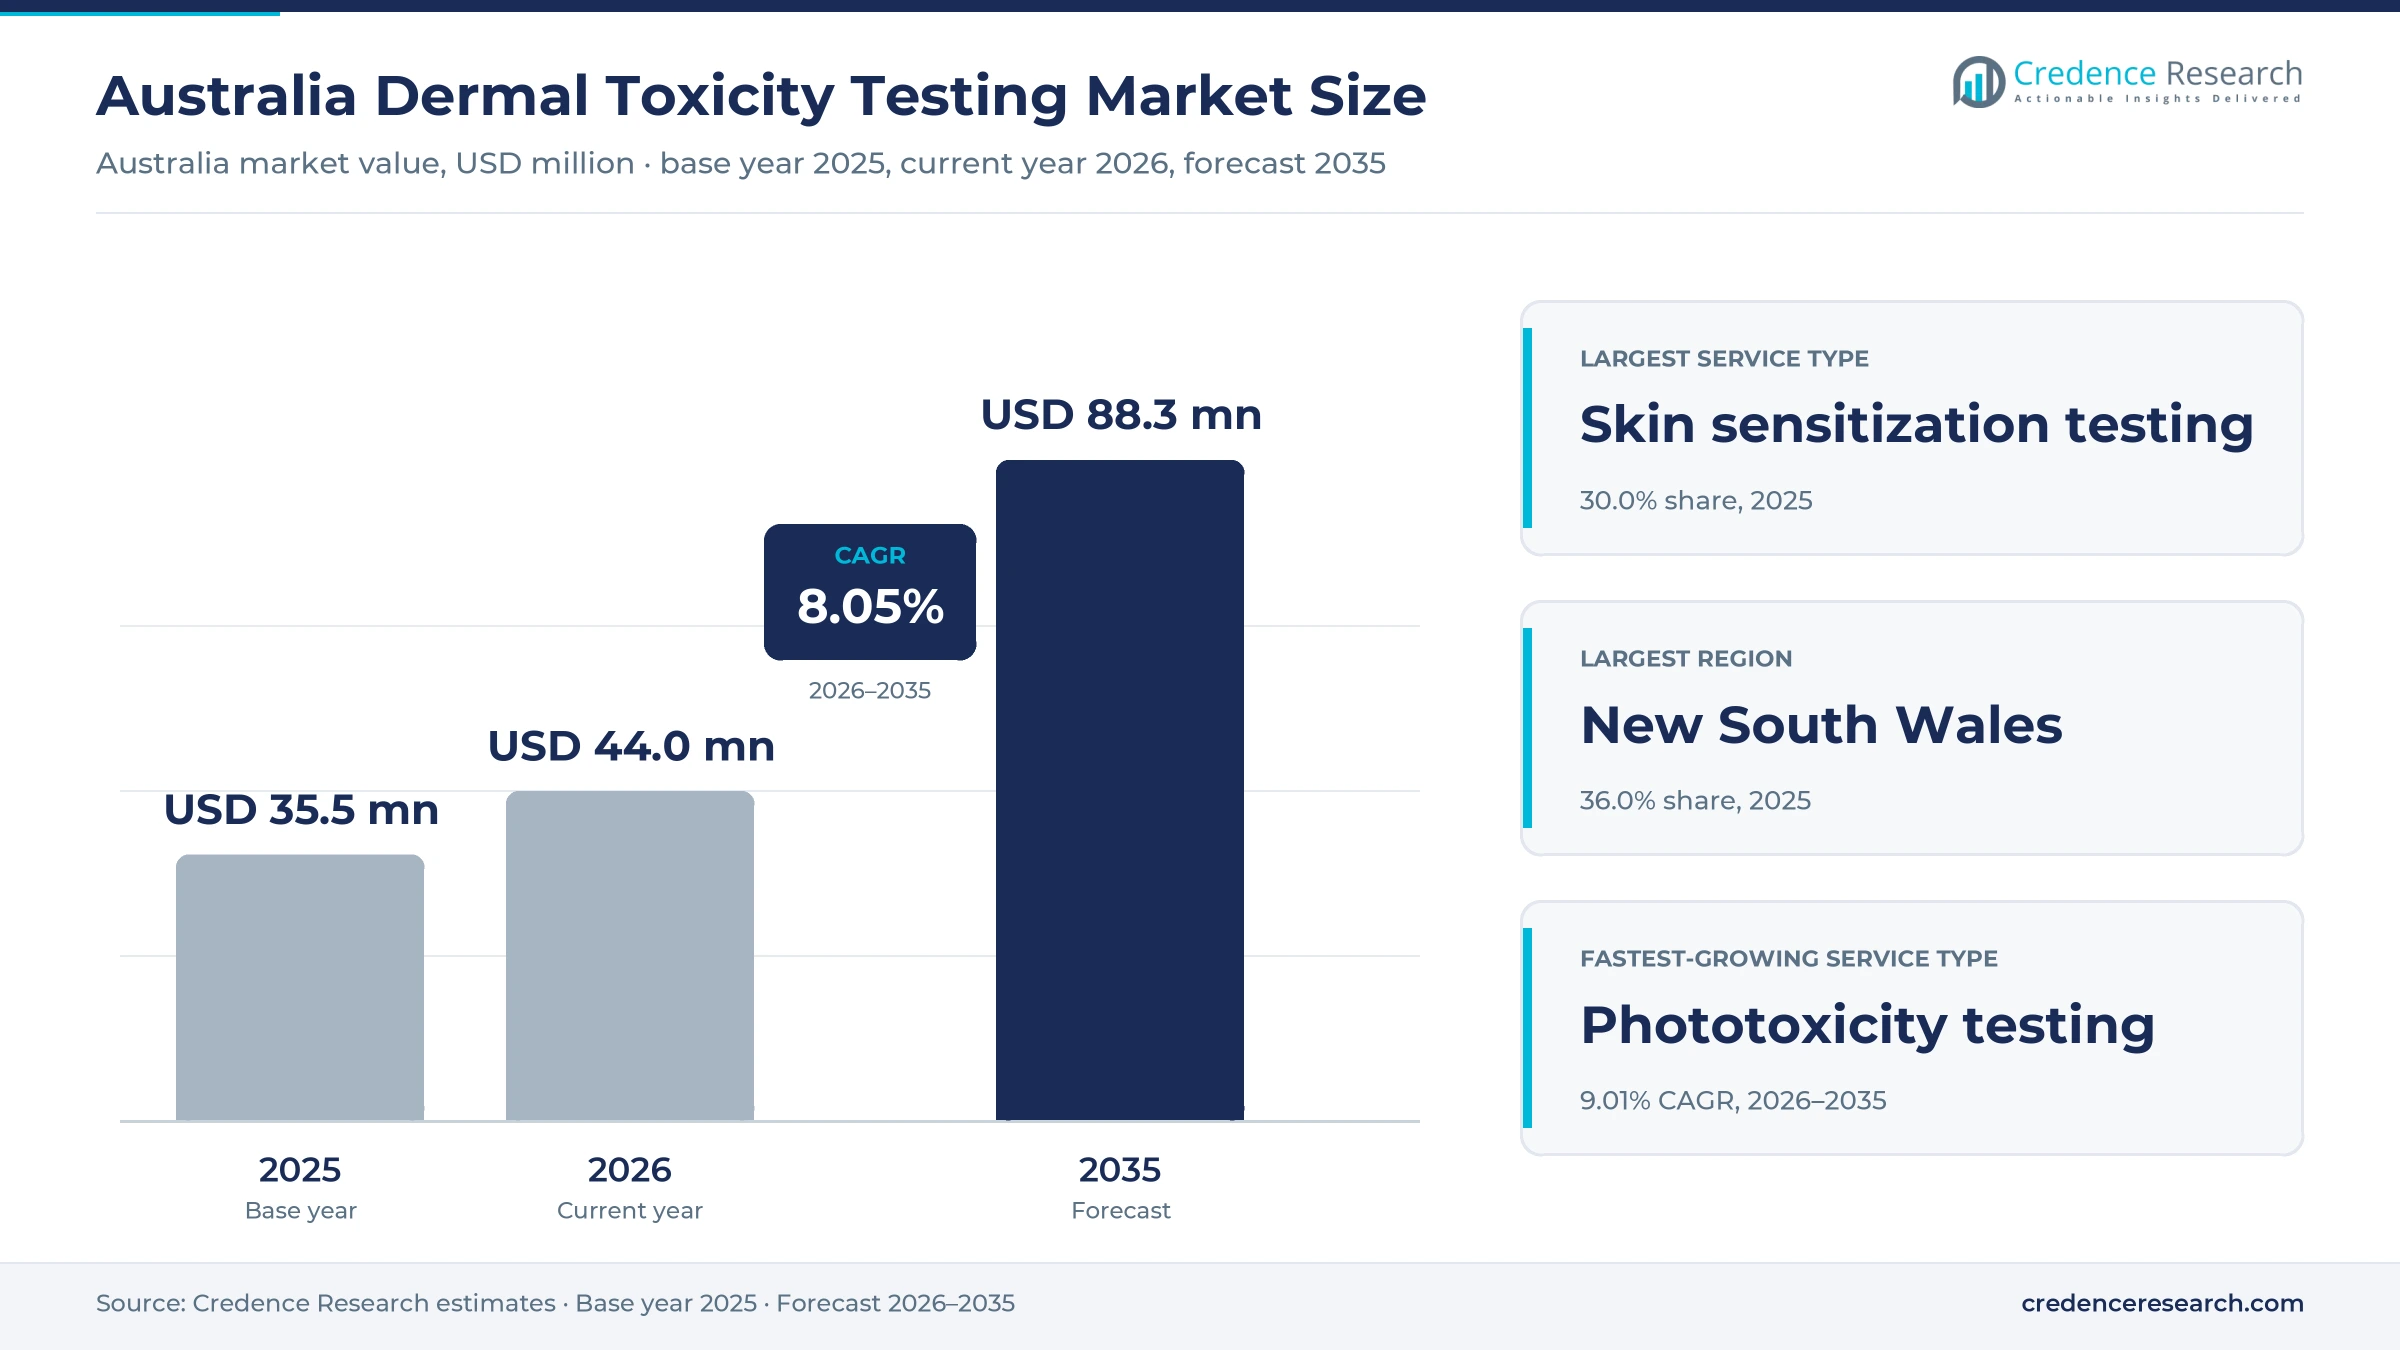
Australia Dermal Toxicity Testing Market Insights
- The Australia dermal toxicity testing market was valued at USD 35.5 million in 2025 and is projected to reach USD 88.3 million by 2035, registering a CAGR of 8.05% during 2026–2035.
- New South Wales held a 36.0% share of 2025 value, because the state has the largest population and a specialist skin study laboratory.
- Skin sensitization studies led with a 30.0% share of 2025 value, because sensitization is the endpoint most affected by limits on new animal data.
- The national regulator released a consultation paper on sunscreen regulation on March 26, 2026, with submissions closing on May 23, 2026.
- Phototoxicity testing grows fastest at 9.01% a year during 2026–2035, as sunscreen and active ingredient reviews raise demand for light-related skin evidence.
Sensitization work leads as phototoxicity grows fastest
Why do sensitization studies lead skin safety spending?
Based on service type, the market is categorized into Skin Sensitisation Testing, Skin Irritation Testing, Skin Corrosion Testing, Phototoxicity Testing and Dermal Toxicity and Absorption Studies. Skin Sensitisation Testing led with a 30.0% share of 2025 value, because sensitization needs several in chemico and in vitro assays to replace one animal study. Phototoxicity Testing grows fastest at 9.01% a year, as sunscreen and active ingredient reviews raise demand for light-related evidence.
Which industries buy the most skin safety studies?
Based on end-use industry, the market is categorized into Pharmaceuticals, Cosmetics and Personal Care, Industrial Chemicals, Academic and Contract Research, and Medical Devices. Cosmetics and Personal Care led with a 34.0% share of 2025 value, because cosmetic ingredients need non-animal evidence before introduction. Medical Devices grow fastest at 8.84% a year, as device makers adopt reconstructed epidermis methods for irritation evidence.
Who commissions skin safety studies in Australia?
Based on customer type, the market is categorized into Product Sponsors, Ingredient Introducers, Testing Organisations and Research Commissioners. Product Sponsors led with a 44.0% share of 2025 value, because sponsors of medicines, devices and sunscreens carry the legal duty to hold safety evidence. Ingredient Introducers grow fastest at 8.59% a year, as chemical importers need alternative data for cosmetic uses.
How do contract and in-house laboratories split the work?
Based on operating model, the market is categorized into Independent Contract Testing, Captive Laboratory Testing and Academic Contract Testing. Independent Contract Testing led with a 58.0% share of 2025 value, because few Australian brands keep their own skin model and assay facilities. Independent Contract Testing also grows fastest at 8.40% a year, as sponsors outsource accredited studies rather than build new laboratories.
| Segment Group | Leading Sub-segment | Share, 2025 | Fastest-growing Sub-segment | CAGR, 2026–2035 |
|---|---|---|---|---|
| By Service Type | Skin Sensitisation Testing | 30.0% | Phototoxicity Testing | 9.01% |
| By End-Use Industry | Cosmetics and Personal Care | 34.0% | Medical Devices | 8.84% |
| By Customer Type | Product Sponsors | 44.0% | Ingredient Introducers | 8.59% |
| By Operating Model | Independent Contract Testing | 58.0% | Independent Contract Testing | 8.40% |
Request a Free Sample
Fill in your details and we'll send you a free sample report.
- Sample data tables & charts
- Research methodology
Cosmetic rules and sunscreen reviews lift study demand
How do limits on new animal data shift cosmetic evidence?
Cosmetic ingredient introducers now buy in vitro and in chemico studies, because animal tests can no longer support most cosmetic-only chemicals. The Australian Industrial Chemicals Introduction Scheme prohibits the use of new animal test data for chemicals with an end use only in cosmetics, covering tests on live vertebrates and cephalopods conducted on or after July 1, 2020. The same rules name skin sensitization tests such as the local lymph node assay among the affected studies. If a cosmetic-only chemical has no alternative data and no exception applies, the chemical cannot be introduced. Its categorization guidelines accept in vitro test guidelines 430, 431 and 435 for skin corrosion and test guideline 439 for skin irritation. As a result, Cosmetics and Personal Care leads end-use value with 34.0% of 2025 spending.
Why does defined-approach adoption expand assay demand?
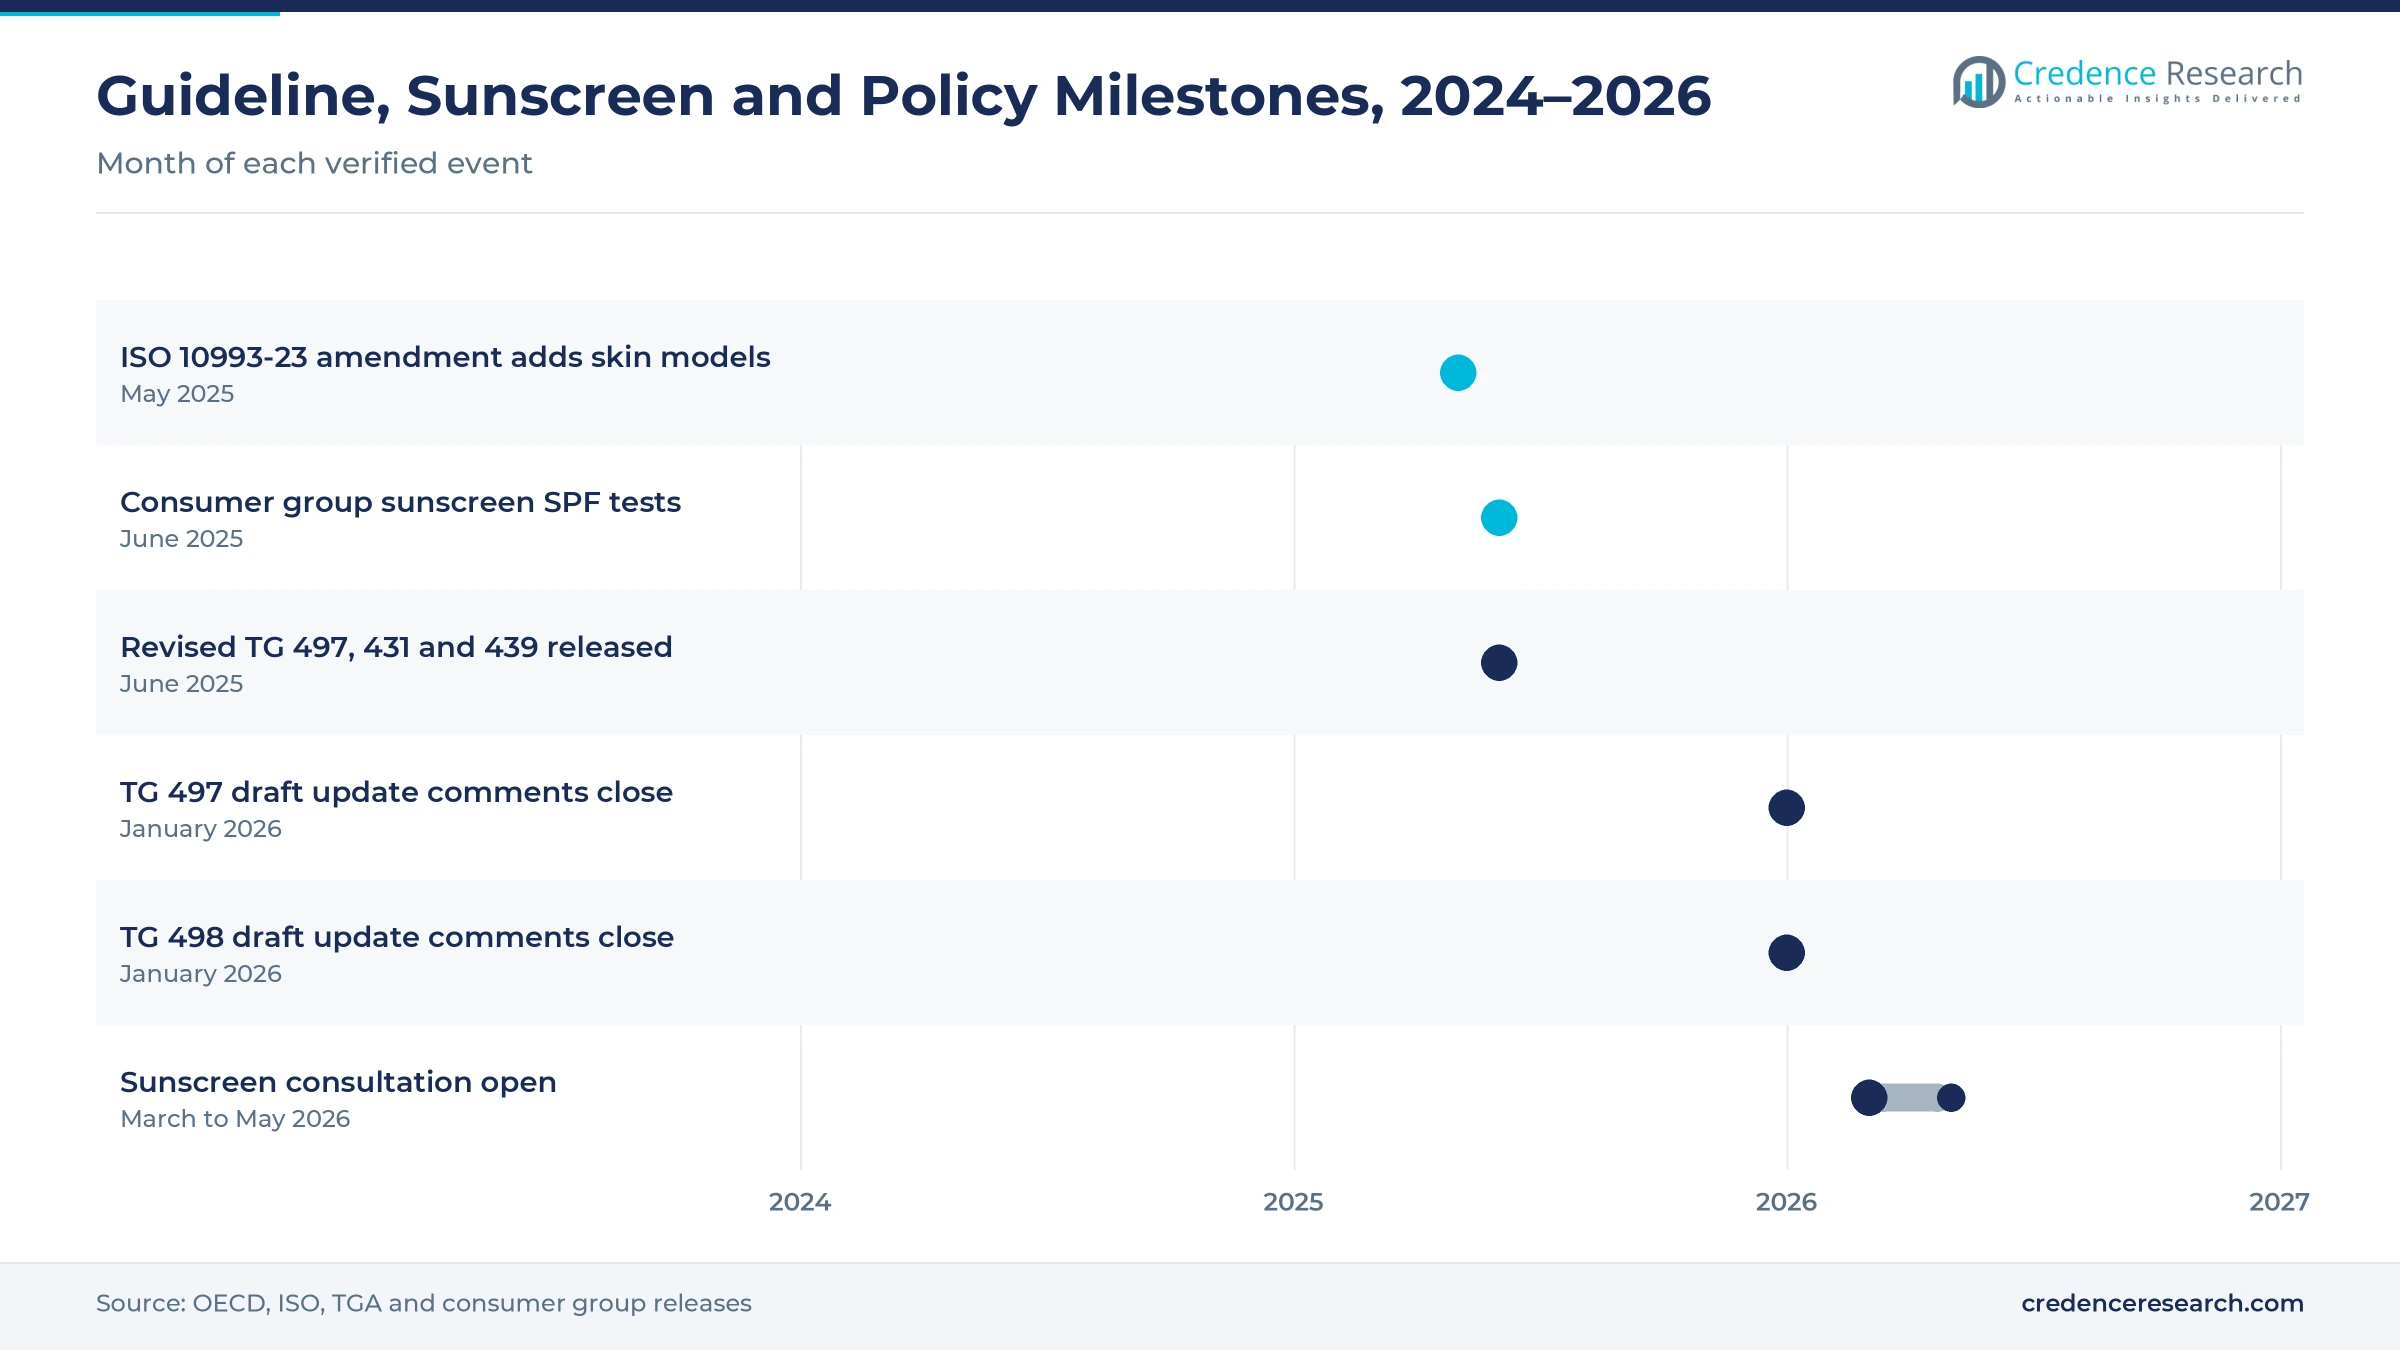
Defined approaches combine several non-animal assays into one prediction, which raises the number of studies needed for each sensitization answer. The OECD introduced Test Guideline 497 on June 9, 2021, and replaced it with a revised version on July 4, 2023. Its "2 out of 3" approach uses the direct peptide reactivity assay, the KeratinoSens assay and the h-CLAT assay together. A June 25, 2025 revision allowed more in chemico and in vitro methods as information sources and added an approach for estimating a point of departure. The Australian categorization guidelines list Test Guideline 497 alongside guidelines 442C, 442D and 442E. In turn, Skin Sensitisation Testing holds 30.0% of 2025 value.
How does sunscreen assessment raise test volumes?
Sunscreens with therapeutic claims face closer review of their evidence, which pushes sponsors to retest products and ingredients. In June 2025, CHOICE tested 20 sunscreens claiming SPF 50 or 50+, and the Therapeutic Goods Administration counts 18 of them as not meeting the requirements of the current standard. One product was cancelled from the register and its batches recalled, and the regulator identified 20 more products using the same base formulation. The regulator also reviewed seven active sunscreen ingredients with its exposure model and is considering lower permitted levels for three. Because sunscreens are worn on sun-exposed skin, Phototoxicity Testing grows fastest at 9.01% a year.
Why do medical device sponsors need more skin evidence?
Devices that touch skin need irritation and sensitization evidence before supply, and new standards let makers meet that need with skin models. The international standard ISO 10993-23 on irritation of medical devices took effect on Jan. 20, 2021, and covers in vitro and in vivo procedures for dermal exposure. Its first amendment, valid from May 1, 2025, adds further reconstructed human epidermis models to the standard. The 2025 revision of test guidelines 431 and 439 also removed one skin model that is no longer commercially available, which shifts work to the remaining validated models. As a result, Medical Devices grow fastest among end-use industries at 8.84% a year.
Lab accreditation, in vitro SPF and patch claims gain ground
Why is the shift to accredited testing laboratories notable?
Sponsors are moving work toward laboratories with formal accreditation, because the sunscreen findings exposed weak oversight of some test providers. The national regulator does not currently regulate or accredit SPF testing laboratories, and its 2026 consultation paper notes that many laboratories, often overseas, lack accreditation such as ISO/IEC 17025. One reform option would require SPF results to come from accredited or certified laboratories. CHOICE used the accredited Eurofins Dermatest laboratory in Sydney for its tests, and a laboratory in Germany validated one result on another batch. In turn, Independent Contract Testing grows at 8.40% a year, the fastest operating model rate.
How are in vitro sun protection methods changing work?
Human panel SPF studies are giving ground to instrument-based and skin model work, as laboratories add new methods to their menus. The International Organization for Standardization has published new in vitro SPF test methods, according to the national regulator, while the current human panel method is ISO 24444. The regulator acknowledges significant variability in results from the current human panel method, and one reform option would allow or mandate in vitro testing where appropriate. Another option would require finished-product testing at listing and periodically after that. Submissions on these options closed on May 23, 2026, after the regulator opened consultation on March 26, 2026. As a result, sunscreen sponsors are expected to commission more light-related skin studies before relisting.
Can sensitive-skin claims open more human patch studies?
Brands that sell products as suitable for sensitive skin need confirmatory human studies, which creates steady work after the non-animal hazard steps. Eurofins Dermatest in Rockdale, New South Wales, runs a human repeat insult patch test that needs data from at least 50 subjects. At least 25 of those subjects must self-nominate as having sensitive skin, and the induction phase uses nine 24-hour patch applications before a challenge patch. The test supports claims of non-primary irritation and non-primary sensitization. Eurofins acquired the Sydney laboratory in 2017, two decades after its founding in 1997, and renamed it Eurofins Dermatest. As a result, laboratories that link reconstructed skin models with patch studies can sell complete claim packages.
Is there room for phototoxicity and light-safety studies?
Ingredient reviews and new guideline work create an opening for laboratories that can run phototoxicity studies locally rather than abroad. The regulator's review of seven active sunscreen ingredients may lower permitted levels for three, which would lead many sponsors to reformulate and retest products. The international guideline on in vitro phototoxicity, Test Guideline 498, entered a draft update commenting round with a deadline of Jan. 27, 2026. Australia also has the highest skin cancer and melanoma rates in the world, with around 2,000 deaths a year, according to the regulator. In turn, light-related skin studies are set to expand as in vitro toxicology capacity expands.
Model supply, validation gaps and costs test laboratories
How does limited skin model supply affect laboratories?
Reconstructed skin models come from a few overseas suppliers, so Australian laboratories depend on imports with short shelf lives. The 2025 guideline revisions removed one skin model that is no longer commercially available, which narrows the choice of validated tissues. As a result, laboratories face scheduling risk when shipments are delayed or rejected. Larger groups respond by qualifying more than one model and planning studies around delivery windows, while smaller laboratories keep fewer endpoints in house.
Why do validation gaps slow full replacement?
Some skin safety questions still lack validated non-animal methods, which leaves sponsors unsure what evidence regulators will accept. The original defined approach guideline states that no single in chemico or in vitro method is a sufficient stand-alone replacement of animal data. In turn, sponsors must buy several assays for one answer, which raises cost and time. Laboratories respond with expert interpretation services that combine assay results, computer predictions and existing data into one weight-of-evidence report.
How do study costs weigh on small brands?
Many Australian cosmetic and sunscreen brands are small businesses, so a full set of non-animal skin studies takes a large share of their development budget. Reform options for sunscreens include periodic finished-product testing, which would add recurring costs for every listed product. As a result, some brands delay launches or choose ingredients that already have data. Laboratories respond with bundled study packages, while ingredient suppliers share data across many brands that use the same material.
Why do accreditation requirements risk testing bottlenecks?
Few laboratories worldwide hold the accreditations that a strict sunscreen reform would require, so demand could outrun local capacity. A mandatory accreditation rule could create testing bottlenecks and higher costs, because few laboratories already hold the required accreditations. In turn, sponsors could face longer waits for results before listing or relisting products. Laboratories respond by seeking accreditation for more methods, while the regulator weighs options that phase in new requirements over time.
Sydney sponsors lead while Queensland labs add capacity
| Region | Value, 2025 (USD million) | Share, 2025 | CAGR, 2026–2035 |
|---|---|---|---|
| New South Wales | 12.8 | 36.0% | 8.12% |
| Victoria | 10.3 | 29.0% | 8.07% |
| Queensland | 5.3 | 15.0% | 8.37% |
| Rest of Australia | 4.3 | 12.0% | 7.52% |
| Western Australia | 2.8 | 8.0% | 7.82% |
What keeps New South Wales ahead in skin safety work?
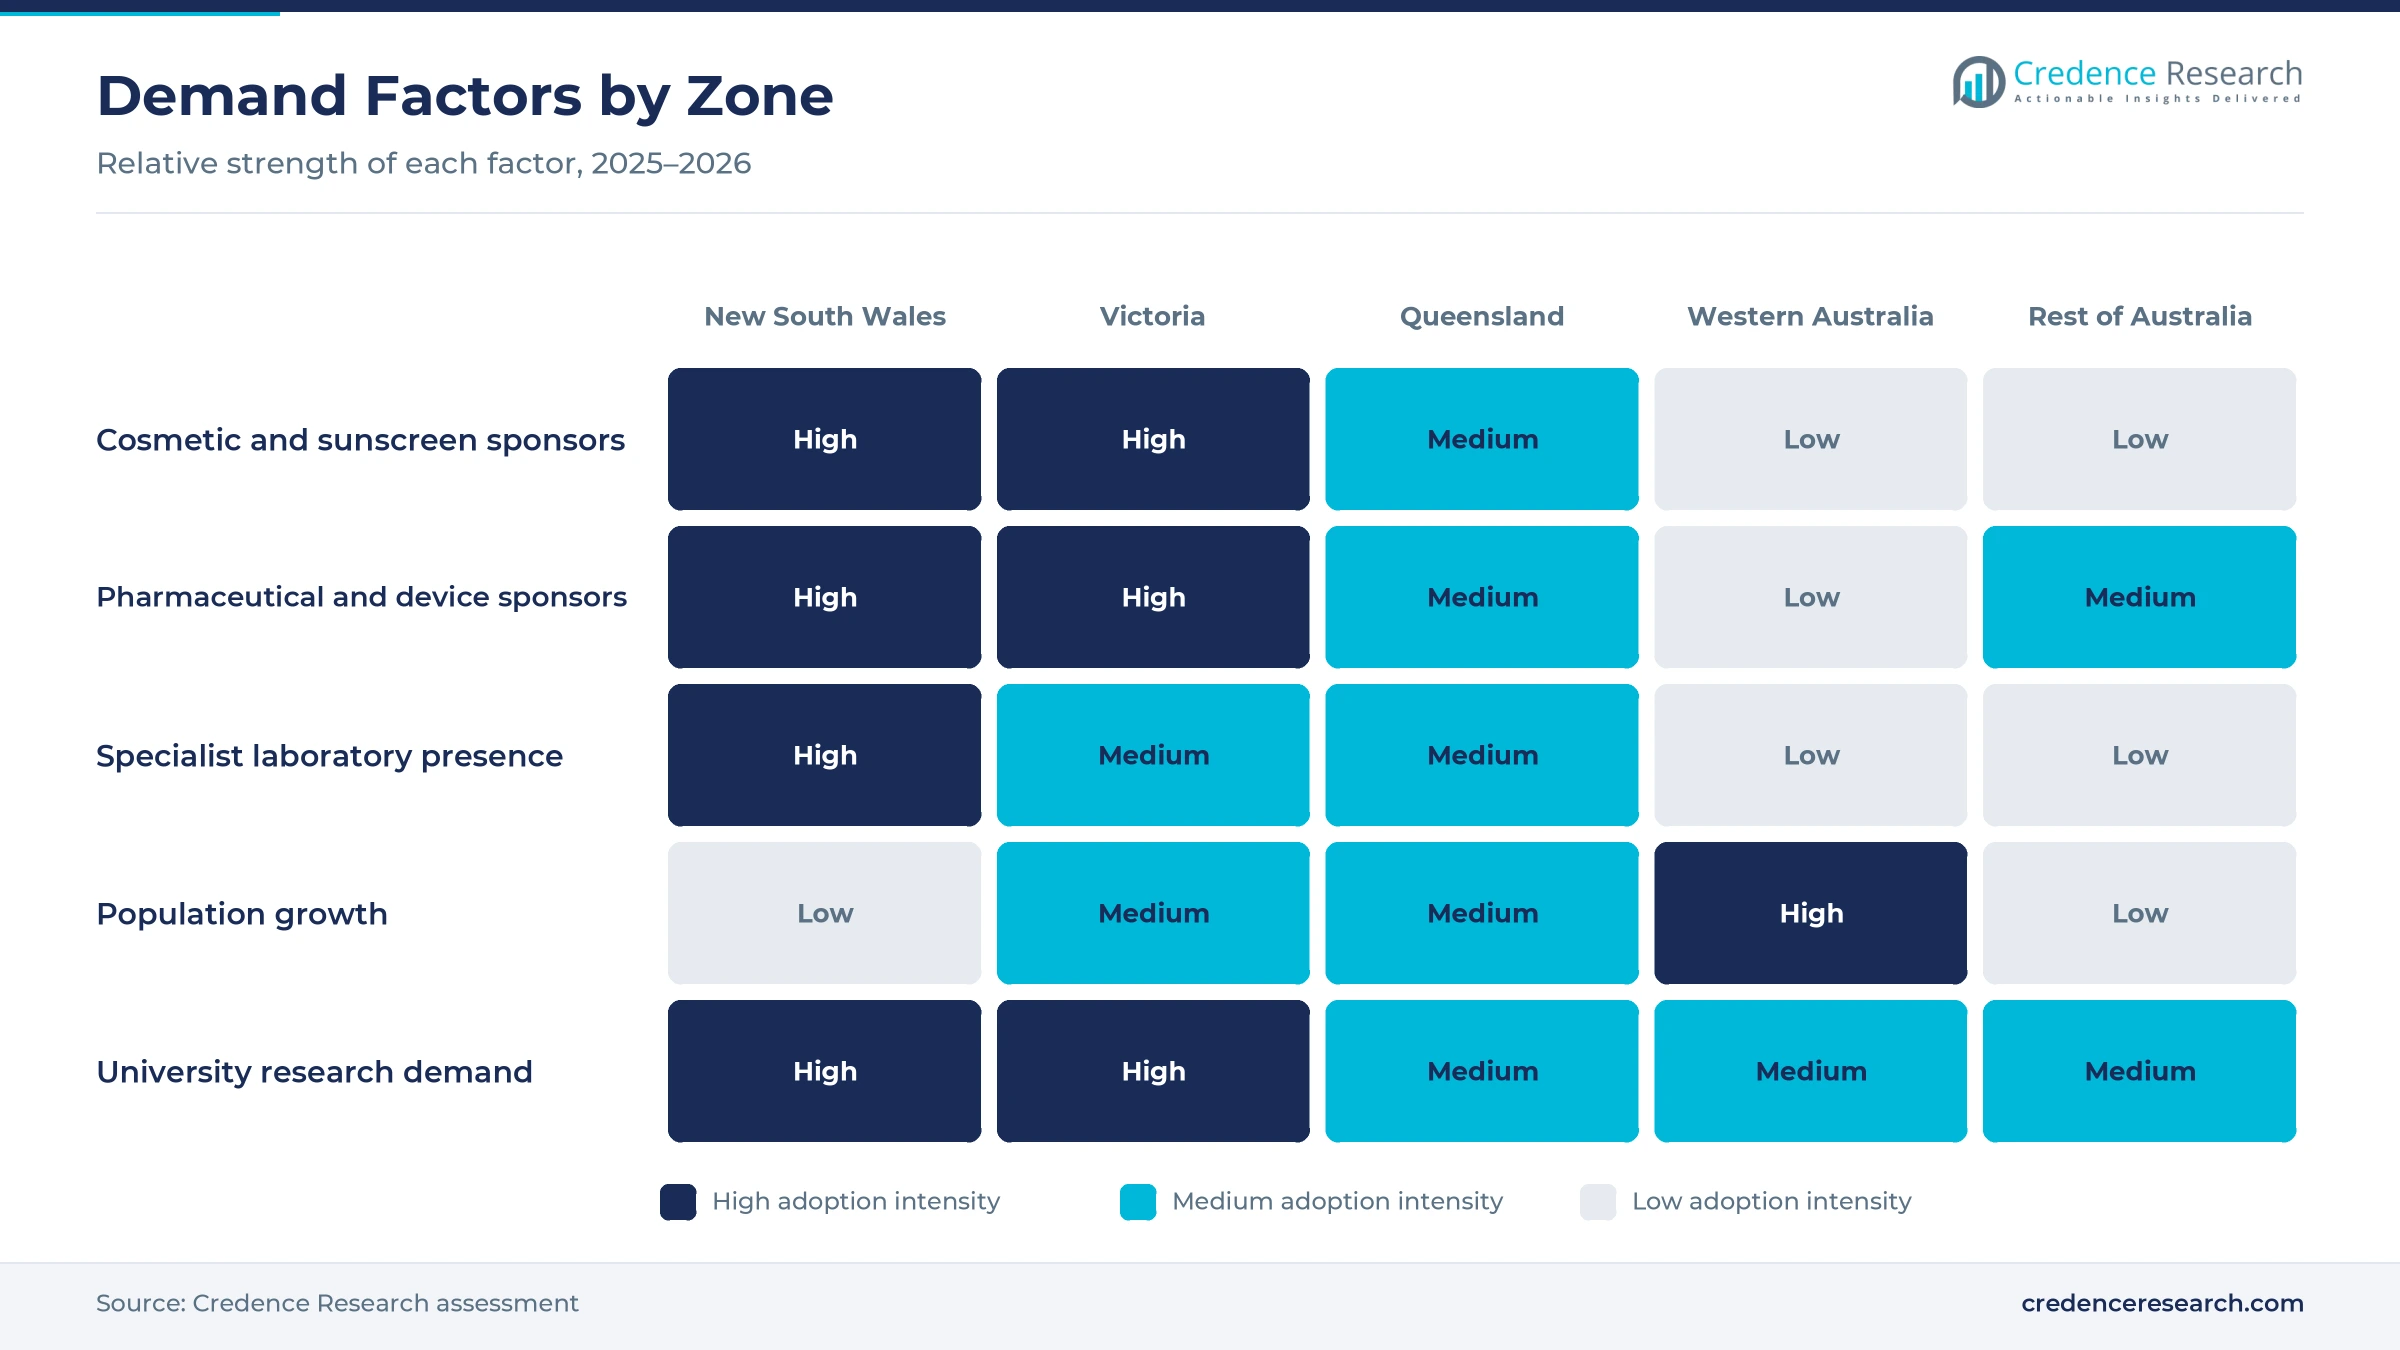
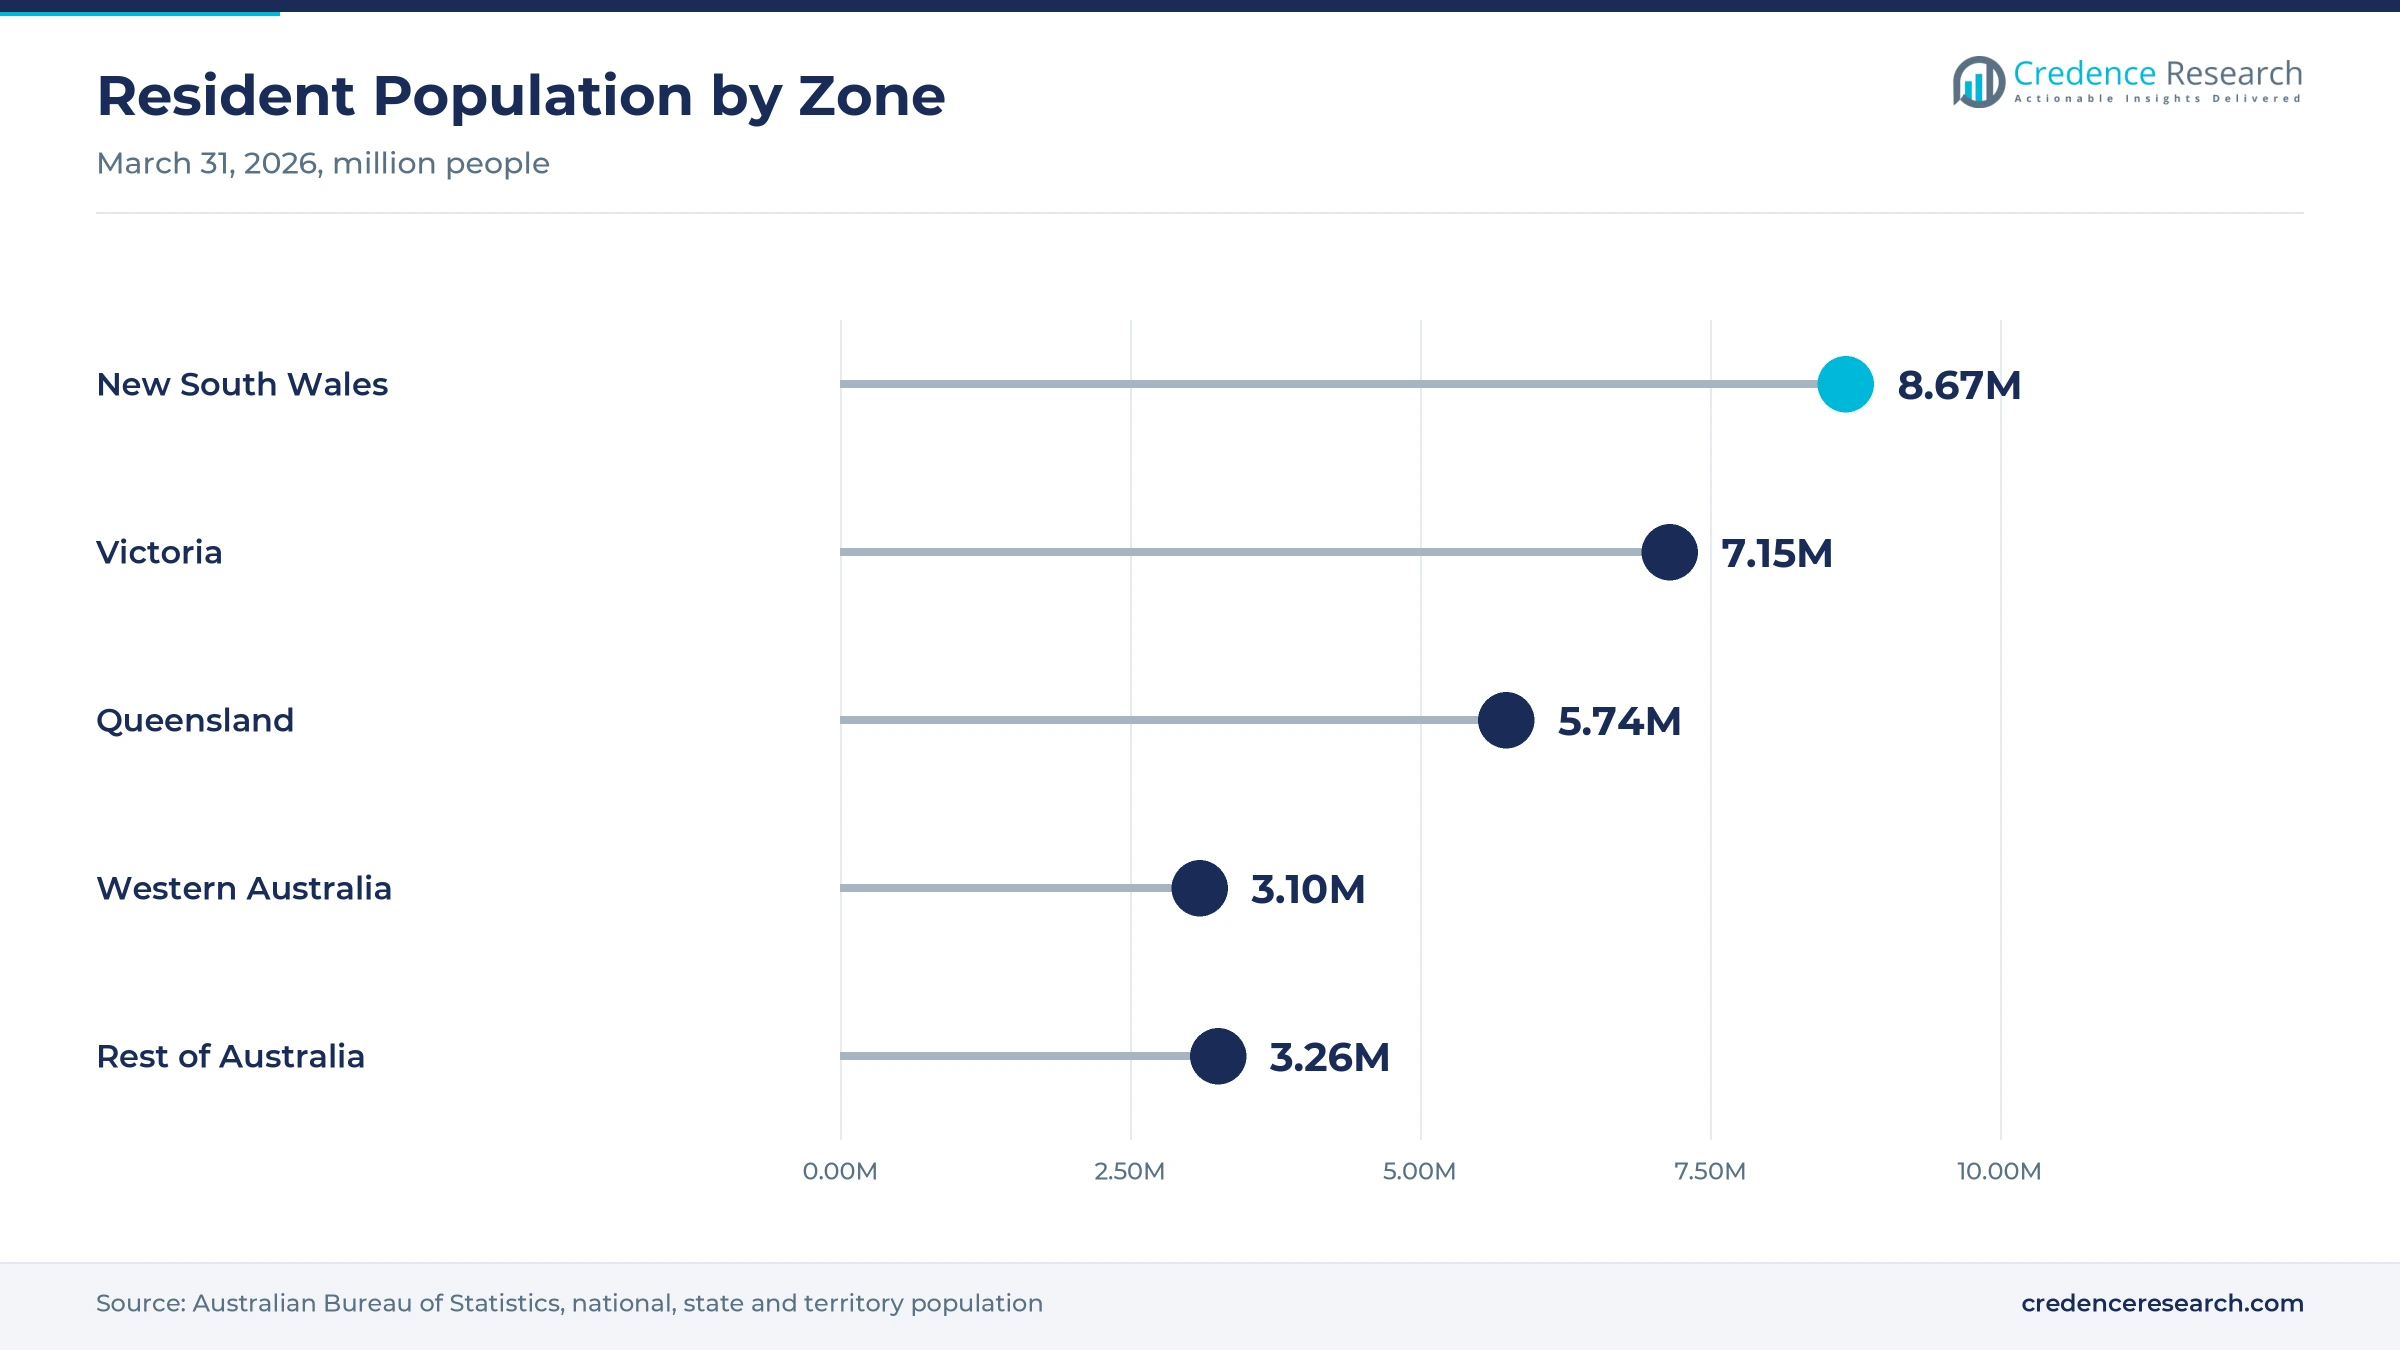
The largest population and a specialist claim support laboratory give New South Wales 36.0% of 2025 value and growth of 8.12% a year. That laboratory runs sun care and human patch studies, including a repeat insult patch test for sensitive-skin claims. The state had 8,670,100 residents on March 31, 2026, according to the Australian Bureau of Statistics. Eurofins Dermatest runs human patch studies in Rockdale, which keeps claim support work in the state. As a result, New South Wales leads sponsor-funded skin safety work.
How does Victoria support pharmaceutical skin work?
Victoria held a 29.0% share of 2025 value and grows at 8.07% a year, because Melbourne hosts pharmaceutical manufacturers and accredited analytical laboratories. The state had 7,154,200 residents on March 31, 2026, after growth of 1.6% over the year. Intertek runs a pharmaceutical laboratory in West Footscray that is accredited by the national medicines and agricultural chemicals regulators. In turn, Victoria remains the second-largest zone, with demand led by medicine and device sponsors.
Why are Queensland skin studies expanding fastest?
Queensland held a 15.0% share of 2025 value and grows fastest at 8.37% a year, because population growth and a Brisbane-based testing group widen local capacity. The state had 5,739,500 residents on March 31, 2026, after growth of 1.6% over the year. ALS lists beauty and personal care safety testing and clinical studies among its Australian services from its Bowen Hills base. As a result, more sponsors can place skin studies with a Queensland provider.
What shapes demand in Western Australia?
Western Australia held 8.0% of 2025 value and grows at 7.82% a year, because its sponsor base is smaller and much of its chemical demand comes from resources rather than consumer products. The state had 3,096,200 residents on March 31, 2026, after growth of 2.1%, the fastest rate nationally. In turn, Western Australian sponsors often send skin studies to laboratories on the east coast.
Where do smaller states and territories buy skin studies?
The rest of Australia held a 12.0% share of 2025 value and grows at 7.52% a year, covering South Australia, Tasmania and the two territories. These areas had about 3.26 million residents combined on March 31, 2026, and Tasmania grew only 0.6% over the year. As a result, demand here comes mainly from university research teams and a few ingredient introducers.
Guideline updates, SPF findings and reform, 2024–2026
| Development | Status and market relevance |
|---|---|
| In June 2025, a consumer group published SPF tests on 20 sunscreens, and the national regulator counted 18 of them as not meeting current requirements. | Triggered retesting, a product cancellation and a regulatory review |
| In June 2025, the international test guideline program introduced revised versions of Test Guideline 497 and the skin corrosion and irritation guidelines 431 and 439. | Widened accepted information sources for sensitization studies |
| In January 2026, commenting rounds closed on draft updates of Test Guideline 497 on sensitization and Test Guideline 498 on in vitro phototoxicity. | Signals further changes to non-animal skin methods |
| In March 2026, the Therapeutic Goods Administration opened a consultation paper on sunscreen regulation, with submissions due by May 23, 2026. | Options include accredited laboratories and in vitro SPF testing |
Skin models, peptide assays and in silico tools advance
- Reconstructed human epidermis models support corrosion and irritation studies under guidelines 431 and 439, and a 2025 amendment to ISO 10993-23 adds more of these models for device work.
- Peptide and cell-based assays measure the key events of skin sensitization, which lets laboratories run the direct peptide reactivity, KeratinoSens and h-CLAT assays inside one defined approach.
- In silico prediction tools such as Derek Nexus and the OECD QSAR Toolbox feed integrated testing strategies, which helps laboratories sell non-animal alternative methods as one evidence package.
Need a Custom Version of This Report?
Tailor the scope, geography, or segments to your exact requirements.
- Custom geography or segment scope
- Direct access to our analyst team
Global inspection groups and specialist labs compete
Competition is split between global inspection and testing groups with Australian laboratories and specialist skin study providers. Eurofins operates Eurofins Dermatest in Rockdale, New South Wales, which runs sun care and human patch studies and served as the accredited laboratory for a 2025 consumer group sunscreen test. ALS lists beauty and personal care safety testing, efficacy testing and clinical studies among its Australian services. Intertek runs a pharmaceutical laboratory in Melbourne accredited by the national medicines regulator, which supports medicine sponsors with analytical work. Rivals compete on accreditation, turnaround times, access to validated skin models and expert interpretation. Because many sponsors also buy cosmetic ingredients from overseas suppliers with existing data, laboratories that can review and combine supplier evidence win more work.
Which companies run skin safety studies in Australia?
| Company | Type | Role in the market |
|---|---|---|
| Eurofins Scientific | Specialist skin study laboratory | Eurofins Dermatest runs sun care and human patch studies in Rockdale |
| ALS Limited | Testing and inspection group | Lists beauty and personal care safety testing in Australia |
| Intertek Australia | Testing and inspection group | Accredited pharmaceutical laboratory in West Footscray, Melbourne |
Credence Research view on skin safety evidence demand
Credence Research's view is that Australian demand for skin safety studies will grow strongly because cosmetic rules, new defined approaches and sunscreen reform all require more evidence per product. Sensitization studies remain the largest value pool, while phototoxicity work adds the fastest growth as sunscreen and ingredient reviews proceed. Laboratories with formal accreditation, access to several skin models and expert interpretation should gain share. Limited local capacity and model supply risks will slow growth, while sponsors that rely on outsourced healthcare research gain flexibility.
How the national skin safety study estimate was built
The report uses 2025 as the base year on a calendar basis, and market values come from the Credence Research model. That model combines regulatory requirements for cosmetic, therapeutic and device evidence, international test guideline releases, state population data and company service disclosures. Segment splits and zone shares and growth rates are Credence Research estimates. Sources used are government regulators, official statistics, international guideline documents, consumer group releases and company publications, and no interviews or surveys were used.
Non-animal evidence and sunscreen reform carry growth
Value across Australian skin safety studies is expected to reach USD 88.3 million by 2035, an 8.05% CAGR during 2026–2035, as non-animal evidence becomes standard and sunscreen reform raises test volumes. Growth should be strongest through 2030 while sponsors retest sunscreens and adopt revised defined approaches. After that, device and phototoxicity work will carry more of the value. Mandatory accreditation would favor established laboratories, while slow reform would keep more work overseas. Laboratories that combine skin models and interpretation are expected to gain the most.
Frequently Asked Questions
How big is the Australia dermal toxicity testing market?
Why do sensitization studies lead skin safety value?
Which state leads spending on skin safety studies?
Can new animal data support cosmetic ingredients in Australia?
What happened with sunscreen testing in 2025?
Which end-use industry is growing fastest?
Which laboratories compete for skin safety work in Australia?
What are the main challenges for skin safety laboratories?
Table of Content
Chapter 1 Market Segmentation
- 1.1 Segmentation Framework
- 1.1.1 Product and Service Classification
- 1.1.2 Application and End-Use Classification
- 1.1.3 Technology and Solution Classification
- 1.1.4 Customer and Distribution Channel Classification
- 1.1.5 Geographic Segmentation
- 1.1.6 Market Segment Definitions and Boundaries
- 1.2 By Service Type
- 1.2.1 Skin Sensitisation Testing
- 1.2.2 Skin Irritation Testing
- 1.2.3 Skin Corrosion Testing
- 1.2.4 Phototoxicity Testing
- 1.2.5 Dermal Toxicity and Absorption Studies
- 1.3 By End-Use Industry
- 1.3.1 Pharmaceuticals
- 1.3.2 Cosmetics and Personal Care
- 1.3.3 Industrial Chemicals
- 1.3.4 Academic and Contract Research
- 1.3.5 Medical Devices
- 1.4 By Customer Type
- 1.4.1 Product Sponsors
- 1.4.2 Ingredient Introducers
- 1.4.3 Testing Organisations
- 1.4.4 Research Commissioners
- 1.5 By Operating Model
- 1.5.1 Independent Contract Testing
- 1.5.2 Captive Laboratory Testing
- 1.5.3 Academic Contract Testing
Chapter 2 Introduction
- 2.1 Report Objectives and Scope
- 2.2 Product Definition and Industry Terminology
- 2.3 Market Inclusions and Exclusions
- 2.4 Research Process
- 2.4.1 Primary Research and Expert Interviews
- 2.4.2 Secondary Research and Source Review
- 2.4.3 Top-Down and Bottom-Up Estimation
- 2.4.4 Data Triangulation and Verification
- 2.5 Market Size Measurement Basis
- 2.5.1 2025: USD 35.5 million → 2035: USD 88.3 million
- 2.6 Historical and Forecast Reference Periods
- 2.6.1 Historical Period: 2018-2025
- 2.6.2 Base Year: 2025
- 2.6.3 Forecast Period: 2025-2035
- 2.7 Research Assumptions and Limitations
Chapter 3 Executive Summary
- 3.1 Market Snapshot and Key Findings
- 3.2 Base-Year Market Size, 2025
- 3.3 Forecast Market Size, 2035
- 3.4 Revenue and Volume Growth Outlook
- 3.5 Key Demand and Supply Indicators
- 3.6 Leading Market Segments
- 3.7 Fastest-Growing Market Opportunities
- 3.8 Regional Performance Highlights
- 3.9 Technology and Industry Transformation
- 3.10 Competitive Landscape Summary
- 3.11 Analyst View and Strategic Implications
Chapter 4 Australia Dermal Toxicity Testing Market Trends and Developments
- 4.1 Historical Industry Development, 2018-2025
- 4.2 Recent Market Trends and Developments
- 4.3 Demand and Customer Behavior Trends
- 4.4 Technology and Product Innovation
- 4.5 Artificial Intelligence, Automation and Digitalization
- 4.6 Local Manufacturing and Supply Chain Realignment
- 4.7 Industry Partnerships, Mergers and Acquisitions
- 4.8 Sustainability and Circular Economy Developments
- 4.9 Government and Private Sector Investment Trends
- 4.10 Emerging Business Models and Commercialization
- 4.11 Industry Developments and Announcements
Chapter 5 Australia Dermal Toxicity Testing Market Production, Supply and Demand Analysis
- 5.1 Demand Trend and Consumption Analysis, 2018-2025
- 5.2 Demand Forecast, 2025-2035
- 5.3 Production and Output Trend, 2018-2025
- 5.4 Production and Output Forecast, 2025-2035
- 5.5 Installed Capacity and Capacity Utilization
- 5.6 Company-Wise Production Plants and Statistics
- 5.6.1 Installed Production Capacity
- 5.6.2 Actual Production
- 5.6.3 Planned Capacity and Expansion Targets
- 5.7 Supply Chain Structure and Procurement Trends
- 5.8 Supply-Demand Gap and Bottlenecks
- 5.9 Import Dependence and Sourcing Structure
- 5.10 Contract Manufacturing and Outsourcing
- 5.11 Regional Supply and Demand Concentration
Chapter 6 Australia Dermal Toxicity Testing Market Pricing Analysis
- 6.1 Pricing Structure and Measurement
- 6.2 Historical Pricing Trends, 2018-2025
- 6.3 Pricing Outlook, 2025-2035
- 6.4 Average Selling Price and Unit Economics
- 6.5 Pricing by Product and Market Segment
- 6.6 Geographic Pricing Differences
- 6.7 Key Input, Energy, Labor and Logistics Costs
- 6.8 Contract Pricing and Purchasing Models
- 6.9 Pricing Sensitivity and Competitive Positioning
- 6.10 Price, Margin and Profitability Implications
Chapter 7 Australia Dermal Toxicity Testing Market Dynamics
- 7.1 Market Growth Drivers
- 7.1.1 Demand-Side Drivers
- 7.1.2 Technology and Innovation Drivers
- 7.1.3 Infrastructure and Investment Drivers
- 7.1.4 Regulatory and Policy Drivers
- 7.2 Market Restraints
- 7.2.1 Cost and Affordability Constraints
- 7.2.2 Technology and Adoption Barriers
- 7.2.3 Supply Chain and Operational Constraints
- 7.3 Market Challenges
- 7.3.1 Competitive Pressure and Margin Erosion
- 7.3.2 Skills, Infrastructure and Implementation Gaps
- 7.4 Emerging Market Opportunities
- 7.5 Market Dynamics Impact and Time-Horizon Assessment
Chapter 8 Australia Dermal Toxicity Testing Value Chain Analysis
- 8.1 Industry Value Chain Overview
- 8.2 Upstream Suppliers and Critical Inputs
- 8.3 Technology and Component Providers
- 8.4 Manufacturing or Service Delivery
- 8.5 Distribution, Channel Partners and Integrators
- 8.6 Downstream Applications and End Users
- 8.7 Value Addition and Profit Pools
- 8.8 Vertical Integration and Outsourcing
- 8.9 Supplier Concentration and Risk
- 8.10 Supply Chain Localization and Resilience
Chapter 9 Australia Dermal Toxicity Testing Market Regulations and Policies
- 9.1 Relevant Laws, Standards and Compliance Frameworks
- 9.2 Product, Service, Safety and Quality Requirements
- 9.3 Government Policies, Incentives and Subsidies
- 9.4 Imports, Exports and Trade Barriers
- 9.5 Public Procurement and Local Content Requirements
- 9.6 Environmental and Sustainability Compliance
- 9.7 Upcoming Policy Changes and Market Implications
Chapter 10 Australia Dermal Toxicity Testing Market Hotspots and Opportunities
- 10.1 Market Opportunity Mapping and Growth Hotspots
- 10.2 High-Growth Applications and Customer Groups
- 10.3 Underserved Markets and White-Space Opportunities
- 10.4 Emerging Technology and Product Opportunities
- 10.5 New Capacity and Investment Hotspots
- 10.6 Market Entry and Expansion Opportunities
- 10.7 Distribution and Partnership Opportunities
- 10.8 Near-Term and Long-Term Commercial Potential
- 10.9 Opportunity Attractiveness and Execution Risks
Chapter 11 Australia Dermal Toxicity Testing Market Outlook, 2025-2035
- 11.1 Market Size and Analysis
- 11.1.1 Revenue (Market Measurement: 2025: USD 35.5 million → 2035: USD 88.3 million)
- 11.1.2 Market Volume and Quantity Sold
- 11.1.3 Historical Market Size, 2018-2025
- 11.1.4 Base-Year Market Size, 2025
- 11.2 Market Forecast, 2025-2035
- 11.2.1 Revenue Forecast to 2035
- 11.2.2 Volume Forecast to 2035
- 11.2.3 CAGR and Year-on-Year Growth
- 11.2.4 Incremental Revenue Opportunity
- 11.3 Forecast Assumptions and Scenario Analysis
- 11.3.1 Base-Case Forecast
- 11.3.2 Optimistic and Conservative Scenarios
- 11.3.3 Technology, Pricing and Policy Sensitivities
- 11.4 Market Attractiveness and Growth Outlook
Chapter 12 Australia Dermal Toxicity Testing Market Segmentation and Outlook
- 12.1 Segmentation Summary and Market Shares, 2025
- 12.2 Largest and Fastest-Growing Segments
- 12.3 By Service Type - Market Size and Forecast, 2025-2035
- 12.3.1 Segment Definition and Scope
- 12.3.2 Historical Market Size, 2018-2025
- 12.3.3 Revenue Forecast, 2025-2035
- 12.3.4 Volume Forecast, 2025-2035
- 12.3.5 Base-Year Market Share, 2025
- 12.3.6 Segment CAGR and Growth Drivers
- 12.3.7 Subsegment Market Size and Forecast
- 12.3.7.1 Skin Sensitisation Testing
- 12.3.7.2 Skin Irritation Testing
- 12.3.7.3 Skin Corrosion Testing
- 12.3.7.4 Phototoxicity Testing
- 12.3.7.5 Dermal Toxicity and Absorption Studies
- 12.3.8 Subsegment Pricing and Adoption Trends
- 12.3.9 Leading Suppliers and Competition
- 12.3.10 Regional Demand and Opportunities
- 12.4 By End-Use Industry - Market Size and Forecast, 2025-2035
- 12.4.1 Segment Definition and Scope
- 12.4.2 Historical Market Size, 2018-2025
- 12.4.3 Revenue Forecast, 2025-2035
- 12.4.4 Volume Forecast, 2025-2035
- 12.4.5 Base-Year Market Share, 2025
- 12.4.6 Segment CAGR and Growth Drivers
- 12.4.7 Subsegment Market Size and Forecast
- 12.4.7.1 Pharmaceuticals
- 12.4.7.2 Cosmetics and Personal Care
- 12.4.7.3 Industrial Chemicals
- 12.4.7.4 Academic and Contract Research
- 12.4.7.5 Medical Devices
- 12.4.8 Subsegment Pricing and Adoption Trends
- 12.4.9 Leading Suppliers and Competition
- 12.4.10 Regional Demand and Opportunities
- 12.5 By Customer Type - Market Size and Forecast, 2025-2035
- 12.5.1 Segment Definition and Scope
- 12.5.2 Historical Market Size, 2018-2025
- 12.5.3 Revenue Forecast, 2025-2035
- 12.5.4 Volume Forecast, 2025-2035
- 12.5.5 Base-Year Market Share, 2025
- 12.5.6 Segment CAGR and Growth Drivers
- 12.5.7 Subsegment Market Size and Forecast
- 12.5.7.1 Product Sponsors
- 12.5.7.2 Ingredient Introducers
- 12.5.7.3 Testing Organisations
- 12.5.7.4 Research Commissioners
- 12.5.8 Subsegment Pricing and Adoption Trends
- 12.5.9 Leading Suppliers and Competition
- 12.5.10 Regional Demand and Opportunities
- 12.6 By Operating Model - Market Size and Forecast, 2025-2035
- 12.6.1 Segment Definition and Scope
- 12.6.2 Historical Market Size, 2018-2025
- 12.6.3 Revenue Forecast, 2025-2035
- 12.6.4 Volume Forecast, 2025-2035
- 12.6.5 Base-Year Market Share, 2025
- 12.6.6 Segment CAGR and Growth Drivers
- 12.6.7 Subsegment Market Size and Forecast
- 12.6.7.1 Independent Contract Testing
- 12.6.7.2 Captive Laboratory Testing
- 12.6.7.3 Academic Contract Testing
- 12.6.8 Subsegment Pricing and Adoption Trends
- 12.6.9 Leading Suppliers and Competition
- 12.6.10 Regional Demand and Opportunities
- 12.7 Segment Growth Comparison
- 12.8 Segment Attractiveness and Priority Matrix
Chapter 13 Australia Dermal Toxicity Testing End-Use and Application Market Outlook
- 13.1 End-Use Industry and Customer Demand Structure
- 13.2 Leading Applications and Customer Groups
- 13.3 End-Use Market Size, Share and Forecast
- 13.4 Major End-Use Industry Deep Dives
- 13.4.1 Customer Requirements and Use Cases
- 13.4.2 Demand and Replacement Cycles
- 13.4.3 Technical and Regulatory Considerations
- 13.4.4 Purchasing and Procurement Models
- 13.4.5 Leading Vendors and Distribution Channels
- 13.4.6 Forecast and Commercial Opportunities
- 13.5 Emerging Applications and Cross-Segment Demand
- 13.6 End-Use Industry Investment Priorities
Chapter 14 Australia Dermal Toxicity Testing Geographic Market Outlook, 2025-2035
- 14.1 Domestic Market Distribution and Demand Clusters
- 14.2 State- or Province-Wise Market Size and Forecast, 2025-2035
- 14.3 City and Metropolitan Market Outlook
- 14.4 Industrial, Manufacturing and Commercial Clusters
- 14.5 Geographic Concentration of Key End Users
- 14.6 Local Pricing and Purchasing Differences
- 14.7 Domestic Production Facilities and Capacity Map
- 14.8 Local Infrastructure and Project Pipeline
- 14.9 State-Level Policy and Incentive Differences
- 14.10 Subnational Investment Hotspots and Opportunities
- 14.11 Distribution and Logistics Networks
- 14.12 Domestic Competitive Footprint
Chapter 15 Australia Dermal Toxicity Testing Technology, Innovation and Sustainability Outlook
- 15.1 Technology Landscape and Maturity
- 15.2 Product, Process and Service Innovation
- 15.3 AI, Automation and Digital Tools in the Industry
- 15.4 Technology Adoption and Performance Benchmarking
- 15.5 Innovation Pipeline and R&D Investment
- 15.6 Patent and Intellectual Property Trends
- 15.7 Energy Efficiency and Resource Management
- 15.8 Sustainability, Recycling and Circularity
- 15.9 Technology Roadmap, 2025-2035
- 15.10 Risks of Obsolescence and Technology Substitution
Chapter 16 Australia Dermal Toxicity Testing Market Key Strategic Imperatives
- 16.1 Growth and Market Entry Priorities
- 16.2 High-Return Products and Segments
- 16.3 Pricing, Profitability and Cost Optimization
- 16.4 Technology Investment and Product Differentiation
- 16.5 Supply Chain Localization and Resilience
- 16.6 Distribution and Customer Acquisition
- 16.7 Partnership, Acquisition and Capacity Strategy
- 16.8 Regional Expansion Priorities
- 16.9 Short-, Medium- and Long-Term Actions
Chapter 17 Competition Outlook
- 17.1 Industry Competition Characteristics
- 17.2 Market Structure and Concentration
- 17.3 Market Share and Competitive Positioning, 2025
- 17.4 Company-Wise Revenue and Product Benchmarking
- 17.5 Production and Service Capacity Benchmarking
- 17.6 Technology, Pricing and Differentiation
- 17.7 Regional Footprint and Distribution Strength
- 17.8 Mergers, Acquisitions and Strategic Alliances
- 17.9 New Entrants and Competitive Threats
- 17.10 Porter's Five Forces and Industry Attractiveness
- 17.11 Competitive Outlook, 2025-2035
Chapter 18 Company Profiles
- 18.1 Company Coverage and Selection Criteria
- 18.2 Eurofins Scientific
- 18.2.1 Business Description
- 18.2.2 Company Ownership and Geographic Presence
- 18.2.3 Product and Service Portfolio
- 18.2.4 Manufacturing and Operating Footprint
- 18.2.5 Production Capacity and Expansion Plans
- 18.2.6 Financial Performance and Investment
- 18.2.7 Market Share and Competitive Position
- 18.2.8 Technology and Innovation Capabilities
- 18.2.9 Strategic Alliances or Partnerships
- 18.2.10 Recent Developments
- 18.2.11 Growth Strategy and Outlook
- 18.3 SGS Australia
- 18.4 ALS Limited
- 18.5 Intertek Australia
- 18.6 Bureau Veritas Australia
- 18.7 Other Relevant Market Participants
Note: Every listed company is profiled on the structure shown under the first company. The company list is preliminary and may change based on research findings, market developments, data availability and client requirements.
Chapter 19 Disclaimer
- 19.1 Research and Forecast Disclaimer
- 19.2 Data Source and Estimation Limitations
Note: The depth of individual sections depends on data availability for this market. Volume, capacity, trade and other unit-based metrics are included where applicable.

