
Shared records, telehealth and aged care software converge
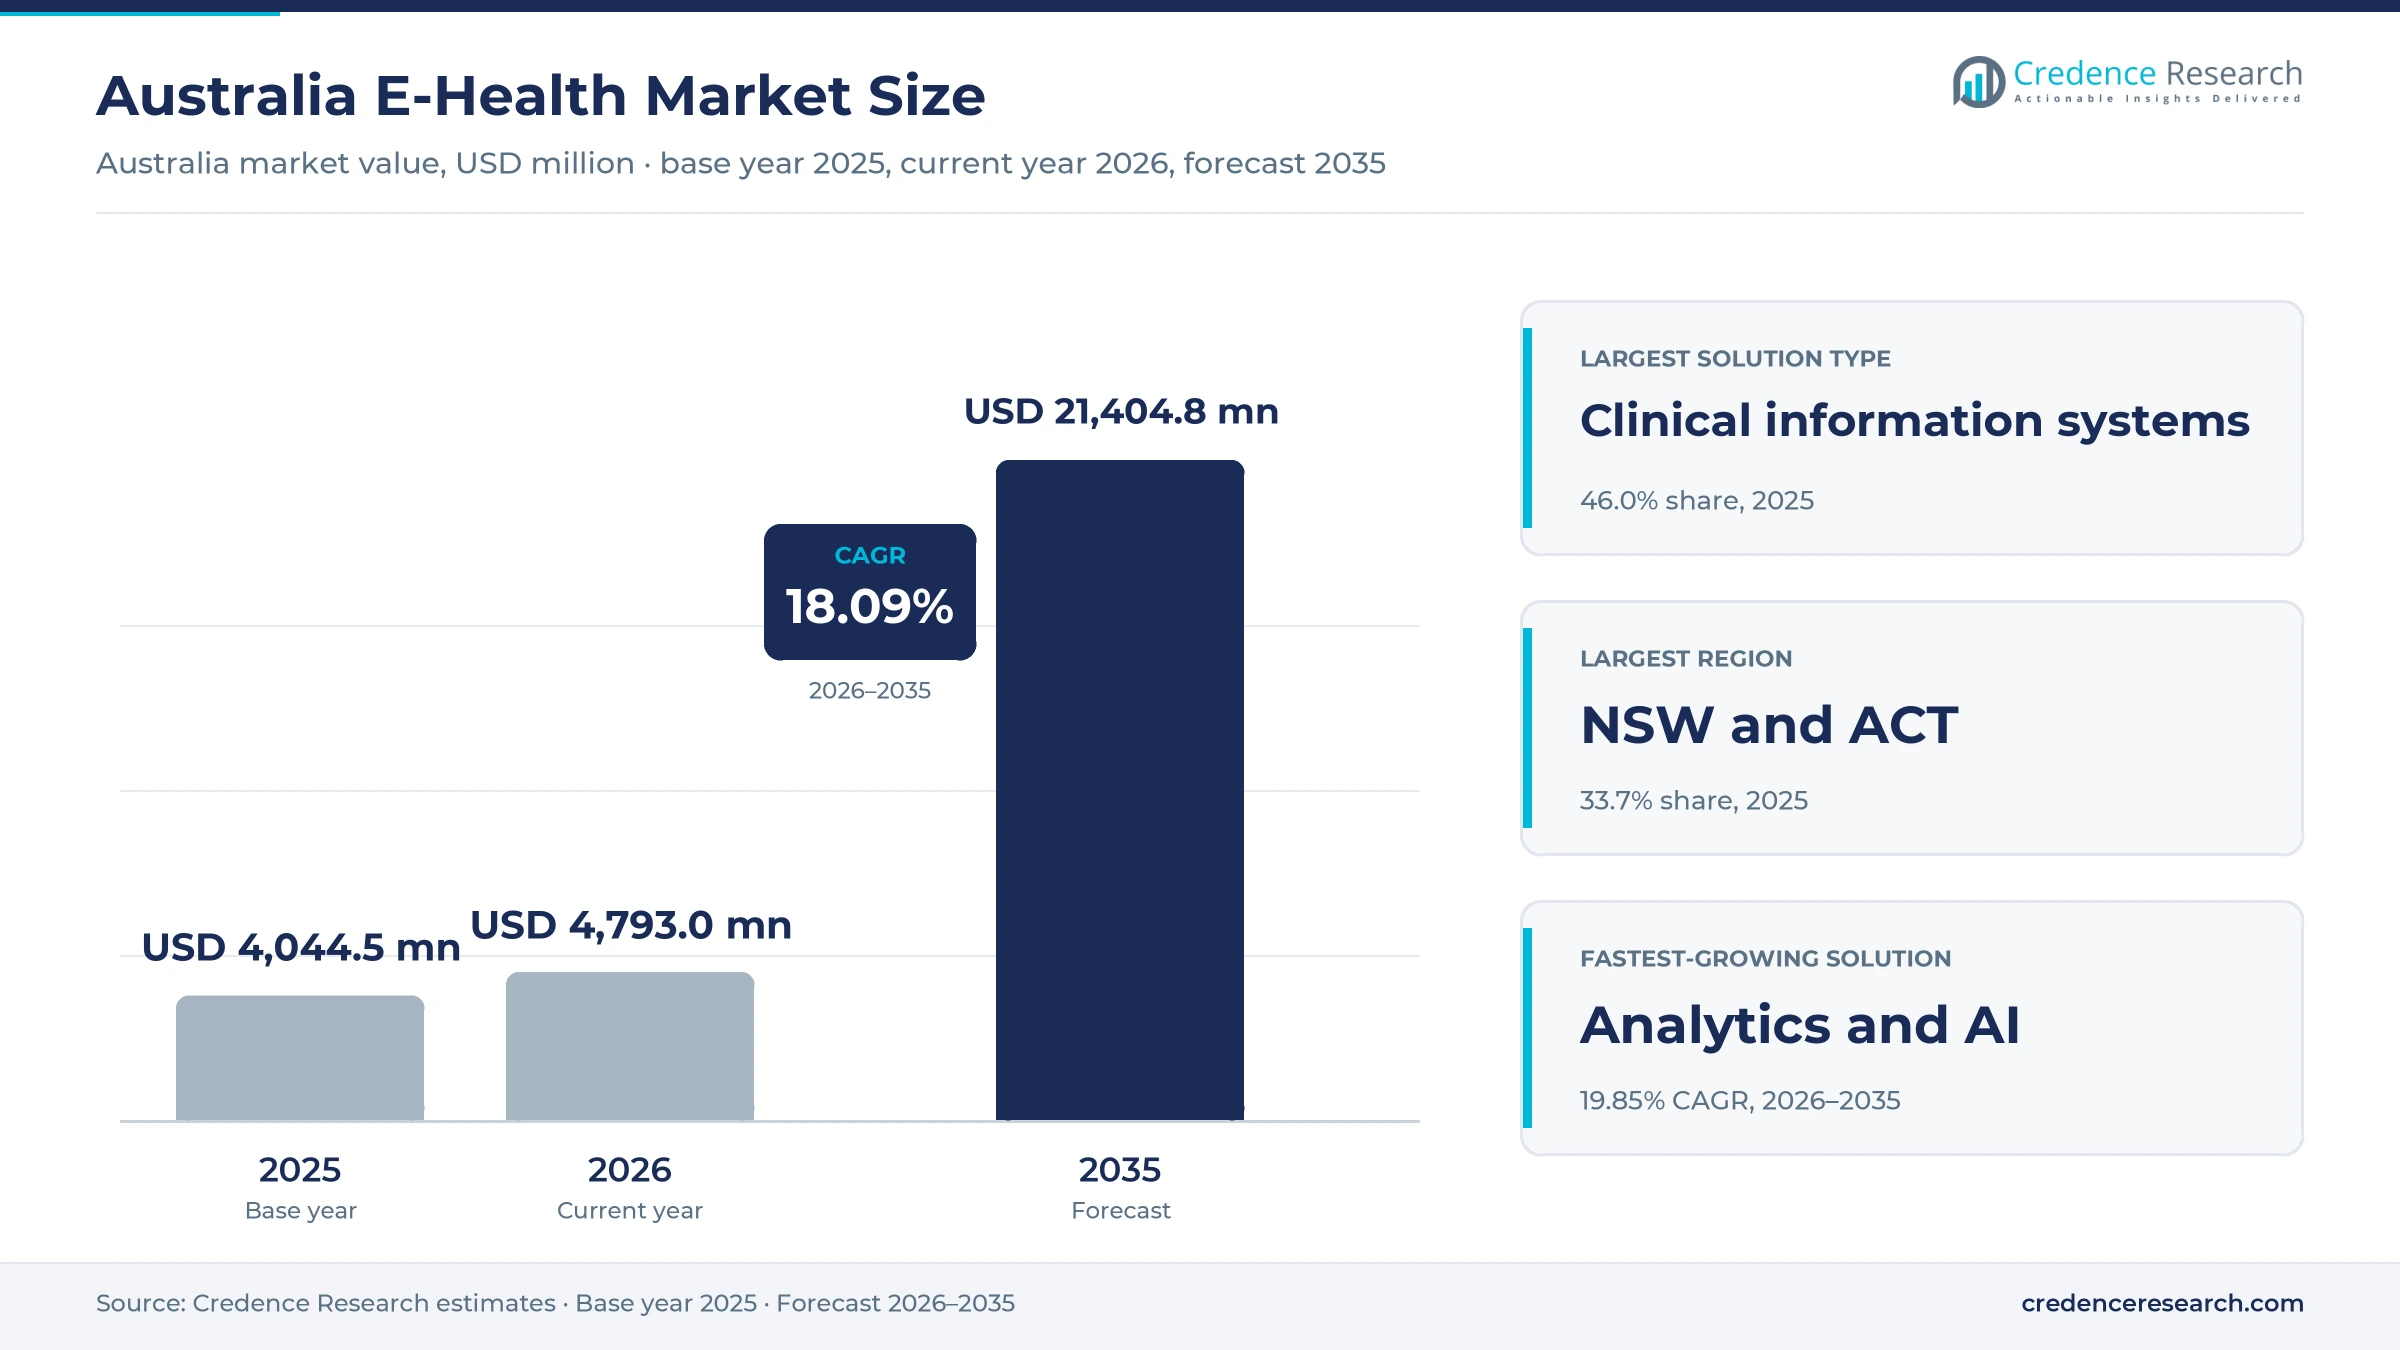
The Australia e-health market was valued at USD 4.04 billion in 2025 and is projected to increase from USD 4.79 billion in 2026 to USD 21.40 billion by 2035, registering a CAGR of 18.09% during 2026–2035. Demand comes from state health departments replacing dozens of hospital systems with single statewide records, from federal rules that push pathology and imaging reports into My Health Record, and from aged care providers rebuilding software for a new Aged Care Act. New South Wales and Australian Capital Territory held the largest regional share, 33.7% in 2025, because NSW Health is moving every public hospital, laboratory and community center onto one record. The same zone is also the fastest-growing region at 18.49% a year as that rollout moves through its stages. In turn, the new Aged Care Act took effect on Nov. 1, 2025, which forced providers to update claiming, reporting and care software.
Which digital health tools does the estimate count?
The estimate measures spending by Australian health departments, private hospitals, practices, aged care providers, insurers and consumers on software and platforms that record, exchange and use health information. It counts license, subscription, hosting, implementation and support fees for clinical information systems, record exchanges, booking and medicines platforms, telehealth tools and analytics and artificial intelligence software.
The estimate excludes Medicare benefits paid for consultations, medical hardware sold as devices and general office software that is not built for care delivery. The value chain runs from global record vendors and Australian software groups through integrators and resellers to state health systems, private operators, general practices, pharmacies, aged care homes and the patients who book and manage care online.
Australia E-Health Market Insights
- The Australia e-health market was valued at USD 4.04 billion in 2025 and is projected to reach USD 21.40 billion by 2035, registering a CAGR of 18.09% during 2026–2035.
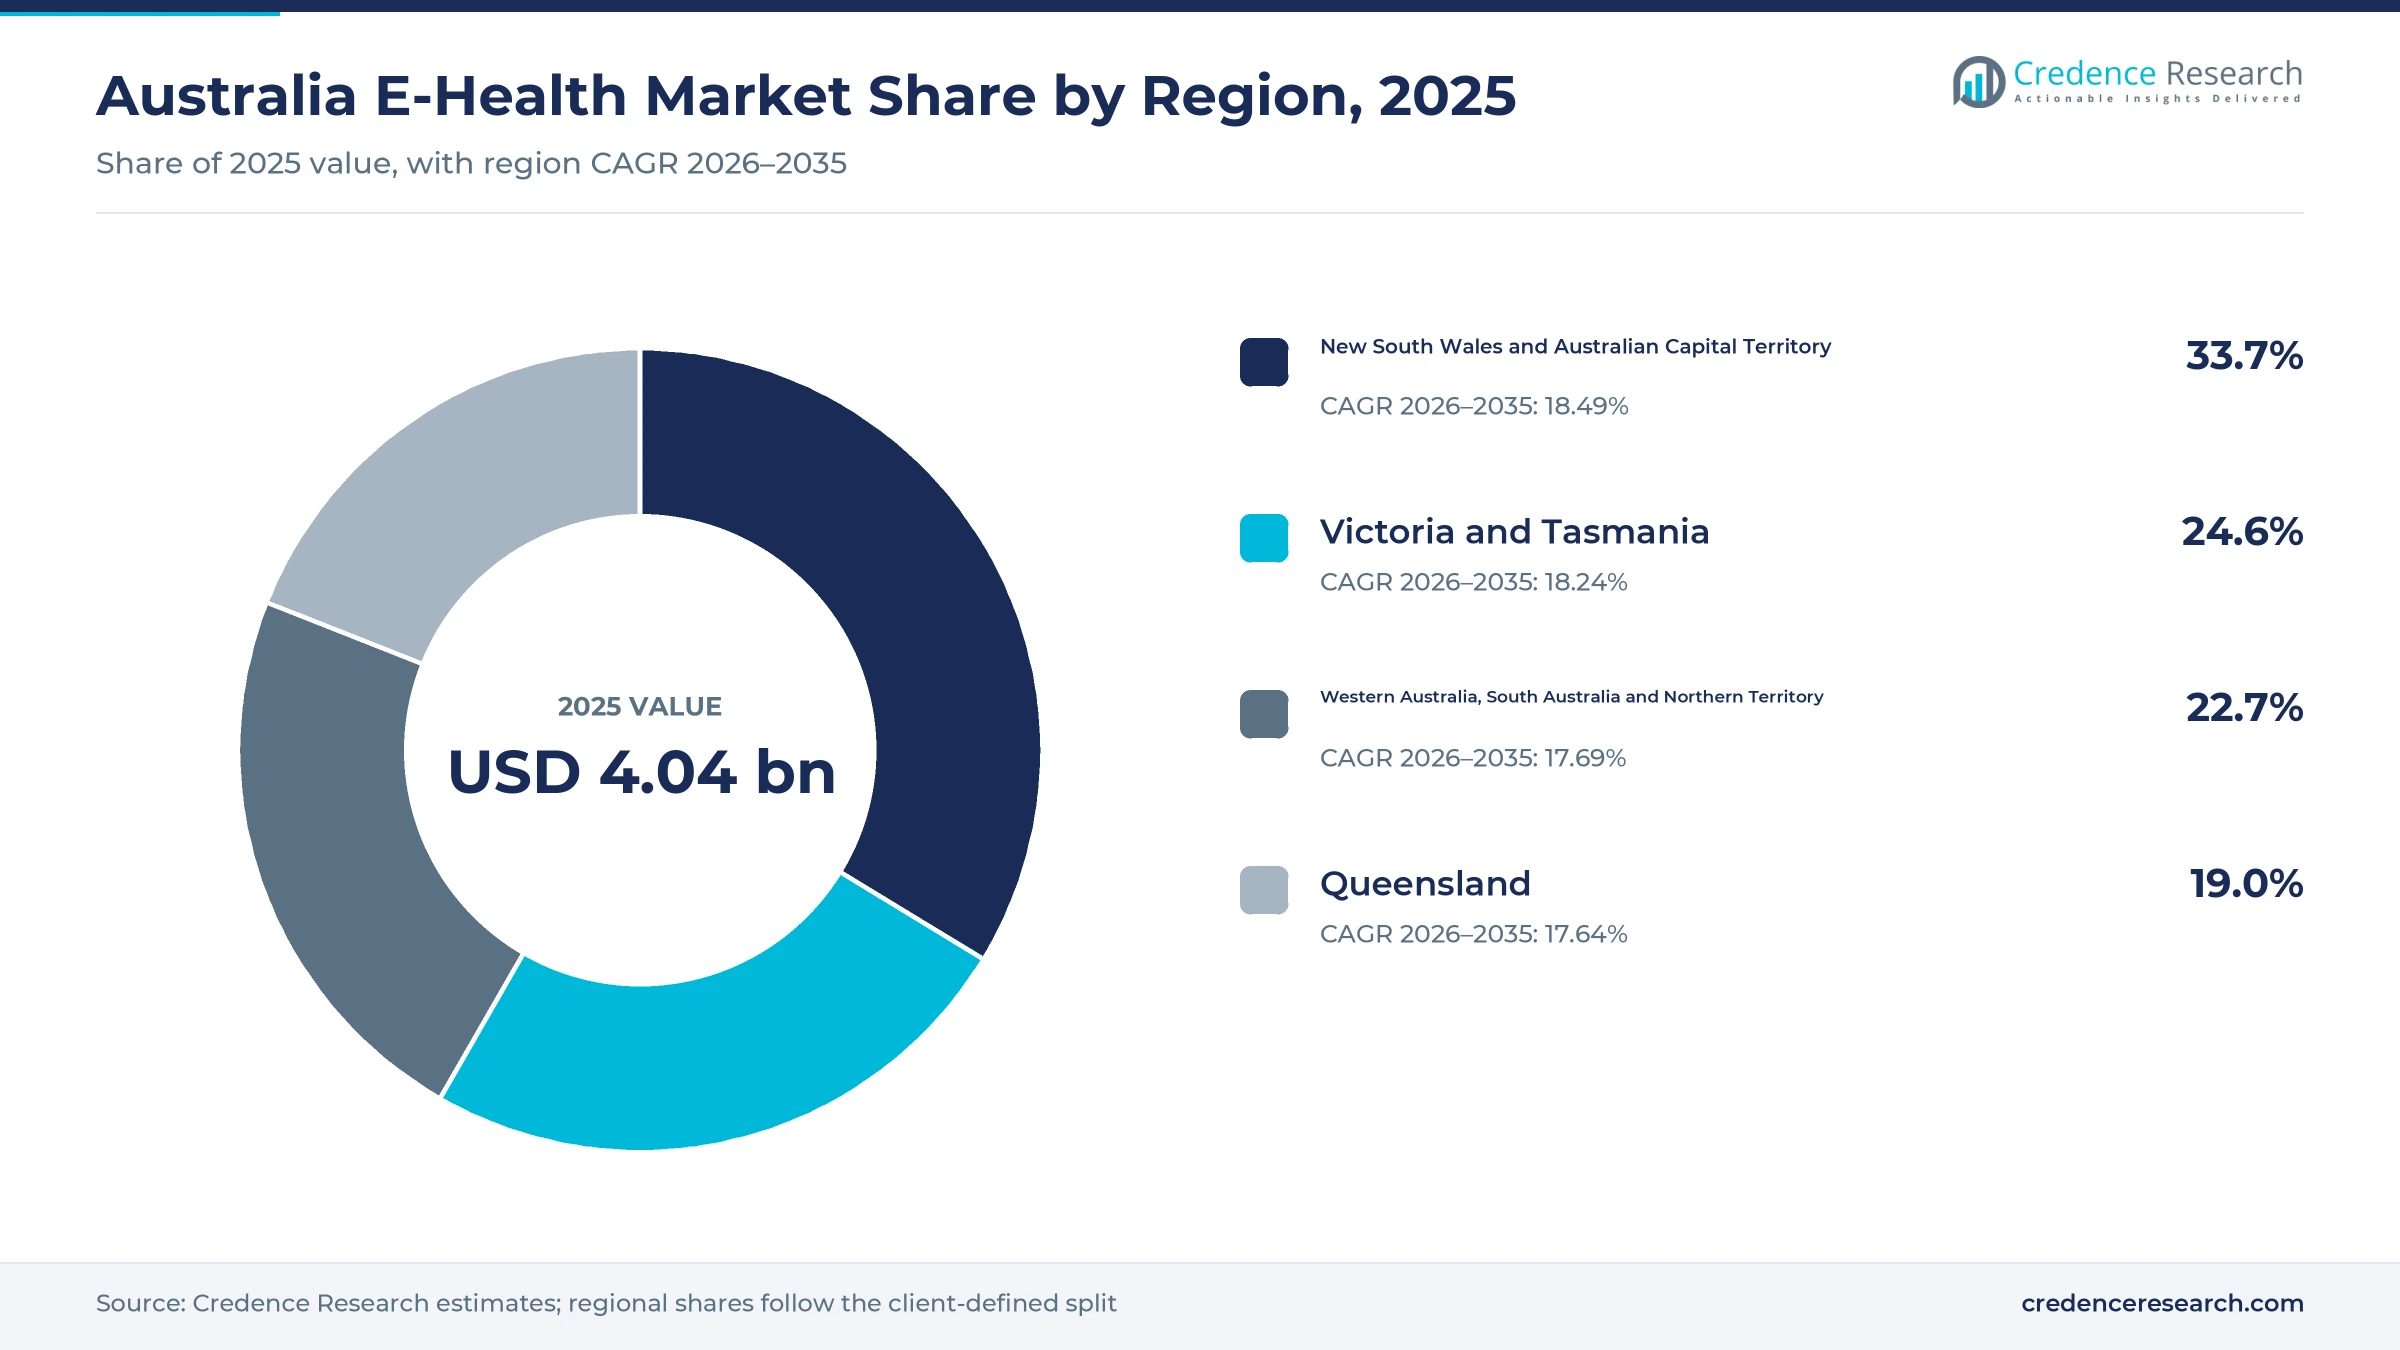
- New South Wales and Australian Capital Territory held a 33.7% share of 2025 value as NSW Health prepared its statewide record rollout.
- Clinical information systems led with a 46.0% share of 2025 value, because statewide hospital record programs carry the largest and longest contracts.
- Pathology reports uploaded to My Health Record rose 36% in the year to February 2026, which shows how quickly shared data volumes are growing.
- Analytics and artificial intelligence grows fastest at 19.85% a year during 2026–2035, as hospitals and practices add AI scribes and predictive tools.
Clinical systems lead while AI and analytics grow fastest
Why do clinical information systems hold the largest share?
Based on solution type, the market is categorized into Clinical Information Systems, Connected Care Platforms, Medicines and Patient Access Platforms, and Analytics and Artificial Intelligence. Clinical Information Systems led with a 46.0% share of 2025 value, because statewide hospital records carry multi-year license, build and support contracts. Analytics and Artificial Intelligence grows fastest at 19.85% a year, as clinicians adopt AI scribes and hospitals add risk tools on top of new records.
How do hospital and home settings split e-health spending?
Based on care setting, the market is categorized into Hospital Care, Ambulatory Care, Community Care and Home and Residential Care. Hospital Care led with a 50.0% share of 2025 value, because public hospital records and patient administration systems are the largest single purchases. Home and Residential Care grows fastest at 19.43% a year, as aged care homes replace paper medication charts and virtual services treat more patients at home.
Which customers fund most e-health purchases?
Based on customer type, the market is categorized into Public Health Authorities, Private Care Organisations, Health Insurers and Individual Consumers. Public Health Authorities led with a 52.0% share of 2025 value, because state departments buy hospital records, pathology systems and exchanges through long programs. Individual Consumers grow fastest at 19.30% a year, as patients book appointments, use online pharmacy services and see results through apps.
How do tenders, direct sales and partners reach buyers?
Based on sales channel, the market is categorized into Public Procurement, Direct Enterprise Sales, Partner-Led Sales and Self-Service Sales. Public Procurement led with a 49.0% share of 2025 value, because state health departments buy most hospital systems through multi-year tenders. Self-Service Sales grows fastest at 19.39% a year, as practices and patients sign up to booking and telehealth platforms online without a sales visit.
| Segment Group | Leading Sub-segment | Share, 2025 | Fastest-growing Sub-segment | CAGR, 2026–2035 |
|---|---|---|---|---|
| By Solution Type | Clinical Information Systems | 46.0% | Analytics and Artificial Intelligence | 19.85% |
| By Care Setting | Hospital Care | 50.0% | Home and Residential Care | 19.43% |
| By Customer Type | Public Health Authorities | 52.0% | Individual Consumers | 19.30% |
| By Sales Channel | Public Procurement | 49.0% | Self-Service Sales | 19.39% |
Request a Free Sample
Fill in your details and we'll send you a free sample report.
- Sample data tables & charts
- Research methodology
Sharing laws, telehealth and aged care reform lift spend
How do connected care and interoperability lift demand?
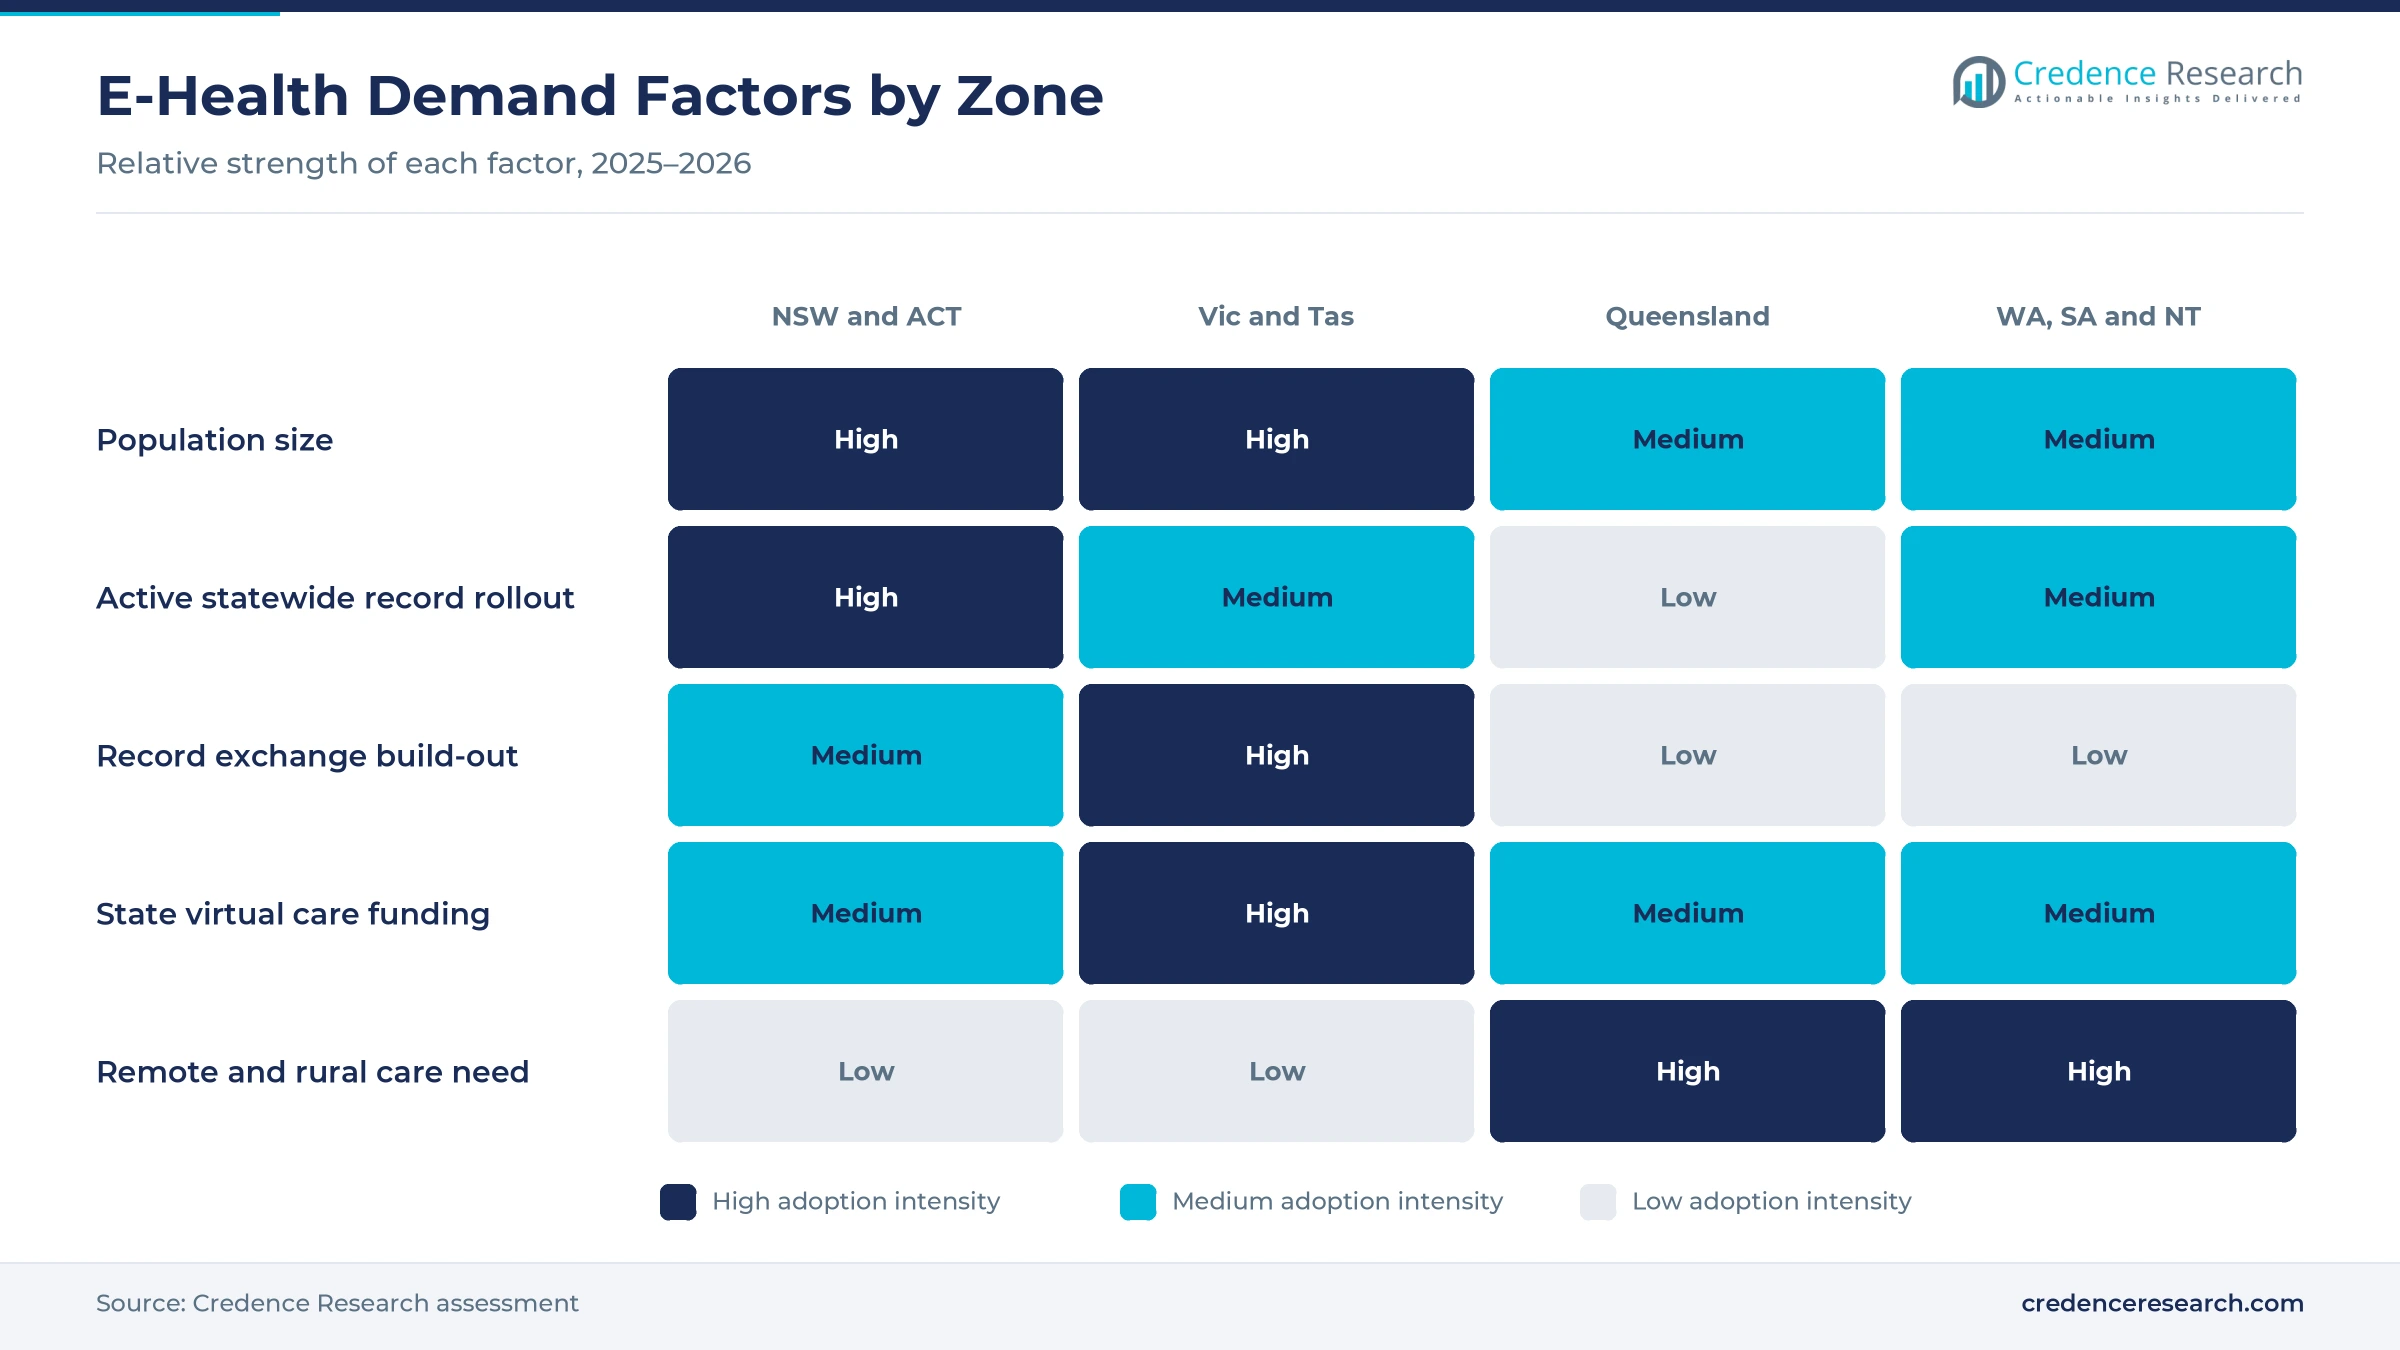
Federal and state programs now require hospitals, laboratories and practices to share records, which forces buyers to fund integration software and upgrades. My Health Record held about 24.8 million records in February 2026, and pathology report uploads rose 36% over the year, according to Australian Digital Health Agency statistics. The Modernising My Health Record (Sharing by Default) Act 2025 lets rules require pathology and imaging providers to upload reports, with civil penalties of 30 penalty units for failures. About 75% of the 44 actions in the national interoperability plan were complete by the March 2026 quarter, according to Medical Republic. As a result, connected care platforms grow faster than the market as reporting systems are rebuilt.
Why do permanent telehealth workflows keep platforms busy?
Telehealth is now a routine Medicare service rather than a pandemic stopgap, so practices and specialists keep paying for booking, video and messaging tools. Most pandemic-era items are now permanent and backed by AUD 106 million, according to Healthcare IT News, which also reported that allied health and non-GP specialists used video in 75% and 48% of telehealth consultations. From Nov. 1, 2025, patients registered with MyMedicare can reach listed telehealth services through their registered practice, according to the Department of Health. HotDoc relaunched its Telehealth on Demand service on Aug. 13, 2025, with consult summaries shared back to the regular practice. In turn, ambulatory care holds a large share while self-service sales grow at 19.39% a year.
How does aged care platform renewal open new budgets?
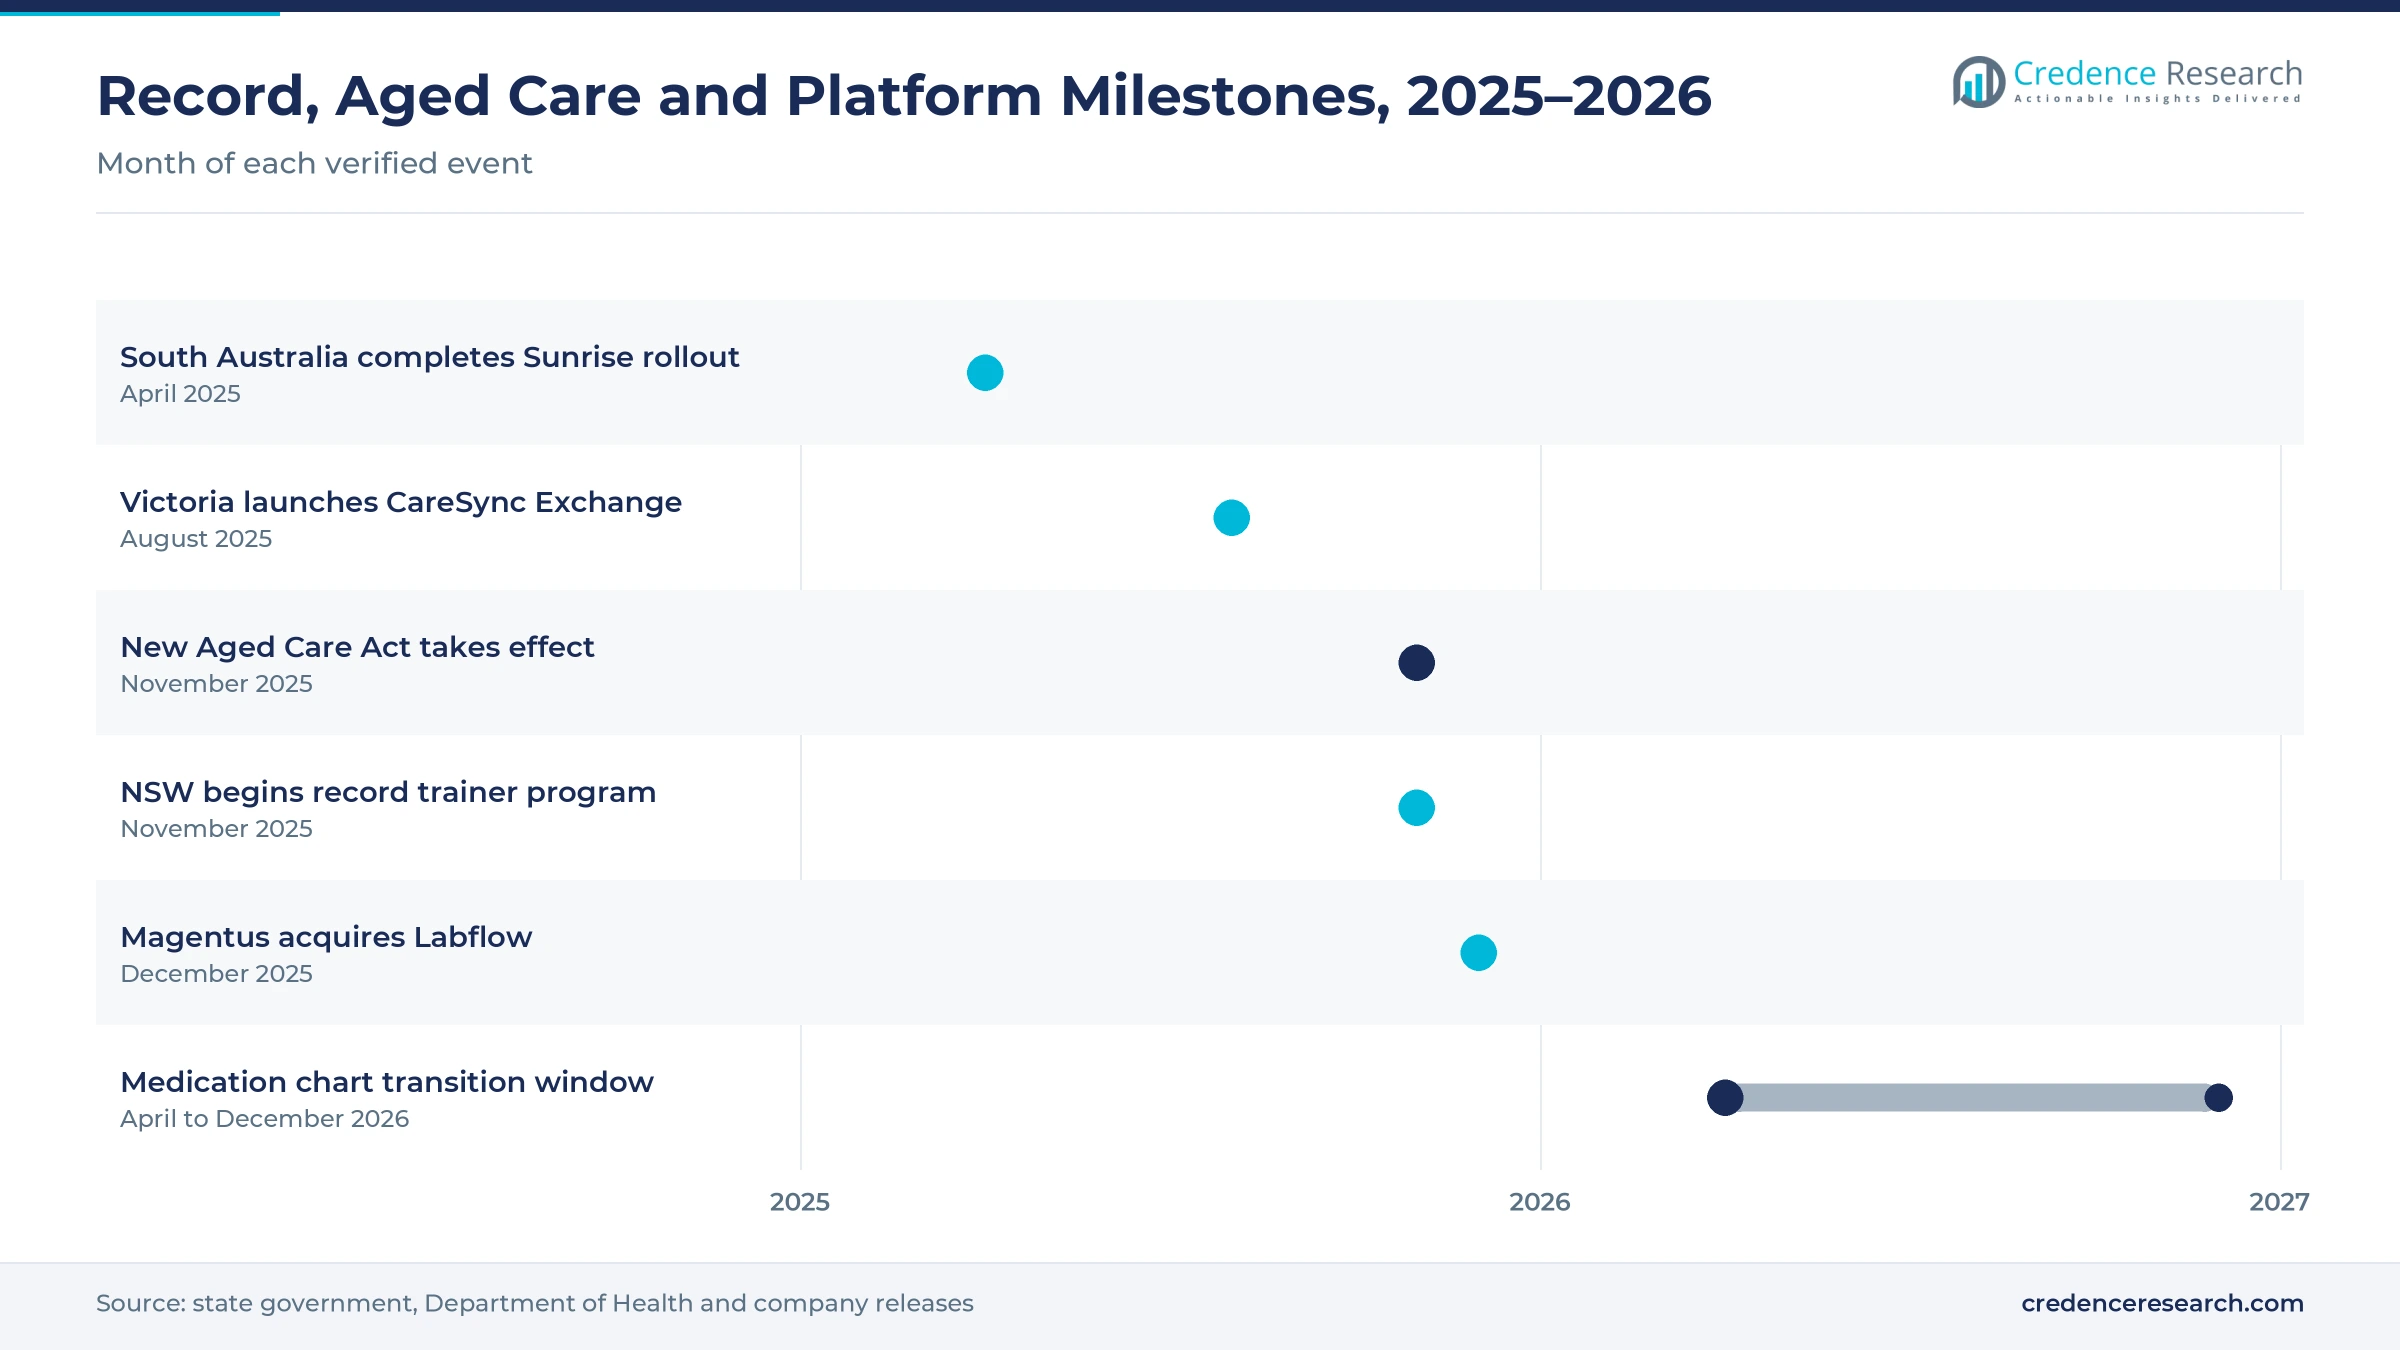
Aged care providers must replace or upgrade clinical, medication and claiming software, which turns a slow digital segment into an active buyer. The new Aged Care Act started on Nov. 1, 2025, and the Department of Health told providers to ask vendors for API tools for reporting and claiming, with Support at Home claims from Dec. 1, 2025. Homes using electronic medication charts must move to an e-prescribing conformant version before the transitional arrangement ends on Dec. 31, 2026, according to the Department of Health. Only 18% of aged care providers had used My Health Record in February 2026, which shows how much catch-up work remains. As a result, home and residential care grows fastest at 19.43% a year.
How do statewide hospital record programs anchor spending?
State governments are replacing many local hospital systems with single records, which creates the largest contracts in Australian e-health. NSW Health said its Single Digital Patient Record will unify nine electronic medical records, 10 patient administration systems and five laboratory systems, reaching more than 220 public hospitals by 2028. South Australia activated the Sunrise record across almost 100 sites with more than 4,900 beds in April 2025, according to Altera Digital Health. Western Australia has invested AUD 247 million in its record program and moved to procurement of a full system after August 2025, according to the state government. As a result, public procurement carries 49.0% of 2025 value.
Mandatory uploads, booking platforms and AI scribes emerge
How is the rise of mandatory data sharing changing vendors?
Laboratories, imaging groups and hospitals are shifting from optional uploads to default sharing, which turns interfaces into a compliance product rather than an extra feature. Diagnostic imaging reports in My Health Record rose 40% to about 70 million in the year to February 2026, while pathology reports reached about 770 million. The Sharing by Default rules also allow Medicare benefits to be recouped where required uploads do not happen, according to the Department of Health. Victoria began its CareSync Exchange in August 2025 with access to more than 2.3 million patient records, according to the Victorian government. In turn, groups that sell data exchange and integration software gain steady demand from every provider type.
Why are patient booking platforms consolidating and scaling?
Patient access platforms are growing into national networks, which attracts investors and pushes smaller apps to merge or exit. Healthengine passed 100 million bookings in November 2025, with about one million bookings a month and more than 10,000 practices, according to ChannelLife Australia. Private equity firm Potentia took a majority stake in HotDoc in February 2026, when 13 million patients and 23,000 practitioners used the platform, according to Startup Daily. MedAdvisor signed a binding agreement on July 2, 2025, to sell its ANZ division to Jonas Software, according to its ASX filing. As a result, individual consumers grow at 19.30% a year as booking and script tools become standard.
Can AI scribes and analytics open a new value pool?
Clinicians spend much of each consultation on notes and letters, which gives AI scribes and analytics a clear opening once records are digital. The Therapeutic Goods Administration said in September 2025 that scribes which only transcribe are not medical devices, while tools that suggest diagnoses or treatments need registration, according to GovTech Review. That line gives vendors a lower-risk path to launch note-taking tools first. Global policy points the same way, because the World Health Assembly extended the global digital health strategy of the World Health Organization to 2027 in May 2025, when 129 countries had national digital health strategies. As a result, Analytics and Artificial Intelligence grows fastest at 19.85% a year during 2026–2035.
Is there room in cloud pathology and imaging platforms?
Diagnostic groups need faster systems to handle rising report volumes and the new upload rules, which opens room for cloud laboratory and imaging software. Magentus acquired Melbourne-based Labflow, a cloud pathology software developer whose platforms helped process more than half of NSW COVID-19 PCR tests at the pandemic peak, in December 2025, according to IT Brief Australia. Pro Medicus listed I-MED and Lumus, two of the largest radiology providers in the country, as five-year Visage customers in its February 2026 results presentation. Best Practice Software, which serves more than 6,000 clinics, added HICAPS claiming in June 2025, according to NAB. In turn, hospital care keeps 50.0% of 2025 value as the main buyer of laboratory and imaging systems.
Program cost, AI rules and aged care readiness test buyers
How do long record programs create delivery risk?
Statewide electronic medical record programs run for many years and need large, staged budgets, which can delay later purchases. Tasmania named Epic Systems its preferred supplier within an AUD 476 million transformation in July 2025, but hoped to start building only in May 2026, according to HTN. As a result, vendors wait years between selection and full revenue. Health departments respond with phased go-lives that start in one district and spread statewide in stages.
Why do AI and software rules slow some product launches?
Software that suggests a diagnosis or treatment can count as a medical device, which means it needs registration before sale in Australia. The Therapeutic Goods Administration said it may take targeted action against non-compliant digital scribes and unlawful advertising. In turn, vendors must narrow claims or seek approval, which lengthens sales cycles for analytics tools. Larger vendors respond with regulatory teams, while start-ups often limit early products to transcription.
How do cyber threats raise the cost of shared records?
Each new link between hospitals, laboratories, practices and aged care homes creates another path to patient data. Health service providers made 225 of the 1,205 data breach notifications in 2025, or 19%, more than any other sector, according to the Office of the Australian Information Commissioner. As a result, buyers add penetration testing, monitoring and security reviews to every contract, which slows go-lives. Health services respond by funding cyber defense for hospital networks alongside new systems.
Why does low aged care digital maturity slow adoption?
Many aged care providers still run paper processes or older systems, which makes each upgrade slower and more expensive. Only 55% of aged care providers were registered for My Health Record in February 2026, compared with 99% of general practices. In turn, vendors must fund training and data migration before homes see benefits. Providers respond by choosing integrated suites, such as the clinical and family messaging tools that Whiddon adopted from Telstra Health in February 2026.
NSW and the ACT lead as the statewide record goes live
| Region | Value, 2025 (USD billion) | Share, 2025 | CAGR, 2026–2035 |
|---|---|---|---|
| New South Wales and Australian Capital Territory | 1.36 | 33.7% | 18.49% |
| Victoria and Tasmania | 0.99 | 24.6% | 18.24% |
| Western Australia, South Australia and Northern Territory | 0.92 | 22.7% | 17.69% |
| Queensland | 0.77 | 19.0% | 17.64% |
How does the statewide record rollout shape NSW and the ACT?
New South Wales and Australian Capital Territory held a 33.7% share of 2025 value and grow fastest at 18.49% a year. The Single Digital Patient Record is now live across Hunter New England, with about 23,000 staff at 26 hospitals and 11 laboratories, according to NSW Health. The two jurisdictions had about 9.16 million residents on March 31, 2026. As a result, implementation and support spending stays high until statewide completion in 2028.
How do exchanges and new builds shape Victoria and Tasmania?
Victoria and Tasmania held a 24.6% share of 2025 value and grow at 18.24% a year, because both states are funding new shared systems. Victoria committed AUD 437 million to make its virtual emergency department permanent and lift capacity to more than 1,750 people a day by 2028-29, according to the state government. Tasmania hoped to start building its new Epic record in May 2026. In turn, exchange, virtual care and record work keeps this zone the second largest.

What shapes e-health demand in Queensland?
Queensland held a 19.0% share of 2025 value and grows at 17.64% a year, because much of its hospital record work is already in place. Mackay became the seventh fully digital health service in the state when Clermont Hospital went live on March 18, 2025, according to Mackay Hospital and Health Service. Queensland had about 5.74 million residents on March 31, 2026, many in remote towns. As a result, demand shifts toward rural sites, upgrades and virtual care for outlying communities.
How do WA, SA and the NT differ in record maturity?
Western Australia, South Australia and Northern Territory held a 22.7% share of 2025 value and grow at 17.69% a year. South Australia completed its statewide Sunrise record in April 2025, while Western Australia finished its digital medical record and single sign-on projects in August 2025 and is planning a full record. As a result, Western Australia supplies most new contracts, while vast distances keep virtual care important across the zone.
Record go-lives and aged care software deals, 2025–2026
| Development | Status and market relevance |
|---|---|
| In April 2025, South Australia activated the Sunrise record across almost 100 public hospitals and health sites. | First Australian jurisdiction with one record across all public hospitals |
| In August 2025, Victoria launched CareSync Exchange at Austin Health, giving clinicians access to over 2.3 million records. | Statewide exchange coverage due by 2028 |
| In November 2025, Alcidion expanded its Miya Precision contract with Leidos Australia for Commonwealth work to June 2028. | Extends a local platform into federal government work |
| In December 2025, Magentus acquired Labflow, a Melbourne developer of cloud-native pathology software. | Adds cloud laboratory tools as upload volumes rise |
| In February 2026, Whiddon adopted Telstra Health clinical and family messaging software across 23 aged care homes. | Shows aged care providers renewing care platforms after reform |
Statewide records, exchanges and AI change daily care
- Statewide electronic records replace local hospital, laboratory and administration systems with one patient record, which lets clinicians see orders, results and medicines across every public site in a state.
- Record exchanges and national uploads connect hospitals and laboratories that run different systems, which puts discharge summaries, pathology results and imaging reports in front of the next clinician without faxed letters.
- AI scribes and analytics draft clinical notes and flag patient risk from existing data, which saves clinician time but brings closer review from the medicines regulator when tools suggest diagnoses.
Need a Custom Version of This Report?
Tailor the scope, geography, or segments to your exact requirements.
- Custom geography or segment scope
- Direct access to our analyst team
Global record vendors and local platforms split the field
Competition is split between global record vendors that win statewide hospital programs and Australian software groups that serve practices, laboratories, radiology and aged care. Epic Systems holds the NSW statewide record and is the preferred supplier in Tasmania, while Oracle Health supplies records at Alfred Health and has extended them into cancer care. Alcidion sells its Miya Precision platform into federal government work through Leidos Australia. Magentus and Pro Medicus compete in pathology and imaging software, and Best Practice Software supplies thousands of general practices. Telstra Health serves aged care and medication management, while HotDoc and Healthengine compete for patient bookings. Rivals compete on statewide references, integration with My Health Record, local support and hosting terms, which gives vendors that win one large program an edge in the next tender.
Which companies supply e-health systems in Australia?
| Company | Type | Role in the market |
|---|---|---|
| Telstra Health | Local platform group | Aged care clinical and medication software, adopted by Whiddon in 2026 |
| Oracle Health | Global record vendor | Supplies Alfred Health records, expanded into oncology in 2024 |
| Epic Systems | Global record vendor | NSW statewide record and preferred supplier in Tasmania |
| Magentus | Local software group | Evolution vLab pathology system, acquired Labflow in 2025 |
| Pro Medicus | Local imaging software firm | Visage platform for I-MED and Lumus radiology |
| Alcidion | Local platform group | Miya Precision modules for Commonwealth work via Leidos |
| Best Practice Software | Practice software vendor | GP software for more than 6,000 clinics |
| MedAdvisor | Medicines platform | Agreed in July 2025 to sell its ANZ division to Jonas Software |
| HotDoc | Patient access platform | Bookings and telehealth for 23,000 practitioners |
| Healthengine | Patient access platform | Passed 100 million bookings in November 2025 |
Statewide records and aged care renewal set the pace
Credence Research's view is that the Australia e-health market will grow strongly because every state is rolling out, finishing or planning a single hospital record while federal law makes data sharing the default. Clinical information systems remain the largest value pool, but analytics and artificial intelligence and home and residential care add the fastest growth. Vendors that hold statewide references and integrate cleanly with My Health Record should gain share. Long program timelines, medical device rules for AI and low aged care readiness will slow some purchases.
Model built from upload data and state program records
The report uses 2025 as the base year on a calendar basis, and market values come from the Credence Research model. That model draws on state budget and program releases, national digital health statistics, Department of Health guidance, population data and company releases on contracts, acquisitions and go-lives. Segment splits and zone growth rates are Credence Research estimates, while zone shares follow the client-defined split. Sources used are official statistics, government releases, regulator guidance, trade press and company filings, and no interviews or surveys were used.
State records, aged care and AI carry growth to 2035
The Australia e-health market is expected to reach USD 21.40 billion by 2035, an 18.09% CAGR during 2026–2035, as states finish record programs and sharing by default becomes routine. Growth should be strongest through 2030 while New South Wales, Tasmania and Western Australia build new records and aged care providers finish their software renewal. After that, AI scribes, analytics, home monitoring and patient apps will carry more of the value. Stricter AI rules would slow some launches, while faster upload rules would lift demand for integration software.
Frequently Asked Questions
How big is the Australia e-health market?
Which solution type leads Australian e-health spending?
Which region leads Australian e-health spending?
What does the Sharing by Default Act change for providers?
Why is aged care software being replaced now?
Which care setting is growing fastest?
Who are the leading companies in Australian e-health?
What are the main challenges for e-health buyers?
Table of Content
Chapter 1 Market Segmentation
- 1.1 Segmentation Framework
- 1.1.1 Product and Service Classification
- 1.1.2 Application and End-Use Classification
- 1.1.3 Technology and Solution Classification
- 1.1.4 Customer and Distribution Channel Classification
- 1.1.5 Geographic Segmentation
- 1.1.6 Market Segment Definitions and Boundaries
- 1.2 By Solution Type
- 1.2.1 Clinical Information Systems
- 1.2.2 Connected Care Platforms
- 1.2.3 Medicines and Patient Access Platforms
- 1.2.4 Analytics and Artificial Intelligence
- 1.3 By Care Setting
- 1.3.1 Hospital Care
- 1.3.2 Ambulatory Care
- 1.3.3 Community Care
- 1.3.4 Home and Residential Care
- 1.4 By Customer Type
- 1.4.1 Public Health Authorities
- 1.4.2 Private Care Organisations
- 1.4.3 Health Insurers
- 1.4.4 Individual Consumers
- 1.5 By Sales Channel
- 1.5.1 Public Procurement
- 1.5.2 Direct Enterprise Sales
- 1.5.3 Partner-Led Sales
- 1.5.4 Self-Service Sales
Chapter 2 Introduction
- 2.1 Report Objectives and Scope
- 2.2 Product Definition and Industry Terminology
- 2.3 Market Inclusions and Exclusions
- 2.4 Research Process
- 2.4.1 Primary Research and Expert Interviews
- 2.4.2 Secondary Research and Source Review
- 2.4.3 Top-Down and Bottom-Up Estimation
- 2.4.4 Data Triangulation and Verification
- 2.5 Market Size Measurement Basis
- 2.5.1 2025: USD 4.04 billion → 2035: USD 21.40 billion
- 2.6 Historical and Forecast Reference Periods
- 2.6.1 Historical Period: 2018-2025
- 2.6.2 Base Year: 2025
- 2.6.3 Forecast Period: 2025-2035
- 2.7 Research Assumptions and Limitations
Chapter 3 Executive Summary
- 3.1 Market Snapshot and Key Findings
- 3.2 Base-Year Market Size, 2025
- 3.3 Forecast Market Size, 2035
- 3.4 Revenue and Volume Growth Outlook
- 3.5 Key Demand and Supply Indicators
- 3.6 Leading Market Segments
- 3.7 Fastest-Growing Market Opportunities
- 3.8 Regional Performance Highlights
- 3.9 Technology and Industry Transformation
- 3.10 Competitive Landscape Summary
- 3.11 Analyst View and Strategic Implications
Chapter 4 Australia E-Health Market Trends and Developments
- 4.1 Historical Industry Development, 2018-2025
- 4.2 Recent Market Trends and Developments
- 4.3 Demand and Customer Behavior Trends
- 4.4 Technology and Product Innovation
- 4.5 Artificial Intelligence, Automation and Digitalization
- 4.6 Local Manufacturing and Supply Chain Realignment
- 4.7 Industry Partnerships, Mergers and Acquisitions
- 4.8 Sustainability and Circular Economy Developments
- 4.9 Government and Private Sector Investment Trends
- 4.10 Emerging Business Models and Commercialization
- 4.11 Industry Developments and Announcements
Chapter 5 Australia E-Health Market Production, Supply and Demand Analysis
- 5.1 Demand Trend and Consumption Analysis, 2018-2025
- 5.2 Demand Forecast, 2025-2035
- 5.3 Production and Output Trend, 2018-2025
- 5.4 Production and Output Forecast, 2025-2035
- 5.5 Installed Capacity and Capacity Utilization
- 5.6 Company-Wise Production Plants and Statistics
- 5.6.1 Installed Production Capacity
- 5.6.2 Actual Production
- 5.6.3 Planned Capacity and Expansion Targets
- 5.7 Supply Chain Structure and Procurement Trends
- 5.8 Supply-Demand Gap and Bottlenecks
- 5.9 Import Dependence and Sourcing Structure
- 5.10 Contract Manufacturing and Outsourcing
- 5.11 Regional Supply and Demand Concentration
Chapter 6 Australia E-Health Market Pricing Analysis
- 6.1 Pricing Structure and Measurement
- 6.2 Historical Pricing Trends, 2018-2025
- 6.3 Pricing Outlook, 2025-2035
- 6.4 Average Selling Price and Unit Economics
- 6.5 Pricing by Product and Market Segment
- 6.6 Geographic Pricing Differences
- 6.7 Key Input, Energy, Labor and Logistics Costs
- 6.8 Contract Pricing and Purchasing Models
- 6.9 Pricing Sensitivity and Competitive Positioning
- 6.10 Price, Margin and Profitability Implications
Chapter 7 Australia E-Health Market Dynamics
- 7.1 Market Growth Drivers
- 7.1.1 Demand-Side Drivers
- 7.1.2 Technology and Innovation Drivers
- 7.1.3 Infrastructure and Investment Drivers
- 7.1.4 Regulatory and Policy Drivers
- 7.2 Market Restraints
- 7.2.1 Cost and Affordability Constraints
- 7.2.2 Technology and Adoption Barriers
- 7.2.3 Supply Chain and Operational Constraints
- 7.3 Market Challenges
- 7.3.1 Competitive Pressure and Margin Erosion
- 7.3.2 Skills, Infrastructure and Implementation Gaps
- 7.4 Emerging Market Opportunities
- 7.5 Market Dynamics Impact and Time-Horizon Assessment
Chapter 8 Australia E-Health Value Chain Analysis
- 8.1 Industry Value Chain Overview
- 8.2 Upstream Suppliers and Critical Inputs
- 8.3 Technology and Component Providers
- 8.4 Manufacturing or Service Delivery
- 8.5 Distribution, Channel Partners and Integrators
- 8.6 Downstream Applications and End Users
- 8.7 Value Addition and Profit Pools
- 8.8 Vertical Integration and Outsourcing
- 8.9 Supplier Concentration and Risk
- 8.10 Supply Chain Localization and Resilience
Chapter 9 Australia E-Health Market Regulations and Policies
- 9.1 Relevant Laws, Standards and Compliance Frameworks
- 9.2 Product, Service, Safety and Quality Requirements
- 9.3 Government Policies, Incentives and Subsidies
- 9.4 Imports, Exports and Trade Barriers
- 9.5 Public Procurement and Local Content Requirements
- 9.6 Environmental and Sustainability Compliance
- 9.7 Upcoming Policy Changes and Market Implications
Chapter 10 Australia E-Health Market Hotspots and Opportunities
- 10.1 Market Opportunity Mapping and Growth Hotspots
- 10.2 High-Growth Applications and Customer Groups
- 10.3 Underserved Markets and White-Space Opportunities
- 10.4 Emerging Technology and Product Opportunities
- 10.5 New Capacity and Investment Hotspots
- 10.6 Market Entry and Expansion Opportunities
- 10.7 Distribution and Partnership Opportunities
- 10.8 Near-Term and Long-Term Commercial Potential
- 10.9 Opportunity Attractiveness and Execution Risks
Chapter 11 Australia E-Health Market Outlook, 2025-2035
- 11.1 Market Size and Analysis
- 11.1.1 Revenue (Market Measurement: 2025: USD 4.04 billion → 2035: USD 21.40 billion)
- 11.1.2 Market Volume and Quantity Sold
- 11.1.3 Historical Market Size, 2018-2025
- 11.1.4 Base-Year Market Size, 2025
- 11.2 Market Forecast, 2025-2035
- 11.2.1 Revenue Forecast to 2035
- 11.2.2 Volume Forecast to 2035
- 11.2.3 CAGR and Year-on-Year Growth
- 11.2.4 Incremental Revenue Opportunity
- 11.3 Forecast Assumptions and Scenario Analysis
- 11.3.1 Base-Case Forecast
- 11.3.2 Optimistic and Conservative Scenarios
- 11.3.3 Technology, Pricing and Policy Sensitivities
- 11.4 Market Attractiveness and Growth Outlook
Chapter 12 Australia E-Health Market Segmentation and Outlook
- 12.1 Segmentation Summary and Market Shares, 2025
- 12.2 Largest and Fastest-Growing Segments
- 12.3 By Solution Type - Market Size and Forecast, 2025-2035
- 12.3.1 Segment Definition and Scope
- 12.3.2 Historical Market Size, 2018-2025
- 12.3.3 Revenue Forecast, 2025-2035
- 12.3.4 Volume Forecast, 2025-2035
- 12.3.5 Base-Year Market Share, 2025
- 12.3.6 Segment CAGR and Growth Drivers
- 12.3.7 Subsegment Market Size and Forecast
- 12.3.7.1 Clinical Information Systems
- 12.3.7.2 Connected Care Platforms
- 12.3.7.3 Medicines and Patient Access Platforms
- 12.3.7.4 Analytics and Artificial Intelligence
- 12.3.8 Subsegment Pricing and Adoption Trends
- 12.3.9 Leading Suppliers and Competition
- 12.3.10 Regional Demand and Opportunities
- 12.4 By Care Setting - Market Size and Forecast, 2025-2035
- 12.4.1 Segment Definition and Scope
- 12.4.2 Historical Market Size, 2018-2025
- 12.4.3 Revenue Forecast, 2025-2035
- 12.4.4 Volume Forecast, 2025-2035
- 12.4.5 Base-Year Market Share, 2025
- 12.4.6 Segment CAGR and Growth Drivers
- 12.4.7 Subsegment Market Size and Forecast
- 12.4.7.1 Hospital Care
- 12.4.7.2 Ambulatory Care
- 12.4.7.3 Community Care
- 12.4.7.4 Home and Residential Care
- 12.4.8 Subsegment Pricing and Adoption Trends
- 12.4.9 Leading Suppliers and Competition
- 12.4.10 Regional Demand and Opportunities
- 12.5 By Customer Type - Market Size and Forecast, 2025-2035
- 12.5.1 Segment Definition and Scope
- 12.5.2 Historical Market Size, 2018-2025
- 12.5.3 Revenue Forecast, 2025-2035
- 12.5.4 Volume Forecast, 2025-2035
- 12.5.5 Base-Year Market Share, 2025
- 12.5.6 Segment CAGR and Growth Drivers
- 12.5.7 Subsegment Market Size and Forecast
- 12.5.7.1 Public Health Authorities
- 12.5.7.2 Private Care Organisations
- 12.5.7.3 Health Insurers
- 12.5.7.4 Individual Consumers
- 12.5.8 Subsegment Pricing and Adoption Trends
- 12.5.9 Leading Suppliers and Competition
- 12.5.10 Regional Demand and Opportunities
- 12.6 By Sales Channel - Market Size and Forecast, 2025-2035
- 12.6.1 Segment Definition and Scope
- 12.6.2 Historical Market Size, 2018-2025
- 12.6.3 Revenue Forecast, 2025-2035
- 12.6.4 Volume Forecast, 2025-2035
- 12.6.5 Base-Year Market Share, 2025
- 12.6.6 Segment CAGR and Growth Drivers
- 12.6.7 Subsegment Market Size and Forecast
- 12.6.7.1 Public Procurement
- 12.6.7.2 Direct Enterprise Sales
- 12.6.7.3 Partner-Led Sales
- 12.6.7.4 Self-Service Sales
- 12.6.8 Subsegment Pricing and Adoption Trends
- 12.6.9 Leading Suppliers and Competition
- 12.6.10 Regional Demand and Opportunities
- 12.7 Segment Growth Comparison
- 12.8 Segment Attractiveness and Priority Matrix
Chapter 13 Australia E-Health End-Use and Application Market Outlook
- 13.1 End-Use Industry and Customer Demand Structure
- 13.2 Leading Applications and Customer Groups
- 13.3 End-Use Market Size, Share and Forecast
- 13.4 Major End-Use Industry Deep Dives
- 13.4.1 Customer Requirements and Use Cases
- 13.4.2 Demand and Replacement Cycles
- 13.4.3 Technical and Regulatory Considerations
- 13.4.4 Purchasing and Procurement Models
- 13.4.5 Leading Vendors and Distribution Channels
- 13.4.6 Forecast and Commercial Opportunities
- 13.5 Emerging Applications and Cross-Segment Demand
- 13.6 End-Use Industry Investment Priorities
Chapter 14 Australia E-Health Geographic Market Outlook, 2025-2035
- 14.1 Domestic Market Distribution and Demand Clusters
- 14.2 State- or Province-Wise Market Size and Forecast, 2025-2035
- 14.3 City and Metropolitan Market Outlook
- 14.4 Industrial, Manufacturing and Commercial Clusters
- 14.5 Geographic Concentration of Key End Users
- 14.6 Local Pricing and Purchasing Differences
- 14.7 Domestic Production Facilities and Capacity Map
- 14.8 Local Infrastructure and Project Pipeline
- 14.9 State-Level Policy and Incentive Differences
- 14.10 Subnational Investment Hotspots and Opportunities
- 14.11 Distribution and Logistics Networks
- 14.12 Domestic Competitive Footprint
Chapter 15 Australia E-Health Technology, Innovation and Sustainability Outlook
- 15.1 Technology Landscape and Maturity
- 15.2 Product, Process and Service Innovation
- 15.3 AI, Automation and Digital Tools in the Industry
- 15.4 Technology Adoption and Performance Benchmarking
- 15.5 Innovation Pipeline and R&D Investment
- 15.6 Patent and Intellectual Property Trends
- 15.7 Energy Efficiency and Resource Management
- 15.8 Sustainability, Recycling and Circularity
- 15.9 Technology Roadmap, 2025-2035
- 15.10 Risks of Obsolescence and Technology Substitution
Chapter 16 Australia E-Health Market Key Strategic Imperatives
- 16.1 Growth and Market Entry Priorities
- 16.2 High-Return Products and Segments
- 16.3 Pricing, Profitability and Cost Optimization
- 16.4 Technology Investment and Product Differentiation
- 16.5 Supply Chain Localization and Resilience
- 16.6 Distribution and Customer Acquisition
- 16.7 Partnership, Acquisition and Capacity Strategy
- 16.8 Regional Expansion Priorities
- 16.9 Short-, Medium- and Long-Term Actions
Chapter 17 Competition Outlook
- 17.1 Industry Competition Characteristics
- 17.2 Market Structure and Concentration
- 17.3 Market Share and Competitive Positioning, 2025
- 17.4 Company-Wise Revenue and Product Benchmarking
- 17.5 Production and Service Capacity Benchmarking
- 17.6 Technology, Pricing and Differentiation
- 17.7 Regional Footprint and Distribution Strength
- 17.8 Mergers, Acquisitions and Strategic Alliances
- 17.9 New Entrants and Competitive Threats
- 17.10 Porter's Five Forces and Industry Attractiveness
- 17.11 Competitive Outlook, 2025-2035
Chapter 18 Company Profiles
- 18.1 Company Coverage and Selection Criteria
- 18.2 Telstra Health
- 18.2.1 Business Description
- 18.2.2 Company Ownership and Geographic Presence
- 18.2.3 Product and Service Portfolio
- 18.2.4 Manufacturing and Operating Footprint
- 18.2.5 Production Capacity and Expansion Plans
- 18.2.6 Financial Performance and Investment
- 18.2.7 Market Share and Competitive Position
- 18.2.8 Technology and Innovation Capabilities
- 18.2.9 Strategic Alliances or Partnerships
- 18.2.10 Recent Developments
- 18.2.11 Growth Strategy and Outlook
- 18.3 Oracle Health
- 18.4 Epic Systems
- 18.5 Magentus
- 18.6 Pro Medicus
- 18.7 Alcidion
- 18.8 Best Practice Software
- 18.9 MedAdvisor
- 18.10 HotDoc
- 18.11 Healthengine
- 18.12 Other Relevant Market Participants
Note: Every listed company is profiled on the structure shown under the first company. The company list is preliminary and may change based on research findings, market developments, data availability and client requirements.
Chapter 19 Disclaimer
- 19.1 Research and Forecast Disclaimer
- 19.2 Data Source and Estimation Limitations
Note: The depth of individual sections depends on data availability for this market. Volume, capacity, trade and other unit-based metrics are included where applicable.

