
Psychosocial safety duties reshape employer health spending
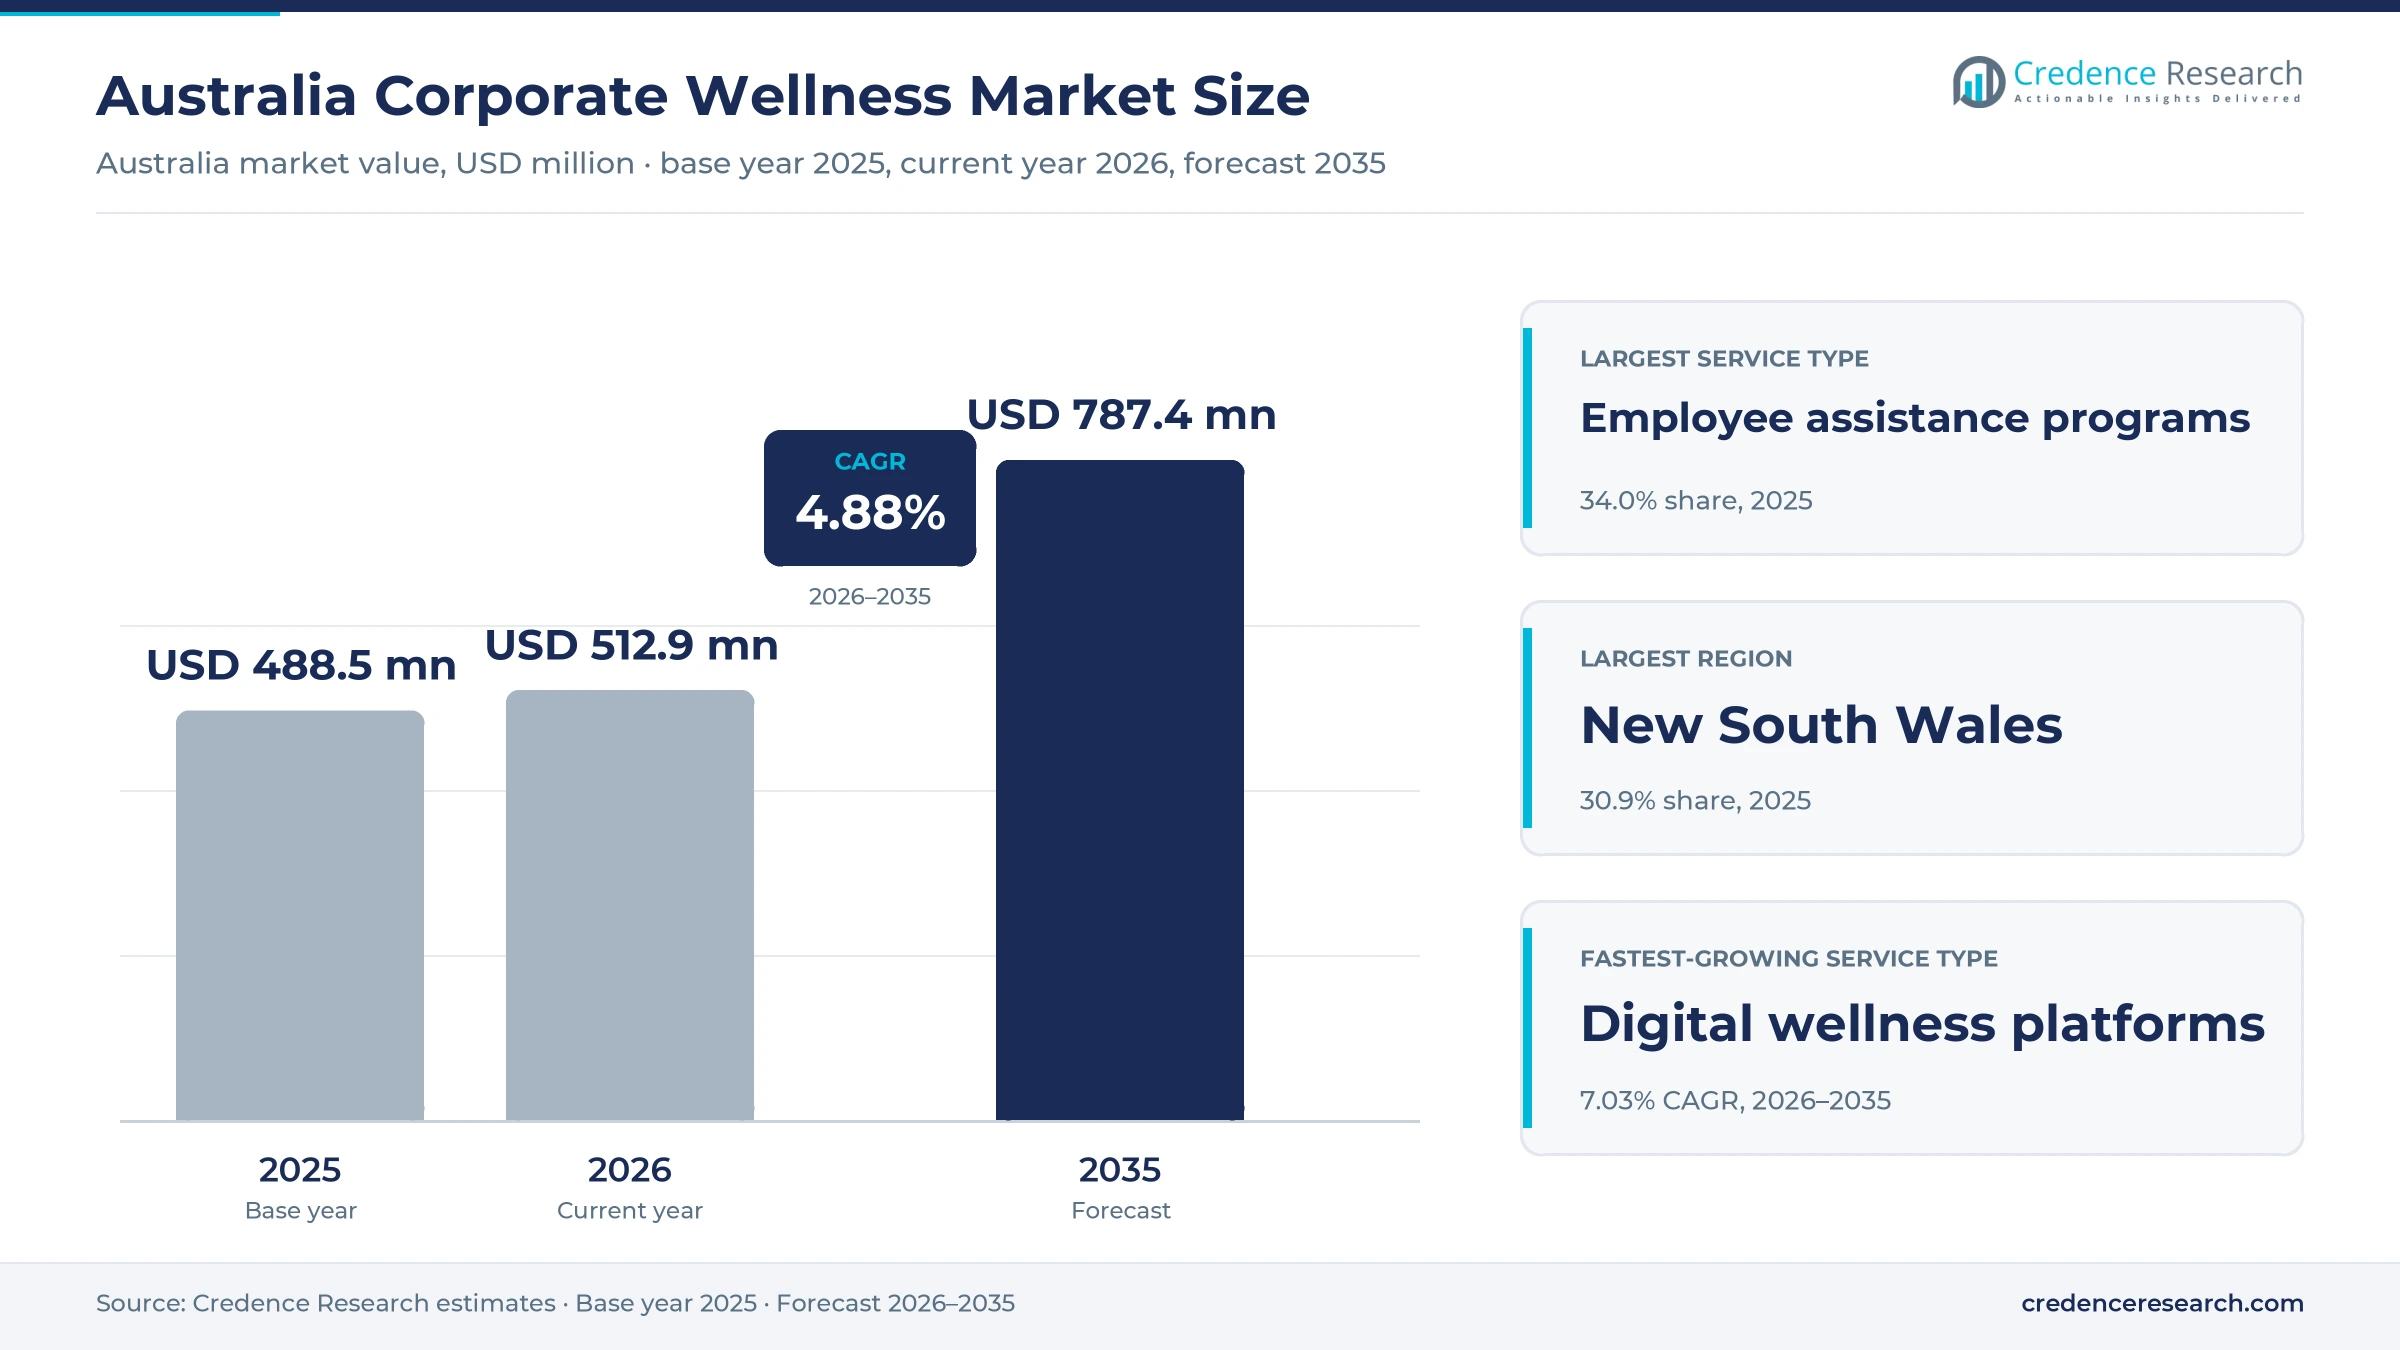
The Australia corporate wellness market was valued at USD 488.5 million in 2025 and is projected to increase from USD 512.9 million in 2026 to USD 787.4 million by 2035, registering a CAGR of 4.88% during 2026–2035. Demand comes from employers that now must identify and control psychosocial hazards in the same way as physical risks, and from rising psychological injury claims that keep staff off work for months. New South Wales held the largest regional share, 30.9% in 2025, because Sydney hosts the largest concentration of head offices, financial firms and public agencies that buy assistance programs at scale. Victoria is the fastest-growing region at 5.24% a year, as its psychological health regulations took effect for every employer at the end of 2025. At the same time, providers are moving counseling, coaching and risk reporting into apps and chat services, which lets employers reach shift, remote and regional workers at a lower cost per contact.
Which employer-funded health services are counted?
The estimate measures the value of health and wellbeing services that Australian employers buy for their workforce, including employee assistance programs, preventive health checks and lifestyle programs, standalone mental health programs, occupational health and rehabilitation services, and digital wellness platforms. It covers services delivered on site, remotely or in hybrid form under direct, intermediary or insurer-referred contracts.
The estimate excludes private health insurance premiums, workers compensation benefit payments, gym memberships that employees buy themselves and general practice care billed to Medicare. The value chain runs from psychologists, nurses and allied health clinicians through national providers and platforms to employers, which often buy through brokers, benefits advisers and insurers that bundle services.
Australia Corporate Wellness Market Insights
- The Australia corporate wellness market was valued at USD 488.5 million in 2025 and is projected to reach USD 787.4 million by 2035, registering a CAGR of 4.88% during 2026–2035.
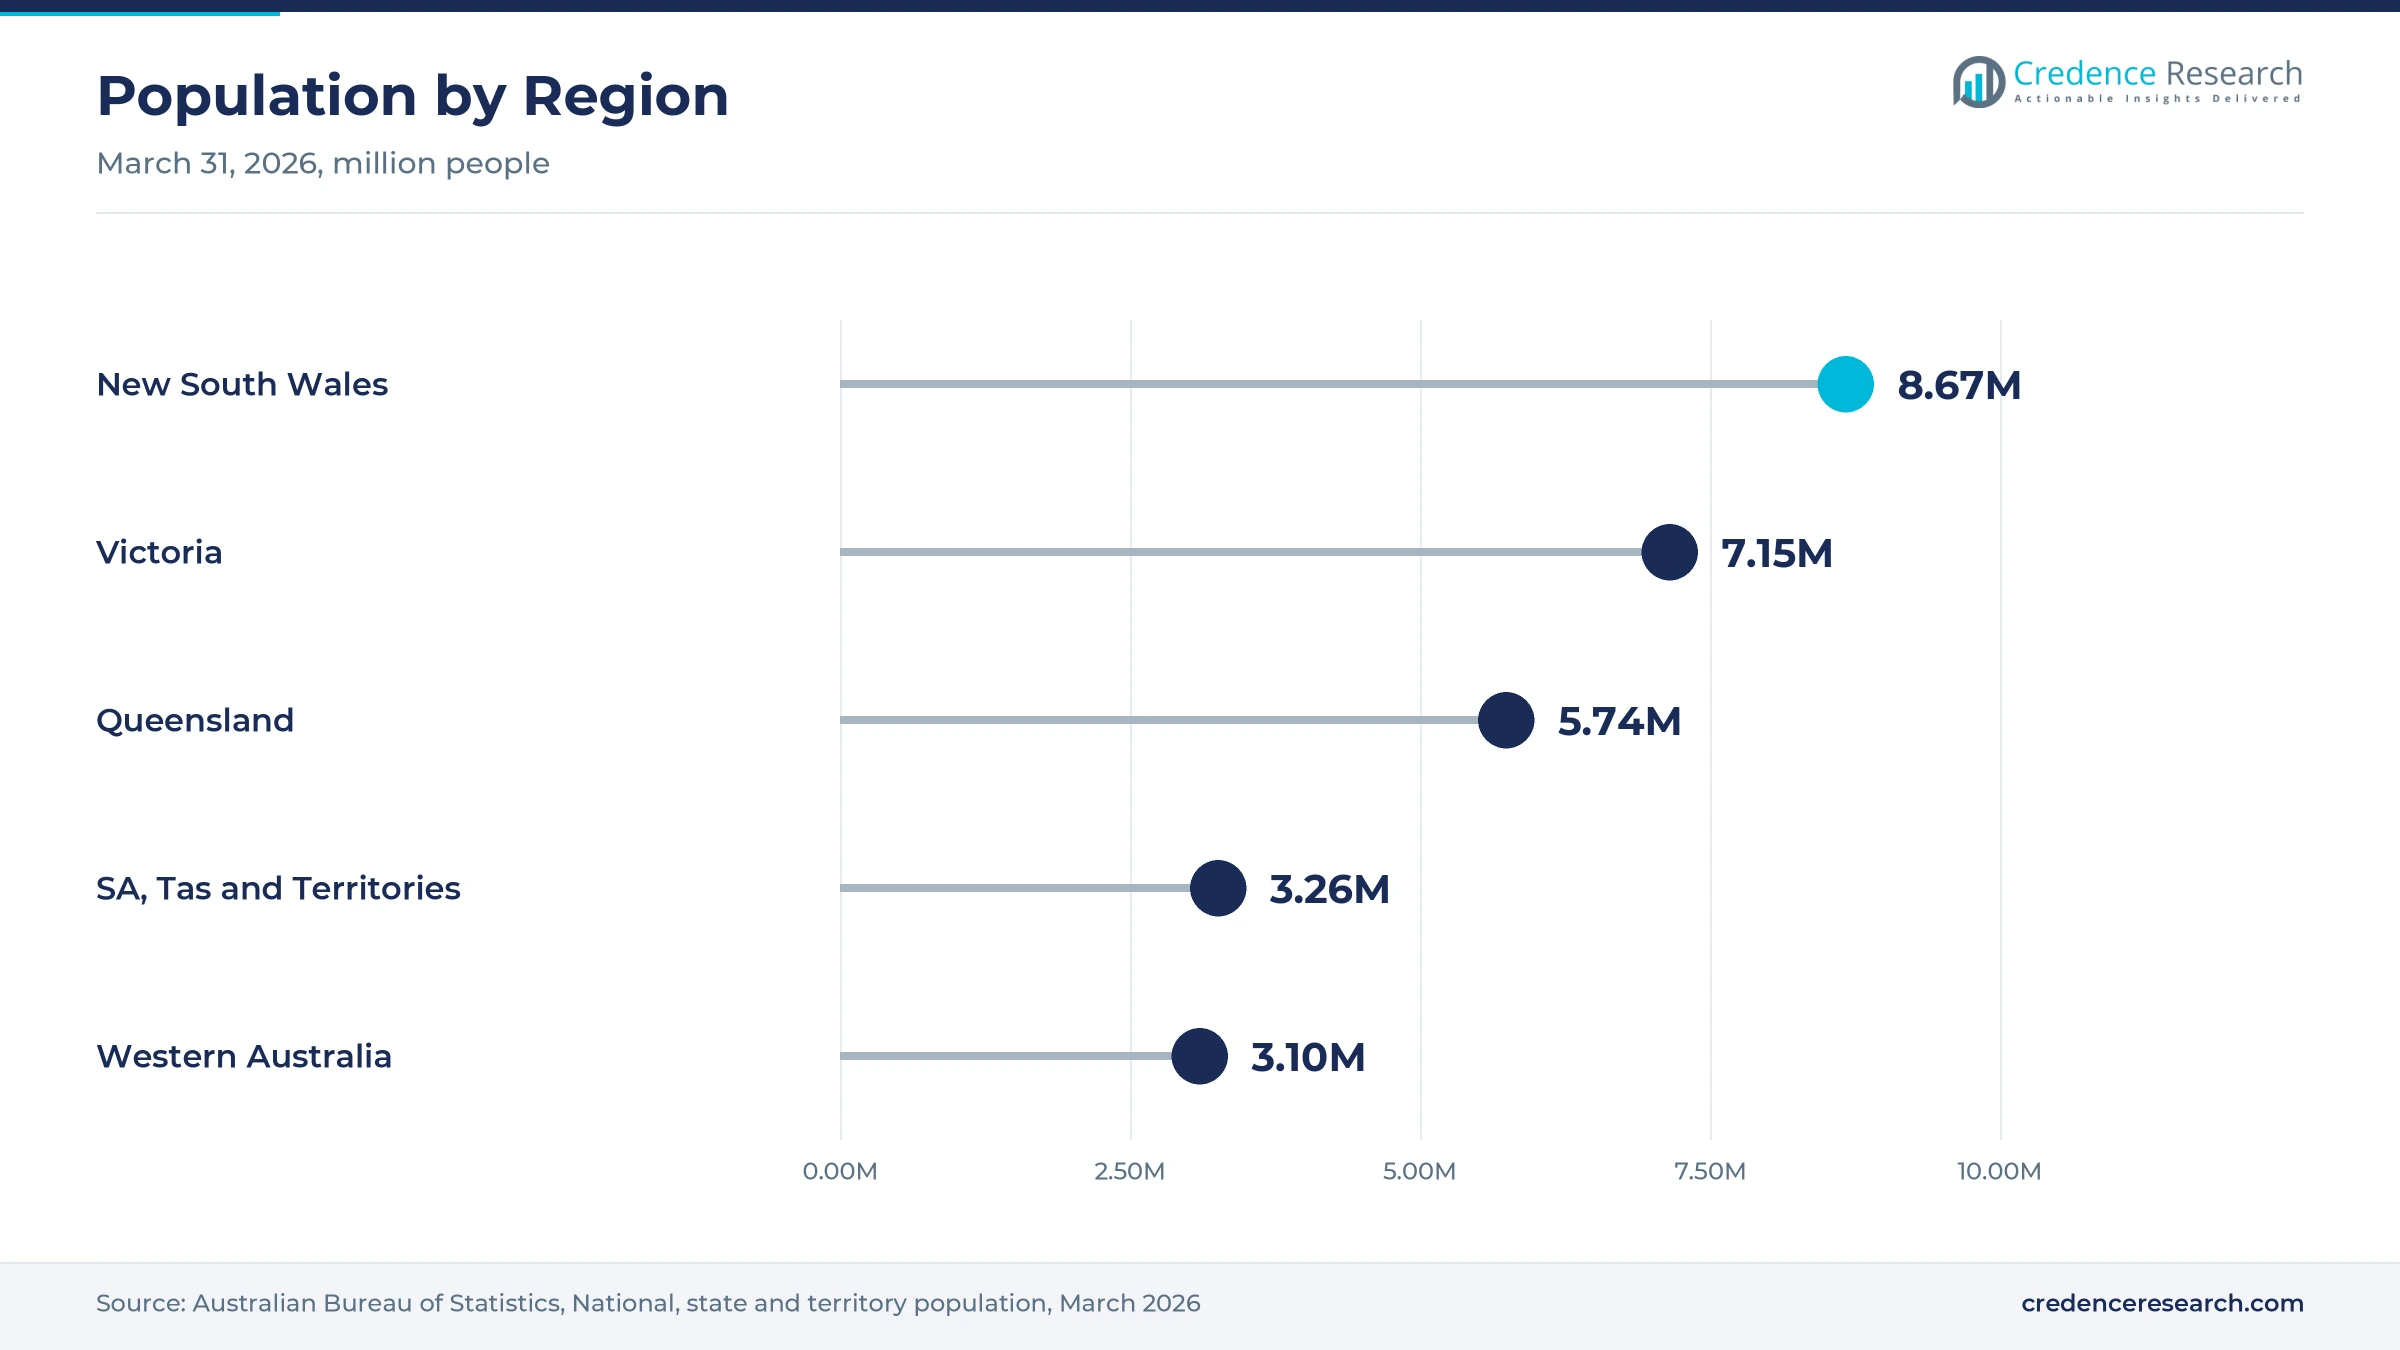
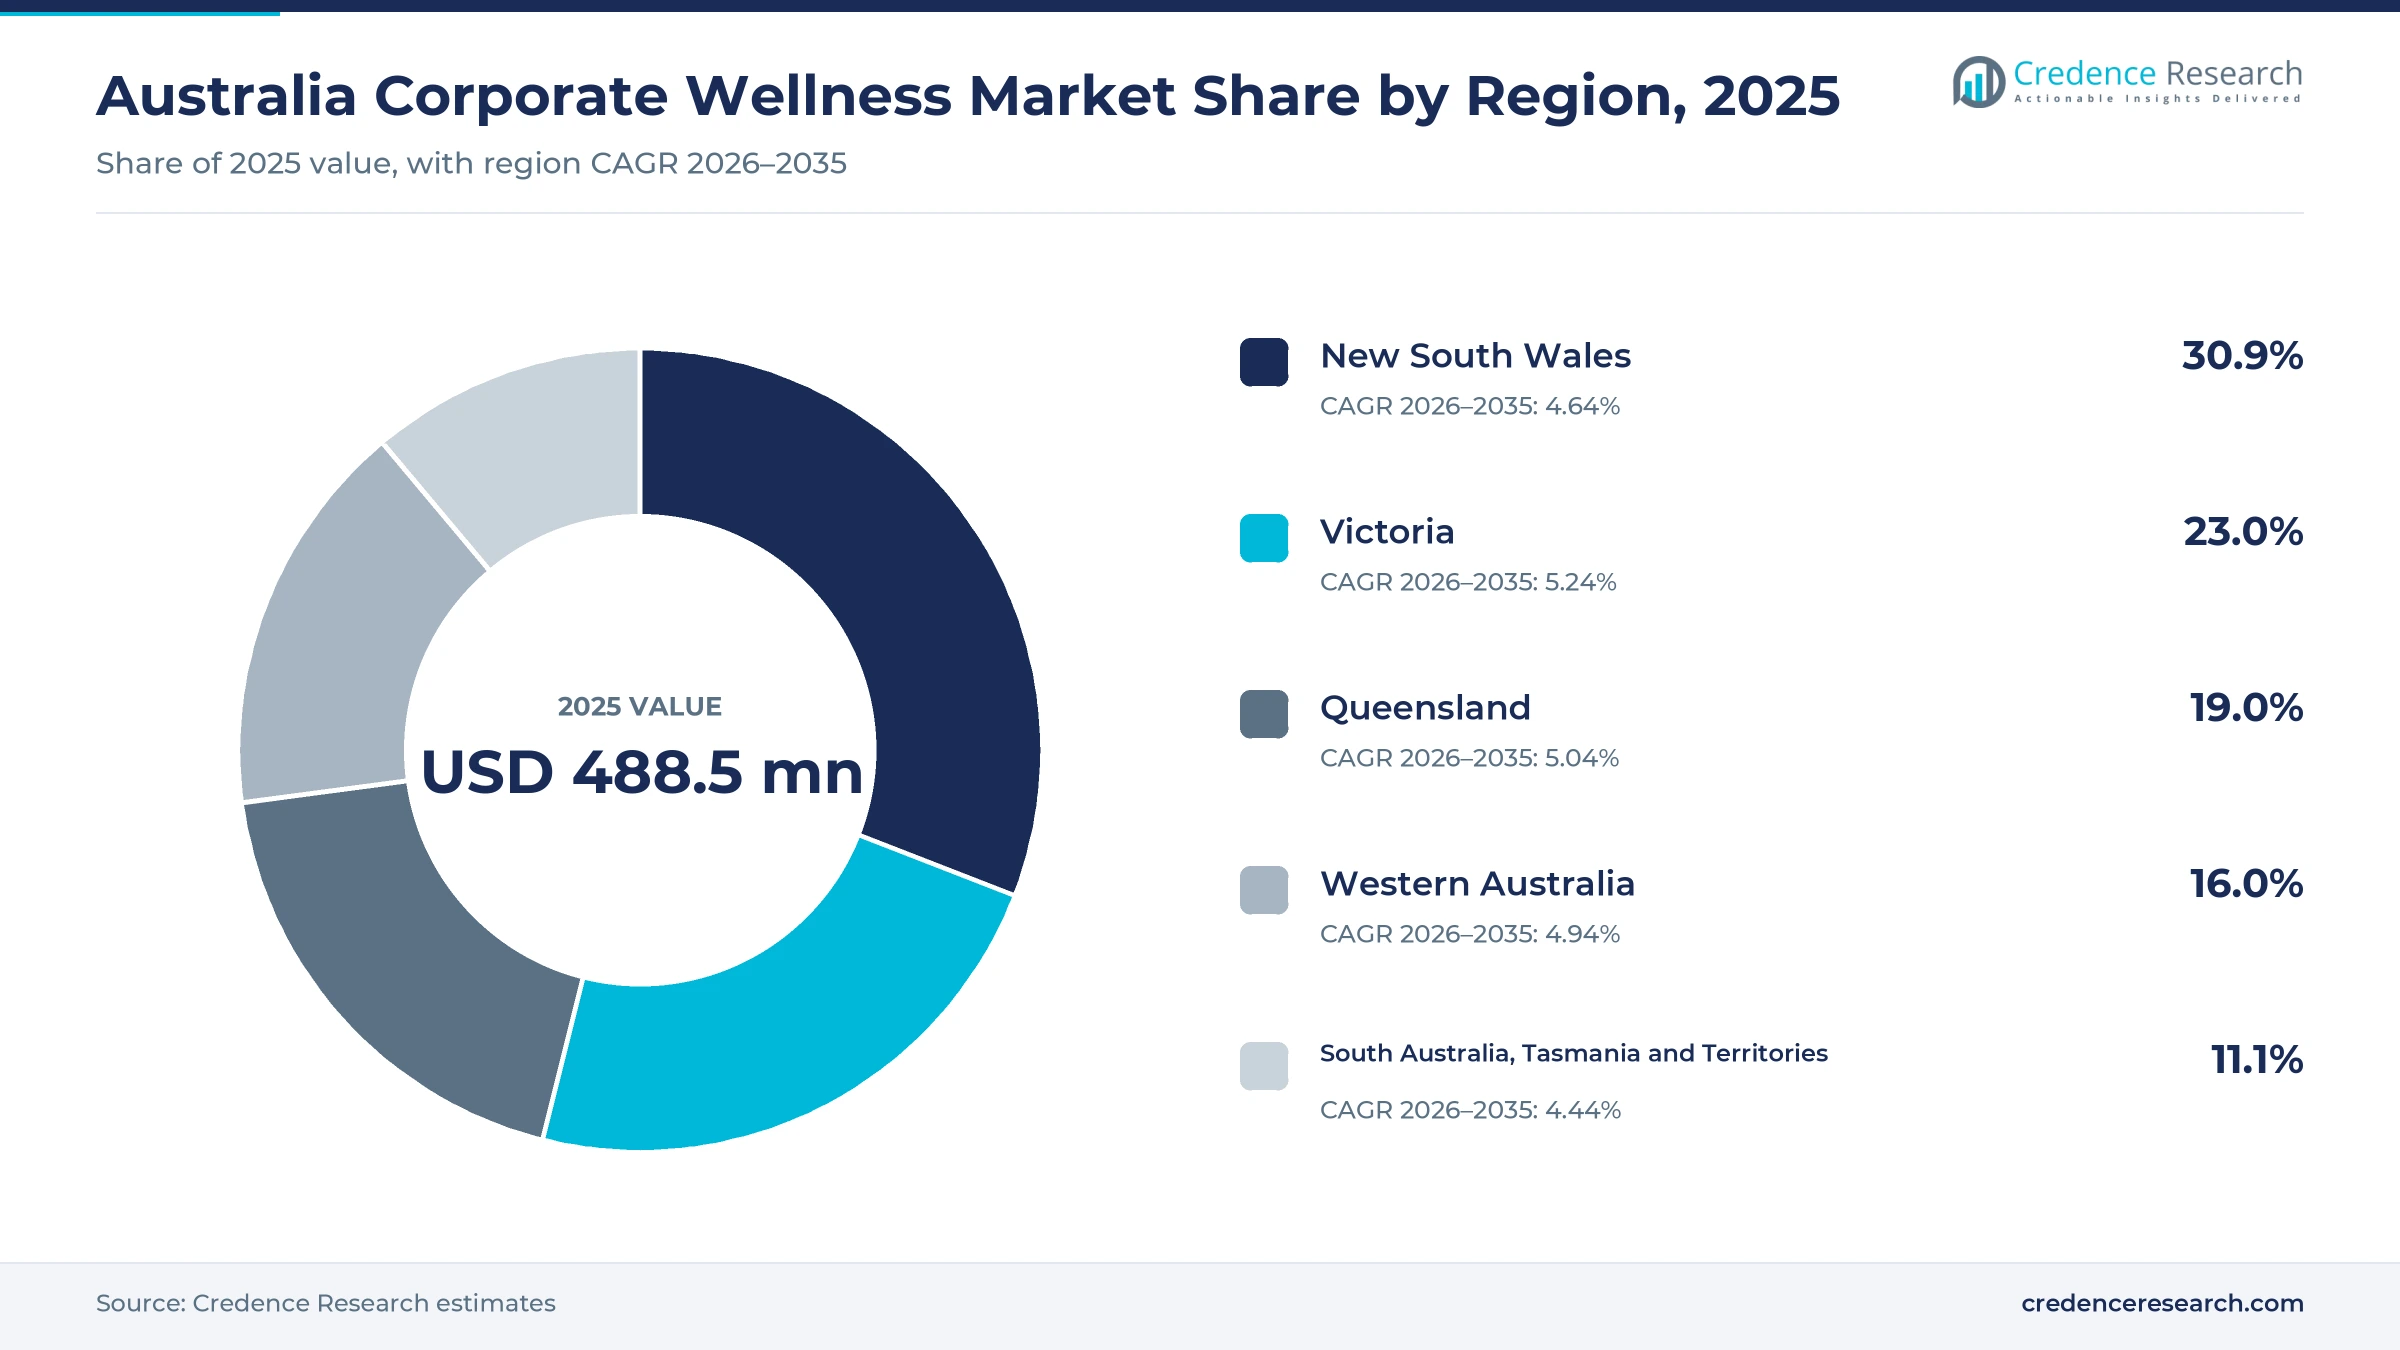
- New South Wales held a 30.9% share of 2025 value, because the state had 8.67 million residents at March 2026 and the largest base of large employers.
- Employee assistance programs led with a 34.0% share of 2025 value, as most large employers hold multi-year counseling and critical incident contracts.
- Mental health conditions made up 12.0% of serious workers compensation claims in 2023-24, which pushes employers toward earlier psychological support and prevention.
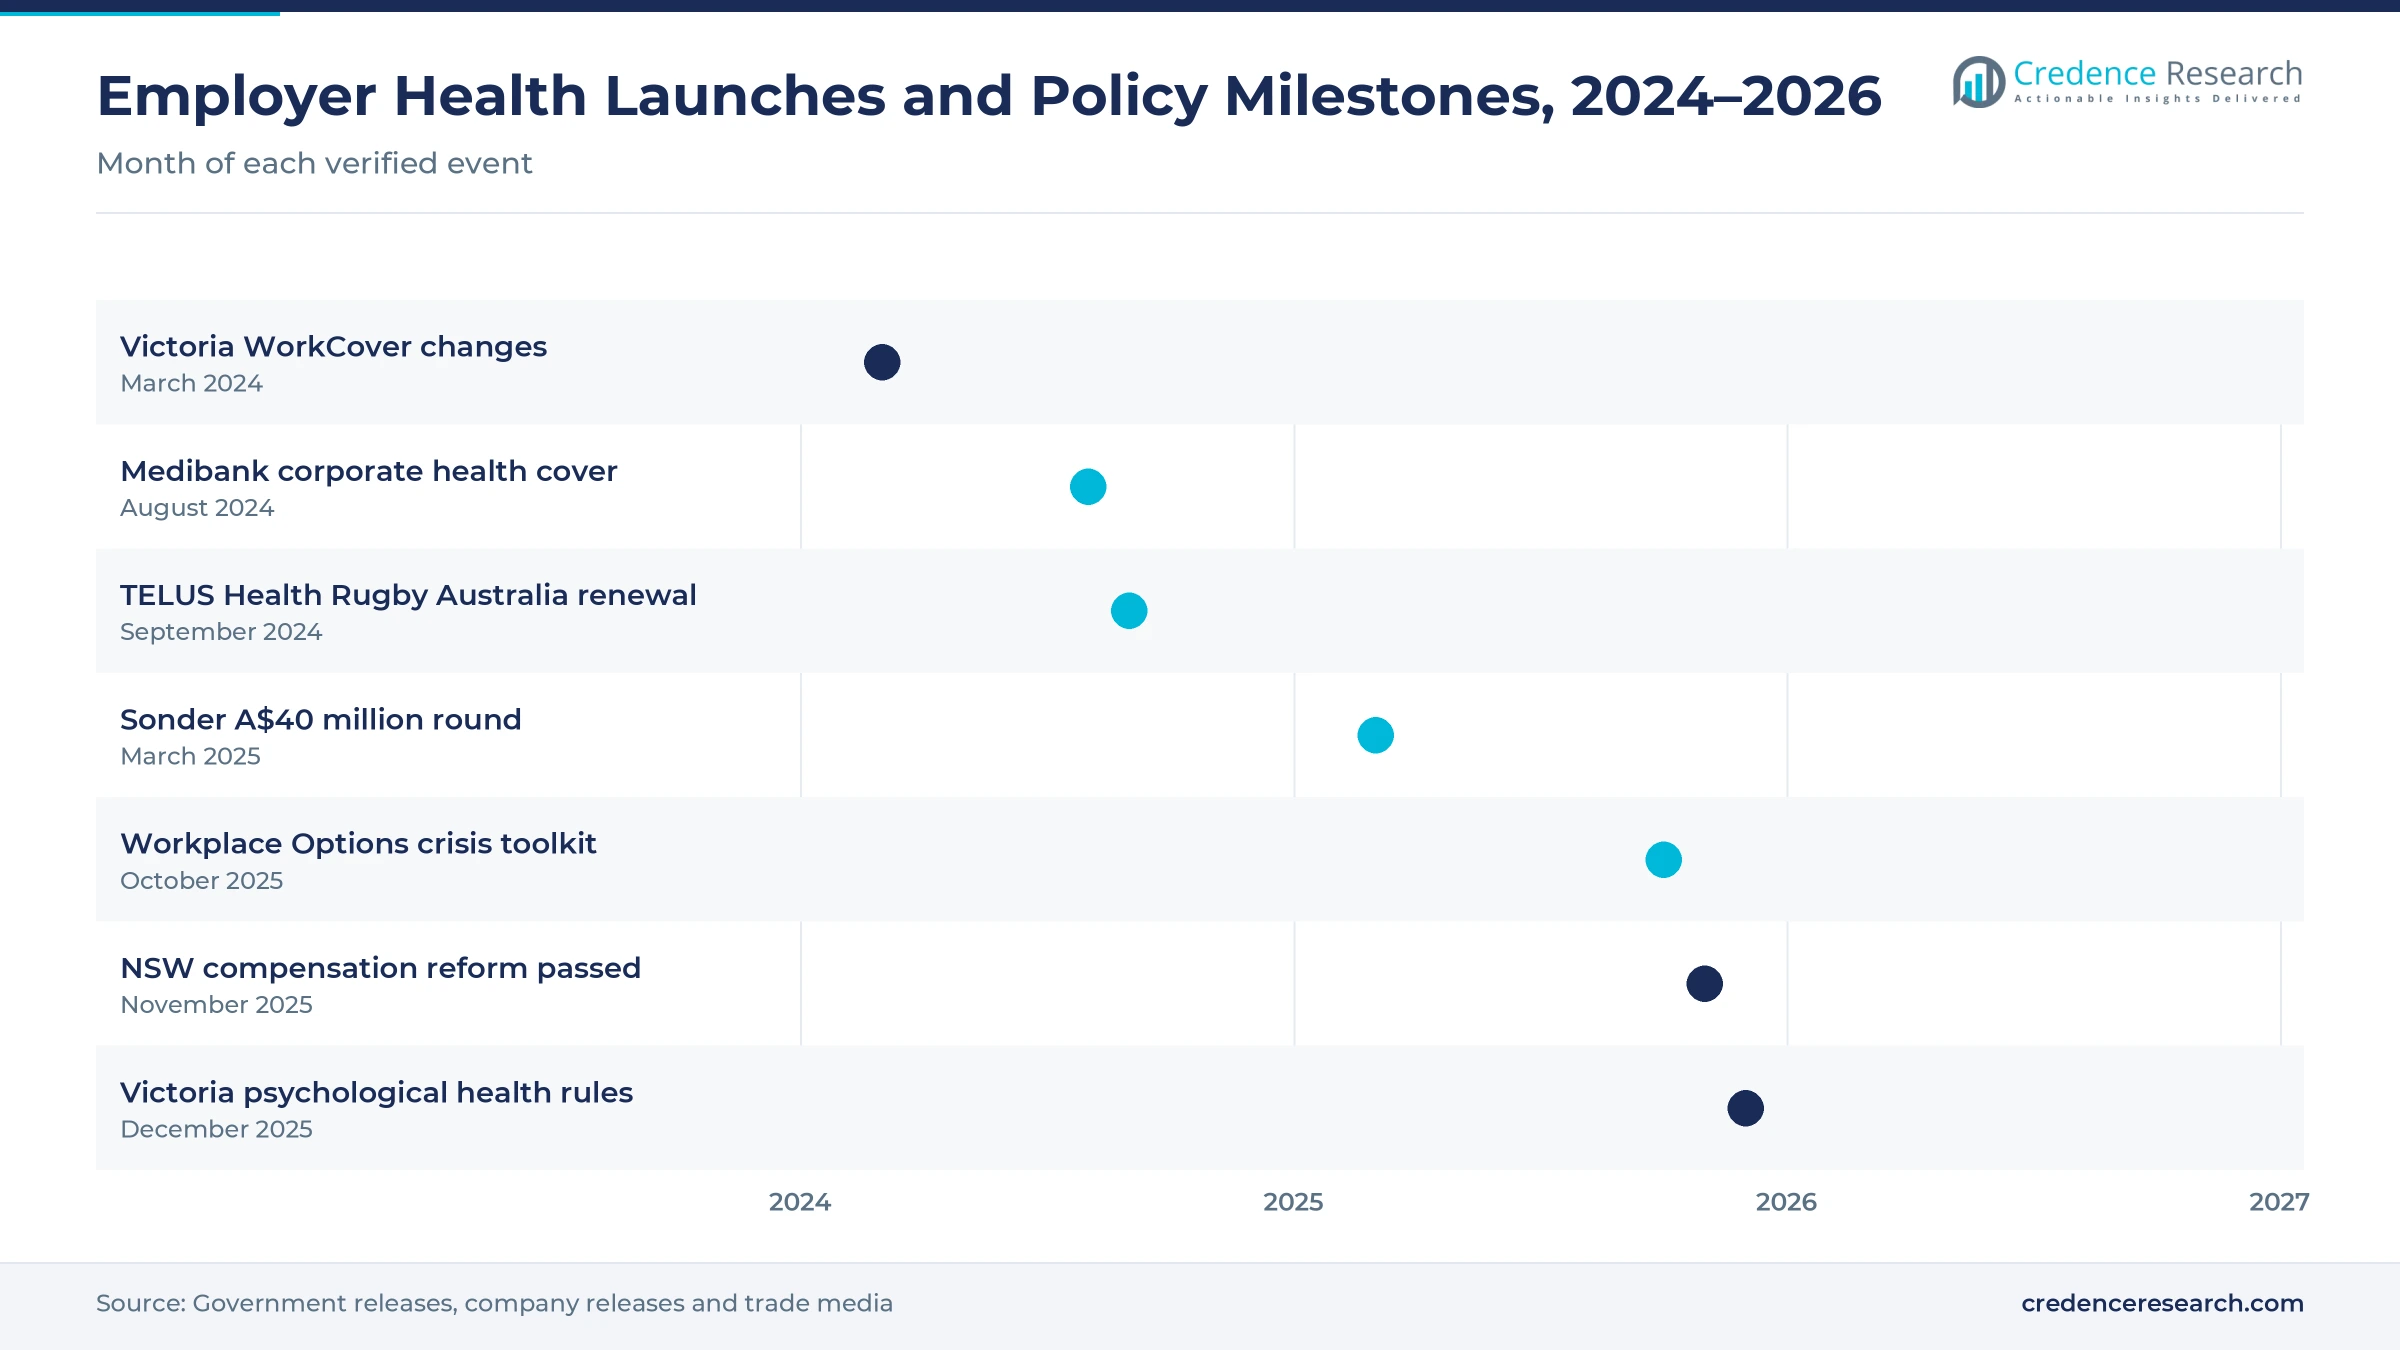
- Sonder raised a further A$40 million in March 2025, while TELUS Health, Medibank and Altius Group widen bundled mental, physical and rehabilitation offers for employers.
Assistance programs lead as digital platforms grow fastest
Why do employee assistance programs hold the largest value?
Based on service type, the market is categorized into employee assistance programs, preventive health and lifestyle services, standalone mental health programs, occupational health and rehabilitation, and digital wellness platforms. Employee Assistance Programs led with a 34.0% share of 2025 value, because most large employers fund confidential counseling and critical incident response. Digital Wellness Platforms grow fastest at 7.03% a year, as chat and app access reaches more staff.
How do large employers anchor contract value?
Based on customer type, the market is categorized into large employers with 200 or more employees, medium employers with 20-199 employees, and small employers with 1-19 employees. Large Employers with 200 or More Employees led with 58.0% of 2025 value, because only 5,366 businesses had 200 or more staff in June 2026, yet they buy the broadest programs. Small Employers with 1-19 Employees grow fastest at 5.74% a year, as low-cost digital plans reach owners.
Why does on-site delivery still lead spending?
Based on delivery model, the market is categorized into on-site delivery, remote delivery and hybrid delivery. On-Site Delivery led with 36.0% of 2025 value, because health checks, flu vaccinations, ergonomic assessments and trauma response need clinicians in the workplace. Remote Delivery grows fastest at 5.43% a year, as employees choose video, phone and chat counseling for routine support.
How do direct contracts keep the channel lead?
Based on sales channel, the market is categorized into direct employer contracts, benefits intermediary contracts and insurer-referred service contracts. Direct Employer Contracts led with 55.0% of 2025 value, because large employers and government agencies tender their own programs. Benefits Intermediary Contracts grow fastest at 5.28% a year, as brokers and benefits advisers bundle wellbeing services for mid-sized firms.
| Segment Group | Leading Sub-segment | Share, 2025 | Fastest-growing Sub-segment | CAGR, 2026–2035 |
|---|---|---|---|---|
| By Service Type | Employee Assistance Programs | 34.0% | Digital Wellness Platforms | 7.03% |
| By Customer Type | Large Employers with 200 or More Employees | 58.0% | Small Employers with 1-19 Employees | 5.74% |
| By Delivery Model | On-Site Delivery | 36.0% | Remote Delivery | 5.43% |
| By Sales Channel | Direct Employer Contracts | 55.0% | Benefits Intermediary Contracts | 5.28% |
Request a Free Sample
Fill in your details and we'll send you a free sample report.
- Sample data tables & charts
- Research methodology
Safety law, injury costs and digital access lift demand
How do psychosocial risk duties turn programs into compliance?
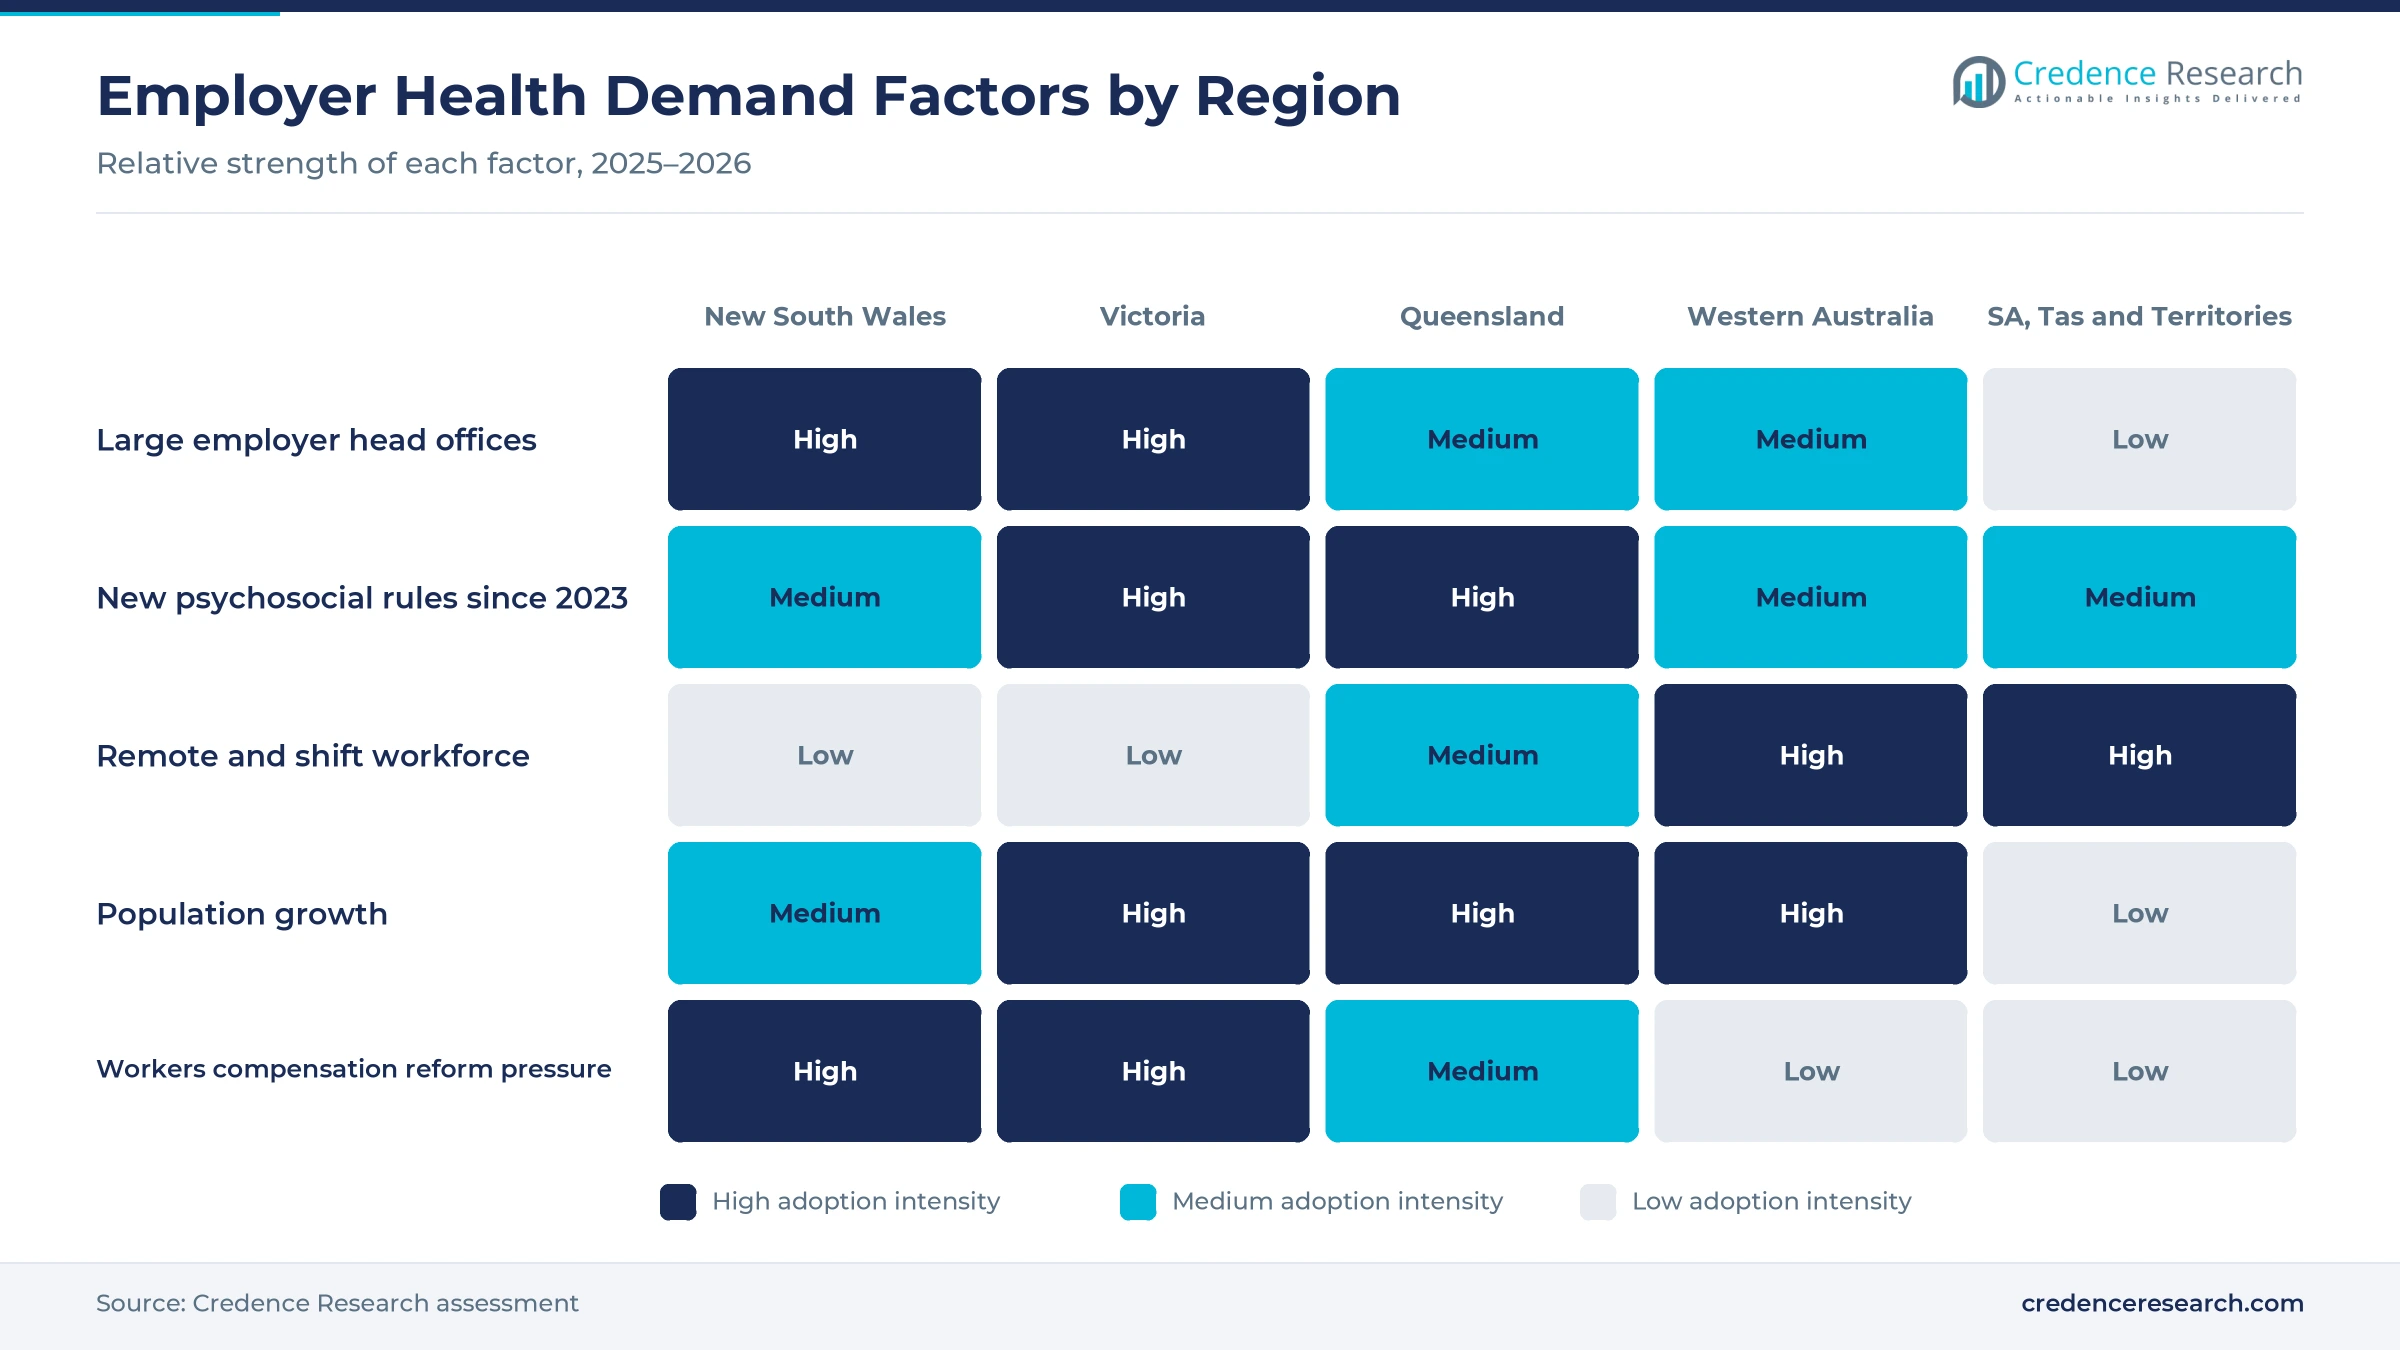
Psychosocial hazard rules have turned employer health programs from optional benefits into part of legal risk management, which lifts demand for assessment, training and support services. Queensland made its psychosocial hazards Code of Practice enforceable on April 1, 2023, the same day as matching regulation amendments, Sparke Helmore reported. The Northern Territory applied psychosocial rules from July 1, 2023, and Western Australia covered psychosocial risks in regulations from Dec. 24, 2022. The World Health Organization and International Labour Organization recommended manager training for the first time in September 2022, which local providers now sell as a core service. As a result, Employee Assistance Programs hold 34.0% of 2025 value, alongside growing occupational health services for risk assessment.
Why does the psychological injury burden push early support?
Psychological injuries cost employers far more than physical injuries, which gives them a strong reason to fund early counseling and return-to-work support. Safe Work Australia data show that mental health conditions made up 12.0% of serious claims in 2023-24, or 17,600 claims, up 14.7% in a year. The same release puts the median time lost on these claims at 35.7 working weeks in 2022-23. Median compensation paid on these claims reached A$67,400 in 2022-23, according to the same report. The Productivity Commission put the cost of mental ill-health and suicide at A$200 billion to A$220 billion a year in its 2020 inquiry. This is why occupational health and rehabilitation hold a large share of value as employers buy psychological injury case management.
How does integrated digital access widen employee reach?
Providers now combine counseling, coaching, medical advice and safety alerts in one app, which lets employers cover shift, remote and regional staff without adding clinic visits. Startup Daily reported on March 11, 2025 that Sonder raised A$40 million, had more than one million users and found that over 90% of staff seeking mental health support preferred chat. The same report said 46% of contacts came outside office hours. TELUS Health delivers its assistance program through the TELUS Health One app, with video, phone and anonymous online chat, as its Rugby Australia renewal of Sept. 6, 2024 described. As a result, Digital Wellness Platforms grow fastest at 7.03% a year, and many of these apps now connect staff to psychologists through mental health software used for bookings and notes.
Why do insurers and benefits advisers widen employer uptake?
Health funds, super funds and brokers increasingly package workplace health services with other products, which brings mid-sized employers into the market without a separate tender. Medibank launched a new corporate health cover program on Aug. 6, 2024, adding 24/7 mental health and nurse lines, health screenings and flu vaccinations for covered staff. Super fund Hostplus joined the March 2025 Sonder funding round, alongside existing investors Blackbird, MA Growth Ventures and Seek. Altius Group runs Employee Assistance Programs, rehabilitation and services for insurers, brokers and government agencies from 10 locations. In turn, Benefits Intermediary Contracts grow fastest at 5.28% a year, because insurers such as Medibank sell workplace programs alongside corporate private health insurance cover.
Prevention, manager training and app-led access gain ground
Why is the shift from counseling to prevention gaining pace?
Employers are shifting spending from reactive counseling toward prevention, because regulators now expect them to fix the work design that causes psychological harm. Victoria's new regulations require employers to identify and control hazards such as bullying, aggression and exposure to traumatic content, as the Victorian Government stated on Dec. 1, 2025. Medibank now offers preventive programs for stress, fatigue and resilience with participation analytics, alongside screening and ergonomic assessments. PeopleSense by Altius delivers about 400 counseling sessions a day through more than 180 employed psychologists. As a result, On-Site Delivery keeps 36.0% of 2025 value, as on-site checks and workshops support prevention plans and health coaching gains a place in employer programs.
How is the rise of manager-led support changing contracts?
Contracts increasingly include manager advice lines and leadership training, which moves providers into the daily running of teams rather than only crisis support. Acacia EAP lists manager support, mediation, critical incident response and psychological fitness-for-work checks, and says it has served more than 2,000 organizations. Australian Catholic University switched its program to Acacia EAP on Jan. 1, 2024 after a competitive tender, with a manager advice service and dedicated First Nations counseling. Workplace Options Australia released a World Mental Health Day toolkit on Oct. 10, 2025 that urged trauma-informed manager training. In turn, Large Employers with 200 or More Employees hold 58.0% of 2025 value, because they buy the widest leadership programs.
Can low-cost digital plans reach small employers?
Small and medium firms remain lightly served, which opens room for low-cost digital plans sold through brokers and payroll platforms. The Australian Bureau of Statistics counted 922,512 businesses with 1-19 employees in June 2026, against only 68,325 with 20-199 employees. Psychosocial duties apply to these firms as well, although many owners lack dedicated staff to design programs. Medibank cites research showing that employer health programs can cut absenteeism by 25%, and it puts the productivity cost of unhealthy staff at A$2,741 per employee a year. As a result, Small Employers with 1-19 Employees grow fastest at 5.74% a year, while providers link wellbeing tools with employee engagement platforms.
Will bundled mental and physical services lift contract value?
Buyers increasingly want one provider for mental health, physical checks and rehabilitation, which creates an opening for groups that combine these services. Workplace Options bought the Veretis Group assistance business on Nov. 1, 2022, adding more than 300 psychologists and consultants. Converge International bought Melbourne digital health platform HeadUp Labs in February 2022 to build an integrated preventive product, according to its adviser Oaklins. Benestar rebranded as TELUS Health, which offered mental, physical and financial services in one program for Rugby Australia from Sept. 6, 2024. In turn, providers that bundle services can lift contract value per employee, while standalone mental health programs still grow at a steady pace.
Low usage, claim reform and thin small firm budgets weigh
Why does low program usage weaken buyer confidence?
Many employees never use the programs their employer pays for, which makes it harder for buyers to justify renewals. A 2022 literature review for the State Insurance Regulatory Authority cited usage of about 6% in an industry survey and about 5% in the Productivity Commission inquiry. Procurement teams therefore push for usage reporting and outcome measures. Providers respond with chat access, family coverage and targeted campaigns for staff groups with low contact rates.
How does workers compensation reform shift employer focus?
States are tightening psychological injury rules, which may reduce some claim costs but leaves employers responsible for prevention. NSW Parliament passed the Workers Compensation Legislation Amendment Bill on Nov. 18, 2025, capping weekly payments for primary psychological injuries at 130 weeks in most cases, QBE reported. Victoria also narrowed mental injury eligibility for new claims from March 31, 2024. For employers, this means less financial pressure from claims, so providers must sell prevention on safety duties.
Why do thin budgets slow uptake among small employers?
Small employers rarely have dedicated budgets for health programs, which slows adoption outside large firms and agencies. Most of these businesses have fewer than five staff, so per-employee pricing and minimum contract sizes often exceed what owners will pay. Providers therefore rely on brokers, industry associations and insurers to reach this group. Pooled plans and app-only tiers lower the entry cost but limit face-to-face counseling.
How do clinician shortages strain service quality?
Assistance providers compete with public and private clinics for registered psychologists, which can lengthen waiting times for in-person sessions. Medibank now promotes psychologist bookings within days rather than weeks as a selling point for its new program. Providers that lack enough clinicians shift more contacts to phone and chat. Larger groups hire salaried psychologists, as Altius does with more than 180 staff, to protect response times.
New South Wales leads as Victoria grows fastest to 2035
| Region | Value, 2025 (USD million) | Share, 2025 | CAGR, 2026–2035 |
|---|---|---|---|
| New South Wales | 150.9 | 30.9% | 4.64% |
| Victoria | 112.4 | 23.0% | 5.24% |
| Queensland | 92.8 | 19.0% | 5.04% |
| Western Australia | 78.2 | 16.0% | 4.94% |
| South Australia, Tasmania and Territories | 54.2 | 11.1% | 4.44% |
Sydney head offices anchor demand in New South Wales
New South Wales held a 30.9% share of 2025 value and grows at 4.64% a year, because Sydney hosts the largest group of financial, professional and public sector employers. The state had 8.67 million residents at March 31, 2026, according to the Australian Bureau of Statistics, after growth of 1.1% over the year. NSW Parliament passed psychological injury reforms in November 2025, which keeps prevention high on employer agendas.
Why is Victoria the fastest-growing region?
Victoria held a 23.0% share of 2025 value and grows fastest at 5.24% a year, because its psychological health regulations took effect for all employers on Dec. 1, 2025. The Victorian Government said that only 42% of workers with a mental injury returned to work within six months, against 75% with physical injuries. The state also had 7.15 million residents at March 2026, after growth of 1.6% over the year.
How do mining and public employers shape Queensland demand?
Queensland held a 19.0% share of 2025 value and grows at 5.04% a year, because it combines fast population growth with an enforceable psychosocial Code of Practice since April 2023. The state had 5.74 million residents at March 2026, after growth of 1.6% over the year. Large public, resources and health employers buy critical incident and trauma services, which supports steady contract renewals across Brisbane and regional centers.
Fly-in, fly-out mining drives Western Australian programs
Western Australia held a 16.0% share of 2025 value and grows at 4.94% a year, because remote resources work raises demand for remote counseling and on-site support. The state had the fastest population growth of any state at 2.1% to March 2026. WorkSafe WA reported in June 2025 that regulations covering psychosocial risks took effect on Dec. 24, 2022, after the parliamentary report on sexual harassment in fly-in, fly-out mining.
Smaller states and territories rely on remote delivery
South Australia, Tasmania and Territories held 11.1% of 2025 value and grow at 4.44% a year. These areas had about 3.26 million residents combined at March 2026, with Tasmania growing only 0.6% over the year. The Northern Territory applied psychosocial rules from July 1, 2023, while remote delivery helps providers serve dispersed workplaces at a lower cost.
Funding rounds, product launches and safety rules since 2024
| Development | Status and market relevance |
|---|---|
| In August 2024, Medibank launched a new corporate health cover program with 24/7 mental health and nurse lines. | Bundles preventive checks and mental health support into insurer-led employer offers |
| In March 2025, Sonder raised A$40 million from investors including Blackbird, Seek and Hostplus. | Funds growth of its app-based safety and wellbeing platform beyond one million users |
| In October 2025, Workplace Options Australia released a World Mental Health Day toolkit in eight languages. | Guides employers on trauma-informed manager support after a workplace crisis |
| In November 2025, NSW Parliament passed the Workers Compensation Legislation Amendment Bill 2025. | Tightens psychological injury claims and keeps prevention high on employer agendas |
| In December 2025, Victoria's psychological health regulations took effect for all employers. | Requires employers to identify and control psychosocial hazards like physical risks |
Digital tools that decide how staff reach support
- Wellbeing apps combine counseling bookings, self-help modules and safety alerts, which lets staff reach support at any hour and lets providers serve remote sites without travel.
- Chat-based counseling connects employees with trained clinicians in text, which suits staff who avoid phone calls, and Sonder found that 46% of contacts came outside office hours.
- Psychosocial risk dashboards turn de-identified usage and survey data into hazard reports, which helps employers show regulators how they identify and control psychosocial hazards.
- Wearable-linked health tools track sleep, activity and stress signals, which supports prevention programs, as Converge sought when it bought HeadUp Labs in 2022.
Need a Custom Version of This Report?
Tailor the scope, geography, or segments to your exact requirements.
- Custom geography or segment scope
- Direct access to our analyst team
Assistance providers and insurers compete for contracts
Competition combines global assistance providers, Australian specialists, health insurers and digital entrants. TELUS Health, which absorbed the former Benestar business, and Workplace Options, which bought the Veretis Group assistance business in November 2022, compete for large national contracts on clinician networks and app access. Converge International, Altius Group, Acacia EAP, AccessEAP and Assure Programs compete through local clinicians, critical incident response and contracts with public and private employers, while the not-for-profit AccessEAP has offered programs since 1989. Medibank competes by bundling workplace health checks and mental health lines with corporate health cover. Sonder competes as a digital alternative with chat support and safety alerts. Buyers now compare providers on response times, usage reporting, psychosocial risk support and the breadth of services under one contract.
Which providers serve Australian employer programs?
| Company | Type | Role in the market |
|---|---|---|
| TELUS Health | Global assistance provider | Rebranded Benestar and runs app-based programs for Rugby Australia |
| Medibank | Health insurer and service provider | Offers workplace health checks and launched new corporate cover in 2024 |
| Sonder | Digital safety and wellbeing platform | Raised A$40 million in March 2025 with over one million users |
| Converge International | Workplace mental health provider | Bought HeadUp Labs in 2022 and partners with the AFL |
| Altius Group | Workplace health and rehabilitation group | Runs PeopleSense programs with more than 180 psychologists |
| Workplace Options | Global assistance provider | Bought the Veretis Group assistance business in November 2022 |
| Acacia EAP | Assistance provider | Took over the Australian Catholic University program in January 2024 |
| AccessEAP | Not-for-profit assistance provider | Has offered assistance programs in Australia since 1989 |
| Assure Programs | Assistance and development provider | Part of APM Group, using registered psychologists only |
| Centre for Corporate Health | Psychological services provider | Assesses psychological injury claims and supports return to work |
Credence Research view on Australian employer health
Credence Research's view is that Australian employer health spending will grow on compliance and prevention more than on new headcount, because psychosocial duties now apply in every state and territory. Assistance programs stay the largest service type, while digital platforms grow fastest as chat and app access widen reach. Victoria gains most from its new regulations, while New South Wales keeps the largest base. Providers that combine prevention, risk reporting, rehabilitation and fast clinician access should win the most contract renewals by 2035.
Model inputs from safety, claims and population data
The report uses 2025 as the base year on a calendar basis, and market values come from the Credence Research model. That model draws on workplace safety statistics, workers compensation reports, state regulations, official population and business counts, government inquiry reports and company announcements. Segment splits, regional shares and regional growth rates are Credence Research estimates. Sources used are government pages, regulator reports, trade media and company releases, and no interviews or surveys were conducted.
Psychosocial compliance and digital care lead to 2035
The Australia corporate wellness market is expected to reach USD 787.4 million by 2035, a 4.88% CAGR during 2026–2035, as employers treat psychological health as a safety duty and fund earlier support for staff. Growth should be strongest in digital platforms, standalone mental health programs, small employers and Victoria, because these areas gain most from new rules and lower-cost access. Low usage, claim reforms and clinician shortages could slow some contracts, while bundled services, manager training and better reporting should support steady demand through the forecast period.
Frequently Asked Questions
How big is the Australia corporate wellness market?
Which service type leads Australian employer spending?
Which region leads the market?
How do psychosocial safety rules affect demand?
How large is the psychological injury burden?
Why are digital wellness platforms growing fastest?
Who are the leading companies in the market?
What are the main challenges for the market?
Table of Content
Chapter 1 Market Segmentation
- 1.1 Segmentation Framework
- 1.1.1 Product and Service Classification
- 1.1.2 Application and End-Use Classification
- 1.1.3 Technology and Solution Classification
- 1.1.4 Customer and Distribution Channel Classification
- 1.1.5 Geographic Segmentation
- 1.1.6 Market Segment Definitions and Boundaries
- 1.2 By Service Type
- 1.2.1 Employee Assistance Programs
- 1.2.2 Preventive Health and Lifestyle Services
- 1.2.3 Standalone Mental Health Programs
- 1.2.4 Occupational Health and Rehabilitation
- 1.2.5 Digital Wellness Platforms
- 1.3 By Customer Type
- 1.3.1 Large Employers with 200 or More Employees
- 1.3.2 Medium Employers with 20-199 Employees
- 1.3.3 Small Employers with 1-19 Employees
- 1.4 By Delivery Model
- 1.4.1 On-Site Delivery
- 1.4.2 Remote Delivery
- 1.4.3 Hybrid Delivery
- 1.5 By Sales Channel
- 1.5.1 Direct Employer Contracts
- 1.5.2 Benefits Intermediary Contracts
- 1.5.3 Insurer-Referred Service Contracts
Chapter 2 Introduction
- 2.1 Report Objectives and Scope
- 2.2 Product Definition and Industry Terminology
- 2.3 Market Inclusions and Exclusions
- 2.4 Research Process
- 2.4.1 Primary Research and Expert Interviews
- 2.4.2 Secondary Research and Source Review
- 2.4.3 Top-Down and Bottom-Up Estimation
- 2.4.4 Data Triangulation and Verification
- 2.5 Market Size Measurement Basis
- 2.5.1 2025: USD 488.5 million → 2035: USD 787.4 million
- 2.6 Historical and Forecast Reference Periods
- 2.6.1 Historical Period: 2018-2025
- 2.6.2 Base Year: 2025
- 2.6.3 Forecast Period: 2025-2035
- 2.7 Research Assumptions and Limitations
Chapter 3 Executive Summary
- 3.1 Market Snapshot and Key Findings
- 3.2 Base-Year Market Size, 2025
- 3.3 Forecast Market Size, 2035
- 3.4 Revenue and Volume Growth Outlook
- 3.5 Key Demand and Supply Indicators
- 3.6 Leading Market Segments
- 3.7 Fastest-Growing Market Opportunities
- 3.8 Regional Performance Highlights
- 3.9 Technology and Industry Transformation
- 3.10 Competitive Landscape Summary
- 3.11 Analyst View and Strategic Implications
Chapter 4 Australia Corporate Wellness Market Trends and Developments
- 4.1 Historical Industry Development, 2018-2025
- 4.2 Recent Market Trends and Developments
- 4.3 Demand and Customer Behavior Trends
- 4.4 Technology and Product Innovation
- 4.5 Artificial Intelligence, Automation and Digitalization
- 4.6 Local Manufacturing and Supply Chain Realignment
- 4.7 Industry Partnerships, Mergers and Acquisitions
- 4.8 Sustainability and Circular Economy Developments
- 4.9 Government and Private Sector Investment Trends
- 4.10 Emerging Business Models and Commercialization
- 4.11 Industry Developments and Announcements
Chapter 5 Australia Corporate Wellness Market Production, Supply and Demand Analysis
- 5.1 Demand Trend and Consumption Analysis, 2018-2025
- 5.2 Demand Forecast, 2025-2035
- 5.3 Production and Output Trend, 2018-2025
- 5.4 Production and Output Forecast, 2025-2035
- 5.5 Installed Capacity and Capacity Utilization
- 5.6 Company-Wise Production Plants and Statistics
- 5.6.1 Installed Production Capacity
- 5.6.2 Actual Production
- 5.6.3 Planned Capacity and Expansion Targets
- 5.7 Supply Chain Structure and Procurement Trends
- 5.8 Supply-Demand Gap and Bottlenecks
- 5.9 Import Dependence and Sourcing Structure
- 5.10 Contract Manufacturing and Outsourcing
- 5.11 Regional Supply and Demand Concentration
Chapter 6 Australia Corporate Wellness Market Pricing Analysis
- 6.1 Pricing Structure and Measurement
- 6.2 Historical Pricing Trends, 2018-2025
- 6.3 Pricing Outlook, 2025-2035
- 6.4 Average Selling Price and Unit Economics
- 6.5 Pricing by Product and Market Segment
- 6.6 Geographic Pricing Differences
- 6.7 Key Input, Energy, Labor and Logistics Costs
- 6.8 Contract Pricing and Purchasing Models
- 6.9 Pricing Sensitivity and Competitive Positioning
- 6.10 Price, Margin and Profitability Implications
Chapter 7 Australia Corporate Wellness Market Dynamics
- 7.1 Market Growth Drivers
- 7.1.1 Demand-Side Drivers
- 7.1.2 Technology and Innovation Drivers
- 7.1.3 Infrastructure and Investment Drivers
- 7.1.4 Regulatory and Policy Drivers
- 7.2 Market Restraints
- 7.2.1 Cost and Affordability Constraints
- 7.2.2 Technology and Adoption Barriers
- 7.2.3 Supply Chain and Operational Constraints
- 7.3 Market Challenges
- 7.3.1 Competitive Pressure and Margin Erosion
- 7.3.2 Skills, Infrastructure and Implementation Gaps
- 7.4 Emerging Market Opportunities
- 7.5 Market Dynamics Impact and Time-Horizon Assessment
Chapter 8 Australia Corporate Wellness Value Chain Analysis
- 8.1 Industry Value Chain Overview
- 8.2 Upstream Suppliers and Critical Inputs
- 8.3 Technology and Component Providers
- 8.4 Manufacturing or Service Delivery
- 8.5 Distribution, Channel Partners and Integrators
- 8.6 Downstream Applications and End Users
- 8.7 Value Addition and Profit Pools
- 8.8 Vertical Integration and Outsourcing
- 8.9 Supplier Concentration and Risk
- 8.10 Supply Chain Localization and Resilience
Chapter 9 Australia Corporate Wellness Market Regulations and Policies
- 9.1 Relevant Laws, Standards and Compliance Frameworks
- 9.2 Product, Service, Safety and Quality Requirements
- 9.3 Government Policies, Incentives and Subsidies
- 9.4 Imports, Exports and Trade Barriers
- 9.5 Public Procurement and Local Content Requirements
- 9.6 Environmental and Sustainability Compliance
- 9.7 Upcoming Policy Changes and Market Implications
Chapter 10 Australia Corporate Wellness Market Hotspots and Opportunities
- 10.1 Market Opportunity Mapping and Growth Hotspots
- 10.2 High-Growth Applications and Customer Groups
- 10.3 Underserved Markets and White-Space Opportunities
- 10.4 Emerging Technology and Product Opportunities
- 10.5 New Capacity and Investment Hotspots
- 10.6 Market Entry and Expansion Opportunities
- 10.7 Distribution and Partnership Opportunities
- 10.8 Near-Term and Long-Term Commercial Potential
- 10.9 Opportunity Attractiveness and Execution Risks
Chapter 11 Australia Corporate Wellness Market Outlook, 2025-2035
- 11.1 Market Size and Analysis
- 11.1.1 Revenue (Market Measurement: 2025: USD 488.5 million → 2035: USD 787.4 million)
- 11.1.2 Market Volume and Quantity Sold
- 11.1.3 Historical Market Size, 2018-2025
- 11.1.4 Base-Year Market Size, 2025
- 11.2 Market Forecast, 2025-2035
- 11.2.1 Revenue Forecast to 2035
- 11.2.2 Volume Forecast to 2035
- 11.2.3 CAGR and Year-on-Year Growth
- 11.2.4 Incremental Revenue Opportunity
- 11.3 Forecast Assumptions and Scenario Analysis
- 11.3.1 Base-Case Forecast
- 11.3.2 Optimistic and Conservative Scenarios
- 11.3.3 Technology, Pricing and Policy Sensitivities
- 11.4 Market Attractiveness and Growth Outlook
Chapter 12 Australia Corporate Wellness Market Segmentation and Outlook
- 12.1 Segmentation Summary and Market Shares, 2025
- 12.2 Largest and Fastest-Growing Segments
- 12.3 By Service Type - Market Size and Forecast, 2025-2035
- 12.3.1 Segment Definition and Scope
- 12.3.2 Historical Market Size, 2018-2025
- 12.3.3 Revenue Forecast, 2025-2035
- 12.3.4 Volume Forecast, 2025-2035
- 12.3.5 Base-Year Market Share, 2025
- 12.3.6 Segment CAGR and Growth Drivers
- 12.3.7 Subsegment Market Size and Forecast
- 12.3.7.1 Employee Assistance Programs
- 12.3.7.2 Preventive Health and Lifestyle Services
- 12.3.7.3 Standalone Mental Health Programs
- 12.3.7.4 Occupational Health and Rehabilitation
- 12.3.7.5 Digital Wellness Platforms
- 12.3.8 Subsegment Pricing and Adoption Trends
- 12.3.9 Leading Suppliers and Competition
- 12.3.10 Regional Demand and Opportunities
- 12.4 By Customer Type - Market Size and Forecast, 2025-2035
- 12.4.1 Segment Definition and Scope
- 12.4.2 Historical Market Size, 2018-2025
- 12.4.3 Revenue Forecast, 2025-2035
- 12.4.4 Volume Forecast, 2025-2035
- 12.4.5 Base-Year Market Share, 2025
- 12.4.6 Segment CAGR and Growth Drivers
- 12.4.7 Subsegment Market Size and Forecast
- 12.4.7.1 Large Employers with 200 or More Employees
- 12.4.7.2 Medium Employers with 20-199 Employees
- 12.4.7.3 Small Employers with 1-19 Employees
- 12.4.8 Subsegment Pricing and Adoption Trends
- 12.4.9 Leading Suppliers and Competition
- 12.4.10 Regional Demand and Opportunities
- 12.5 By Delivery Model - Market Size and Forecast, 2025-2035
- 12.5.1 Segment Definition and Scope
- 12.5.2 Historical Market Size, 2018-2025
- 12.5.3 Revenue Forecast, 2025-2035
- 12.5.4 Volume Forecast, 2025-2035
- 12.5.5 Base-Year Market Share, 2025
- 12.5.6 Segment CAGR and Growth Drivers
- 12.5.7 Subsegment Market Size and Forecast
- 12.5.7.1 On-Site Delivery
- 12.5.7.2 Remote Delivery
- 12.5.7.3 Hybrid Delivery
- 12.5.8 Subsegment Pricing and Adoption Trends
- 12.5.9 Leading Suppliers and Competition
- 12.5.10 Regional Demand and Opportunities
- 12.6 By Sales Channel - Market Size and Forecast, 2025-2035
- 12.6.1 Segment Definition and Scope
- 12.6.2 Historical Market Size, 2018-2025
- 12.6.3 Revenue Forecast, 2025-2035
- 12.6.4 Volume Forecast, 2025-2035
- 12.6.5 Base-Year Market Share, 2025
- 12.6.6 Segment CAGR and Growth Drivers
- 12.6.7 Subsegment Market Size and Forecast
- 12.6.7.1 Direct Employer Contracts
- 12.6.7.2 Benefits Intermediary Contracts
- 12.6.7.3 Insurer-Referred Service Contracts
- 12.6.8 Subsegment Pricing and Adoption Trends
- 12.6.9 Leading Suppliers and Competition
- 12.6.10 Regional Demand and Opportunities
- 12.7 Segment Growth Comparison
- 12.8 Segment Attractiveness and Priority Matrix
Chapter 13 Australia Corporate Wellness End-Use and Application Market Outlook
- 13.1 End-Use Industry and Customer Demand Structure
- 13.2 Leading Applications and Customer Groups
- 13.3 End-Use Market Size, Share and Forecast
- 13.4 Major End-Use Industry Deep Dives
- 13.4.1 Customer Requirements and Use Cases
- 13.4.2 Demand and Replacement Cycles
- 13.4.3 Technical and Regulatory Considerations
- 13.4.4 Purchasing and Procurement Models
- 13.4.5 Leading Vendors and Distribution Channels
- 13.4.6 Forecast and Commercial Opportunities
- 13.5 Emerging Applications and Cross-Segment Demand
- 13.6 End-Use Industry Investment Priorities
Chapter 14 Australia Corporate Wellness Geographic Market Outlook, 2025-2035
- 14.1 Domestic Market Distribution and Demand Clusters
- 14.2 State- or Province-Wise Market Size and Forecast, 2025-2035
- 14.3 City and Metropolitan Market Outlook
- 14.4 Industrial, Manufacturing and Commercial Clusters
- 14.5 Geographic Concentration of Key End Users
- 14.6 Local Pricing and Purchasing Differences
- 14.7 Domestic Production Facilities and Capacity Map
- 14.8 Local Infrastructure and Project Pipeline
- 14.9 State-Level Policy and Incentive Differences
- 14.10 Subnational Investment Hotspots and Opportunities
- 14.11 Distribution and Logistics Networks
- 14.12 Domestic Competitive Footprint
Chapter 15 Australia Corporate Wellness Technology, Innovation and Sustainability Outlook
- 15.1 Technology Landscape and Maturity
- 15.2 Product, Process and Service Innovation
- 15.3 AI, Automation and Digital Tools in the Industry
- 15.4 Technology Adoption and Performance Benchmarking
- 15.5 Innovation Pipeline and R&D Investment
- 15.6 Patent and Intellectual Property Trends
- 15.7 Energy Efficiency and Resource Management
- 15.8 Sustainability, Recycling and Circularity
- 15.9 Technology Roadmap, 2025-2035
- 15.10 Risks of Obsolescence and Technology Substitution
Chapter 16 Australia Corporate Wellness Market Key Strategic Imperatives
- 16.1 Growth and Market Entry Priorities
- 16.2 High-Return Products and Segments
- 16.3 Pricing, Profitability and Cost Optimization
- 16.4 Technology Investment and Product Differentiation
- 16.5 Supply Chain Localization and Resilience
- 16.6 Distribution and Customer Acquisition
- 16.7 Partnership, Acquisition and Capacity Strategy
- 16.8 Regional Expansion Priorities
- 16.9 Short-, Medium- and Long-Term Actions
Chapter 17 Competition Outlook
- 17.1 Industry Competition Characteristics
- 17.2 Market Structure and Concentration
- 17.3 Market Share and Competitive Positioning, 2025
- 17.4 Company-Wise Revenue and Product Benchmarking
- 17.5 Production and Service Capacity Benchmarking
- 17.6 Technology, Pricing and Differentiation
- 17.7 Regional Footprint and Distribution Strength
- 17.8 Mergers, Acquisitions and Strategic Alliances
- 17.9 New Entrants and Competitive Threats
- 17.10 Porter's Five Forces and Industry Attractiveness
- 17.11 Competitive Outlook, 2025-2035
Chapter 18 Company Profiles
- 18.1 Company Coverage and Selection Criteria
- 18.2 TELUS Health
- 18.2.1 Business Description
- 18.2.2 Company Ownership and Geographic Presence
- 18.2.3 Product and Service Portfolio
- 18.2.4 Manufacturing and Operating Footprint
- 18.2.5 Production Capacity and Expansion Plans
- 18.2.6 Financial Performance and Investment
- 18.2.7 Market Share and Competitive Position
- 18.2.8 Technology and Innovation Capabilities
- 18.2.9 Strategic Alliances or Partnerships
- 18.2.10 Recent Developments
- 18.2.11 Growth Strategy and Outlook
- 18.3 Medibank
- 18.4 Sonder
- 18.5 Converge International
- 18.6 Altius Group
- 18.7 Workplace Options
- 18.8 Acacia EAP
- 18.9 AccessEAP
- 18.10 Assure Programs
- 18.11 Centre for Corporate Health
- 18.12 Other Relevant Market Participants
Note: Every listed company is profiled on the structure shown under the first company. The company list is preliminary and may change based on research findings, market developments, data availability and client requirements.
Chapter 19 Disclaimer
- 19.1 Research and Forecast Disclaimer
- 19.2 Data Source and Estimation Limitations
Note: The depth of individual sections depends on data availability for this market. Volume, capacity, trade and other unit-based metrics are included where applicable.

