
Virtual visits become a routine part of care delivery
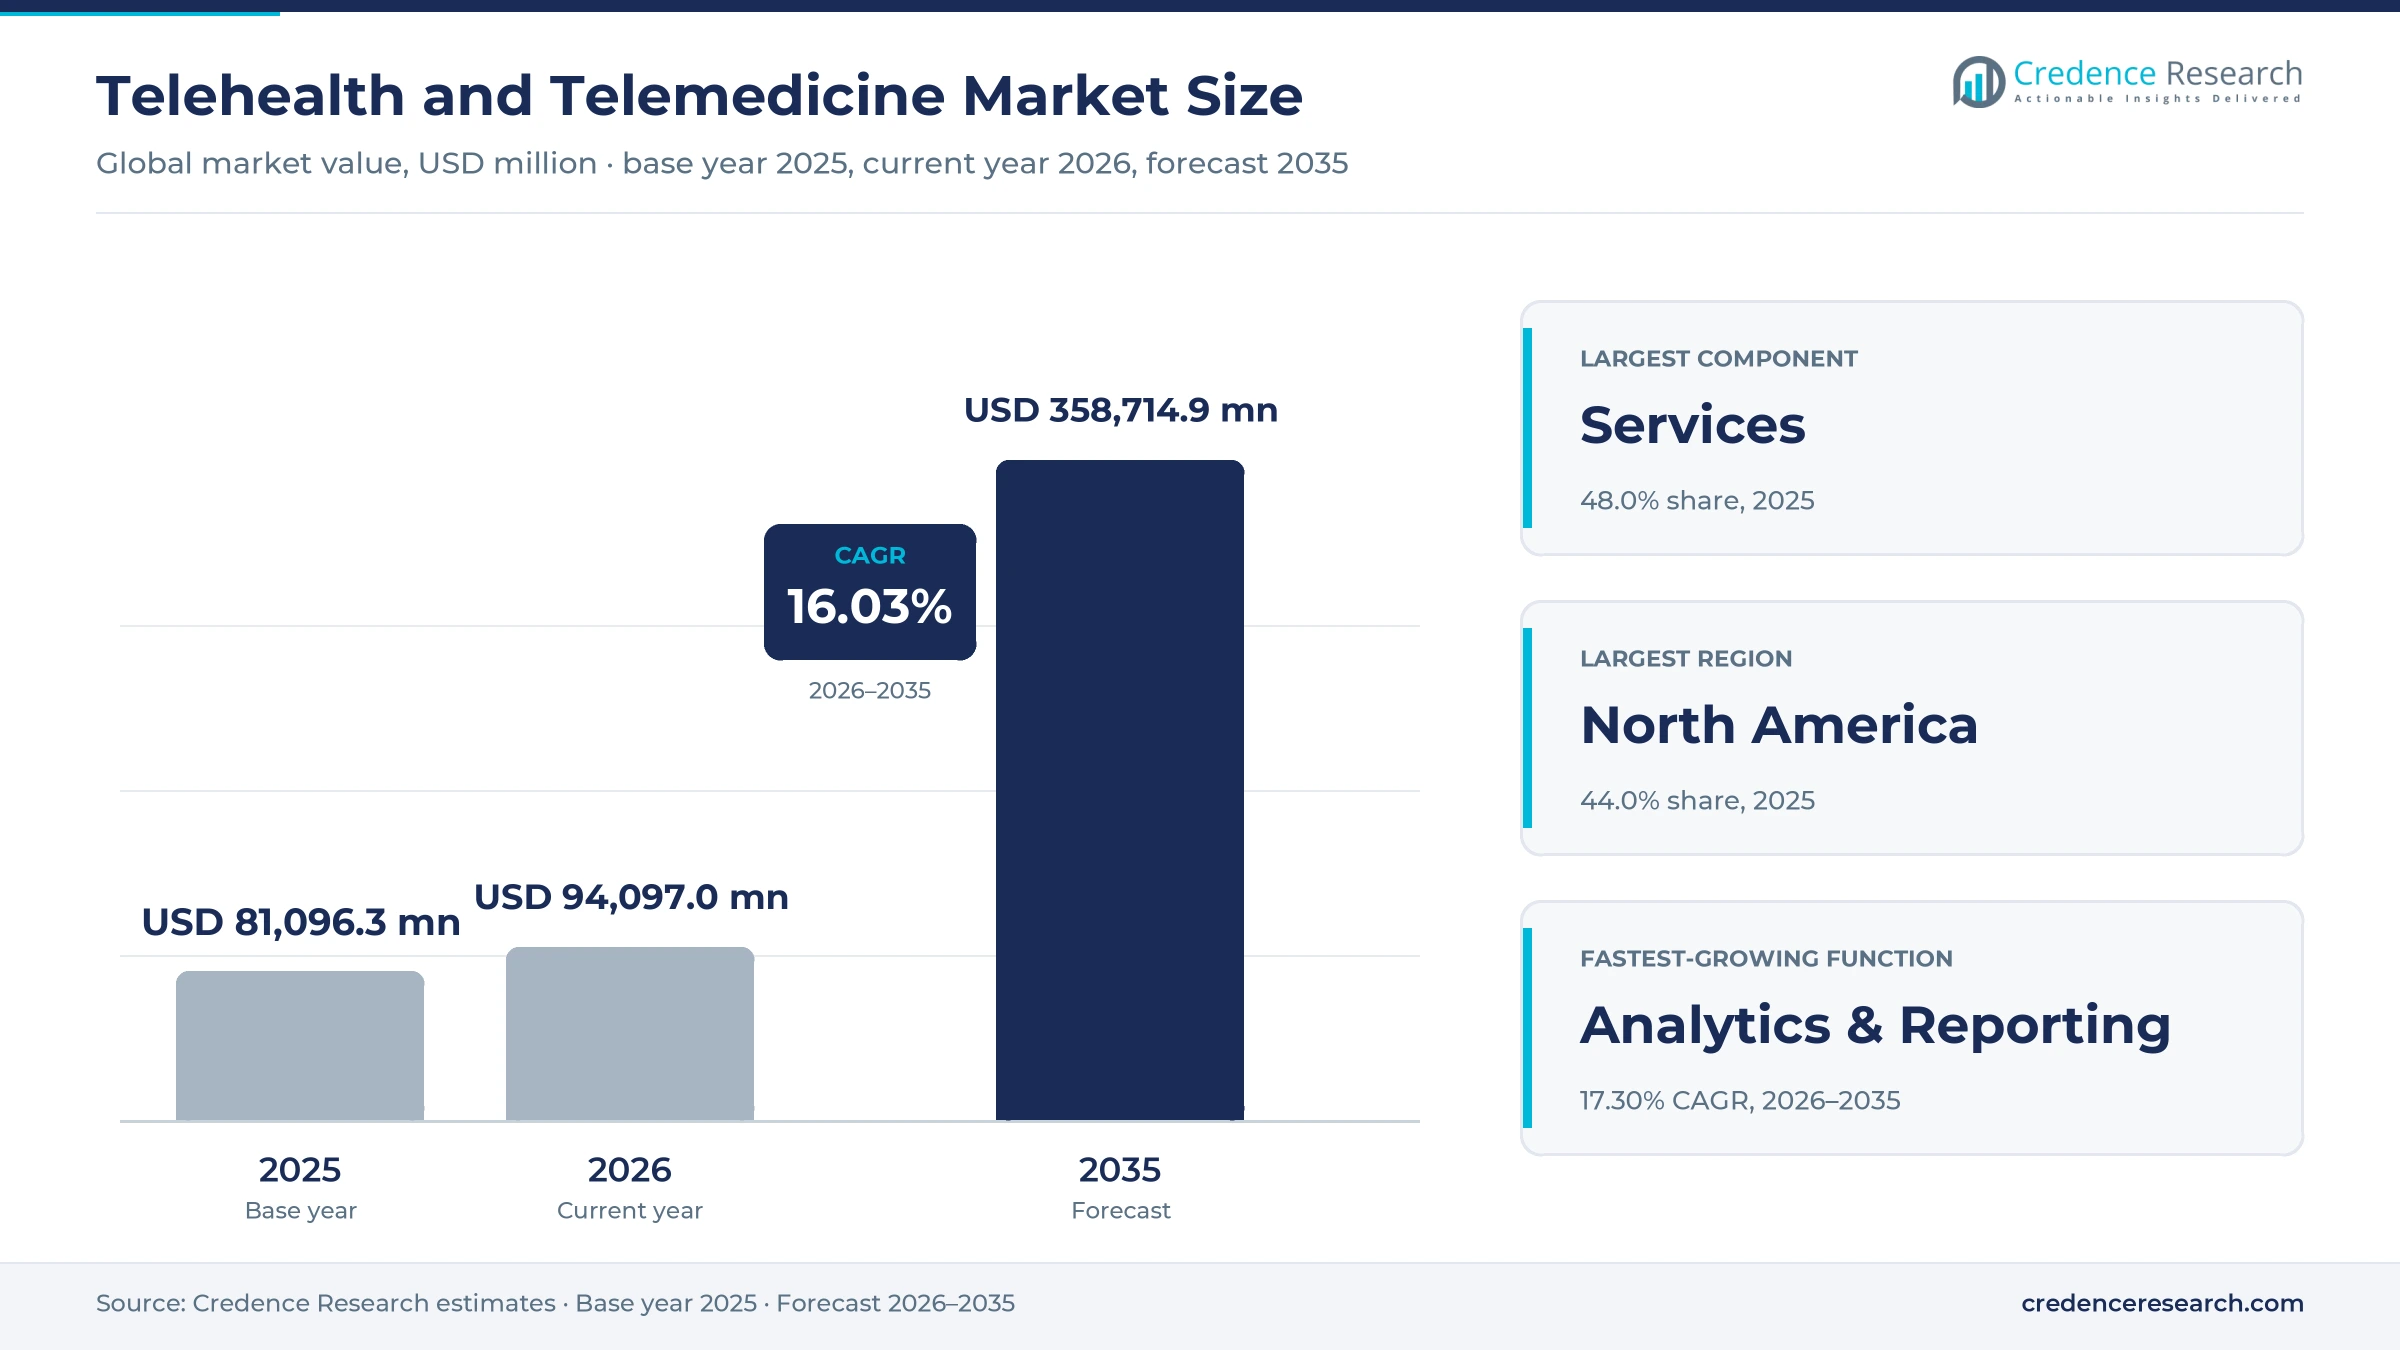
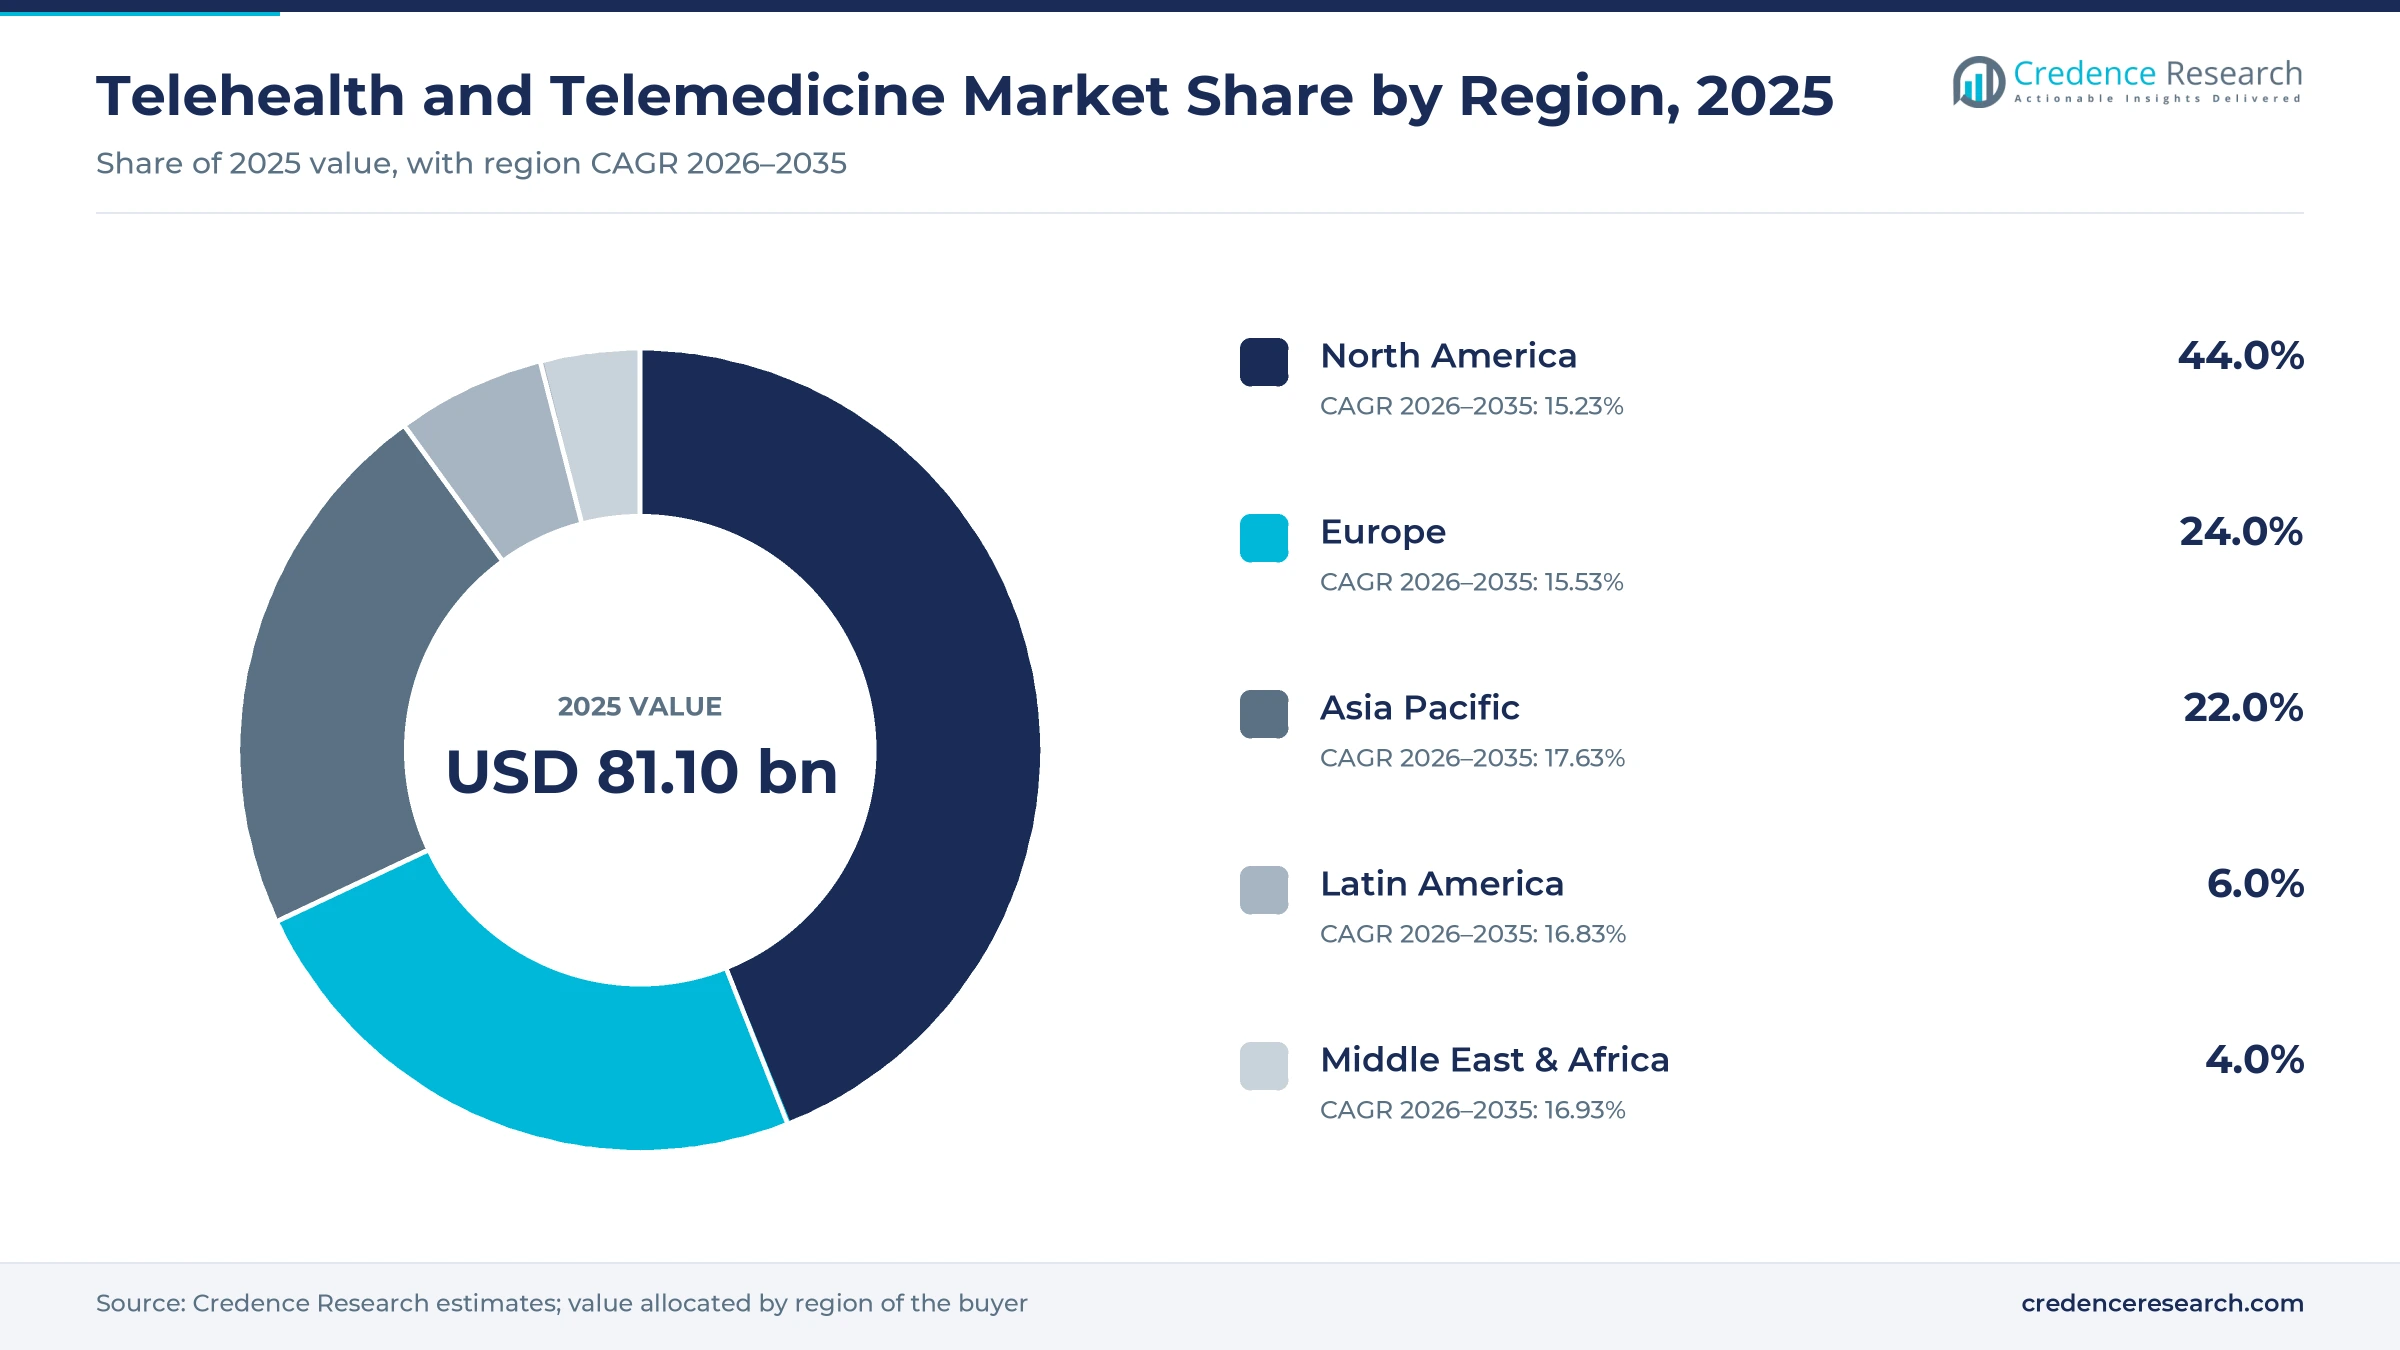
The global telehealth and telemedicine market was valued at USD 81.10 billion in 2025 and is projected to increase from USD 94.10 billion in 2026 to USD 358.71 billion by 2035, registering a CAGR of 16.03% during 2026–2035. Demand rises because patients want faster access to doctors and therapists, while health systems use video visits and remote monitoring to manage chronic disease outside clinics. North America held the largest regional share, 44.0% in 2025, because Medicare, private insurers and employers pay for virtual visits at scale. Asia Pacific is the fastest-growing region at 17.63% a year, as India, China and Southeast Asian countries build national virtual care platforms. Policy also became more stable in 2026, when U.S. lawmakers extended Medicare telehealth flexibilities through Dec. 31, 2027. As a result, providers and vendors can plan multi-year virtual care programs with greater confidence about payment.
Which virtual care products and services does this analysis count?
The analysis counts hardware such as monitoring devices, carts and peripherals, software for video visits, scheduling and analytics, and services such as virtual consultations and remote monitoring programs. Healthcare providers, payers, patients, medtech companies and drug makers buy them for adult and pediatric users.
General video conferencing for business use and in-person clinic revenue sit outside the value counted here. The value chain runs from network and device supply through software platforms and clinician networks to payers, employers and patients who pay for each virtual visit or program.
Telehealth and Telemedicine Market Insights
- The telehealth and telemedicine market grows from USD 81.10 billion in 2025 to USD 358.71 billion by 2035, a 16.03% CAGR as virtual visits become routine care.
- North America held 44.0% of global value in 2025, because Medicare, insurers and employers pay widely for virtual visits.
- Services led components with 48.0% of 2025 value, because virtual consultations, clinician networks and remote monitoring programs earn recurring fees from payers.
- In May 2025, the World Health Assembly extended the WHO global strategy on digital health through 2027, while 129 countries now have national strategies.
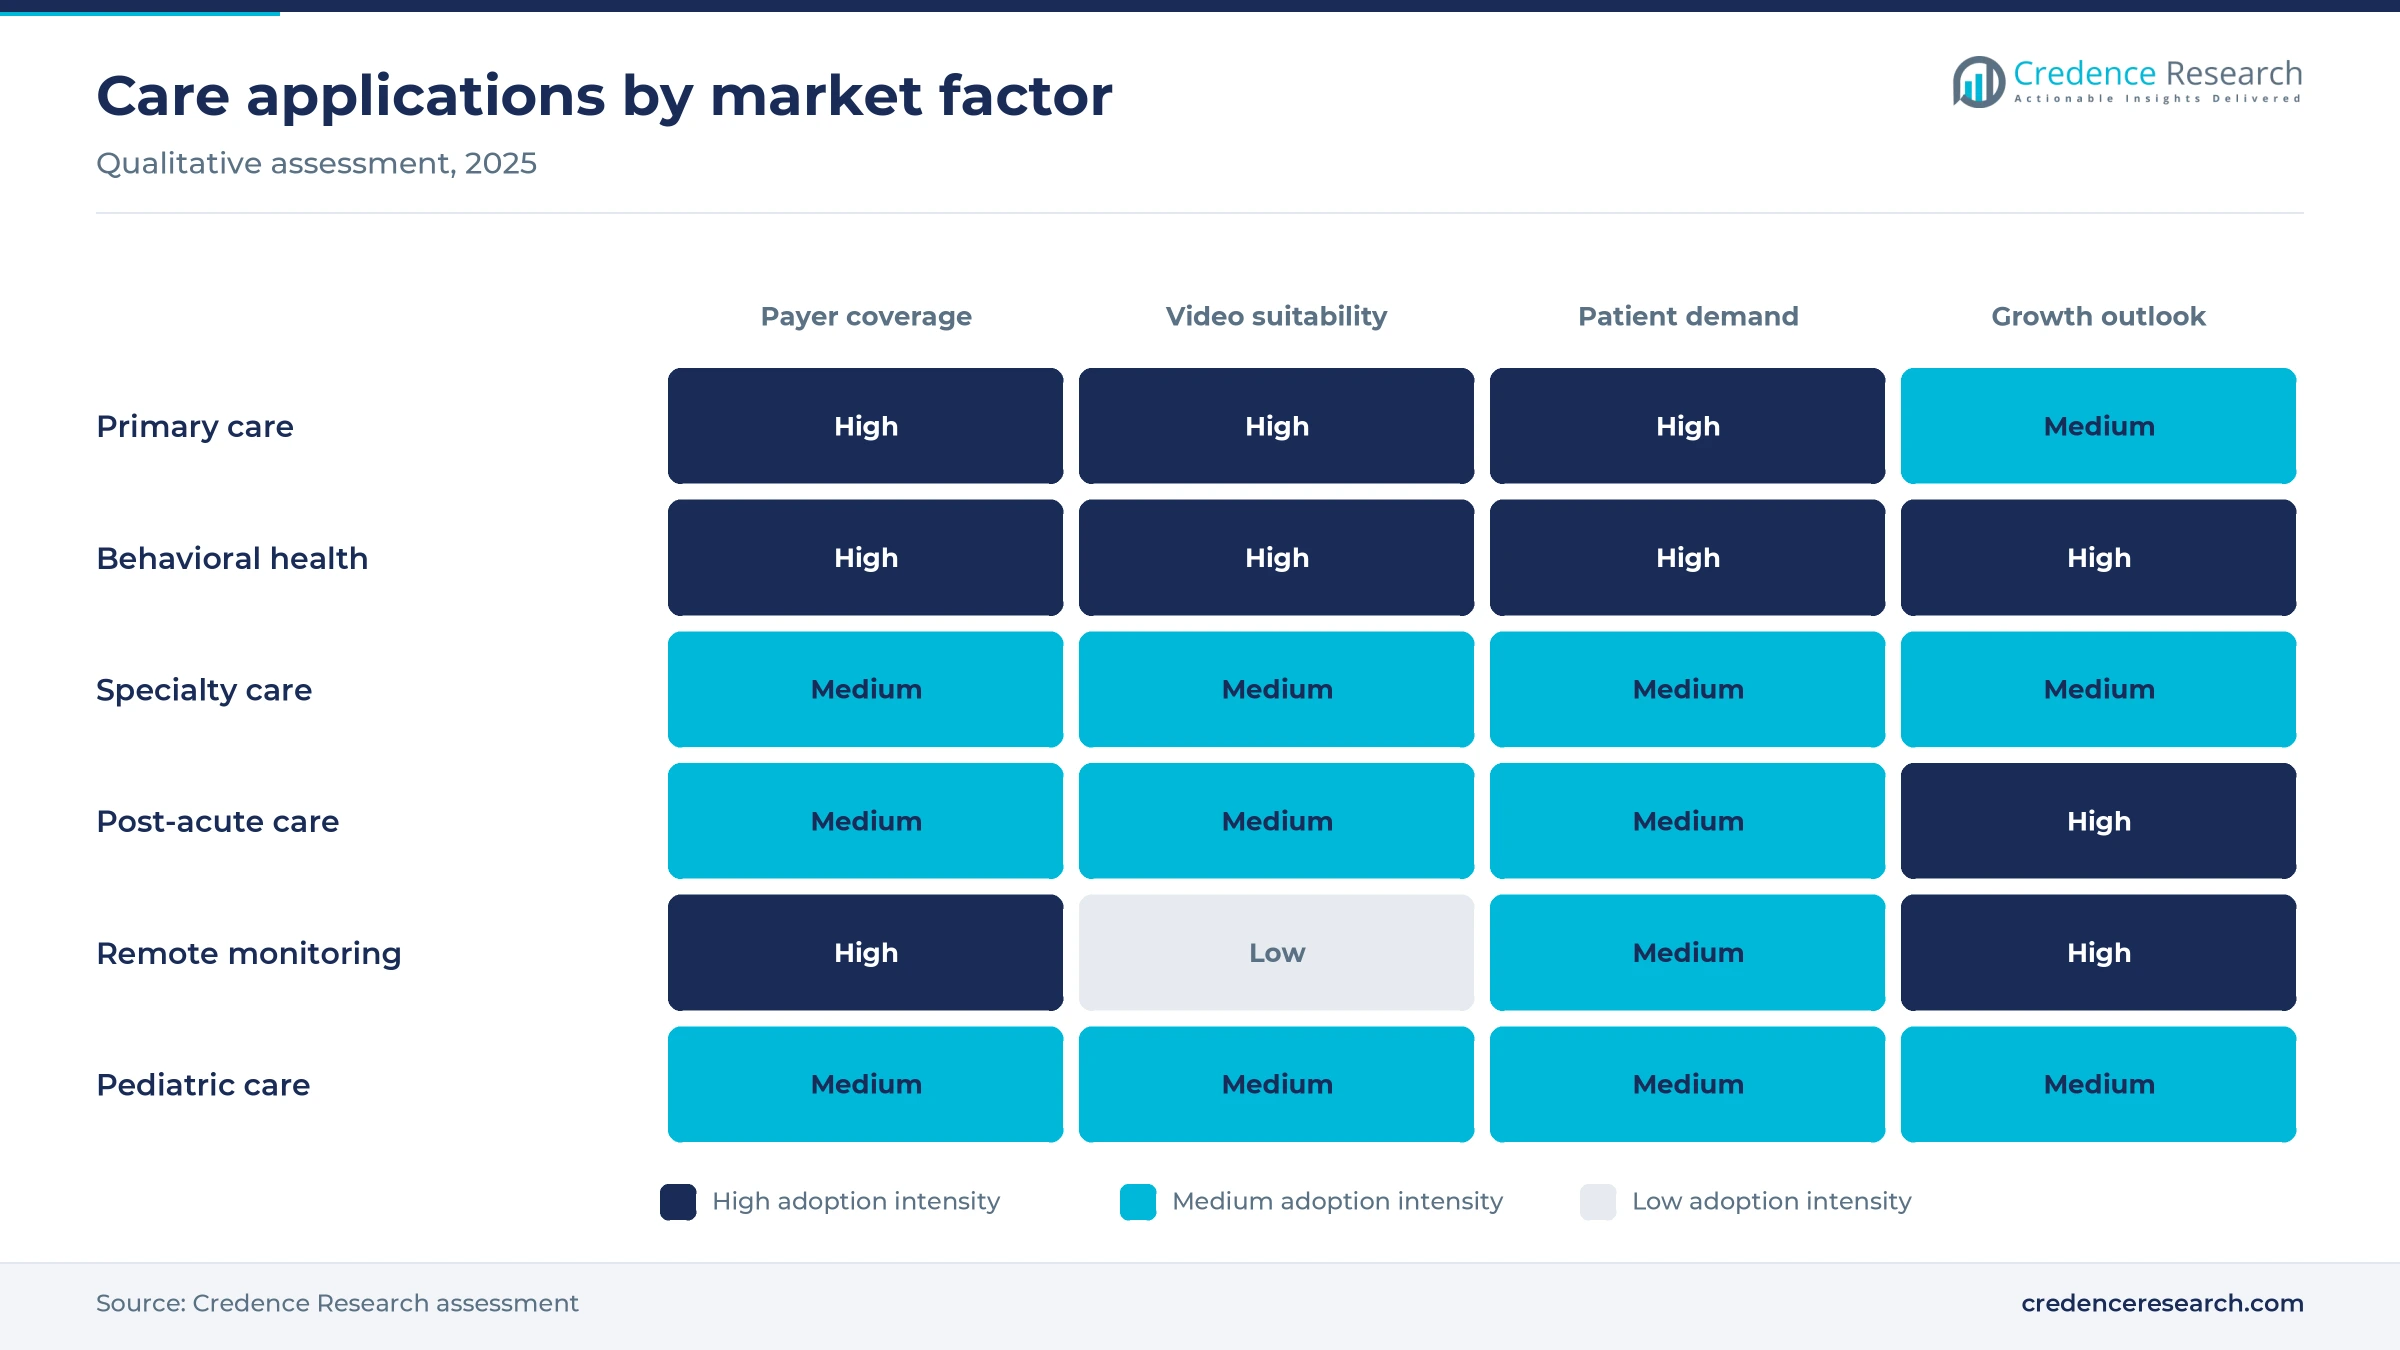
- Behavioral health grows fastest among applications at 17.06% a year through 2035, as therapy and psychiatry move online.
Services, primary care and providers hold the largest shares
Do services or software earn more virtual care revenue?
Based on component, the market is categorized into hardware, software and services. Services led with 48.0% of 2025 value, because virtual consultations, monitoring programs and clinician networks earn recurring fees. Software grows fastest at 16.90% a year, as AI documentation, scheduling and analytics tools spread. Hardware includes carts, cameras and monitoring peripherals that link patients to care teams.
Which care functions use virtual tools most?
Based on function, the market is categorized into clinical care management, preventive care management, diagnostics and treatment, patient monitoring, analytics and reporting and others. Clinical Care Management led with 26.0% of 2025 value, because care teams manage chronic patients through regular video check-ins. Analytics & Reporting grows fastest at 17.30% a year, as payers and providers measure outcomes from virtual programs.
Which care settings rely most on virtual visits?
Based on application, the market is categorized into primary care, specialty care, behavioral health, post-acute care and others. Primary Care led with 34.0% of 2025 value, because routine visits, minor illness and prescription renewals suit video. Behavioral Health grows fastest at 17.06% a year, as therapy and psychiatry move online. Pediatric and adult users are both served, with adults making up most visits.
Who pays for virtual care?
Based on end user, the market is categorized into healthcare providers, healthcare payers, patients, medtech companies and pharmaceutical and biotechnology companies. Healthcare Providers led with 46.0% of 2025 value, because hospitals and physician groups buy platforms for their own clinicians. Pharmaceutical & Biotechnology Companies grow fastest at 16.94% a year, as drug makers use virtual visits for decentralized trials and patient support.
| Segment Group | Leading Sub-segment | Share, 2025 | Fastest-growing Sub-segment | CAGR, 2026–2035 |
|---|---|---|---|---|
| By Component | Services | 48.0% | Software | 16.90% |
| By Function | Clinical Care Management | 26.0% | Analytics & Reporting | 17.30% |
| By Application | Primary Care | 34.0% | Behavioral Health | 17.06% |
| By End User | Healthcare Providers | 46.0% | Pharmaceutical & Biotechnology Companies | 16.94% |
Request a Free Sample
Fill in your details and we'll send you a free sample report.
- Sample data tables & charts
- Research methodology
Policy extensions, connectivity and access gaps lift demand
Why do U.S. payment extensions support long-term demand?
Medicare and federal regulators have extended virtual care rules several times, which gives providers more certainty to invest. The Consolidated Appropriations Act of 2026 extended Medicare telehealth flexibilities through Dec. 31, 2027, including audio-only visits and care delivered at home. The same law extended the Acute Hospital Care at Home initiative through Sept. 30, 2030. In January 2026, the Drug Enforcement Administration issued a fourth temporary rule that keeps remote prescribing of controlled medicines in place through Dec. 31, 2026. As a result, North America grows at 15.23% a year, and U.S. health systems keep building virtual programs for rural and home-bound patients.
How does wider internet access expand the patient base?
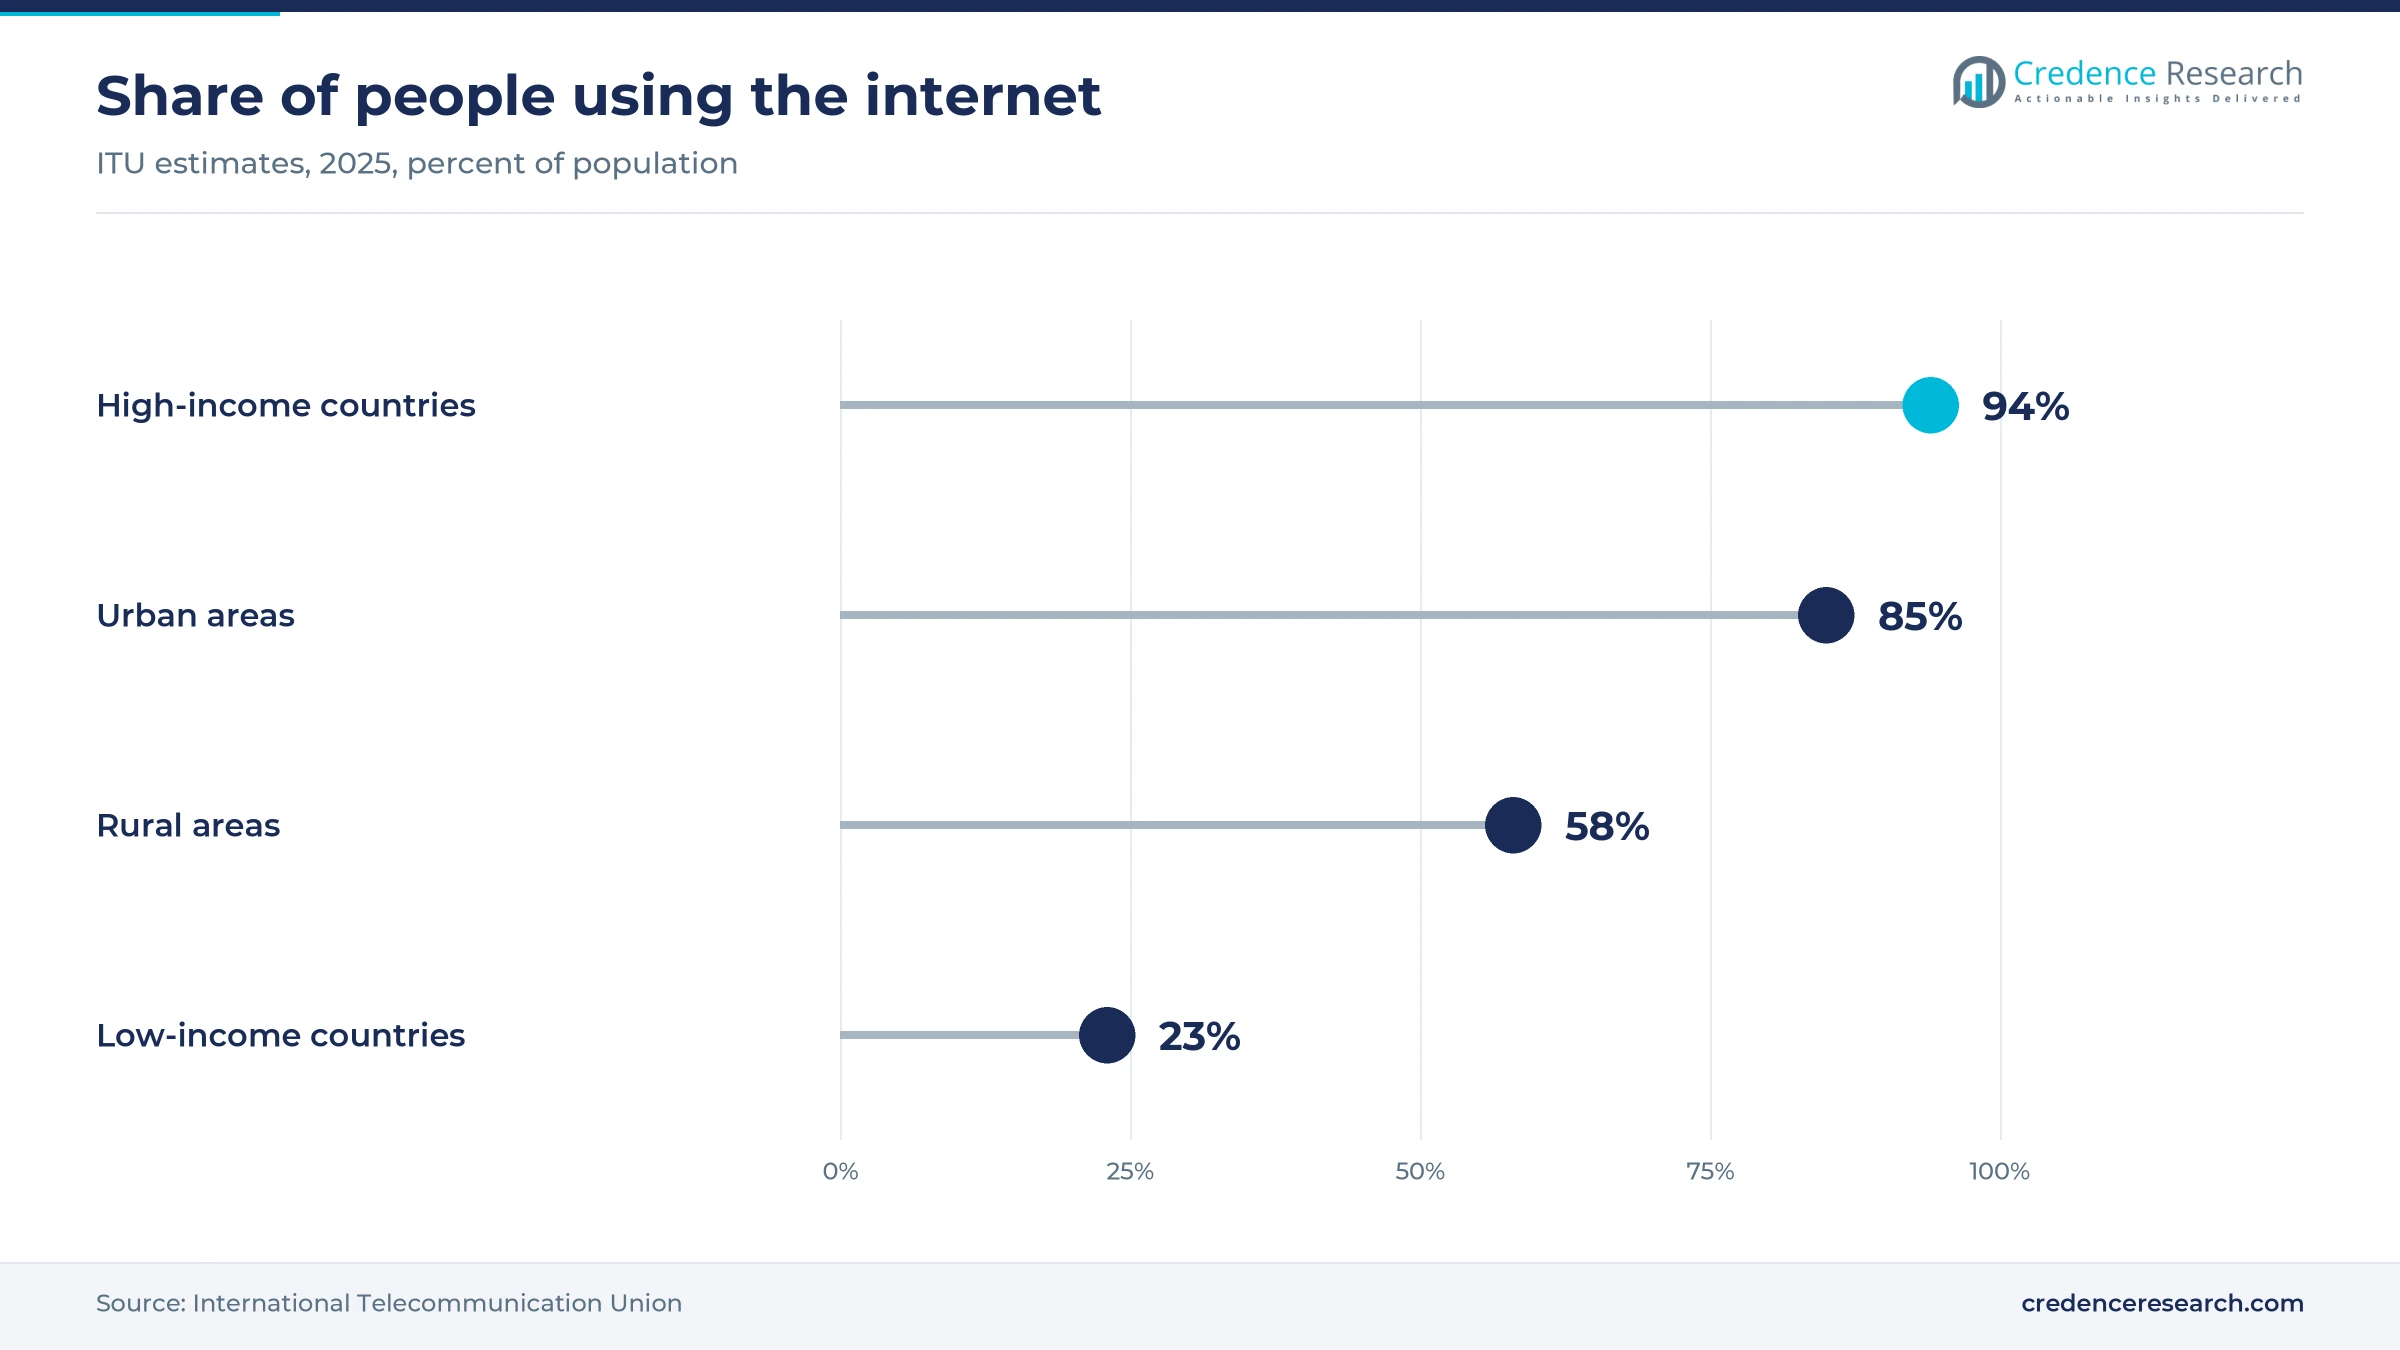
More people than ever can join a video visit, because mobile broadband now reaches most of the world. The International Telecommunication Union estimates that about 6 billion people, roughly three-quarters of the world population, use the internet in 2025. 5G networks cover about 55% of the world population this year, which supports smooth video visits on smartphones and tablets. However, 94% of people in high-income countries are online, compared with only 23% in low-income countries. In turn, Asia Pacific gains the most new users as connectivity spreads, and platforms for digital health reach new users in emerging markets.
Why do rural and specialty access gaps favor virtual visits?
Patients far from hospitals and specialists save travel time with video, so access gaps remain a strong driver. The National Center for Health Statistics reports that 37.0% of U.S. adults used telemedicine in 2021. Use was higher among women, at 42.0%, than among men, at 31.7%. Adults aged 65 and older used it most, at 43.3%, which reflects their need for regular follow-up care. However, use fell from 40.3% in large central metro counties to 27.5% in rural noncore areas, which shows clear room for further growth in rural areas. As a result, primary care leads applications with 34.0% of 2025 value.
How do national digital health strategies widen adoption?
Governments now treat virtual care as part of national health systems, which widens adoption beyond private platforms. In May 2025, the World Health Assembly endorsed extending the WHO global strategy on digital health through 2027 and asked WHO to prepare a new strategy for 2028 to 2033. According to WHO, 129 countries have established national digital health strategies. Also, 130 member states have completed digital health maturity assessments. In India, the public eSanjeevani platform has passed 500 million teleconsultations across all states. In turn, healthcare providers lead end users with 46.0% of 2025 value as public hospitals add virtual clinics and specialist hubs.
AI notes, behavioral care and national platforms rise
How is the rise of AI documentation changing virtual visits?
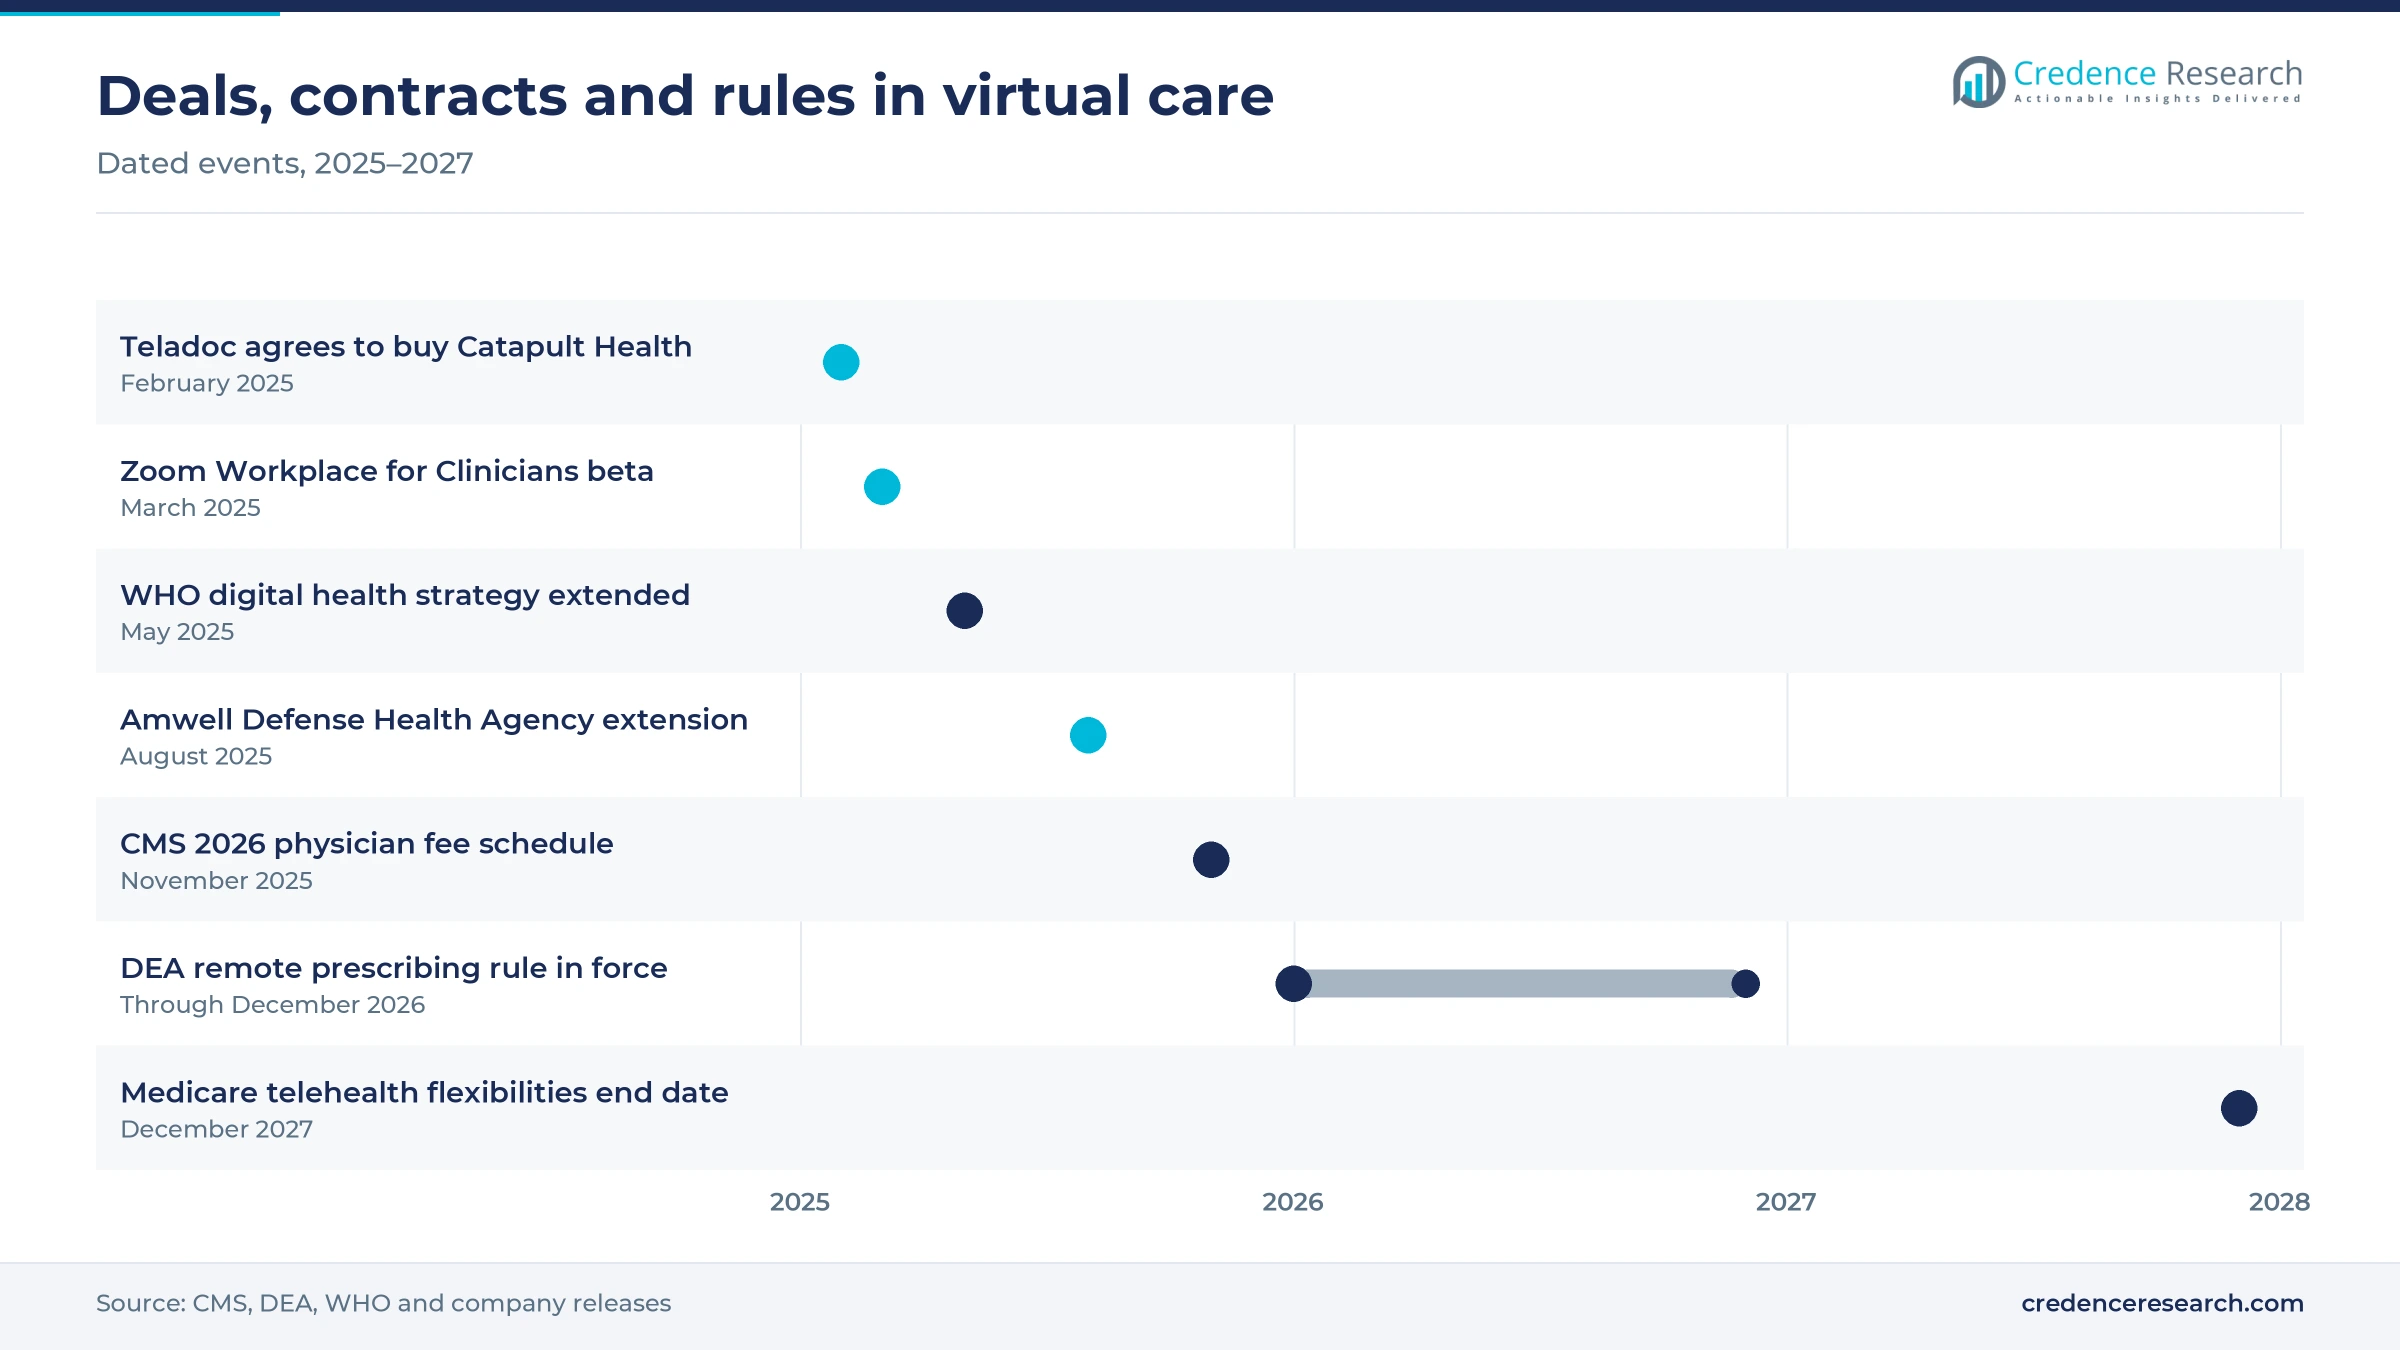
Clinicians spend less time typing when software writes visit notes, so AI documentation is now built into video platforms. In March 2025, Zoom announced Zoom Workplace for Clinicians in public beta, with AI-generated clinical notes for virtual and in-person visits. The product was slated for general availability at the end of that month, with templates for multiple specialties and note translation. Zoom also planned a Custom AI Companion for healthcare for summer 2025, adding medical speech recognition and links to electronic health records. As a result, software grows at 16.90% a year, the fastest pace among components, and healthcare analytics tools gain more structured visit data.
Is the shift of behavioral care online accelerating?
Therapy and psychiatry need no physical exam, so mental health care has moved online faster than most specialties. About 37.0% of U.S. adults used telemedicine in 2021, and therapy is among the services that need no exam. In May 2025, Teladoc Health agreed to buy UpLift, a virtual therapy, psychiatry and medication management platform, for $30 million. The deal lets BetterHelp customers use insurance benefits through the UpLift network. In January 2026, the DEA extended remote prescribing of controlled medicines, which many psychiatry services rely on. Medicare also delayed in-person visit requirements for certain mental health services under the 2026 law. In turn, behavioral health grows at 17.06% a year, the fastest pace among applications.
Where can remote monitoring open new demand?
Chronic patients need regular readings between visits, which makes remote monitoring a clear opening for vendors. In November 2025, the Centers for Medicare & Medicaid Services finalized its 2026 physician fee schedule, which permanently allows virtual direct supervision through real-time audio and video. The rule also permanently removed frequency limits on follow-up hospital, nursing facility and critical care visits by telehealth. Congress also extended the Acute Hospital Care at Home initiative through Sept. 30, 2030, which keeps home recovery programs funded. As a result, remote patient monitoring programs expand, and patient monitoring grows faster than the overall function mix.
Can national and defense platforms open large contracts?
Governments and military health systems buy virtual care at very large scale, which opens big contracts for platform vendors. In August 2025, Amwell announced an extension of its Digital First contract with the U.S. Defense Health Agency. The Military Health System serves about 9.6 million beneficiaries, and virtual visits nearly tripled after Amwell replaced the earlier video tool. In October 2026, India's eSanjeevani platform passed 500 million teleconsultations, handling 250,000 to 300,000 consultations a day in 15 languages. In turn, Asia Pacific held 22.0% of 2025 value and keeps adding public users through national networks that reach rural clinics.
Reimbursement cliffs, licensing and digital divides
How do short-term payment extensions create risk?
Many U.S. virtual care rules still depend on temporary extensions, which leaves providers exposed to policy cliffs. Medicare flexibilities lapsed on Oct. 1, 2025, during a federal shutdown, and Congress restored them on Nov. 12, 2025. That law ran only through Jan. 30, 2026, so providers faced a second deadline within weeks. As a result, health systems hesitate to hire virtual-only clinicians until permanent payment rules are in place. Permanent coverage for home visits would remove much of this uncertainty for providers and vendors.
Why do licensing rules limit cross-border care?
Clinicians usually need a license in the state or country where the patient sits, which limits virtual reach. Multi-state licenses take time and money, so smaller practices often serve only local patients. Cross-border care within Europe and Asia faces similar rules on data and professional registration. In turn, platforms must build large clinician networks in each market, which raises their costs. Interstate licensing compacts help, but many clinicians have not yet joined them.
How does the digital divide hold back use?
About 2.2 billion people remain offline in 2025, so many patients cannot join video visits at all. Rural residents and older adults with poor connections often fall back to audio-only calls, which limit what clinicians can assess. Low-income countries have far lower internet use than high-income ones. However, national platforms that work on basic phones and in local languages are helping public systems reach these groups. Community health workers also help patients join visits from local clinics.
Why do privacy and security concerns slow adoption?
Virtual visits move sensitive health data across networks, apps and cloud servers, which raises privacy risks. Health systems must check each vendor for security controls and data storage rules before signing contracts. Breaches can expose patient records and lead to fines and lost trust. As a result, procurement cycles lengthen and vendors invest in encryption, access controls and audits to win large hospital and payer contracts. Clear national privacy rules make these reviews faster and more predictable.
U.S. payers lead value as Asian public platforms scale
| Region | Value, 2025 (USD billion) | Share, 2025 | CAGR, 2026–2035 |
|---|---|---|---|
| North America | 35.68 | 44.0% | 15.23% |
| Europe | 19.46 | 24.0% | 15.53% |
| Asia Pacific | 17.84 | 22.0% | 17.63% |
| Latin America | 4.87 | 6.0% | 16.83% |
| Middle East & Africa | 3.24 | 4.0% | 16.93% |
What keeps U.S. payers and providers ahead?
North America held a 44.0% share of 2025 value and grows at 15.23% a year through 2035. Medicare telehealth flexibilities now run through Dec. 31, 2027, and remote prescribing rules run through the end of 2026. Teladoc Health, Amwell, MDLIVE and Zoom serve large employer, payer and hospital customers. The Defense Health Agency also runs virtual care for about 9.6 million military health beneficiaries. Canada adds demand through provincial virtual care programs that pay physicians for video and phone visits.
How fast is Asia Pacific adding virtual users?
Asia Pacific held a 22.0% share of 2025 value and is the fastest-growing region at 17.63% a year. India's eSanjeevani platform links more than 142,000 local health centers with over 19,000 medical hubs for remote consultations. China and Southeast Asian countries are building online hospital services, while Japan and Australia use virtual care to reach older and remote patients. The eSanjeevani service also handles 250,000 to 300,000 consultations a day, which shows how public platforms scale in the region.
How do national health systems in Europe pay for video?
Europe held a 24.0% share of 2025 value and grows at 15.53% a year through 2035. National health systems in the United Kingdom, Germany and France pay for video visits and remote monitoring for chronic disease. However, separate national rules on reimbursement, data and professional licenses keep regional growth below the global pace. Philips and other European device makers supply monitoring hardware and software to hospitals and home care programs across the region.
Where are Brazilian and Mexican insurers adding video visits?
Latin America held a 6.0% share of 2025 value and grows at 16.83% a year through 2035. Brazil and Mexico lead regional demand, with private insurers and employers paying for virtual primary care visits.
Which Gulf and African factors shape demand?
The Middle East and Africa held a 4.0% share of 2025 value and grows at 16.93% a year through 2035. Gulf states fund national virtual care services, while low internet use limits reach in much of Africa.
Deals, contracts and rule changes in virtual care since 2025
| Development | Status and market relevance |
|---|---|
| In February 2025, Teladoc Health agreed to acquire Catapult Health, a virtual preventive checkup company, for $65 million. | Announced; adds at-home preventive exams |
| In March 2025, Zoom announced Zoom Workplace for Clinicians with AI-generated clinical notes. | Public beta; general availability planned |
| In May 2025, Teladoc Health agreed to acquire UpLift, a virtual mental health platform, for $30 million. | Announced; insurance-covered therapy network |
| In August 2025, Amwell announced an extension of its Digital First contract with the U.S. Defense Health Agency. | Extended; Military Health System platform |
| In November 2025, CMS published its 2026 physician fee schedule with permanent virtual direct supervision. | Final rule; effective for 2026 |
Video, monitoring devices and AI tools reshape visits
- Secure video platforms connect patients with clinicians from phones and computers, which supports routine and urgent visits.
- Connected monitoring devices send blood pressure, glucose and weight readings to care teams, which supports chronic disease programs.
- AI documentation tools write clinical notes from visit audio, which reduces paperwork for clinicians after each consultation.
- Store-and-forward imaging lets specialists review images later, which helps dermatology and eye care reach remote patients.
- Hub-and-spoke public networks link local health centers with district hospitals, which brings specialists to rural patients.
Need a Custom Version of This Report?
Tailor the scope, geography, or segments to your exact requirements.
- Custom geography or segment scope
- Direct access to our analyst team
Virtual care platforms and device makers compete widely
Competition in the market centers on virtual care platforms, communications companies and device makers that sell to providers, payers and employers. Teladoc Health, Amwell and MDLIVE compete on clinician networks, behavioral health services and payer contracts, and Teladoc added UpLift and Catapult Health in 2025. Zoom Video Communications, doxy.me and VSee offer video tools for clinics of all sizes, while AT&T supplies connectivity for hospitals and remote sites. Philips Healthcare, GE Healthcare and Medtronic supply monitoring hardware and software that feed virtual programs. Care Simple and Timedoc Health focus on remote monitoring and chronic care management services. Kindbody offers virtual fertility consultations alongside its network of physical clinics. However, payer coverage, security reviews and outcome data still decide which vendors win large contracts.
Companies profiled and their roles in this market
| Company | Type | Role in the market |
|---|---|---|
| Teladoc Health | Virtual care services | Virtual visits, BetterHelp, UpLift and Catapult Health |
| Amwell | Virtual care platform | Platform for health systems, payers and the Defense Health Agency |
| MDLIVE | Virtual care services | Virtual urgent, primary and behavioral care |
| Zoom Video Communications | Video and AI software | Zoom Workplace for Clinicians with AI notes |
| doxy.me | Video software | Browser-based video visits for clinicians |
| VSee | Video software | Video visits and remote examination tools |
| AT&T | Connectivity | Network and connectivity for virtual care |
| Philips Healthcare | Monitoring technology | Remote patient monitoring and virtual care software |
| GE Healthcare | Monitoring technology | Patient monitoring and care coordination tools |
| Medtronic | Monitoring technology | Remote monitoring for cardiac and diabetes care |
| Care Simple | Remote monitoring services | Remote monitoring and chronic care management |
| Timedoc Health | Care management services | Chronic care and remote monitoring programs |
| Kindbody | Fertility care | Virtual and in-clinic fertility services |
Hybrid care models carry growth through 2035
Credence Research's view is that hybrid care models, rather than stand-alone video visits, will carry most growth through 2035. The market grows at 16.03% a year as payers, governments and employers fold virtual visits into routine care. Longer U.S. policy extensions, wider internet access and AI documentation lower the cost of each visit. The strongest openings sit in behavioral health, remote monitoring and public platforms in Asia Pacific, while payment cliffs and the digital divide remain the main brakes on adoption.
How Credence Research built the virtual care model
The report uses 2025 as the base year and 2026 to 2035 as the forecast period. Market values come from the Credence Research model, which builds spending by component, function, application, user group and end user. Regional and segment splits are Credence Research estimates informed by ITU, CDC and WHO statistics, U.S. federal rules, government platform data, company releases and health trade press. No primary interviews or surveys were used in preparing this edition of the report.
Virtual care outlook to 2035
By 2035, the telehealth and telemedicine market is projected to reach USD 358.71 billion, with growth led by Asia Pacific, software and behavioral health. Services will remain the largest component as virtual consultations and monitoring programs scale. AI documentation, connected devices and public platforms will add new users and lower visit costs each year. North America keeps the highest spending per patient, while Asia Pacific adds the most new users over the decade. Vendors that combine secure platforms, clinician networks and payer coverage will gain the most share.
Frequently Asked Questions
How big is the global telehealth and telemedicine market?
Which region leads the telehealth and telemedicine market?
Which component leads the market?
Which application grows fastest?
How long do Medicare telehealth flexibilities last?
How many U.S. adults use telemedicine?
Who are the leading telehealth and telemedicine companies?
How many people can reach virtual care online?
Table of Content
Chapter 1 Market Segmentation
- 1.1 Segmentation Framework
- 1.1.1 Product and Service Classification
- 1.1.2 Application and End-Use Classification
- 1.1.3 Technology and Solution Classification
- 1.1.4 Customer and Distribution Channel Classification
- 1.1.5 Geographic Segmentation
- 1.1.6 Market Segment Definitions and Boundaries
- 1.2 By Component
- 1.2.1 Hardware
- 1.2.2 Software
- 1.2.3 Services
- 1.3 By Function
- 1.3.1 Clinical Care Management
- 1.3.2 Preventive Care Management
- 1.3.3 Diagnostics & Treatment
- 1.3.4 Patient Monitoring
- 1.3.5 Analytics & Reporting
- 1.3.6 Others
- 1.4 By Application
- 1.4.1 Primary Care
- 1.4.2 Specialty Care
- 1.4.3 Behavioral Health
- 1.4.4 Post-acute Care
- 1.4.5 Others
- 1.5 By End User
- 1.5.1 Healthcare Providers
- 1.5.2 Healthcare Payers
- 1.5.3 Patients
- 1.5.4 Medtech Companies
- 1.5.5 Pharmaceutical & Biotechnology Companies
Chapter 2 Introduction
- 2.1 Report Objectives and Scope
- 2.2 Product Definition and Industry Terminology
- 2.3 Market Inclusions and Exclusions
- 2.4 Research Process
- 2.4.1 Primary Research and Expert Interviews
- 2.4.2 Secondary Research and Source Review
- 2.4.3 Top-Down and Bottom-Up Estimation
- 2.4.4 Data Triangulation and Verification
- 2.5 Market Size Measurement Basis
- 2.5.1 2025: USD 81.10 billion → 2035: USD 358.71 billion
- 2.6 Historical and Forecast Reference Periods
- 2.6.1 Historical Period: 2018-2025
- 2.6.2 Base Year: 2025
- 2.6.3 Forecast Period: 2025-2035
- 2.7 Research Assumptions and Limitations
Chapter 3 Executive Summary
- 3.1 Market Snapshot and Key Findings
- 3.2 Base-Year Market Size, 2025
- 3.3 Forecast Market Size, 2035
- 3.4 Revenue and Volume Growth Outlook
- 3.5 Key Demand and Supply Indicators
- 3.6 Leading Market Segments
- 3.7 Fastest-Growing Market Opportunities
- 3.8 Regional Performance Highlights
- 3.9 Technology and Industry Transformation
- 3.10 Competitive Landscape Summary
- 3.11 Analyst View and Strategic Implications
Chapter 4 Global Telehealth and Telemedicine Market Trends and Developments
- 4.1 Historical Industry Development, 2018-2025
- 4.2 Recent Market Trends and Developments
- 4.3 Demand and Customer Behavior Trends
- 4.4 Technology and Product Innovation
- 4.5 Artificial Intelligence, Automation and Digitalization
- 4.6 Local Manufacturing and Supply Chain Realignment
- 4.7 Industry Partnerships, Mergers and Acquisitions
- 4.8 Sustainability and Circular Economy Developments
- 4.9 Government and Private Sector Investment Trends
- 4.10 Emerging Business Models and Commercialization
- 4.11 Industry Developments and Announcements
Chapter 5 Global Telehealth and Telemedicine Market Production, Supply and Demand Analysis
- 5.1 Demand Trend and Consumption Analysis, 2018-2025
- 5.2 Demand Forecast, 2025-2035
- 5.3 Production and Output Trend, 2018-2025
- 5.4 Production and Output Forecast, 2025-2035
- 5.5 Installed Capacity and Capacity Utilization
- 5.6 Company-Wise Production Plants and Statistics
- 5.6.1 Installed Production Capacity
- 5.6.2 Actual Production
- 5.6.3 Planned Capacity and Expansion Targets
- 5.7 Supply Chain Structure and Procurement Trends
- 5.8 Supply-Demand Gap and Bottlenecks
- 5.9 Import Dependence and Sourcing Structure
- 5.10 Contract Manufacturing and Outsourcing
- 5.11 Regional Supply and Demand Concentration
Chapter 6 Global Telehealth and Telemedicine Market Pricing Analysis
- 6.1 Pricing Structure and Measurement
- 6.2 Historical Pricing Trends, 2018-2025
- 6.3 Pricing Outlook, 2025-2035
- 6.4 Average Selling Price and Unit Economics
- 6.5 Pricing by Product and Market Segment
- 6.6 Geographic Pricing Differences
- 6.7 Key Input, Energy, Labor and Logistics Costs
- 6.8 Contract Pricing and Purchasing Models
- 6.9 Pricing Sensitivity and Competitive Positioning
- 6.10 Price, Margin and Profitability Implications
Chapter 7 Global Telehealth and Telemedicine Market Dynamics
- 7.1 Market Growth Drivers
- 7.1.1 Demand-Side Drivers
- 7.1.2 Technology and Innovation Drivers
- 7.1.3 Infrastructure and Investment Drivers
- 7.1.4 Regulatory and Policy Drivers
- 7.2 Market Restraints
- 7.2.1 Cost and Affordability Constraints
- 7.2.2 Technology and Adoption Barriers
- 7.2.3 Supply Chain and Operational Constraints
- 7.3 Market Challenges
- 7.3.1 Competitive Pressure and Margin Erosion
- 7.3.2 Skills, Infrastructure and Implementation Gaps
- 7.4 Emerging Market Opportunities
- 7.5 Market Dynamics Impact and Time-Horizon Assessment
Chapter 8 Global Telehealth and Telemedicine Value Chain Analysis
- 8.1 Industry Value Chain Overview
- 8.2 Upstream Suppliers and Critical Inputs
- 8.3 Technology and Component Providers
- 8.4 Manufacturing or Service Delivery
- 8.5 Distribution, Channel Partners and Integrators
- 8.6 Downstream Applications and End Users
- 8.7 Value Addition and Profit Pools
- 8.8 Vertical Integration and Outsourcing
- 8.9 Supplier Concentration and Risk
- 8.10 Supply Chain Localization and Resilience
Chapter 9 Global Telehealth and Telemedicine Market Regulations and Policies
- 9.1 Relevant Laws, Standards and Compliance Frameworks
- 9.2 Product, Service, Safety and Quality Requirements
- 9.3 Government Policies, Incentives and Subsidies
- 9.4 Imports, Exports and Trade Barriers
- 9.5 Public Procurement and Local Content Requirements
- 9.6 Environmental and Sustainability Compliance
- 9.7 Upcoming Policy Changes and Market Implications
Chapter 10 Global Telehealth and Telemedicine Market Hotspots and Opportunities
- 10.1 Market Opportunity Mapping and Growth Hotspots
- 10.2 High-Growth Applications and Customer Groups
- 10.3 Underserved Markets and White-Space Opportunities
- 10.4 Emerging Technology and Product Opportunities
- 10.5 New Capacity and Investment Hotspots
- 10.6 Market Entry and Expansion Opportunities
- 10.7 Distribution and Partnership Opportunities
- 10.8 Near-Term and Long-Term Commercial Potential
- 10.9 Opportunity Attractiveness and Execution Risks
Chapter 11 Global Telehealth and Telemedicine Market Outlook, 2025-2035
- 11.1 Market Size and Analysis
- 11.1.1 Revenue (Market Measurement: 2025: USD 81.10 billion → 2035: USD 358.71 billion)
- 11.1.2 Market Volume and Quantity Sold
- 11.1.3 Historical Market Size, 2018-2025
- 11.1.4 Base-Year Market Size, 2025
- 11.2 Market Forecast, 2025-2035
- 11.2.1 Revenue Forecast to 2035
- 11.2.2 Volume Forecast to 2035
- 11.2.3 CAGR and Year-on-Year Growth
- 11.2.4 Incremental Revenue Opportunity
- 11.3 Forecast Assumptions and Scenario Analysis
- 11.3.1 Base-Case Forecast
- 11.3.2 Optimistic and Conservative Scenarios
- 11.3.3 Technology, Pricing and Policy Sensitivities
- 11.4 Market Attractiveness and Growth Outlook
Chapter 12 Global Telehealth and Telemedicine Market Segmentation and Outlook
- 12.1 Segmentation Summary and Market Shares, 2025
- 12.2 Largest and Fastest-Growing Segments
- 12.3 By Component - Market Size and Forecast, 2025-2035
- 12.3.1 Segment Definition and Scope
- 12.3.2 Historical Market Size, 2018-2025
- 12.3.3 Revenue Forecast, 2025-2035
- 12.3.4 Volume Forecast, 2025-2035
- 12.3.5 Base-Year Market Share, 2025
- 12.3.6 Segment CAGR and Growth Drivers
- 12.3.7 Subsegment Market Size and Forecast
- 12.3.7.1 Hardware
- 12.3.7.2 Software
- 12.3.7.3 Services
- 12.3.8 Subsegment Pricing and Adoption Trends
- 12.3.9 Leading Suppliers and Competition
- 12.3.10 Regional Demand and Opportunities
- 12.4 By Function - Market Size and Forecast, 2025-2035
- 12.4.1 Segment Definition and Scope
- 12.4.2 Historical Market Size, 2018-2025
- 12.4.3 Revenue Forecast, 2025-2035
- 12.4.4 Volume Forecast, 2025-2035
- 12.4.5 Base-Year Market Share, 2025
- 12.4.6 Segment CAGR and Growth Drivers
- 12.4.7 Subsegment Market Size and Forecast
- 12.4.7.1 Clinical Care Management
- 12.4.7.2 Preventive Care Management
- 12.4.7.3 Diagnostics & Treatment
- 12.4.7.4 Patient Monitoring
- 12.4.7.5 Analytics & Reporting
- 12.4.7.6 Others
- 12.4.8 Subsegment Pricing and Adoption Trends
- 12.4.9 Leading Suppliers and Competition
- 12.4.10 Regional Demand and Opportunities
- 12.5 By Application - Market Size and Forecast, 2025-2035
- 12.5.1 Segment Definition and Scope
- 12.5.2 Historical Market Size, 2018-2025
- 12.5.3 Revenue Forecast, 2025-2035
- 12.5.4 Volume Forecast, 2025-2035
- 12.5.5 Base-Year Market Share, 2025
- 12.5.6 Segment CAGR and Growth Drivers
- 12.5.7 Subsegment Market Size and Forecast
- 12.5.7.1 Primary Care
- 12.5.7.2 Specialty Care
- 12.5.7.3 Behavioral Health
- 12.5.7.4 Post-acute Care
- 12.5.7.5 Others
- 12.5.8 Subsegment Pricing and Adoption Trends
- 12.5.9 Leading Suppliers and Competition
- 12.5.10 Regional Demand and Opportunities
- 12.6 By End User - Market Size and Forecast, 2025-2035
- 12.6.1 Segment Definition and Scope
- 12.6.2 Historical Market Size, 2018-2025
- 12.6.3 Revenue Forecast, 2025-2035
- 12.6.4 Volume Forecast, 2025-2035
- 12.6.5 Base-Year Market Share, 2025
- 12.6.6 Segment CAGR and Growth Drivers
- 12.6.7 Subsegment Market Size and Forecast
- 12.6.7.1 Healthcare Providers
- 12.6.7.2 Healthcare Payers
- 12.6.7.3 Patients
- 12.6.7.4 Medtech Companies
- 12.6.7.5 Pharmaceutical & Biotechnology Companies
- 12.6.8 Subsegment Pricing and Adoption Trends
- 12.6.9 Leading Suppliers and Competition
- 12.6.10 Regional Demand and Opportunities
- 12.7 Segment Growth Comparison
- 12.8 Segment Attractiveness and Priority Matrix
Chapter 13 Global Telehealth and Telemedicine End-Use and Application Market Outlook
- 13.1 End-Use Industry and Customer Demand Structure
- 13.2 Leading Applications and Customer Groups
- 13.3 End-Use Market Size, Share and Forecast
- 13.4 Major End-Use Industry Deep Dives
- 13.4.1 Customer Requirements and Use Cases
- 13.4.2 Demand and Replacement Cycles
- 13.4.3 Technical and Regulatory Considerations
- 13.4.4 Purchasing and Procurement Models
- 13.4.5 Leading Vendors and Distribution Channels
- 13.4.6 Forecast and Commercial Opportunities
- 13.5 Emerging Applications and Cross-Segment Demand
- 13.6 End-Use Industry Investment Priorities
Chapter 14 Global Telehealth and Telemedicine Geographic Market Outlook, 2025-2035
- 14.1 Regional Market Size and Share, 2025
- 14.2 Regional Market Forecast, 2025-2035
- 14.3 Regional Pricing, Production and Demand Differences
- 14.4 North America
- 14.4.1 United States
- 14.4.2 Canada
- 14.4.3 Mexico
- 14.5 Europe
- 14.5.1 Germany
- 14.5.2 France
- 14.5.3 Italy
- 14.5.4 United Kingdom
- 14.5.5 Spain
- 14.5.6 Poland
- 14.5.7 Russia
- 14.5.8 Netherlands
- 14.5.9 Belgium
- 14.5.10 Sweden
- 14.5.11 Denmark
- 14.5.12 Norway
- 14.5.13 Rest of Europe
- 14.6 Asia Pacific
- 14.6.1 China
- 14.6.2 India
- 14.6.3 Japan
- 14.6.4 South Korea
- 14.6.5 Thailand
- 14.6.6 Indonesia
- 14.6.7 Vietnam
- 14.6.8 Malaysia
- 14.6.9 Australia
- 14.6.10 Rest of Asia Pacific
- 14.7 Latin America
- 14.7.1 Brazil
- 14.7.2 Argentina
- 14.7.3 Colombia
- 14.7.4 Chile
- 14.7.5 Rest of Latin America
- 14.8 Middle East
- 14.8.1 Saudi Arabia
- 14.8.2 United Arab Emirates
- 14.8.3 Turkey
- 14.8.4 Israel
- 14.8.5 Iran
- 14.8.6 Rest of the Middle East
- 14.9 Africa
- 14.9.1 South Africa
- 14.9.2 Egypt
- 14.9.3 Nigeria
- 14.9.4 Morocco
- 14.9.5 Rest of Africa
- 14.10 Regional Investment, Policy and Supply Chain Differences
- 14.11 Regional Competitive Landscape
- 14.12 Geographic Growth Hotspots
Chapter 15 Global Telehealth and Telemedicine Technology, Innovation and Sustainability Outlook
- 15.1 Technology Landscape and Maturity
- 15.2 Product, Process and Service Innovation
- 15.3 AI, Automation and Digital Tools in the Industry
- 15.4 Technology Adoption and Performance Benchmarking
- 15.5 Innovation Pipeline and R&D Investment
- 15.6 Patent and Intellectual Property Trends
- 15.7 Energy Efficiency and Resource Management
- 15.8 Sustainability, Recycling and Circularity
- 15.9 Technology Roadmap, 2025-2035
- 15.10 Risks of Obsolescence and Technology Substitution
Chapter 16 Global Telehealth and Telemedicine Market Key Strategic Imperatives
- 16.1 Growth and Market Entry Priorities
- 16.2 High-Return Products and Segments
- 16.3 Pricing, Profitability and Cost Optimization
- 16.4 Technology Investment and Product Differentiation
- 16.5 Supply Chain Localization and Resilience
- 16.6 Distribution and Customer Acquisition
- 16.7 Partnership, Acquisition and Capacity Strategy
- 16.8 Regional Expansion Priorities
- 16.9 Short-, Medium- and Long-Term Actions
Chapter 17 Competition Outlook
- 17.1 Industry Competition Characteristics
- 17.2 Market Structure and Concentration
- 17.3 Market Share and Competitive Positioning, 2025
- 17.4 Company-Wise Revenue and Product Benchmarking
- 17.5 Production and Service Capacity Benchmarking
- 17.6 Technology, Pricing and Differentiation
- 17.7 Regional Footprint and Distribution Strength
- 17.8 Mergers, Acquisitions and Strategic Alliances
- 17.9 New Entrants and Competitive Threats
- 17.10 Porter's Five Forces and Industry Attractiveness
- 17.11 Competitive Outlook, 2025-2035
Chapter 18 Company Profiles
- 18.1 Company Coverage and Selection Criteria
- 18.2 AT&T
- 18.2.1 Business Description
- 18.2.2 Company Ownership and Geographic Presence
- 18.2.3 Product and Service Portfolio
- 18.2.4 Manufacturing and Operating Footprint
- 18.2.5 Production Capacity and Expansion Plans
- 18.2.6 Financial Performance and Investment
- 18.2.7 Market Share and Competitive Position
- 18.2.8 Technology and Innovation Capabilities
- 18.2.9 Strategic Alliances or Partnerships
- 18.2.10 Recent Developments
- 18.2.11 Growth Strategy and Outlook
- 18.3 Philips Healthcare
- 18.4 GE Healthcare
- 18.5 Medtronic
- 18.6 Teladoc Health
- 18.7 Amwell
- 18.8 Zoom Video Communications
- 18.9 MDLIVE
- 18.10 doxy.me
- 18.11 VSee
- 18.12 Care Simple
- 18.13 Timedoc Health
- 18.14 Kindbody
- 18.15 Other Relevant Market Participants
Note: Every listed company is profiled on the structure shown under the first company. The company list is preliminary and may change based on research findings, market developments, data availability and client requirements.
Chapter 19 Disclaimer
- 19.1 Research and Forecast Disclaimer
- 19.2 Data Source and Estimation Limitations
Note: The depth of individual sections depends on data availability for this market. Volume, capacity, trade and other unit-based metrics are included where applicable.

