
Regulated sectors move decisions onto data and AI tools
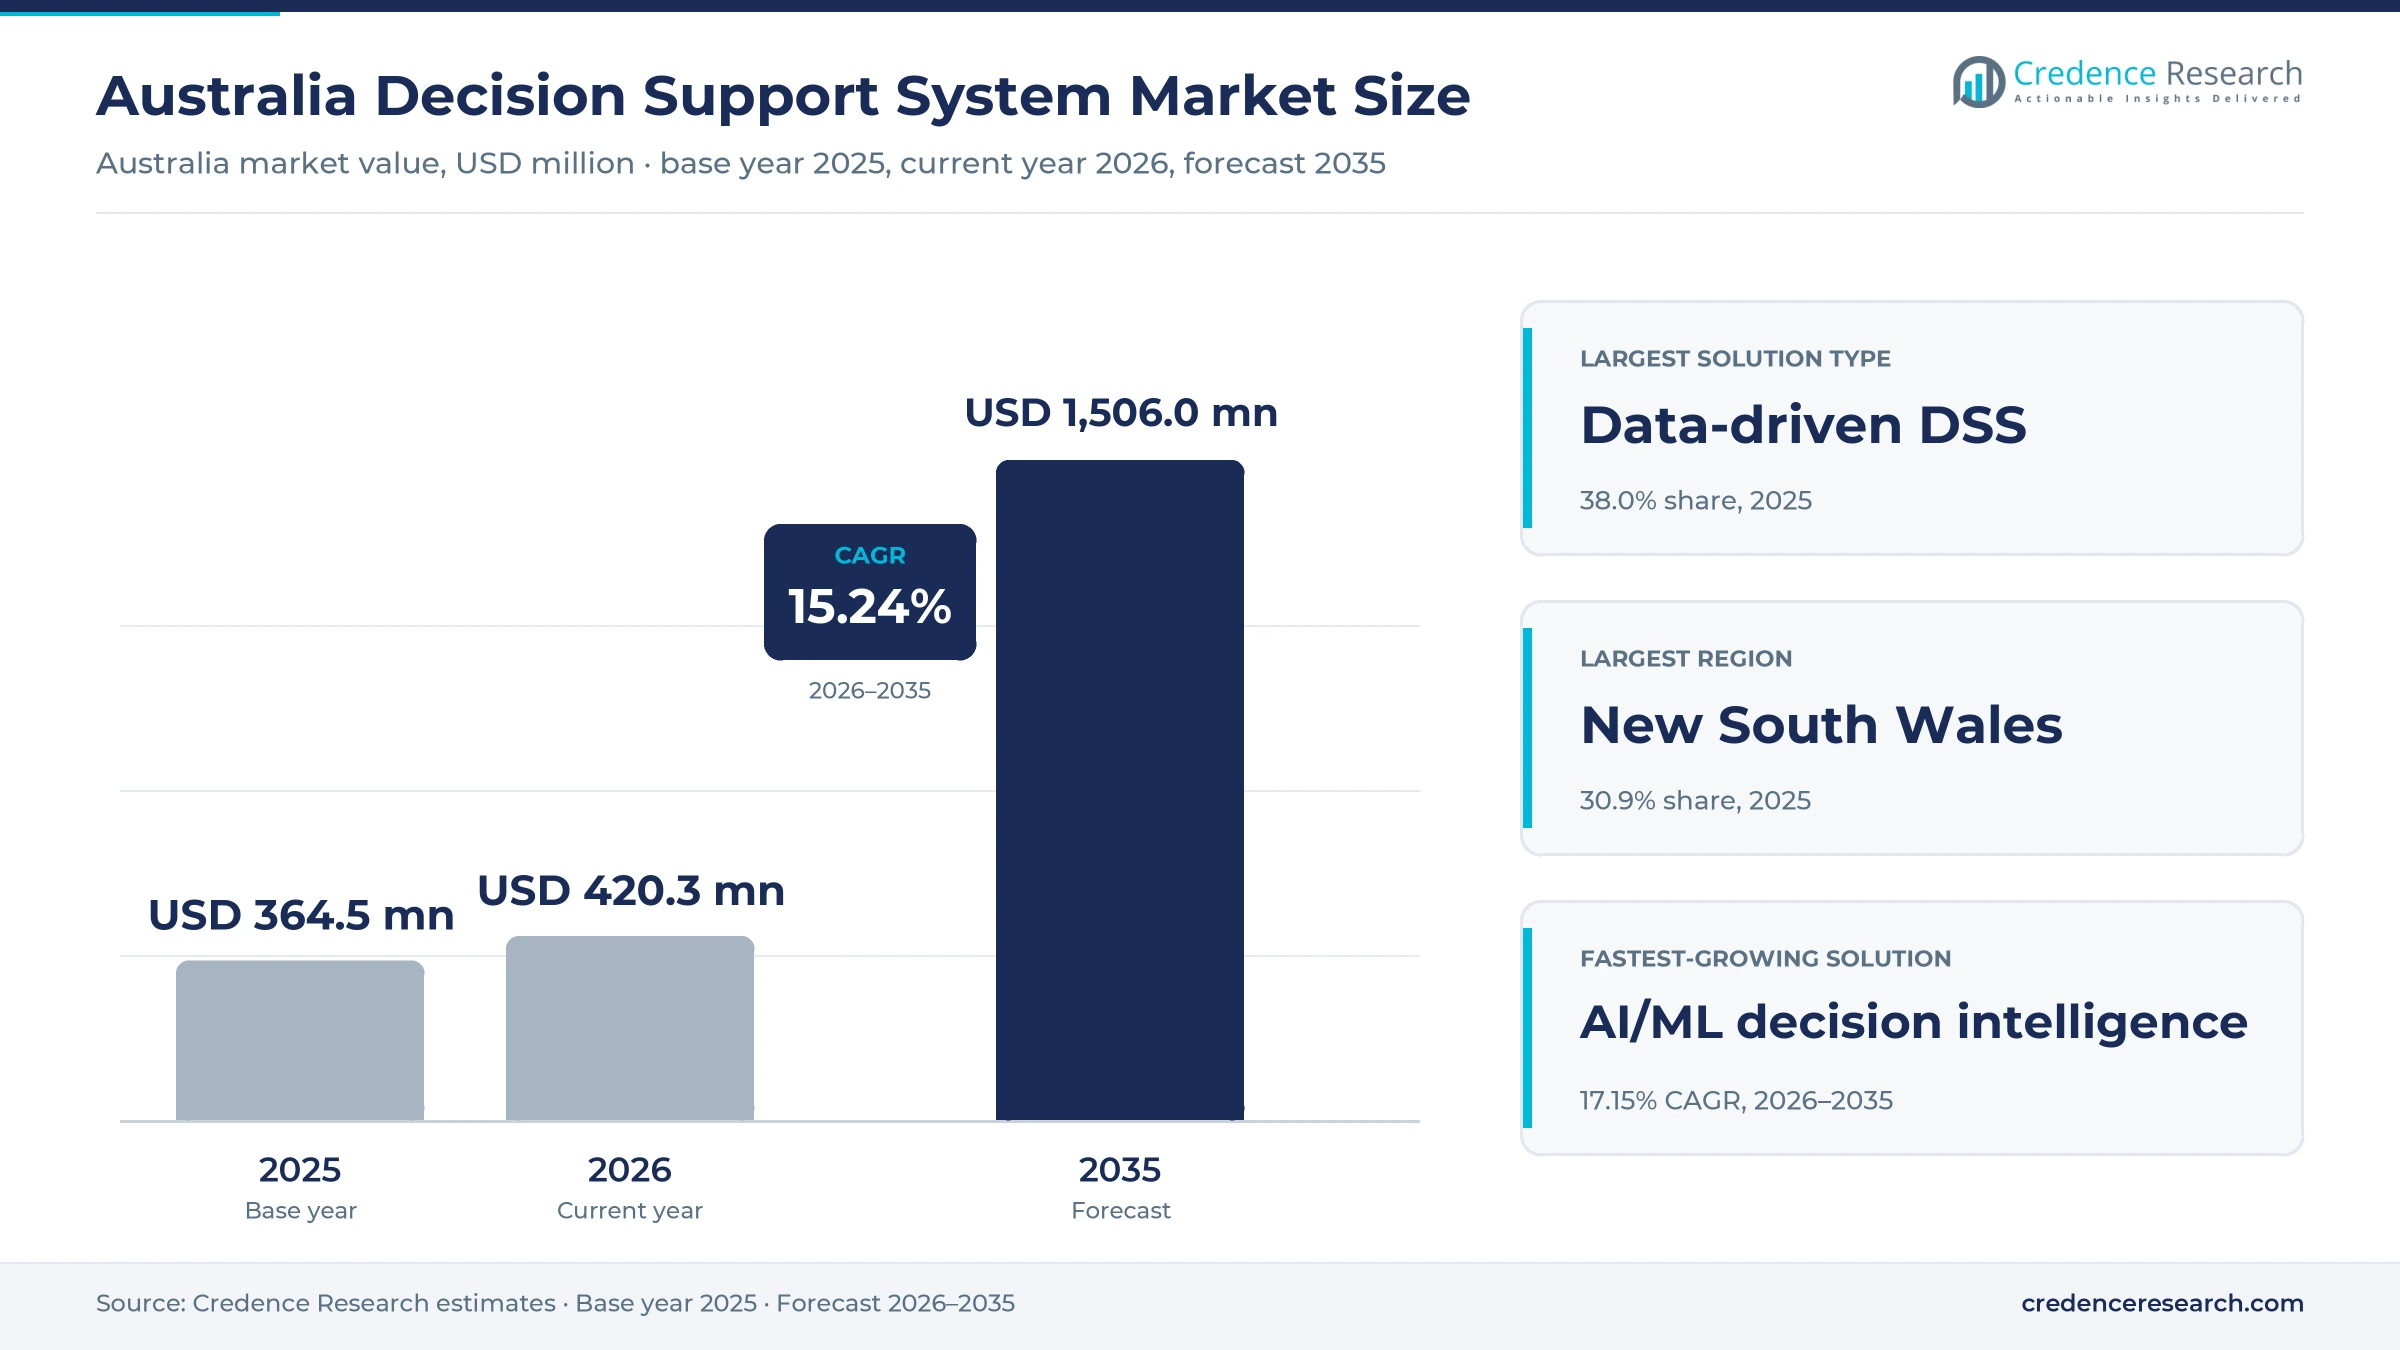
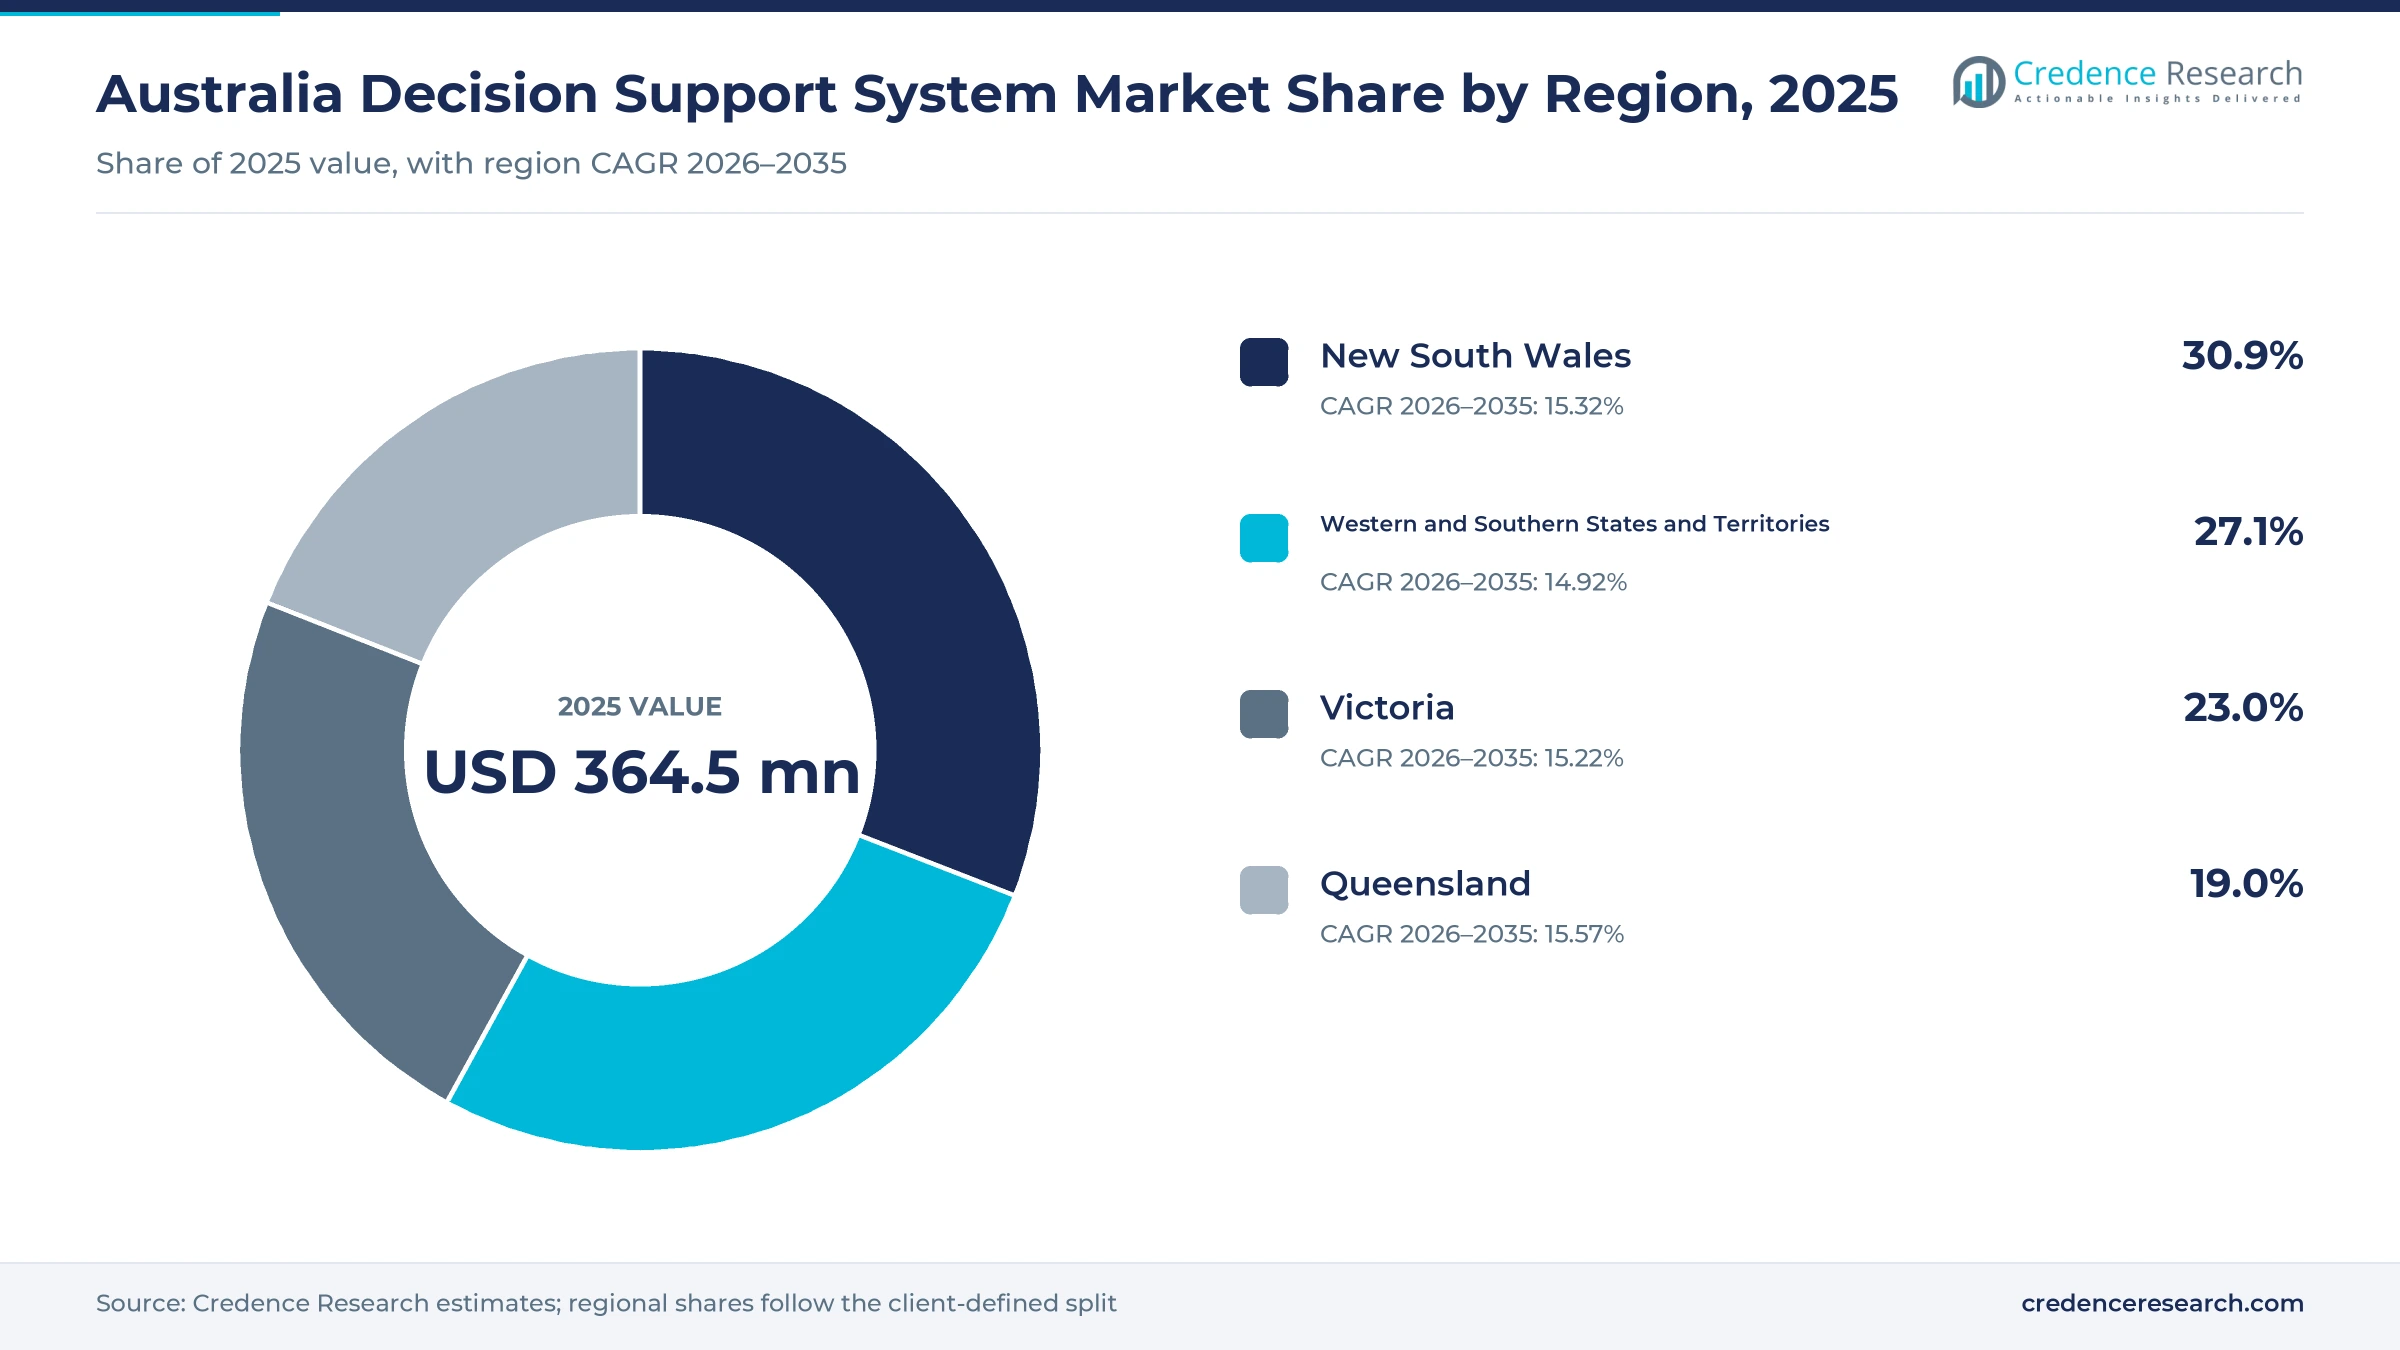
The Australia decision support system market was valued at USD 364.5 million in 2025 and is projected to increase from USD 420.3 million in 2026 to USD 1.51 billion by 2035, registering a CAGR of 15.24% during 2026–2035. Demand comes from banks, insurers, hospitals, government agencies and miners that are moving credit, fraud, clinical, planning and service decisions onto data platforms and machine learning models. New South Wales held the largest regional share, 30.9% in 2025, because Sydney hosts the head offices of most major banks, insurers and federal technology buyers. Queensland is the fastest-growing region at 15.57% a year, supported by the strongest state output growth of 2024-25 and a large public-service base already using generative AI tools. In turn, regulation is now a direct spending trigger, because privacy policies must describe automated decisions that significantly affect individuals from Dec. 10, 2026, and prudential operational risk rules for banks and insurers took effect on July 1, 2025.
Which decision tools does the Australian estimate count?
The estimate measures spending by Australian banks, insurers, health services, government agencies, miners and other enterprises on software that turns data, models and rules into recommendations or automated choices. It counts subscription, usage, license, maintenance, implementation and managed service fees for data-driven, model-driven, knowledge-driven and AI-driven decision tools, whether hosted in the cloud, on premises or in a hybrid setup.
The estimate excludes general office software, basic reporting dashboards that make no recommendation, hardware and data center construction. The value chain runs from global cloud and analytics vendors through local integrators and consultancies to bank risk teams, hospital clinical units, agency service centers and mine operations rooms, where staff act on or override the recommendations the tools produce.
Australia Decision Support System Market Insights
- The Australia decision support system market was valued at USD 364.5 million in 2025 and is projected to reach USD 1.51 billion by 2035, registering a CAGR of 15.24% during 2026–2035.
- New South Wales held a 30.9% share of 2025 value, because Sydney concentrates bank, insurer and federal technology buying.
- Data-Driven DSS led with a 38.0% share of 2025 value, as reporting, scoring and alerting tools remain the most common installed base.
- Australian business use of AI reached about 12% in 2024-25, and large businesses reached about 35%, according to national statistics released in June 2026.
- AI/ML-Driven Decision Intelligence grows fastest at 17.15% a year during 2026–2035, as agents and predictive models move into regulated workflows.
Data-driven tools lead while AI decision intelligence surges
Why do data-driven tools still hold the largest share?
Based on solution type, the market is categorized into Data-Driven DSS, AI/ML-Driven Decision Intelligence, Model-Driven DSS and Knowledge/Document-Driven DSS. Data-Driven DSS led with a 38.0% share of 2025 value, because scoring, alerting and analytics tools sit inside most bank, agency and hospital workflows. AI/ML-Driven Decision Intelligence grows fastest at 17.15% a year, as buyers add predictive models and AI agents on top of existing data platforms.
How do cloud and on-premise deployments split spending?
Based on deployment model, the market is categorized into Cloud/SaaS, On-Premise and Hybrid. Cloud/SaaS led with a 52.0% share of 2025 value, because vendors now release new models and agents first on hosted platforms in Sydney and Melbourne. Cloud/SaaS grows fastest at 16.03% a year, as agencies and banks move workloads onto locally hosted, security-assessed services that are often delivered with cloud migration and integration services.
Which industries fund most decision tool purchases?
Based on end-use industry, the market is categorized into Financial Services, Healthcare, Government and Public Sector, and Resources and Enterprise Operations. Financial Services led with a 34.0% share of 2025 value, because credit, fraud, pricing and scam controls run on automated scoring. Healthcare grows fastest at 16.17% a year, as hospitals test AI triage and add guideline prompts to digital records.
Which applications carry the most decision tool value?
Based on application, the market is categorized into Financial and Customer Decisioning, Clinical Decision Support, Operational Planning and Optimisation, and Public-Service and Strategic Decisioning. Financial and Customer Decisioning led with a 36.0% share of 2025 value, because lenders and retailers pair credit models with customer journey analytics. Clinical Decision Support grows fastest at 16.19% a year, as triage and deterioration models move from pilots into wards.
| Segment Group | Leading Sub-segment | Share, 2025 | Fastest-growing Sub-segment | CAGR, 2026–2035 |
|---|---|---|---|---|
| By Solution Type | Data-Driven DSS | 38.0% | AI/ML-Driven Decision Intelligence | 17.15% |
| By Deployment Model | Cloud/SaaS | 52.0% | Cloud/SaaS | 16.03% |
| By End-Use Industry | Financial Services | 34.0% | Healthcare | 16.17% |
| By Application | Financial and Customer Decisioning | 36.0% | Clinical Decision Support | 16.19% |
Request a Free Sample
Fill in your details and we'll send you a free sample report.
- Sample data tables & charts
- Research methodology
AI adoption, prudential rules and clinical AI lift demand
How does embedded decision intelligence widen the buyer base?
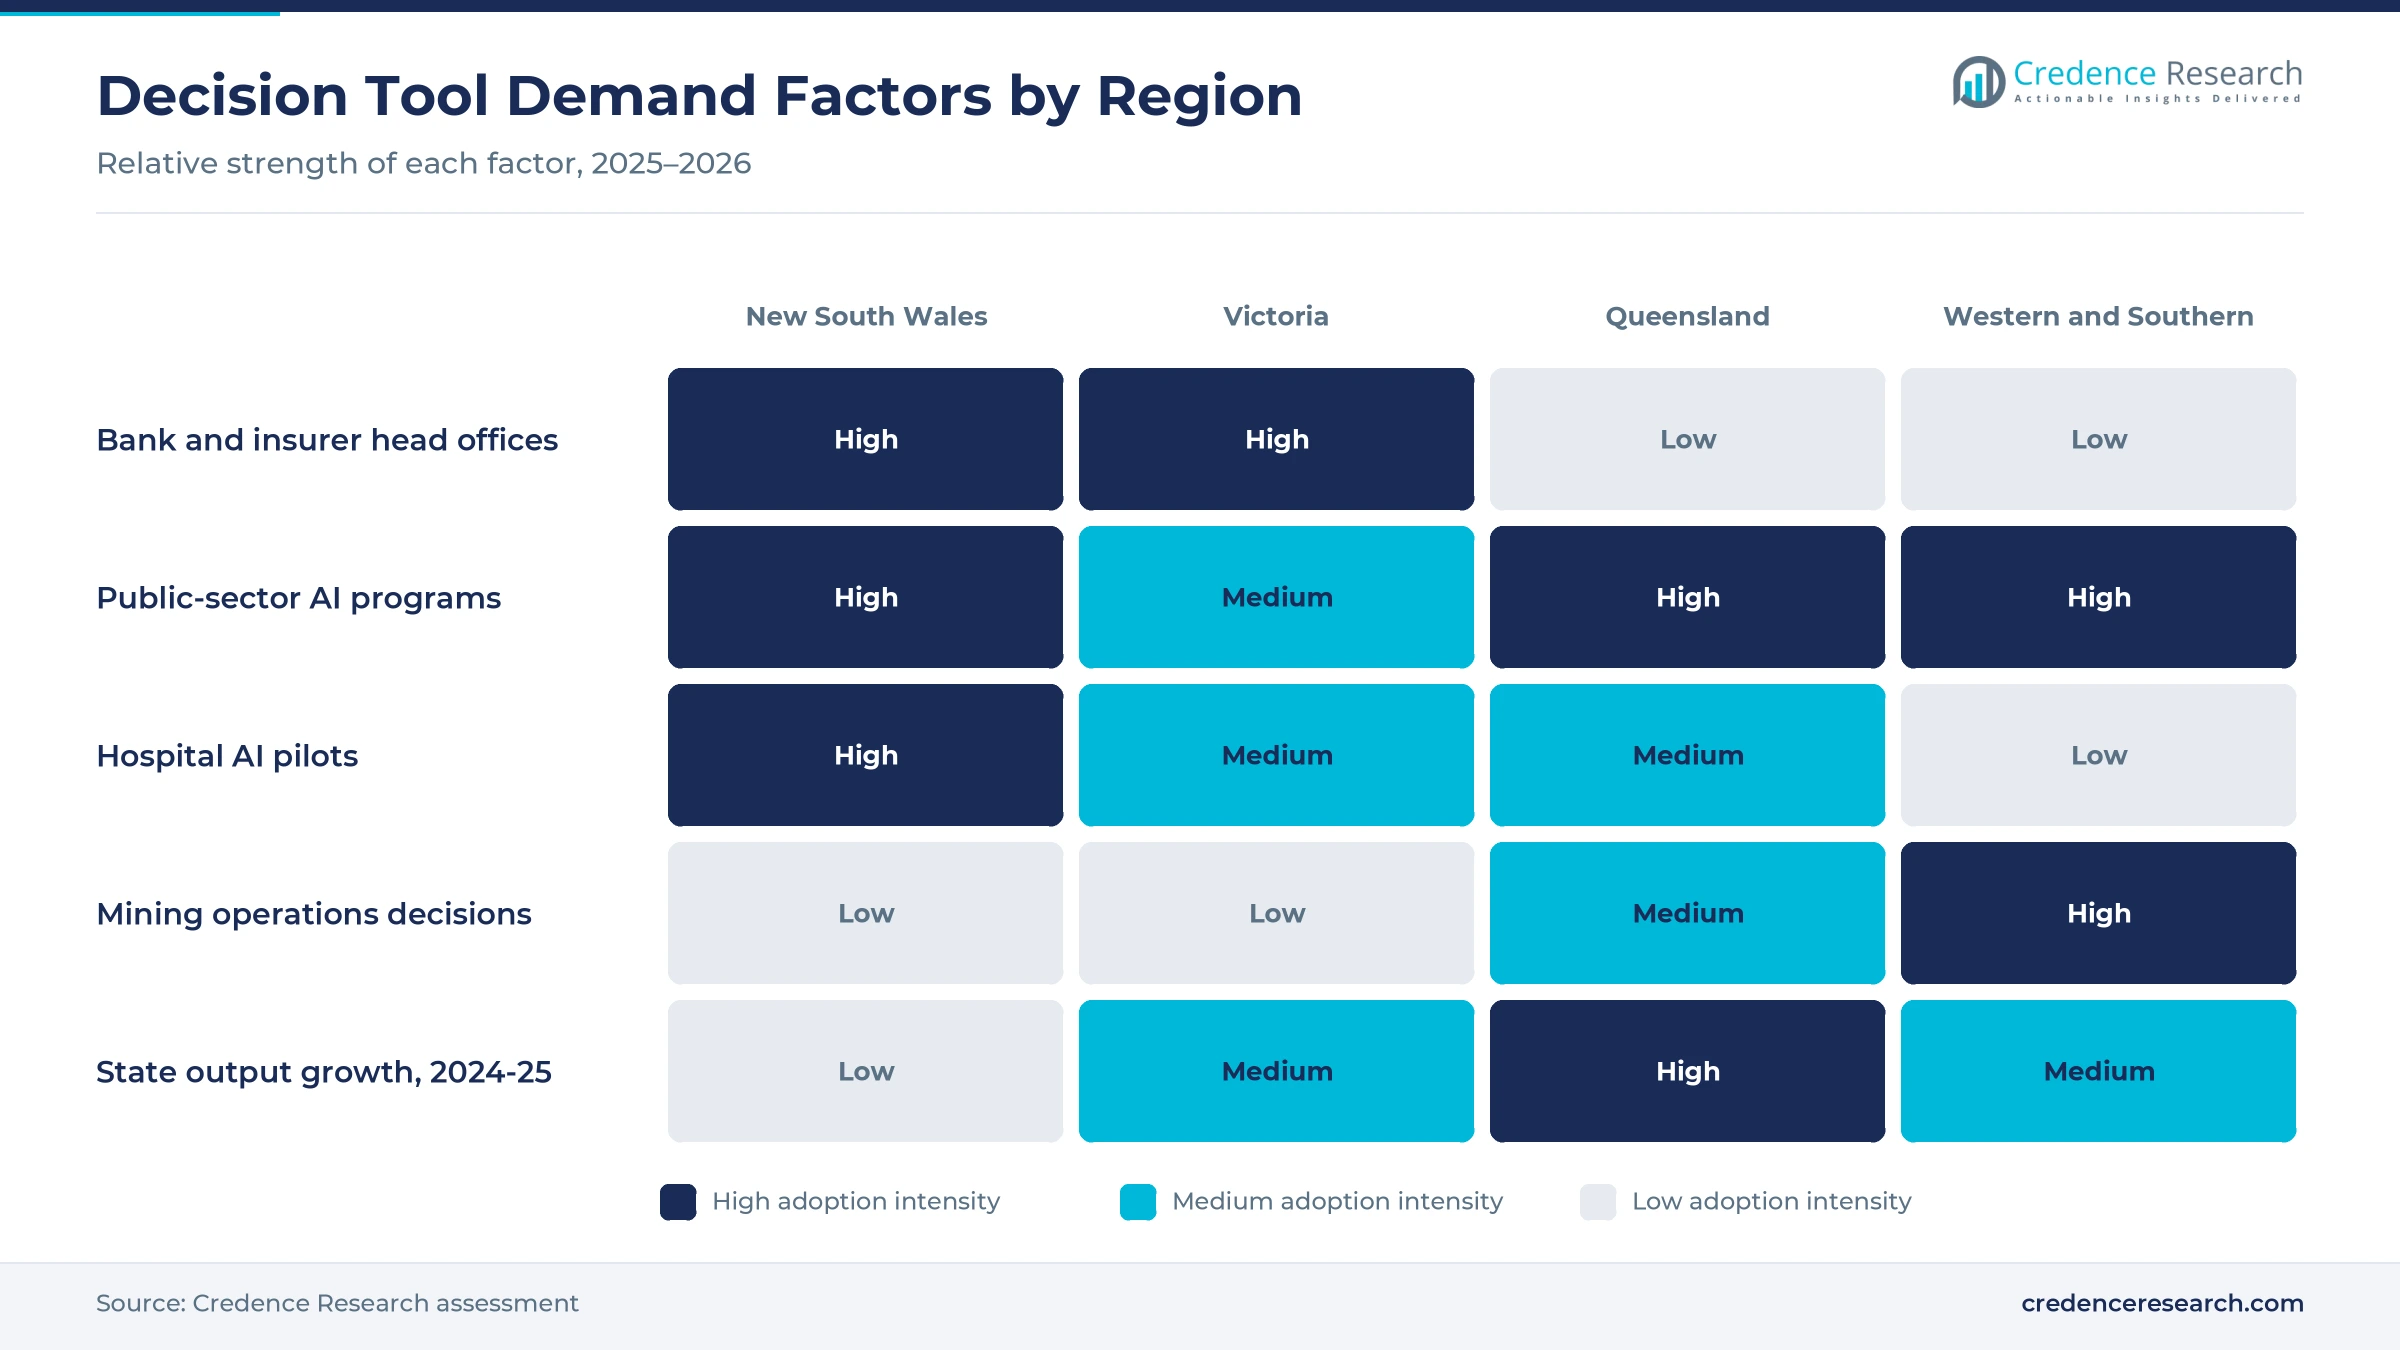
Vendors now build recommendations and AI agents into the CRM, ERP and analytics software that firms already license, which turns decision tools into a standard feature rather than a separate project. About 12% of Australian businesses used AI in 2024-25, rising to about 35% of large businesses and 24% of financial and insurance firms, according to the Australian Bureau of Statistics. Salesforce named Medibank, Telstra and ANZ Bank among its customers at its Agentforce event in Melbourne on June 25, 2025, and El Jannah said its service agent had handled more than 1,000 customer queries alone. As a result, AI/ML-Driven Decision Intelligence grows fastest at 17.15% a year during 2026–2035.
Why do prudential and conduct rules force decision upgrades?
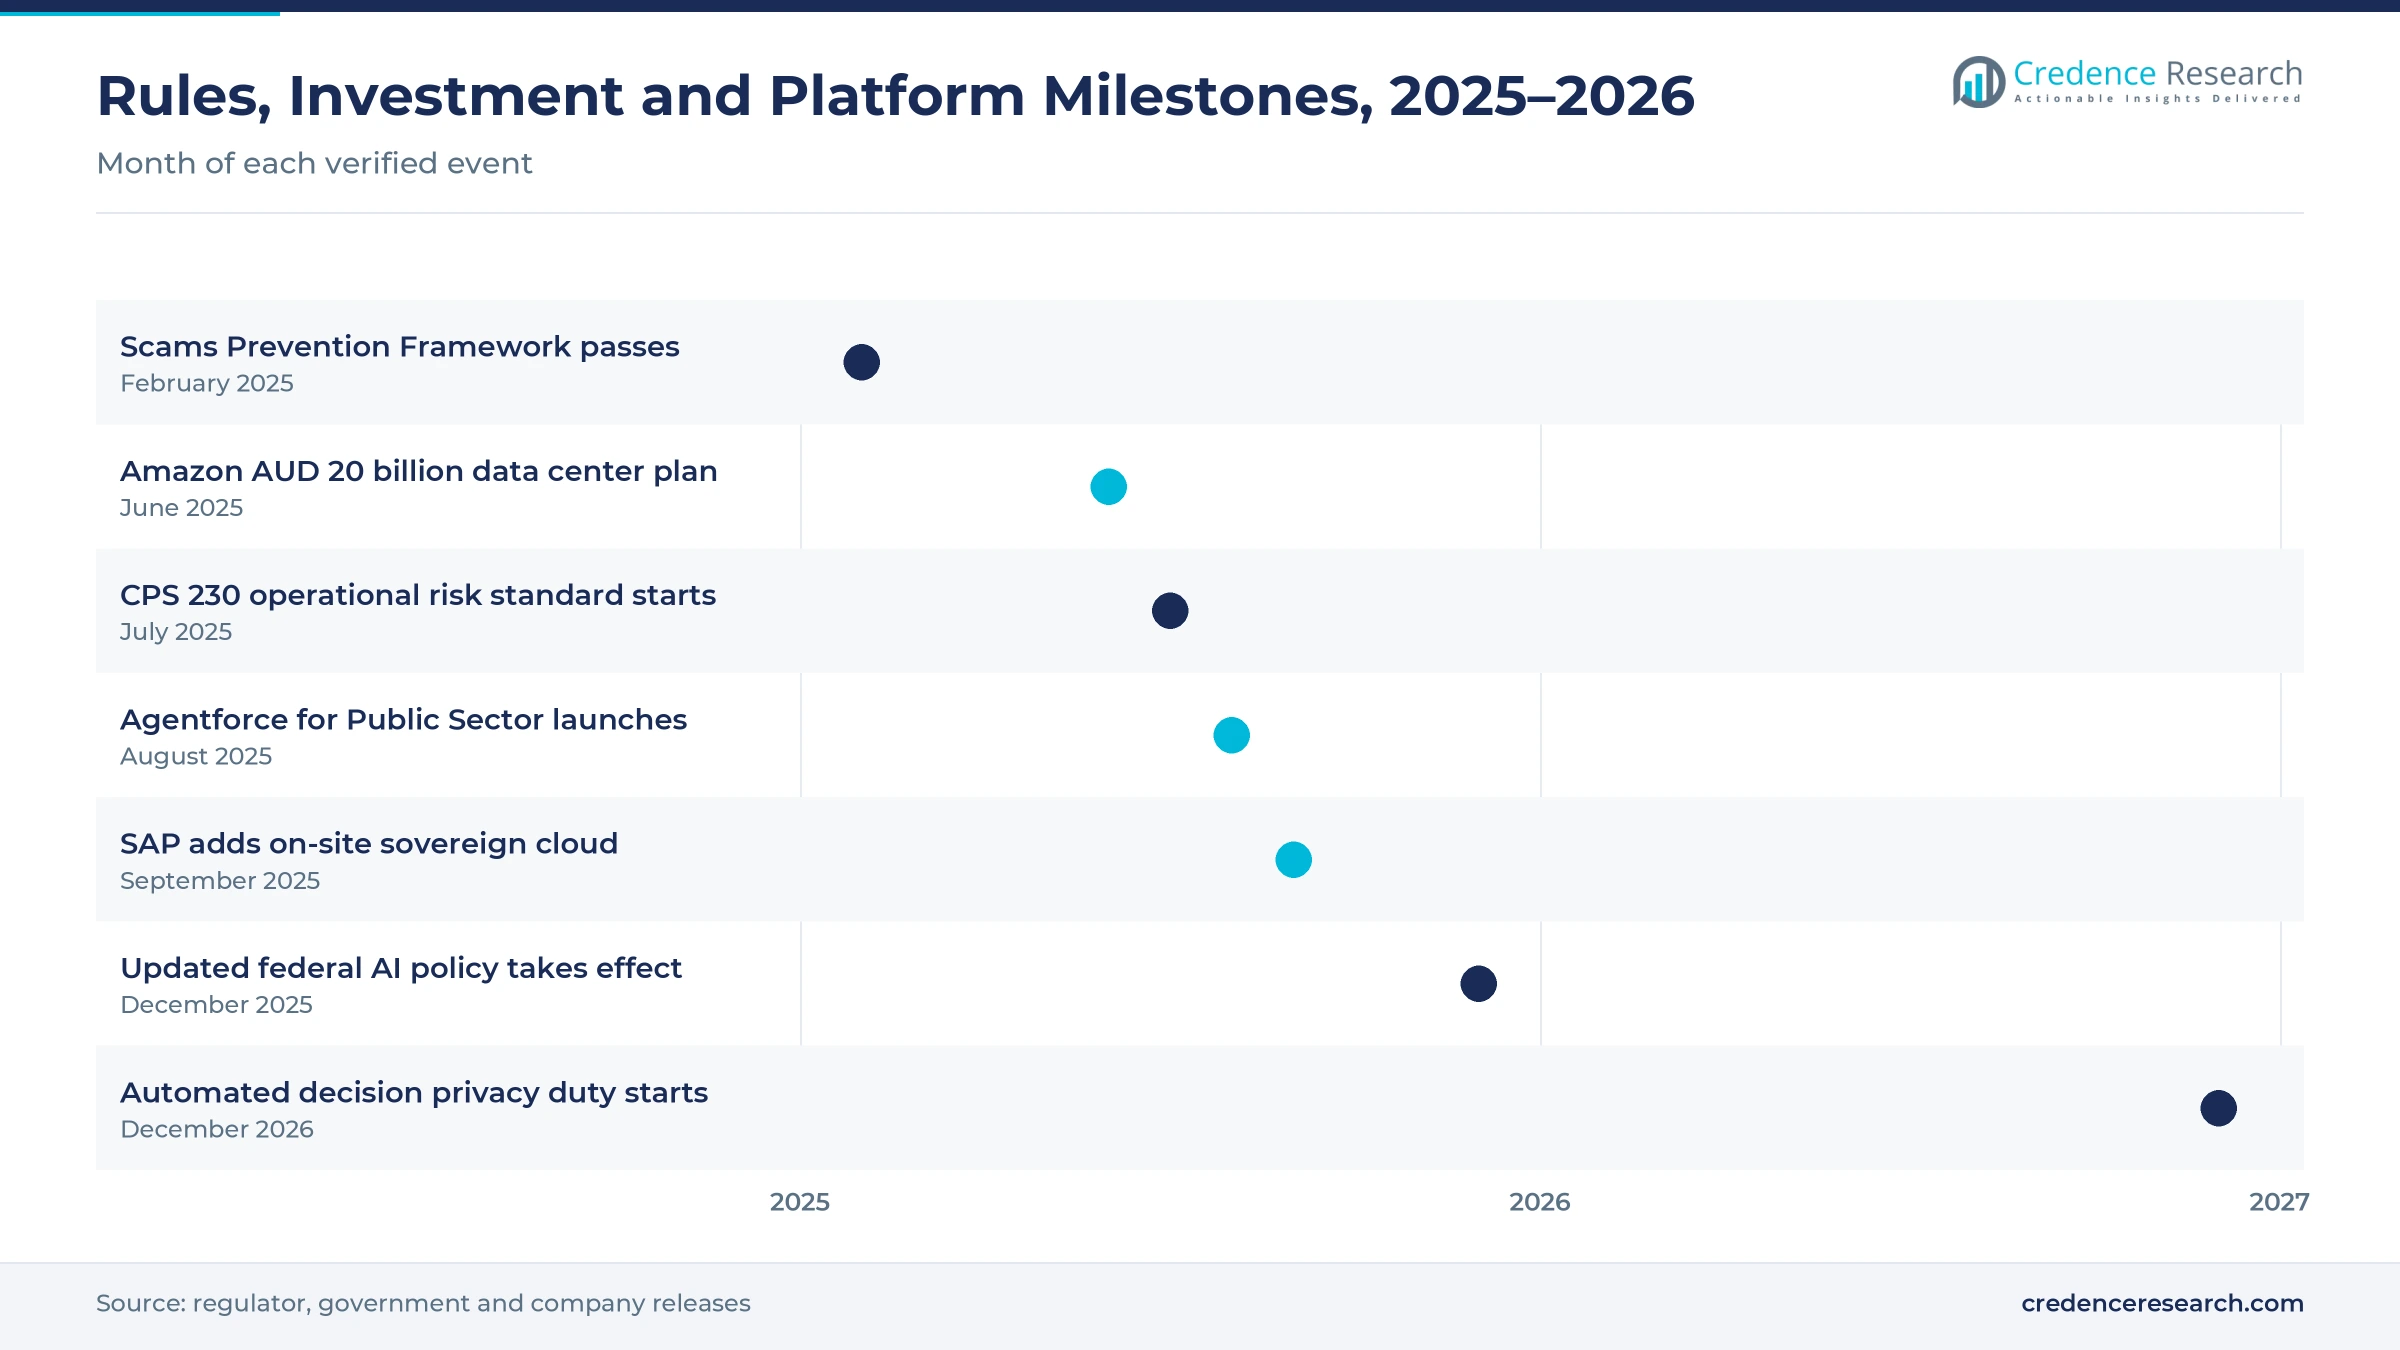
Banks, insurers and other regulated lenders must now prove that automated decisions are controlled, tested and resilient, which pushes them toward governed decision platforms. The operational risk standard CPS 230 took effect on July 1, 2025, with new rules on controls, continuity and service providers, according to the Australian Prudential Regulation Authority. The securities regulator ASIC reviewed 624 AI use cases at 23 licensees and found that 61% planned to increase AI use within 12 months. Parliament also passed the Scams Prevention Framework on Feb. 13, 2025, requiring banks to prevent, detect and disrupt scams, according to Gilbert + Tobin. In turn, financial services holds 34.0% of 2025 decision tool value.
How do connected clinical workflows lift hospital demand?
Hospitals now feed digital record data into triage, deterioration and prescribing prompts, which turns clinical decision tools into part of routine care. The Therapeutic Goods Administration exempts some guideline-based software from listing, but AI-enabled tools whose logic cannot be verified must be registered as medical devices. NSW Health clinicians built the SAFE-WAIT sepsis model, which helped Westmead patients receive antibiotics 83 minutes earlier on average and is moving to five western Sydney hospitals, according to Cyber Daily. The national safety commission issued AI clinical use guidance on Aug. 14, 2025, according to Pharmacy Daily. As a result, Clinical Decision Support grows at 16.19% a year alongside spending on e-health platforms.
Why does public-sector AI policy open agency budgets?
Federal and state governments now require agencies to plan, register and assess AI use, which creates funded programs for governed decision tools. An updated policy for responsible AI use took effect on Dec. 15, 2025, requiring an accountable officer, an internal register and an impact assessment for each use case, according to the Digital Transformation Agency. The AI Plan for the Australian Public Service, released on Nov. 12, 2025, set out 15 initiatives, including Chief AI Officers and foundational training. Queensland reported more than 14,000 public servants across 18 agencies using its QChat assistant in May 2025, according to iTnews. In turn, government and public sector buyers keep funding governed tools for casework, eligibility and planning.
Agentic AI, sovereign hosting and explainability emerge
How is the rise of AI agents changing decision workflows?
Decision tools are shifting from dashboards that advise staff toward AI agents that complete parts of a task within set limits, which raises the value of each deployment. Salesforce launched Agentforce for Public Sector in Australia on Aug. 28, 2025, with compliance, complaint and recruitment agents, and said Agentforce had reached PROTECTED status under the government security assessment program, according to IT Brief Australia. ASIC found that generative AI made up 22% of licensee use cases still in development, compared with 5% in production. Roy Hill uses AI on Microsoft Azure to predict equipment failures and plan production schedules for its Pilbara mine, according to AI Magazine. As a result, AI-driven tools win a growing share of new budgets.
Why are buyers shifting to sovereign, locally hosted platforms?
Agencies, banks and hospitals increasingly want decision models and their data kept onshore under Australian security assessments, which shifts purchases toward local cloud regions. Amazon announced on June 14, 2025, that it would invest AUD 20 billion in Australian data centers from 2025 to 2029. Microsoft committed AUD 5 billion in October 2023 to grow its local footprint from 20 to 29 data centers, according to W.Media. SAP added on-site sovereign cloud hosting in Australia on Sept. 3, 2025, and scheduled Business Data Cloud and AI services for 2026, according to SAP. In turn, growth in hyperscale data center capacity helps Cloud/SaaS hold 52.0% of 2025 value.
Can explainable automation tools open a compliance niche?
New transparency duties give vendors a clear opening to sell tools that log, explain and contest automated choices about individuals. From Dec. 10, 2026, entities bound by the Australian Privacy Principles must explain in their privacy policies how computer programs make or inform decisions that could significantly affect individuals, according to the Office of the Australian Information Commissioner. ASIC found that none of the 23 licensees it reviewed had contestability arrangements for AI decisions. The Robodebt Royal Commission also recommended a consistent legal framework for automation in government services, which the government agreed in principle, according to the AusPubLaw blog. As a result, audit, explanation and model governance modules become a separate buying line for banks and agencies.
Is there room for affordable decision tools for smaller firms?
Smaller firms use AI far less than large ones, which leaves a wide opening for packaged, low-cost decision tools sold by subscription. Small and micro businesses had AI adoption of about 11% in 2024-25, against about 35% for large businesses, according to national statistics. The National AI Plan of December 2025 lists AUD 17 million for the AI Adopt Program for SMEs and reports that 29% of regional organizations are adopting AI, compared with 40% in metropolitan areas. Internet use already reached about 96% of Australians in 2024, according to World Bank data, so access is not the constraint. In turn, subscription and usage-based software gains as smaller buyers sign up online.
Skills, data quality and automation trust test buyers
How do skills and data quality limit returns?
Decision tools only work when firms have clean data and staff who can test, tune and challenge models. ASIC found that 30% of licensee AI use cases relied on models built by third parties, which makes internal checks harder. As a result, many buyers stall after pilots because results cannot be explained or trusted. Firms respond by funding data cleanup, model validation teams and managed services before they scale tools across business units.
Why does the legacy of Robodebt slow public automation?
The Robodebt Royal Commission showed how an automated debt process could harm citizens, which still shapes how agencies approach automation. Agencies now face impact assessments, registers and accountable officers for each AI use case before deployment. In turn, procurement cycles lengthen and some projects stay advisory rather than automated. Vendors respond by stressing human review, audit trails and explainable rules in their public-sector offers.
How do privacy and cyber duties raise deployment costs?
Decision tools draw on personal, financial and health data, which makes every new integration a privacy and security risk. Privacy policies must disclose automated decisions from Dec. 10, 2026, and prudential rules now require tested controls over material service providers. As a result, buyers add security reviews, data mapping and legal work to each contract, which slows go-lives. Larger vendors respond with locally hosted, security-assessed services that shorten agency and bank approvals.
Why do medical device rules slow clinical AI?
Clinical tools that rely on AI or cannot show transparent logic must be registered with the medicines regulator before supply in Australia. That requirement adds evidence, documentation and post-market reporting costs for developers. In turn, many hospital tools remain in pilots or research evaluations for years, such as the sepsis model that faces a two-and-a-half-year evaluation from 2027. Developers respond by starting with guideline-based prompts that can qualify for exemption.
New South Wales leads as Queensland grows fastest
| Region | Value, 2025 (USD million) | Share, 2025 | CAGR, 2026–2035 |
|---|---|---|---|
| New South Wales | 112.6 | 30.9% | 15.32% |
| Western and Southern States and Territories | 98.8 | 27.1% | 14.92% |
| Victoria | 83.8 | 23.0% | 15.22% |
| Queensland | 69.3 | 19.0% | 15.57% |
New South Wales leads as banks and hospitals adopt AI tools
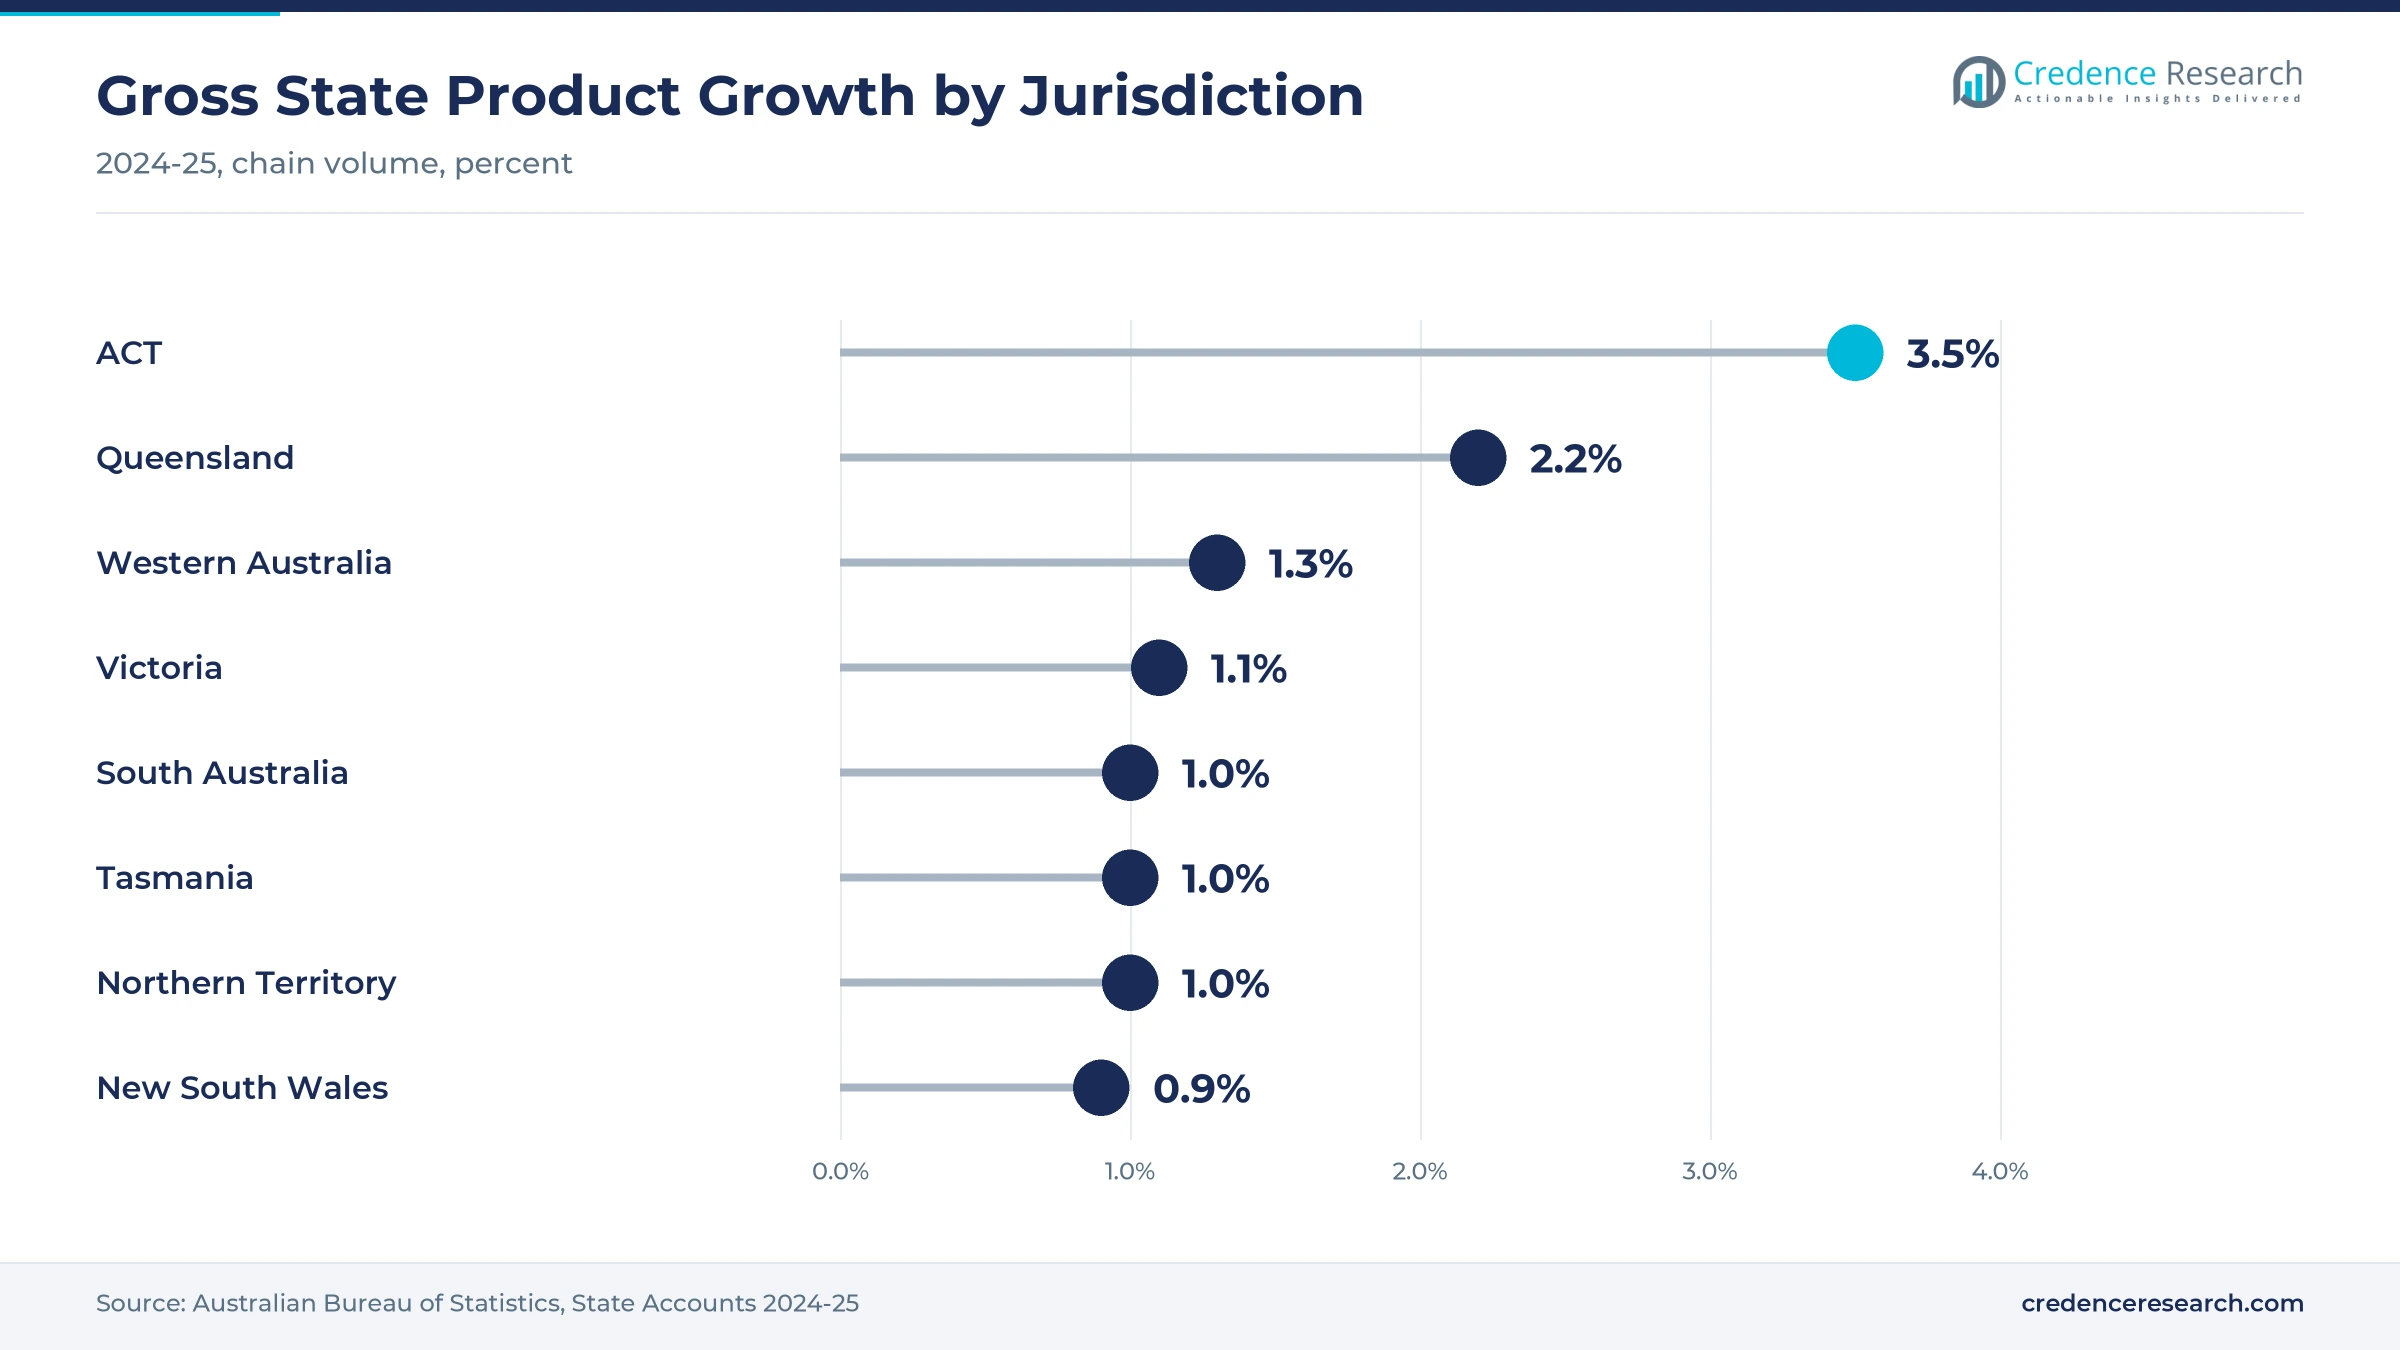
New South Wales held a 30.9% share of 2025 value and grows at 15.32% a year, because Sydney hosts the head offices of most major banks and insurers. State output rose 0.9% in 2024-25, and financial and insurance services grew 3.8%, according to the Australian Bureau of Statistics. NSW Health is also moving its SAFE-WAIT sepsis model into five western Sydney hospitals. As a result, the state leads in both financial decisioning and clinical decision support for buyers in New South Wales.
How do state contracts shape demand in Victoria?
Victoria held a 23.0% share of 2025 value and grows at 15.22% a year, supported by Melbourne insurers, energy retailers and a large state public service. State output rose 1.1% in 2024-25, with financial and insurance services up 2.6%. Salesforce renewed its Victorian Government State Purchase Contract for three years and plans a larger Melbourne office by mid-2026. In turn, cloud customer and public-service decision tools carry most new spending.
Why does Queensland grow fastest among the regions?
Queensland held a 19.0% share of 2025 value and grows fastest at 15.57% a year. State output rose 2.2% in 2024-25, the strongest result of any state, according to the Australian Bureau of Statistics. The state government also reported more than 14,000 public servants using its QChat assistant, built on Azure OpenAI, by May 2025. As a result, agencies that already use generative AI are moving toward governed decision tools for casework and planning.
How do mining and Canberra shape the western and southern states?
Western and Southern States and Territories held a 27.1% share of 2025 value and grow at 14.92% a year. The Australian Capital Territory grew 3.5% in 2024-25, the fastest of any jurisdiction, while Western Australia grew 1.3%. Roy Hill runs its Pilbara mine, rail and port from a Perth operations center more than 1,200 km away. In turn, federal agencies in Canberra and Pilbara miners drive planning and optimization spending here.
Cloud, sovereign hosting and public-sector AI moves, 2025
| Development | Status and market relevance |
|---|---|
| In June 2025, Amazon announced AUD 20 billion of investment in Australian data centers for 2025 to 2029. | Expands local capacity for hosted analytics and AI models |
| In June 2025, Salesforce showed Agentforce deployments by Australian firms at its Melbourne World Tour event. | Brings AI agents into customer service decisions |
| In August 2025, Salesforce launched Agentforce for Public Sector in Australia with PROTECTED security status. | Opens agency casework and complaint decisions to AI agents |
| In September 2025, SAP added on-site sovereign cloud hosting in Australia for public-sector and defense buyers. | Keeps planning and analytics data onshore |
| In December 2025, the updated federal policy for responsible AI use took effect for government agencies. | Requires registers and impact assessments for each AI use case |
Rules engines, ML models and AI agents shape choices
- Rules engines and scorecards encode credit, eligibility and clinical guidelines in transparent logic, which lets banks, agencies and hospitals explain each outcome to regulators and customers.
- Machine learning models predict default, fraud, sepsis risk or equipment failure from past data, which gives staff earlier warnings but requires validation and monitoring.
- AI agents read documents, draft responses and complete parts of a task within set limits, which raises productivity while bringing new privacy and accountability duties.
Need a Custom Version of This Report?
Tailor the scope, geography, or segments to your exact requirements.
- Custom geography or segment scope
- Direct access to our analyst team
Cloud platforms and analytics specialists split the field
Competition is split between global cloud platforms that embed decision tools in wider suites and analytics specialists that sell modeling and risk software. Microsoft supplies Azure and Copilot tools to buyers such as Colonial First State, which signed a five-year agreement in July 2024, and Queensland built QChat on Azure OpenAI. Salesforce sells Agentforce to banks, insurers and agencies, while SAP offers analytics and planning tools from an Australian sovereign cloud. SAS serves banks with risk modeling and fraud detection and insurers with actuarial analysis, according to iTWire. IBM made its watsonx platform available from its Sydney data center in November 2024, and Amazon Web Services hosts many third-party decision tools. Rivals compete on local hosting, security assessments, model governance and integration with core systems, which favors vendors with strong regulated-industry references.
Which companies supply decision tools in Australia?
| Company | Type | Role in the market |
|---|---|---|
| Microsoft | Cloud and AI platform | Azure and Copilot, five-year agreement with Colonial First State |
| Salesforce | CRM and AI agent platform | Agentforce for Public Sector with PROTECTED status |
| SAP | Enterprise software group | Analytics and planning from Australian sovereign cloud |
| SAS | Analytics specialist | Risk modeling and fraud detection for banks |
| IBM | AI and software group | Watsonx available from its Sydney data center |
| Amazon Web Services | Cloud platform | AUD 20 billion data center program, 2025 to 2029 |
Regulation turns decision tools into core infrastructure
Credence Research's view is that the Australia decision support system market will grow quickly because regulators are turning automated decisions into a governed, auditable activity. Data-driven tools remain the largest value pool, but AI/ML-Driven Decision Intelligence and Clinical Decision Support add the fastest growth. Vendors that combine local hosting, security assessments and explainable models should gain share with banks and agencies. Weak data, scarce skills and medical device rules will slow some deployments, especially in hospitals.
Model built from adoption statistics and program records
The report uses 2025 as the base year on a calendar basis, and market values come from the Credence Research model. That model draws on national AI adoption statistics, state output data, regulator standards and guidance, government policy releases and company announcements on investments, launches and contracts. Segment splits and regional growth rates are Credence Research estimates, while regional shares follow the client-defined split. Sources used are official statistics, regulator releases, government documents, trade press and company releases, and no interviews or surveys were used.
AI agents and explainable automation carry growth to 2035
The Australia decision support system market is expected to reach USD 1.51 billion by 2035, a 15.24% CAGR during 2026–2035, as AI agents and predictive models move into credit, clinical, service and planning work. Growth should be strongest through 2028 while privacy transparency duties, prudential controls and agency AI policies take hold. After that, clinical AI and tools for smaller firms will carry more of the value. Stricter AI rules would slow some launches, while faster cloud adoption would lift subscription spending.
Frequently Asked Questions
How big is the Australia decision support system market?
Which solution type leads Australian decision tool spending?
Which region leads the Australian market?
What changes for automated decisions on Dec. 10, 2026?
Why are banks and insurers upgrading decision tools now?
Which application is growing fastest?
Who are the leading companies in Australian decision tools?
What are the main challenges for buyers?
Table of Content
Chapter 1 Market Segmentation
- 1.1 Segmentation Framework
- 1.1.1 Product and Service Classification
- 1.1.2 Application and End-Use Classification
- 1.1.3 Technology and Solution Classification
- 1.1.4 Customer and Distribution Channel Classification
- 1.1.5 Geographic Segmentation
- 1.1.6 Market Segment Definitions and Boundaries
- 1.2 By Solution Type
- 1.2.1 Data-Driven DSS
- 1.2.2 AI/ML-Driven Decision Intelligence
- 1.2.3 Model-Driven DSS
- 1.2.4 Knowledge/Document-Driven DSS
- 1.3 By Deployment Model
- 1.3.1 Cloud/SaaS
- 1.3.2 On-Premise
- 1.3.3 Hybrid
- 1.4 By End-Use Industry
- 1.4.1 Financial Services
- 1.4.2 Healthcare
- 1.4.3 Government and Public Sector
- 1.4.4 Resources and Enterprise Operations
- 1.5 By Application
- 1.5.1 Financial and Customer Decisioning
- 1.5.2 Clinical Decision Support
- 1.5.3 Operational Planning and Optimisation
- 1.5.4 Public-Service and Strategic Decisioning
Chapter 2 Introduction
- 2.1 Report Objectives and Scope
- 2.2 Product Definition and Industry Terminology
- 2.3 Market Inclusions and Exclusions
- 2.4 Research Process
- 2.4.1 Primary Research and Expert Interviews
- 2.4.2 Secondary Research and Source Review
- 2.4.3 Top-Down and Bottom-Up Estimation
- 2.4.4 Data Triangulation and Verification
- 2.5 Market Size Measurement Basis
- 2.5.1 2025: USD 364.5 million → 2035: USD 1.51 billion
- 2.6 Historical and Forecast Reference Periods
- 2.6.1 Historical Period: 2018-2025
- 2.6.2 Base Year: 2025
- 2.6.3 Forecast Period: 2025-2035
- 2.7 Research Assumptions and Limitations
Chapter 3 Executive Summary
- 3.1 Market Snapshot and Key Findings
- 3.2 Base-Year Market Size, 2025
- 3.3 Forecast Market Size, 2035
- 3.4 Revenue and Volume Growth Outlook
- 3.5 Key Demand and Supply Indicators
- 3.6 Leading Market Segments
- 3.7 Fastest-Growing Market Opportunities
- 3.8 Regional Performance Highlights
- 3.9 Technology and Industry Transformation
- 3.10 Competitive Landscape Summary
- 3.11 Analyst View and Strategic Implications
Chapter 4 Australia Decision Support System Market Trends and Developments
- 4.1 Historical Industry Development, 2018-2025
- 4.2 Recent Market Trends and Developments
- 4.3 Demand and Customer Behavior Trends
- 4.4 Technology and Product Innovation
- 4.5 Artificial Intelligence, Automation and Digitalization
- 4.6 Local Manufacturing and Supply Chain Realignment
- 4.7 Industry Partnerships, Mergers and Acquisitions
- 4.8 Sustainability and Circular Economy Developments
- 4.9 Government and Private Sector Investment Trends
- 4.10 Emerging Business Models and Commercialization
- 4.11 Industry Developments and Announcements
Chapter 5 Australia Decision Support System Market Supply and Demand Analysis
- 5.1 Demand Trend and Consumption Analysis, 2018-2025
- 5.2 Demand Forecast, 2025-2035
- 5.3 Supply Chain Structure and Procurement Trends
- 5.4 Supply-Demand Gap and Bottlenecks
- 5.5 Import Dependence and Sourcing Structure
- 5.6 Regional Supply and Demand Concentration
Chapter 6 Australia Decision Support System Market Pricing Analysis
- 6.1 Pricing Structure and Measurement
- 6.2 Historical Pricing Trends, 2018-2025
- 6.3 Pricing Outlook, 2025-2035
- 6.4 Pricing by Product and Market Segment
- 6.5 Geographic Pricing Differences
- 6.6 Key Input, Energy, Labor and Logistics Costs
- 6.7 Contract Pricing and Purchasing Models
- 6.8 Pricing Sensitivity and Competitive Positioning
- 6.9 Price, Margin and Profitability Implications
Chapter 7 Australia Decision Support System Market Dynamics
- 7.1 Market Growth Drivers
- 7.1.1 Demand-Side Drivers
- 7.1.2 Technology and Innovation Drivers
- 7.1.3 Infrastructure and Investment Drivers
- 7.1.4 Regulatory and Policy Drivers
- 7.2 Market Restraints
- 7.2.1 Cost and Affordability Constraints
- 7.2.2 Technology and Adoption Barriers
- 7.2.3 Supply Chain and Operational Constraints
- 7.3 Market Challenges
- 7.3.1 Competitive Pressure and Margin Erosion
- 7.3.2 Skills, Infrastructure and Implementation Gaps
- 7.4 Emerging Market Opportunities
- 7.5 Market Dynamics Impact and Time-Horizon Assessment
Chapter 8 Australia Decision Support System Value Chain Analysis
- 8.1 Industry Value Chain Overview
- 8.2 Upstream Suppliers and Critical Inputs
- 8.3 Technology and Component Providers
- 8.4 Manufacturing or Service Delivery
- 8.5 Distribution, Channel Partners and Integrators
- 8.6 Downstream Applications and End Users
- 8.7 Value Addition and Profit Pools
- 8.8 Vertical Integration and Outsourcing
- 8.9 Supplier Concentration and Risk
- 8.10 Supply Chain Localization and Resilience
Chapter 9 Australia Decision Support System Market Regulations and Policies
- 9.1 Relevant Laws, Standards and Compliance Frameworks
- 9.2 Product, Service, Safety and Quality Requirements
- 9.3 Government Policies, Incentives and Subsidies
- 9.4 Imports, Exports and Trade Barriers
- 9.5 Public Procurement and Local Content Requirements
- 9.6 Data Protection, AI and Cybersecurity Compliance
- 9.7 Upcoming Policy Changes and Market Implications
Chapter 10 Australia Decision Support System Market Hotspots and Opportunities
- 10.1 Market Opportunity Mapping and Growth Hotspots
- 10.2 High-Growth Applications and Customer Groups
- 10.3 Underserved Markets and White-Space Opportunities
- 10.4 Emerging Technology and Product Opportunities
- 10.5 New Capacity and Investment Hotspots
- 10.6 Market Entry and Expansion Opportunities
- 10.7 Distribution and Partnership Opportunities
- 10.8 Near-Term and Long-Term Commercial Potential
- 10.9 Opportunity Attractiveness and Execution Risks
Chapter 11 Australia Decision Support System Market Outlook, 2025-2035
- 11.1 Market Size and Analysis
- 11.1.1 Revenue (Market Measurement: 2025: USD 364.5 million → 2035: USD 1.51 billion)
- 11.1.2 Historical Market Size, 2018-2025
- 11.1.3 Base-Year Market Size, 2025
- 11.2 Market Forecast, 2025-2035
- 11.2.1 Revenue Forecast to 2035
- 11.2.2 CAGR and Year-on-Year Growth
- 11.2.3 Incremental Revenue Opportunity
- 11.3 Forecast Assumptions and Scenario Analysis
- 11.3.1 Base-Case Forecast
- 11.3.2 Optimistic and Conservative Scenarios
- 11.3.3 Technology, Pricing and Policy Sensitivities
- 11.4 Market Attractiveness and Growth Outlook
Chapter 12 Australia Decision Support System Market Segmentation and Outlook
- 12.1 Segmentation Summary and Market Shares, 2025
- 12.2 Largest and Fastest-Growing Segments
- 12.3 By Solution Type - Market Size and Forecast, 2025-2035
- 12.3.1 Segment Definition and Scope
- 12.3.2 Historical Market Size, 2018-2025
- 12.3.3 Revenue Forecast, 2025-2035
- 12.3.4 Base-Year Market Share, 2025
- 12.3.5 Segment CAGR and Growth Drivers
- 12.3.6 Subsegment Market Size and Forecast
- 12.3.6.1 Data-Driven DSS
- 12.3.6.2 AI/ML-Driven Decision Intelligence
- 12.3.6.3 Model-Driven DSS
- 12.3.6.4 Knowledge/Document-Driven DSS
- 12.3.7 Subsegment Pricing and Adoption Trends
- 12.3.8 Leading Suppliers and Competition
- 12.3.9 Regional Demand and Opportunities
- 12.4 By Deployment Model - Market Size and Forecast, 2025-2035
- 12.4.1 Segment Definition and Scope
- 12.4.2 Historical Market Size, 2018-2025
- 12.4.3 Revenue Forecast, 2025-2035
- 12.4.4 Base-Year Market Share, 2025
- 12.4.5 Segment CAGR and Growth Drivers
- 12.4.6 Subsegment Market Size and Forecast
- 12.4.6.1 Cloud/SaaS
- 12.4.6.2 On-Premise
- 12.4.6.3 Hybrid
- 12.4.7 Subsegment Pricing and Adoption Trends
- 12.4.8 Leading Suppliers and Competition
- 12.4.9 Regional Demand and Opportunities
- 12.5 By End-Use Industry - Market Size and Forecast, 2025-2035
- 12.5.1 Segment Definition and Scope
- 12.5.2 Historical Market Size, 2018-2025
- 12.5.3 Revenue Forecast, 2025-2035
- 12.5.4 Base-Year Market Share, 2025
- 12.5.5 Segment CAGR and Growth Drivers
- 12.5.6 Subsegment Market Size and Forecast
- 12.5.6.1 Financial Services
- 12.5.6.2 Healthcare
- 12.5.6.3 Government and Public Sector
- 12.5.6.4 Resources and Enterprise Operations
- 12.5.7 Subsegment Pricing and Adoption Trends
- 12.5.8 Leading Suppliers and Competition
- 12.5.9 Regional Demand and Opportunities
- 12.6 By Application - Market Size and Forecast, 2025-2035
- 12.6.1 Segment Definition and Scope
- 12.6.2 Historical Market Size, 2018-2025
- 12.6.3 Revenue Forecast, 2025-2035
- 12.6.4 Base-Year Market Share, 2025
- 12.6.5 Segment CAGR and Growth Drivers
- 12.6.6 Subsegment Market Size and Forecast
- 12.6.6.1 Financial and Customer Decisioning
- 12.6.6.2 Clinical Decision Support
- 12.6.6.3 Operational Planning and Optimisation
- 12.6.6.4 Public-Service and Strategic Decisioning
- 12.6.7 Subsegment Pricing and Adoption Trends
- 12.6.8 Leading Suppliers and Competition
- 12.6.9 Regional Demand and Opportunities
- 12.7 Segment Growth Comparison
- 12.8 Segment Attractiveness and Priority Matrix
Chapter 13 Australia Decision Support System End-Use and Application Market Outlook
- 13.1 End-Use Industry and Customer Demand Structure
- 13.2 Leading Applications and Customer Groups
- 13.3 End-Use Market Size, Share and Forecast
- 13.4 Major End-Use Industry Deep Dives
- 13.4.1 Customer Requirements and Use Cases
- 13.4.2 Demand and Replacement Cycles
- 13.4.3 Technical and Regulatory Considerations
- 13.4.4 Purchasing and Procurement Models
- 13.4.5 Leading Vendors and Distribution Channels
- 13.4.6 Forecast and Commercial Opportunities
- 13.5 Emerging Applications and Cross-Segment Demand
- 13.6 End-Use Industry Investment Priorities
Chapter 14 Australia Decision Support System Geographic Market Outlook, 2025-2035
- 14.1 Domestic Market Distribution and Demand Clusters
- 14.2 State- or Province-Wise Market Size and Forecast, 2025-2035
- 14.3 City and Metropolitan Market Outlook
- 14.4 Industrial, Manufacturing and Commercial Clusters
- 14.5 Geographic Concentration of Key End Users
- 14.6 Local Pricing and Purchasing Differences
- 14.7 Domestic Production Facilities and Capacity Map
- 14.8 Local Infrastructure and Project Pipeline
- 14.9 State-Level Policy and Incentive Differences
- 14.10 Subnational Investment Hotspots and Opportunities
- 14.11 Distribution and Logistics Networks
- 14.12 Domestic Competitive Footprint
Chapter 15 Australia Decision Support System Technology, Innovation and Sustainability Outlook
- 15.1 Technology Landscape and Maturity
- 15.2 Product, Process and Service Innovation
- 15.3 AI, Automation and Digital Tools in the Industry
- 15.4 Technology Adoption and Performance Benchmarking
- 15.5 Innovation Pipeline and R&D Investment
- 15.6 Patent and Intellectual Property Trends
- 15.7 Energy Efficiency and Resource Management
- 15.8 Sustainability, Recycling and Circularity
- 15.9 Technology Roadmap, 2025-2035
- 15.10 Risks of Obsolescence and Technology Substitution
Chapter 16 Australia Decision Support System Market Key Strategic Imperatives
- 16.1 Growth and Market Entry Priorities
- 16.2 High-Return Products and Segments
- 16.3 Pricing, Profitability and Cost Optimization
- 16.4 Technology Investment and Product Differentiation
- 16.5 Supply Chain Localization and Resilience
- 16.6 Distribution and Customer Acquisition
- 16.7 Partnership, Acquisition and Capacity Strategy
- 16.8 Regional Expansion Priorities
- 16.9 Short-, Medium- and Long-Term Actions
Chapter 17 Competition Outlook
- 17.1 Industry Competition Characteristics
- 17.2 Market Structure and Concentration
- 17.3 Market Share and Competitive Positioning, 2025
- 17.4 Company-Wise Revenue and Product Benchmarking
- 17.5 Production and Service Capacity Benchmarking
- 17.6 Technology, Pricing and Differentiation
- 17.7 Regional Footprint and Distribution Strength
- 17.8 Mergers, Acquisitions and Strategic Alliances
- 17.9 New Entrants and Competitive Threats
- 17.10 Porter's Five Forces and Industry Attractiveness
- 17.11 Competitive Outlook, 2025-2035
Chapter 18 Company Profiles
- 18.1 Company Coverage and Selection Criteria
- 18.2 Microsoft
- 18.2.1 Business Description
- 18.2.2 Company Ownership and Geographic Presence
- 18.2.3 Product and Service Portfolio
- 18.2.4 Manufacturing and Operating Footprint
- 18.2.5 Financial Performance and Investment
- 18.2.6 Market Share and Competitive Position
- 18.2.7 Technology and Innovation Capabilities
- 18.2.8 Strategic Alliances or Partnerships
- 18.2.9 Recent Developments
- 18.2.10 Growth Strategy and Outlook
- 18.3 Salesforce
- 18.4 SAP
- 18.5 SAS
- 18.6 IBM
- 18.7 Amazon Web Services
- 18.8 Other Relevant Market Participants
Note: Every listed company is profiled on the structure shown under the first company. The company list is preliminary and may change based on research findings, market developments, data availability and client requirements.
Chapter 19 Disclaimer
- 19.1 Research and Forecast Disclaimer
- 19.2 Data Source and Estimation Limitations
Note: The depth of individual sections depends on data availability for this market. Volume, capacity, trade and other unit-based metrics are included where applicable.

