
Landscaping Products Market Overview:
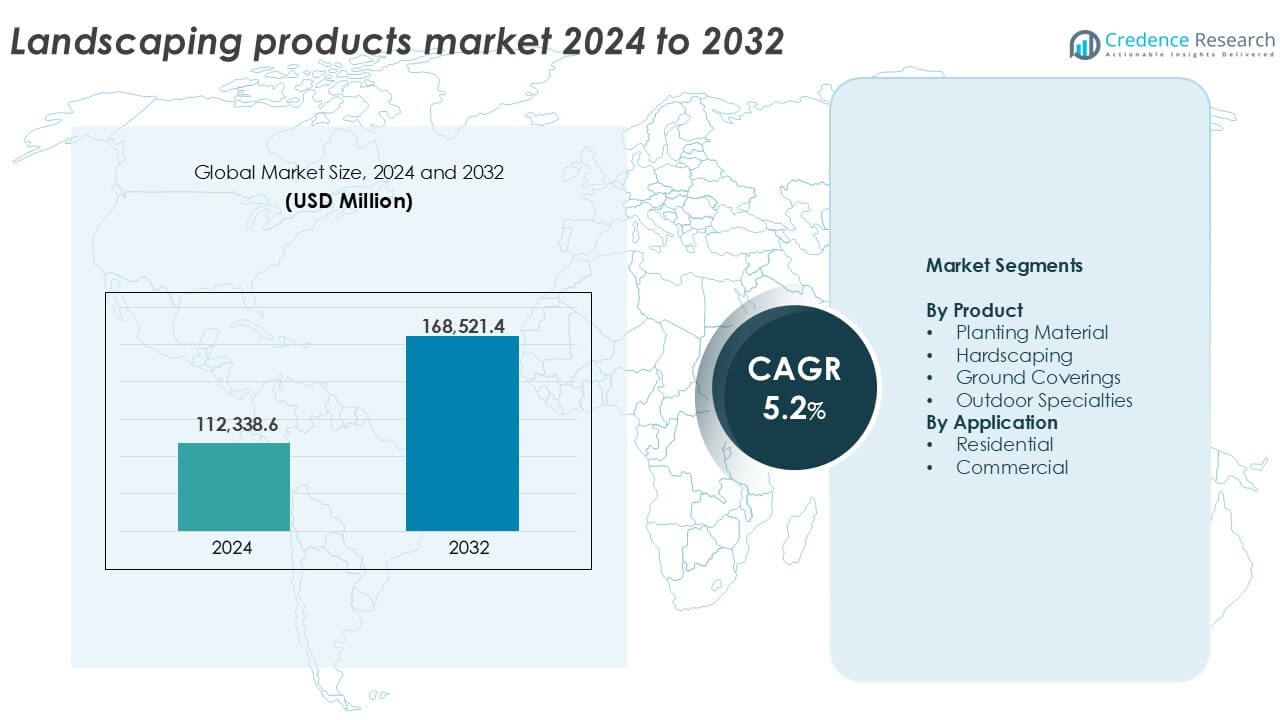
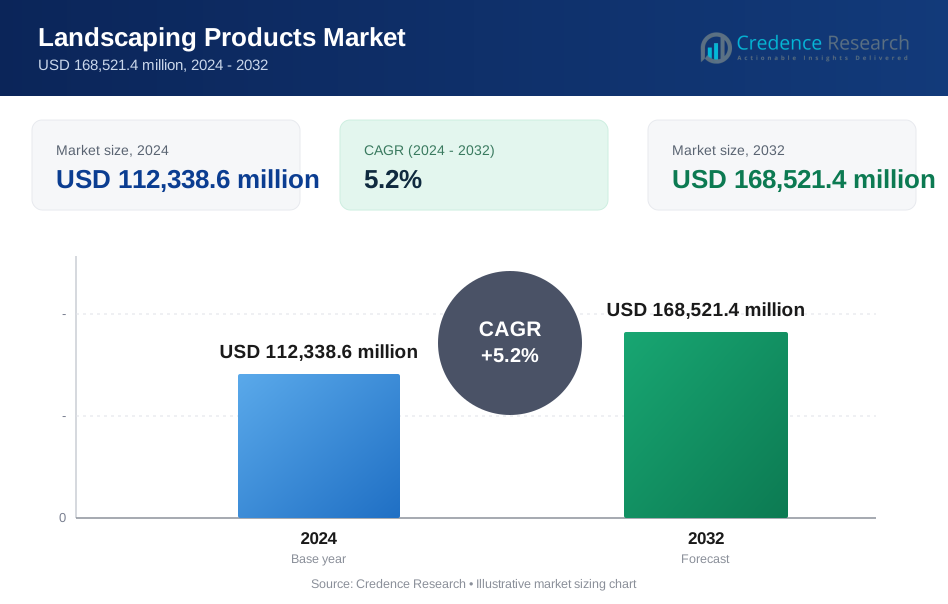
The Landscaping Products Market size was valued at USD 112,338.6 million in 2024 and is anticipated to reach USD 168,521.4 million by 2032, growing at a CAGR of 5.2% during the forecast period.
| REPORT ATTRIBUTE | DETAILS |
|---|---|
| Historical Period | 2020-2023 |
| Base Year | 2024 |
| Forecast Period | 2025-2032 |
| Landscaping Products Market Size 2024 | USD 112,338.6 million |
| Landscaping Products Market, CAGR | 5.2% |
| Landscaping Products Market Size 2032 | USD 168,521.4 million |
Landscaping Products Market Insights
- Rising demand for outdoor living spaces, along with increased home renovation activity, continues to drive market growth globally.
- Trends such as smart irrigation, low-maintenance landscapes, and eco-friendly materials are reshaping consumer preferences and product innovation.
- Key players like Home Depot, Oldcastle APG, and The QUIKRETE Companies maintain strong market positions, while niche players focus on decorative and sustainable offerings.
- North America leads with over 40% market share, followed by Europe with 25%, while the hardscaping segment dominates the product category with over 45% revenue share.
Landscaping Products Market Segmentation Analysis:
By Product
The hardscaping segment held the largest market share in the landscaping products market in 2024. It accounted for over 45% of the total revenue. Demand for pavers, retaining walls, decks, and walkways continues to rise due to outdoor living trends. Homeowners invest in functional outdoor spaces with enhanced aesthetics. Growth in home remodeling projects and commercial outdoor upgrades further supports this segment. Weather-resistant and low-maintenance materials gain preference, especially in urban landscapes. Suppliers innovate with eco-friendly and permeable hardscape solutions to meet sustainability goals. Planting material follows as the second most prominent product category. It benefits from rising consumer interest in home gardening and native plant species. Municipal greening programs and residential lawn expansions add to segment demand. Ground coverings such as mulch and artificial turf also gain traction for low-maintenance landscaping. Outdoor specialties, including lighting and water features, grow steadily, driven by lifestyle upgrades.
- For instance, Belgard products such as concrete pavers are widely stocked in major U.S. retail stores, available in multiple standard sizes like 7 in by 7 in and 11 in by 7 in.
By Application
The residential segment dominated the landscaping products market in 2024, contributing over 60% of the total market share. Homeowners prioritize outdoor improvements to boost property value and enhance leisure spaces. Demand grows for patios, outdoor kitchens, and gardens with smart lighting and irrigation. DIY landscaping trends also drive product purchases through retail and e-commerce platforms. Suburban expansion and increased single-family housing construction support continued growth in this segment. The shift toward home-centric lifestyles post-pandemic has further accelerated residential landscaping investments. The commercial segment sees steady growth, fueled by rising investments in hospitality, office, and urban infrastructure projects. Businesses enhance outdoor spaces to improve visual appeal and customer experience. Green building certifications and sustainability mandates promote use of eco-friendly materials and native vegetation. Public parks, recreational areas, and green corridors increasingly rely on structured landscaping products.
- For instance, The Home Depot offers outdoor plant and garden products across its full store network.
Key Growth Drivers
Expansion of Residential Outdoor Living Spaces
The rising preference for enhanced outdoor living drives strong demand for landscaping products. Homeowners invest in patios, fire pits, decks, and gardens to create functional and aesthetic outdoor environments. The trend is especially prominent in North America and Europe, where backyard transformation aligns with lifestyle upgrades. Increasing home improvement spending, particularly post-pandemic, fuels purchases of hardscaping and planting materials. Growing suburban development and single-family housing construction further support the market. Do-it-yourself landscaping boosts retail sales, while online channels simplify access to a wide range of products. The desire to boost property value and quality of life remains a consistent growth driver.
- For instance, The Home Depot stocks over 1,200 different hardscape options including pavers and wall blocks for patio builds.
Commercial Infrastructure and Urban Beautification Projects
Urbanization and infrastructure expansion across developing economies drive landscaping product consumption. Governments invest in city beautification, green corridors, public parks, and smart city projects, creating steady demand for hardscaping and ground coverings. Commercial properties such as hotels, offices, and malls enhance outdoor aesthetics to attract visitors and improve brand image. Landscape architects and project developers incorporate sustainable and low-maintenance solutions. Institutional sectors, including schools and healthcare centers, also prioritize green spaces for wellness and environmental goals. Landscaping products play a key role in meeting green building certifications and improving urban livability, making this a strong and ongoing market catalyst.
- For instance, the Atatürk Airport National Garden project in Türkiye includes more than 20,000 newly planted trees and over 1,000,000 m² of lawn landscaping.
Growing Focus on Sustainability and Water Conservation
Eco-conscious landscaping practices contribute significantly to market growth. Consumers and developers seek products that support low water usage, reduced chemical input, and long-term ecological balance. Drought-resistant plants, permeable pavers, organic mulches, and smart irrigation systems are gaining traction. Regulatory mandates in several regions encourage sustainable landscape designs in residential and commercial settings. Native planting trends and xeriscaping practices are reshaping planting material preferences. Manufacturers innovate with recycled and biodegradable materials across product lines. These practices not only reduce environmental impact but also help lower long-term maintenance costs. The shift toward sustainable landscaping aligns with broader ESG goals, making it a strong growth driver.
Key Trends & Opportunities
Integration of Smart Landscaping Technologies
Technology integration is reshaping landscaping, opening new growth avenues. Smart irrigation systems, sensor-based lighting, and robotic lawnmowers are increasingly adopted in both residential and commercial applications. These solutions help reduce water waste, energy use, and manual labor. Consumer interest in home automation extends to outdoor spaces, where app-controlled systems enhance convenience and efficiency. Landscape service providers also adopt software tools for design visualization and maintenance planning. The trend aligns with smart home ecosystems and supports environmental goals. Manufacturers that offer tech-enabled products with user-friendly interfaces gain competitive advantages. This shift creates strong opportunities for innovation-driven growth in the landscaping market.
- For instance, Rachio’s smart sprinkler controller supports up to 16 watering zones, letting homeowners automate irrigation via an app.
Rise of Low-Maintenance and Multi-Functional Landscapes
Demand for low-maintenance, versatile outdoor spaces is rising, especially among urban and aging populations. Artificial turf, composite decking, and native plants reduce upkeep while maintaining visual appeal. Homeowners seek spaces that serve multiple purposes—recreation, gardening, entertaining, and relaxation. Compact, modular landscaping solutions are gaining popularity in small city homes and apartments. In commercial sectors, multi-functional green spaces help meet social and environmental targets. Trends like edible landscapes and pollinator gardens also support biodiversity. Manufacturers and service providers offering easy-install and durable products are well-positioned to benefit from this evolving consumer preference toward practicality and multifunctionality.
Key Challenges
High Cost of Quality Landscaping Products and Services
Cost remains a significant barrier, especially for consumers in emerging markets. Premium materials such as natural stone, composite wood, and smart systems can substantially raise installation budgets. Labor costs for design, installation, and maintenance further increase total expenditure. While affluent homeowners and commercial developers continue to invest, price sensitivity among middle-income groups limits broader adoption. Seasonal demand fluctuations also affect purchasing patterns, particularly in colder regions. Budget constraints can lead to delays or scaling down of landscaping plans. Manufacturers face pressure to balance product quality with affordability, while service providers must justify value-added pricing in competitive environments.
Impact of Climatic Variability and Water Restrictions
Landscaping practices are heavily influenced by regional climate conditions. Extreme weather events, prolonged droughts, or excessive rainfall disrupt planting schedules and damage installed landscapes. Water scarcity in regions like California, Australia, and the Middle East leads to restrictions that limit irrigation-dependent landscaping. Such policies reduce demand for water-intensive products like turf grass or ornamental plants. Consumers may opt for minimalistic or artificial landscapes, affecting traditional product categories. Climate unpredictability also increases risks for landscape service providers. To overcome this, companies must adapt offerings to suit local conditions, promote drought-tolerant materials, and emphasize resilient design principles.
Regional Analysis
North America
North America held the largest share in the landscaping products market, accounting for over 40% of global revenue in 2024. The U.S. dominates due to high demand for outdoor living spaces and extensive home renovation activity. Strong DIY culture and favorable climate conditions support consistent product uptake. Increasing investments in residential yards, patios, and commercial spaces fuel the need for hardscaping and planting materials. The region also leads in smart landscaping technology adoption. Canada contributes with public green space upgrades and commercial landscaping developments. North America’s mature infrastructure and spending capacity maintain its leadership in the global landscape products market.
Europe
Europe accounted for nearly 25% of the landscaping products market share in 2024. Germany, the UK, and France lead regional growth due to structured urban landscaping programs and public green space investments. The market benefits from strong demand for sustainable and low-maintenance landscaping solutions. Regulatory focus on biodiversity and climate-resilient cities drives adoption of native plants, permeable pavers, and eco-friendly ground coverings. Commercial buildings incorporate landscaped exteriors to meet green building standards. Residential gardens see steady investment, especially in Northern and Western Europe. The aging population and small-space gardening trends support further demand for compact, functional landscaping solutions.
Asia Pacific
Asia Pacific captured around 18% of the global landscaping products market in 2024 and shows the fastest growth rate. China, Japan, India, and Australia drive demand through rapid urbanization, infrastructure development, and rising middle-class spending. Public parks, real estate landscapes, and hospitality projects boost product consumption across segments. Increasing awareness of green environments supports planting material and smart irrigation system sales. Japan leads in compact and aesthetic landscaping, while India sees rising residential adoption. Urban beautification and city modernization plans across Southeast Asia further propel market expansion. Asia Pacific is expected to gain more market share in coming years.
Latin America
Latin America held approximately 8% of the global landscaping products market in 2024. Brazil and Mexico drive most of the demand, supported by rising investments in public infrastructure and private housing. Landscaping is increasingly integrated into commercial properties, resorts, and urban development projects. Climate diversity across regions encourages the use of drought-tolerant materials and native planting. Growing tourism also supports outdoor upgrades in hotels and entertainment areas. However, the market faces limitations due to economic fluctuations and high product costs. Still, expanding middle-class housing and city beautification efforts present long-term opportunities for landscaping suppliers.
Middle East & Africa
The Middle East & Africa region accounted for about 7% of the landscaping products market in 2024. GCC countries lead the regional landscape, with the UAE and Saudi Arabia investing heavily in tourism, hospitality, and smart cities. Water-efficient landscaping gains traction due to arid climates, promoting artificial turf, drip irrigation, and xeriscaping materials. Commercial sectors prioritize green spaces for aesthetic and environmental benefits. In Africa, urbanization and infrastructure growth in South Africa and Nigeria boost basic landscaping demand. However, limited water resources and price sensitivity constrain broader adoption. Despite challenges, MEA offers emerging potential through large-scale public and private projects.
Landscaping Products Market Segmentations:
By Product
- Planting Material
- Hardscaping
- Ground Coverings
- Outdoor Specialties
By Application
- Residential
- Commercial
By Geography
- North America
- U.S.
- Canada
- Mexico
- Europe
- Germany
- France
- U.K.
- Italy
- Spain
- Rest of Europe
- Asia Pacific
- China
- Japan
- India
- South Korea
- South-east Asia
- Rest of Asia Pacific
- Latin America
- Brazil
- Argentina
- Rest of Latin America
- Middle East & Africa
- GCC Countries
- South Africa
- Rest of the Middle East and Africa
Competitive Landscape
The landscaping products market features a moderately consolidated competitive landscape, with a mix of global manufacturers, regional suppliers, and specialty product providers. Leading players such as Home Depot, Oldcastle APG, The QUIKRETE Companies, and Heidelberg Materials command significant market share through extensive distribution networks and broad product portfolios. These firms invest in innovation, sustainability, and strategic acquisitions to expand presence and address shifting consumer demands. Niche players like Haddonstone, Kafka Granite, and ecoDynamics focus on premium, decorative, and eco-friendly solutions that cater to customized landscaping needs. Companies also compete on pricing, material durability, design variety, and turnaround times. Expansion into online retail, DIY-friendly offerings, and smart landscaping solutions further intensifies competition. Regional players strengthen their foothold by offering climate-specific and culturally tailored products. The competitive landscape is defined by continuous product enhancement, partnerships with contractors and retailers, and efforts to align offerings with environmental standards and evolving residential and commercial landscaping trends.
Key Player Analysis
- Haddonstone
- ecoDynamics
- Kafka Granite, LLC
- The Monarch Cement Company
- The QUIKRETE Companies
- Griffon Corporation Inc.
- Oldcastle APG, a CRH company
- Henri Studio
- Heidelberg Materials
- Home Depot
Recent Developments
- In November 2024, Hanson Australia did officially rebrand as Heidelberg Materials Australia. However, this was not a "new partnership" in the sense of a fresh merger; Hanson has been a wholly-owned subsidiary of the Heidelberg group since 2007
- In October 2024, Paradise Landscape Centers introduces the go-to guide for finding wholesale rocks in Los Angeles County. The go-to guide aims to help homeowners and contractors pick up the right products for their residential and commercial landscaping projects.
- In March 2024, SRS Distribution Inc. (“SRS”) announced the strategic collaboration with the Home Depot to be acquired for $18.250 billion. With the terms of the agreement, SRS Distribution operates an independent business unit within The Home Depot to increase the growth in the Pro market.
Report Coverage
The research report offers an in-depth analysis based on Product, Application and Geography. It details leading market players, providing an overview of their business, product offerings, investments, revenue streams, and key applications. Additionally, the report includes insights into the competitive environment, SWOT analysis, current market trends, as well as the primary drivers and constraints. Furthermore, it discusses various factors that have driven market expansion in recent years. The report also explores market dynamics, regulatory scenarios, and technological advancements that are shaping the industry. It assesses the impact of external factors and global economic changes on market growth. Lastly, it provides strategic recommendations for new entrants and established companies to navigate the complexities of the market.
Future Outlook
- Demand for low-maintenance and water-efficient landscaping solutions will continue to rise.
- Smart technologies such as app-controlled irrigation and lighting systems will see wider adoption.
- Residential landscaping will remain the dominant segment due to ongoing home improvement trends.
- Urban development projects will increase demand for commercial landscaping solutions.
- Manufacturers will focus on sustainable and recycled materials to meet environmental goals.
- Online retail and DIY landscaping products will gain higher market traction.
- Public and private investments in green infrastructure will expand across emerging economies.
- Climate-resilient landscaping designs will influence product innovation and planning.
- Competitive pressure will drive companies to expand product portfolios and service offerings.
- Asia Pacific will register the fastest growth, supported by urbanization and rising consumer spending.
Request a Free Sample
Fill in your details and we'll send you a free sample report.
- Sample data tables & charts
- Research methodology
Need a Custom Version of This Report?
Tailor the scope, geography, or segments to your exact requirements.
- Custom geography or segment scope
- Direct access to our analyst team
Frequently Asked Questions
What is the current market size for the Landscaping products market, and what is its projected size in 2032?
At what Compound Annual Growth Rate is the Landscaping products market projected to grow between 2024 and 2032?
Which Landscaping products market segment held the largest share in 2024?
What are the primary factors fueling the growth of the Landscaping products market?
Who are the leading companies in the Landscaping products market?
Which region commanded the largest share of the Landscaping products market in 2024?
Table of Content
Chapter 1. Report Introduction
- 1.1 Report Description & Purpose
- 1.1.1 Report Title & Market Definition
- 1.1.2 Unique Selling Propositions (USP) & Key Differentiators
- 1.1.3 Value Proposition for Stakeholders
- 1.2 Research Objectives
- 1.2.1 Market Sizing Objectives (Volume & Revenue)
- 1.2.2 Segmentation Objectives
- 1.2.3 Competitive Intelligence Objectives
- 1.2.4 Forecast & Scenario Objectives
- 1.3 Report Scope
- 1.3.1 Landscaping Products Scope – Types & Subtypes Covered
- 1.3.2 Geographic Scope – Regions & Countries Covered
- 1.3.3 Historical Period, Base Year & Forecast Period (2024; forecast to 2032)
- 1.3.4 Inclusions & Exclusions
- 1.4 HS Code & Classification Framework
- 1.5 Currency, Units & Pricing Basis
- 1.6 Target Stakeholders
- 1.7 Limitations & Assumptions
Chapter 2. Executive Summary
- 2.1 Global Landscaping Products Market Snapshot
- 2.1.1 Market Size – Historical (2024) & Forecast (2024-2032) (2024: USD 112,338.6 million → 2032: USD 168,521.4 million)
- 2.1.2 Volume & Revenue – Global Totals
- 2.1.3 Key Market Highlights – Top Five Facts
- 2.2 Landscaping Products Market Segmentation Snapshot
- 2.2.1 Market Split by Region – 2024 vs. 2032
- 2.3 Competitive Snapshot
- 2.3.1 Top 10 Players by Revenue Share – 2024
- 2.3.2 Top 10 Players by Volume Share – 2024
- 2.3.3 Recent Strategic Developments (18-Month Summary)
- 2.4 Key Investment Highlights & Strategic Conclusions
Chapter 3. Landscaping Products Market Dynamics & Industry Analysis
- 3.1 Market Overview & Context
- 3.1.1 Landscaping Products Market Position in the Broader Automotive Value Chain
- 3.1.2 OEM vs. Replacement Market Dynamics
- 3.1.3 Market Maturity & Development Stage by Region
- 3.2 Landscaping Products Market Drivers
- 3.3 Landscaping Products Market Restraints & Challenges
- 3.4 Landscaping Products Market Opportunities
- 3.5 Porter's Five Forces Analysis
- 3.5.1 Threat of New Entrants
- 3.5.2 Bargaining Power of Suppliers
- 3.5.3 Bargaining Power of Buyers
- 3.5.4 Threat of Substitutes
- 3.5.5 Competitive Rivalry – Intensity Assessment
- 3.6 Landscaping Products Value Chain Analysis
- 3.6.1 Upstream – Raw Material/Input Suppliers
- 3.6.1.1 Raw Material/Input 1
- 3.6.1.2 Raw Material/Input 2
- 3.6.1.3 Raw Material/Input 3
- 3.6.2 Midstream – Production/Manufacturing/Service Delivery
- 3.6.2.1 Production/Process Overview
- 3.6.2.2 Key Facility Locations & Capacity by Manufacturer
- 3.6.3 Downstream – Distribution & End Consumer
- 3.6.3.1 Primary Channel – B2B/OEM
- 3.6.3.2 Secondary Channels – Dealer, Retail, Online, Direct
- 3.6.4 Value Chain Profitability Analysis
- 3.6.1 Upstream – Raw Material/Input Suppliers
- 3.7 PESTEL Analysis
- 3.7.1 Political Factors
- 3.7.2 Economic Factors
- 3.7.3 Social Factors
- 3.7.4 Technological Factors
- 3.7.5 Environmental Factors
- 3.7.6 Legal Factors
- 3.8 Landscaping Products Supply Chain Analysis
- 3.8.1 Raw Material/Input Supply Risk Assessment
- 3.8.2 Manufacturing Concentration Risk (Geographic Exposure)
- 3.8.3 Trade Disruption Impact Analysis
- 3.9 Regulatory & Policy Landscape
Note: The regulatory and policy landscape section covers regulations based on their applicability to the market, Landscaping Products category, geography, and scope of the study. Only regulatory frameworks with a material impact on operations, compliance, trade, sustainability, or market access are analyzed in detail.
Chapter 4. Key Investment Pockets & Opportunity Analysis
- 4.1 Landscaping Products Market Attractiveness Analysis
- 4.1.1 By Region – Investment Attractiveness Matrix (Volume × CAGR)
- 4.2 Absolute Revenue Growth Opportunity
- 4.2.1 By Region – Absolute USD Growth Through 2032
- 4.3 Incremental Volume Opportunity
- 4.3.1 By Region – Incremental Volume Through 2032
- 4.3.2 Segment – Incremental Volume
- 4.4 Emerging Submarket Opportunity Deep Dive (Subject to Applicability)
- 4.5 Emerging Market Opportunity Scorecards
- 4.5.1 United States
- 4.5.2 Europe
- 4.5.3 Asia
- 4.5.4 Middle East & Africa
Note: Emerging Market Opportunity Scorecards will be included based on relevance and strategic importance. Regions listed are indicative and may vary depending on data availability and market dynamics.
Chapter 5. Landscaping Products Import-Export Analysis & Trade Flows
- 5.1 Global Trade Overview
- 5.1.1 Global Export Value by Country (2024)
- 5.1.2 Global Export Volume by Country (2024)
- 5.1.3 Global Import Value by Country (2024)
- 5.1.4 Global Import Volume by Country (2024)
- 5.1.5 Net Trade Balance by Country (2024)
- 5.2 Export Analysis – Segment
- 5.2.1 Type 1 (HS Code)
- 5.2.2 Type 2 (HS Code)
- 5.2.3 Type 3 (HS Code)
- 5.2.4 Type 4 (HS Code)
- 5.2.5 Type 5 (HS Code)
- 5.3 Import Analysis – Segment
- 5.3.1 Type 1 (HS Code)
- 5.3.2 Type 2 (HS Code)
- 5.3.3 Type 3 (HS Code)
- 5.3.4 Type 4 (HS Code)
- 5.3.5 Type 5 (HS Code)
- 5.4 Average Unit Trade Prices
- 5.4.1 Average Export Price – Segment & Country
- 5.4.2 Average Import Price – Segment & Source Country
- 5.4.3 Price Trends (2024)
- 5.5 Key Trade Route Analysis
- 5.5.1 Trade Route 1
- 5.5.2 Trade Route 2
- 5.5.3 Trade Route 3
- 5.5.4 Trade Route 4
- 5.5.5 Trade Route 5
- 5.6 Trade Policy Impact Assessment
- 5.6.1 US Anti-Dumping & Section 301 Tariffs
- 5.6.2 EU Customs Union Impact
- 5.6.3 Major Free Trade Agreements
- 5.6.4 USMCA Rules of Origin
Note: Trade policy analysis will be included only where relevant to the Landscaping Products market.
Chapter 6. Competitive Landscape & Company Benchmarking
- 6.1 Landscaping Products Market Concentration & Structure
- 6.1.1 Herfindahl-Hirschman Index (HHI) – vs. 2024
- 6.1.2 Tier 1, Tier 2 & Tier 3 Market Structure
- 6.1.3 Global, Regional & Local Player Dynamics
- 6.2 Landscaping Products Market Share Analysis – 2024
- 6.2.1 Global Revenue Share by Company
- 6.2.2 Global Volume Share by Company
- 6.2.3 Regional Revenue Share
- 6.2.4 Market Share Evolution ( vs. 2024)
- 6.2.5 OEM Segment Share by Company
- 6.2.6 Replacement Segment Share by Company
- 6.3 Production/Delivery Capacity & Facility Analysis
- 6.3.1 Global Installed Capacity
- 6.3.2 Capacity Utilization Rates
- 6.3.3 Production/Output Volume
- 6.3.4 Facility Locations & Capacity Map
- 6.3.5 Planned Capacity Additions
- 6.4 Landscaping Products Competitive Benchmarking Matrix
- 6.4.1 Revenue, Volume, CAGR & Profitability Comparison
- 6.4.2 Channel Revenue Mix
- 6.4.3 Geographic Revenue Exposure
- 6.4.4 R&D Intensity
- 6.4.5 Sustainability Maturity
- 6.5 Strategic Developments in Landscaping Products (Last 24 Months)
- 6.5.1 Mergers, Acquisitions & Divestments
- 6.5.2 New Landscaping Products Launches
- 6.5.3 Facility Expansions
- 6.5.4 Strategic Alliances, Joint Ventures & Partnerships
- 6.5.5 Distribution Expansion & Market Entry
- 6.5.6 Sustainability & ESG Initiatives
- 6.6 Competitive Strategy Mapping
- 6.6.1 Leader, Challenger, Follower & Niche Classification
- 6.6.2 Pricing Strategy Comparison
- 6.6.3 Channel Strategy Matrix
Note: Strategic developments are included based on their materiality and the availability of reliable information.
Chapter 7. Global Landscaping Products Market – By Distribution Channel
- 7.1 Segment Overview
- 7.1.1 Volume & Revenue Split by Channel (2024 & 2032)
- 7.1.2 Channel Mix Evolution (2024-2032)
Chapter 8. Regional Market Analysis – Global Overview
- 8.1 Global Regional Overview
- 8.1.1 Regional Volume Share
- 8.1.2 Regional Revenue Share
- 8.1.3 Regional Volume by Region
- 8.1.4 Regional Revenue by Region
- 8.1.5 Regional Forecast Through 2032
- 8.2 Cross-Regional Segment Analysis
- 8.2.1 By Distribution Channel
- 8.2.2 By Brand/Price Tier
Chapter 9. North America Landscaping Products Market
- 9.1 United States
- 9.2 Canada
- 9.3 Mexico
Chapter 10. Europe Landscaping Products Market
- 10.1 Germany
- 10.2 France
- 10.3 Italy
- 10.4 United Kingdom
- 10.5 Spain
- 10.6 Poland
- 10.7 Russia
- 10.8 Netherlands
- 10.9 Belgium
- 10.10 Sweden
- 10.11 Denmark
- 10.12 Norway
- 10.13 Rest of Europe
Chapter 11. Asia Pacific Landscaping Products Market
- 11.1 China
- 11.2 India
- 11.3 Japan
- 11.4 South Korea
- 11.5 Thailand
- 11.6 Indonesia
- 11.7 Vietnam
- 11.8 Malaysia
- 11.9 Australia
- 11.10 Rest of Asia Pacific
Chapter 12. Latin America Landscaping Products Market
- 12.1 Brazil
- 12.2 Argentina
- 12.3 Colombia
- 12.4 Chile
- 12.5 Rest of Latin America
Chapter 13. Middle East Landscaping Products Market
- 13.1 Saudi Arabia
- 13.2 United Arab Emirates
- 13.3 Turkey
- 13.4 Israel
- 13.5 Iran
- 13.6 Rest of the Middle East
Chapter 14. Africa Landscaping Products Market
- 14.1 South Africa
- 14.2 Egypt
- 14.3 Nigeria
- 14.4 Morocco
- 14.5 Rest of Africa
Chapter 15. Landscaping Products Company Profiles
- 15.1 [Company 01]
- 15.1.1 Company Overview
- 15.1.2 Key Management Personnel
- 15.1.3 Products & Services Portfolio
- 15.1.4 Financial Performance
- 15.1.5 Key Market Focus & Geographic Presence
- 15.1.6 Recent Developments & Strategic Initiatives
Note: The company profile list is preliminary and may change based on research findings, market developments, data availability, and client requirements.
Chapter 16. Appendices
- Appendix A – List of Abbreviations & Acronyms
- Appendix B – Industry Classification Code Reference – Full Series
- Appendix C – Production & Capacity Data Tables
- Appendix D – End-Use & Demand Base Tables
- Appendix E – Consumption & Replacement Rate Assumptions
- Appendix F – ASP Reference Tables
- Appendix G – Manufacturing & Facility Database
- Appendix H – Import-Export Data Tables
- Appendix I – Regulatory Summary Tables
- Appendix J – Primary Research Participant List (Anonymized)
- Appendix K – Primary Research Questionnaire Framework
- Appendix L – Data Sources & Bibliography
- Appendix M – Market Size Divergence & Source Comparison
Chapter 17. Research Methodology
- 17.1 Research Framework & Philosophy
- 17.2 Secondary Research – Sources, Hierarchy & Data Extraction
- 17.3 Data Modeling – Bottom-Up & Top-Down Market Sizing
- 17.4 Primary Research – Stakeholder Framework, LOI & Sample Sizes
- 17.5 Forecast Methodology – Regression, Scenario & Sensitivity Analysis
- 17.6 Quality Control – Four-Layer Validation Framework
- 17.7 Limitations & Standard Assumptions
- 17.8 Disclaimer
