
Euro VI trucks and older diesel fleets lift filter demand
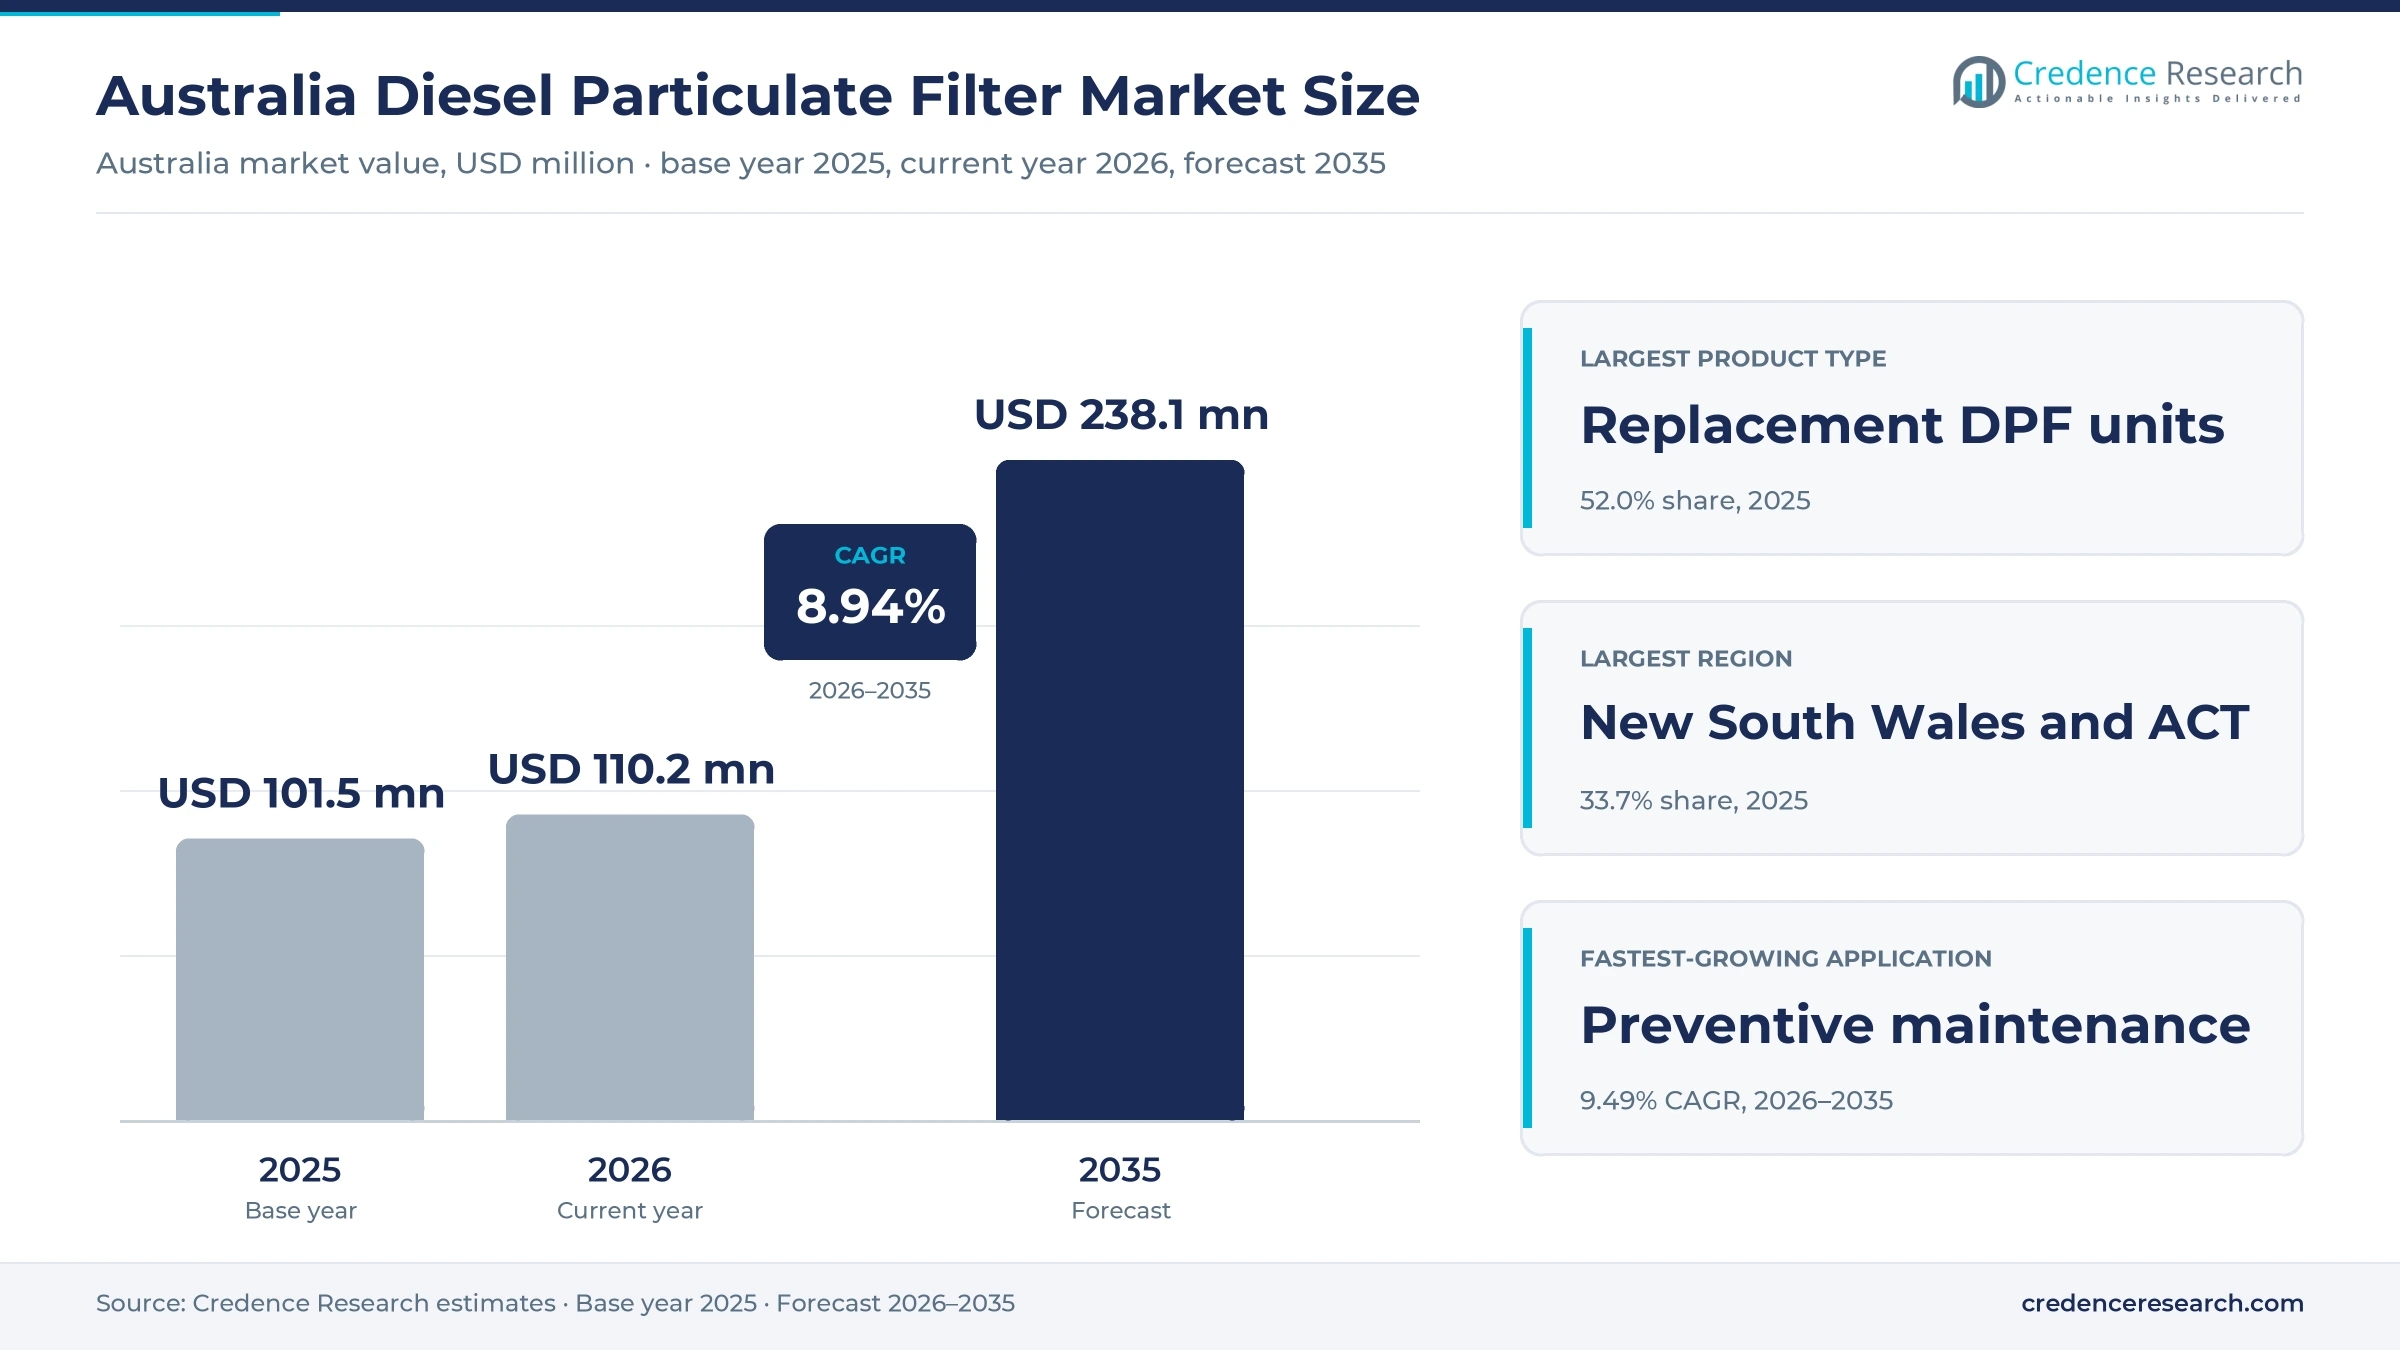
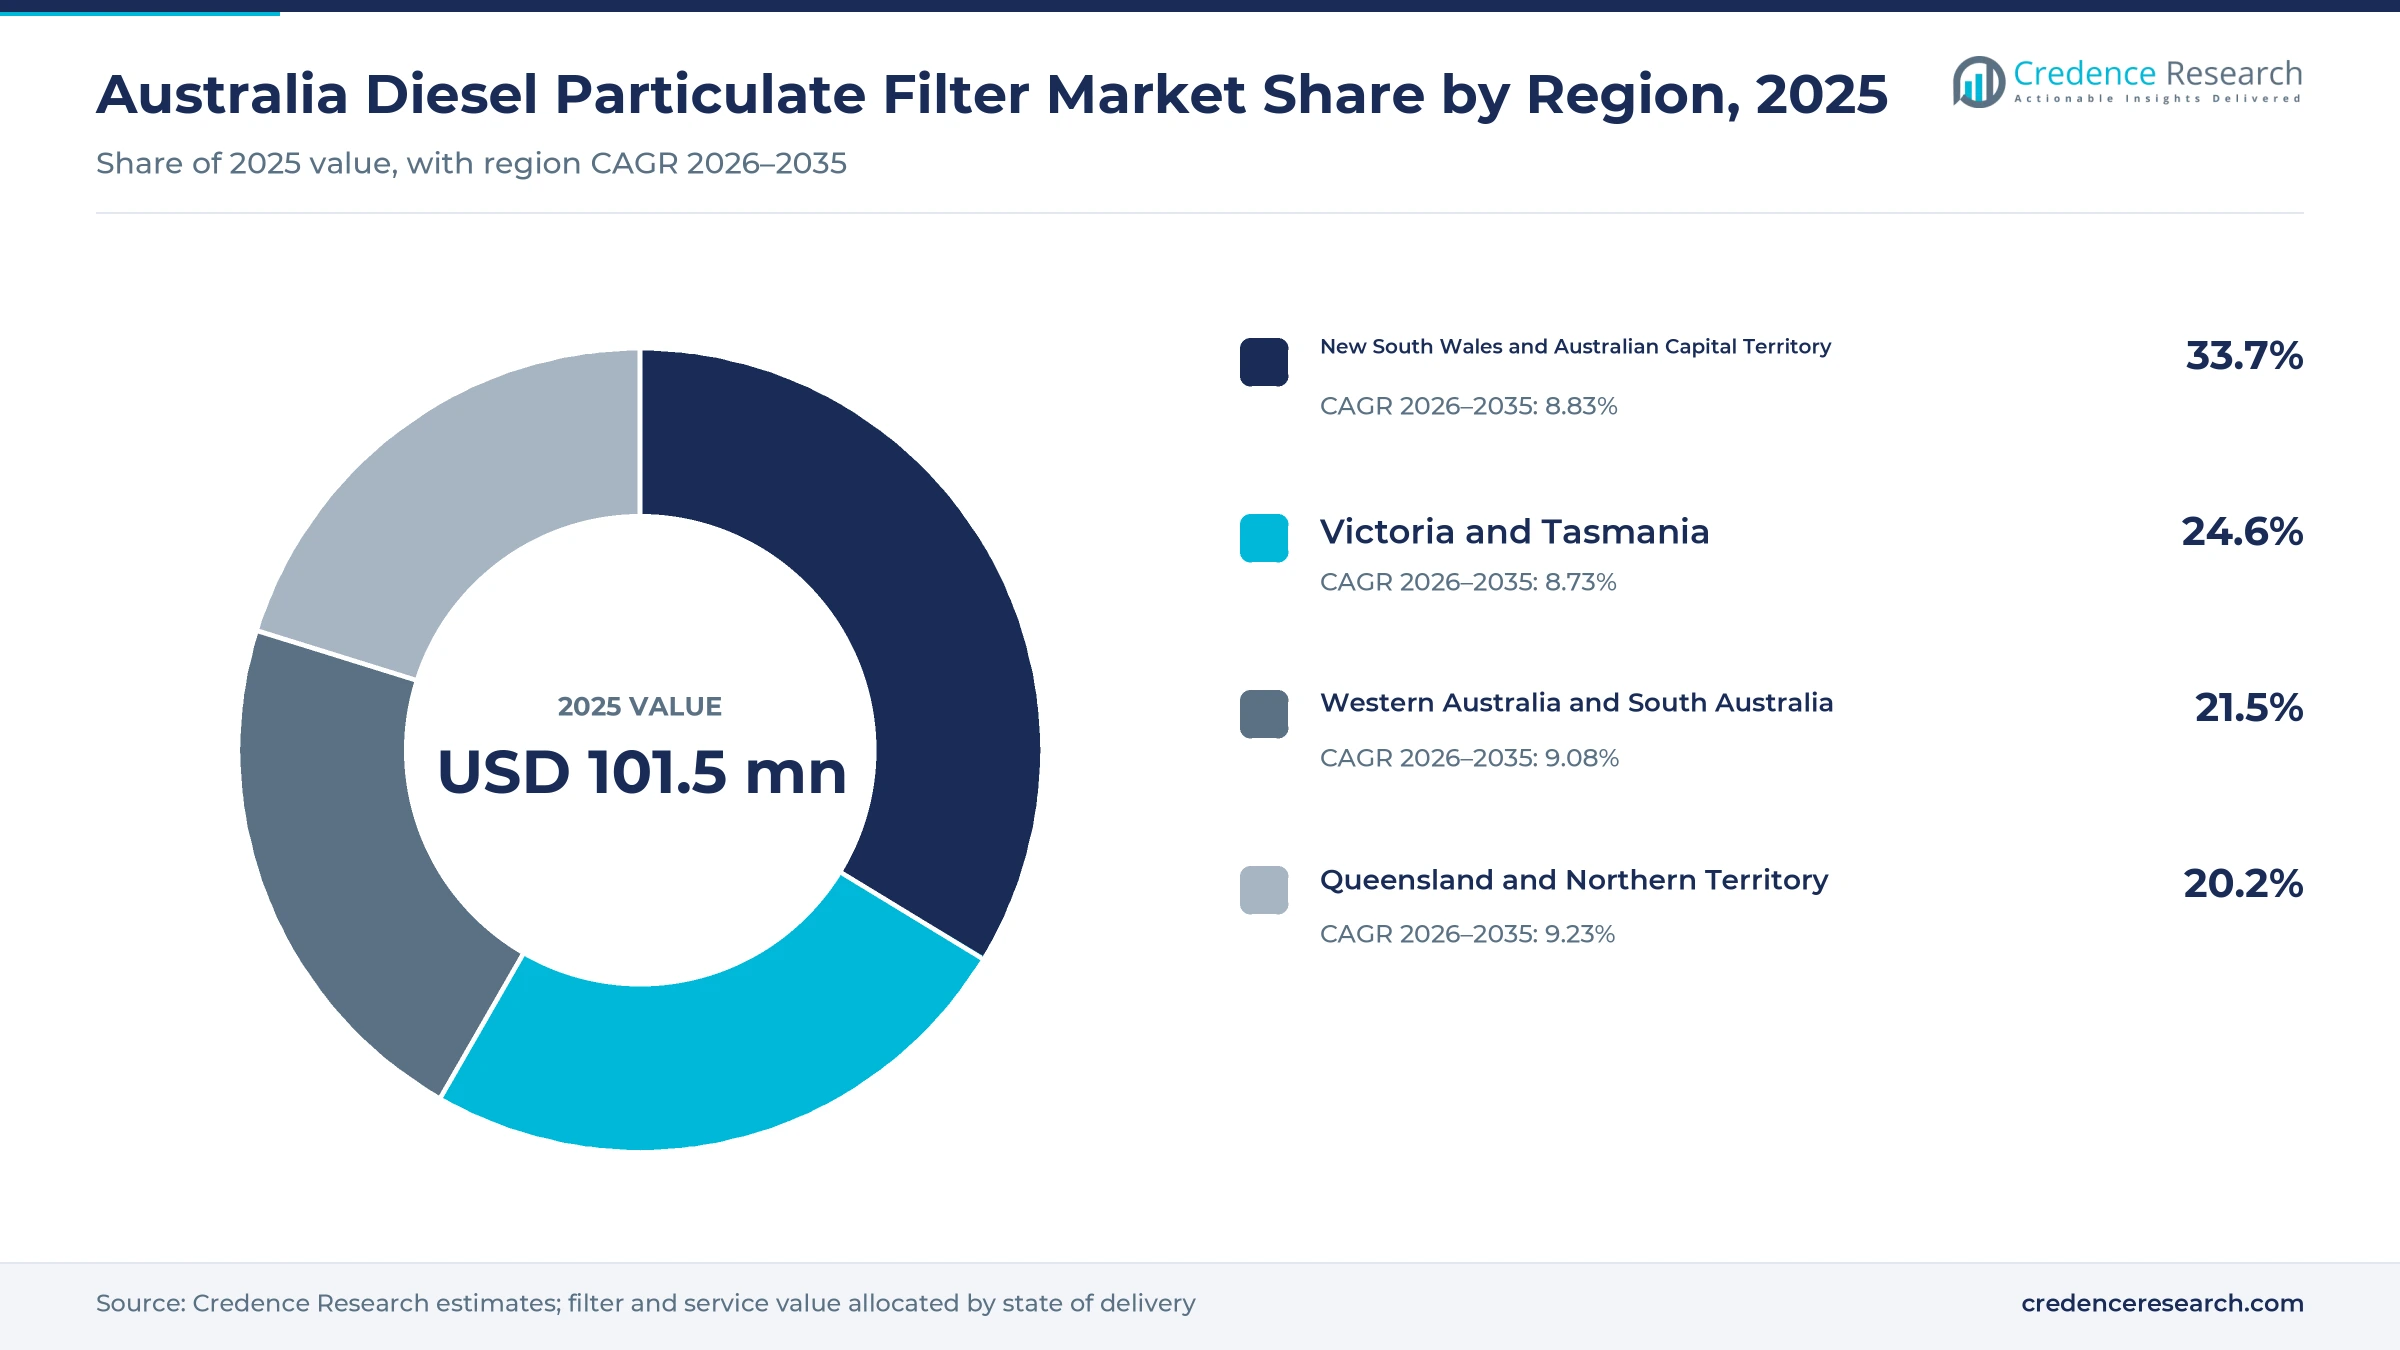
The Australia diesel particulate filter market was valued at USD 101.5 million in 2025 and is projected to increase from USD 110.2 million in 2026 to USD 238.1 million by 2035, registering a CAGR of 8.94% during 2026–2035. Demand comes from independent workshops, fleet maintenance teams, dealers and equipment owners that replace, clean and repair exhaust filters on utes, trucks, buses and off-road machines. New South Wales and Australian Capital Territory held the largest regional share, 33.7% in 2025, because Sydney hosts the largest freight and trade vehicle base. Queensland and Northern Territory is the fastest-growing region at 9.23% a year, as mining and regional freight keep diesel engines working hard. Vehicle rules are also changing, because ADR 80/04 applied Euro VI limits to new heavy vehicle models from November 2024 and to all new heavy vehicles from November 2025. As a result, more filter-equipped trucks enter the fleet and will need service as they age.
Which filters, services and buyers does the estimate cover?
The estimate measures the value of replacement diesel particulate filter units, professional cleaning and repair services, and related parts such as sensors, gaskets and clamps sold in Australia. Values are stated at the prices that workshops, fleet operators, dealers, equipment owners and local assemblers pay for these products and services.
The estimate excludes filters fitted to new vehicles at the factory overseas and complete exhaust systems sold without a filter. The value chain runs from substrate and catalyst makers, mostly overseas, through local importers, filter brands and cleaning centers to workshops, fleet depots and mine sites in every state and territory.
Australia Diesel Particulate Filter Market Insights
- The Australia diesel particulate filter market was valued at USD 101.5 million in 2025 and is projected to reach USD 238.1 million by 2035, registering a CAGR of 8.94% during 2026–2035.
- New South Wales and Australian Capital Territory held a 33.7% share of 2025 value, because Sydney hosts the largest freight and trade vehicle base.
- Replacement DPF units led with a 52.0% share of 2025 value, because blocked or cracked filters on older diesel vehicles often need a full replacement.
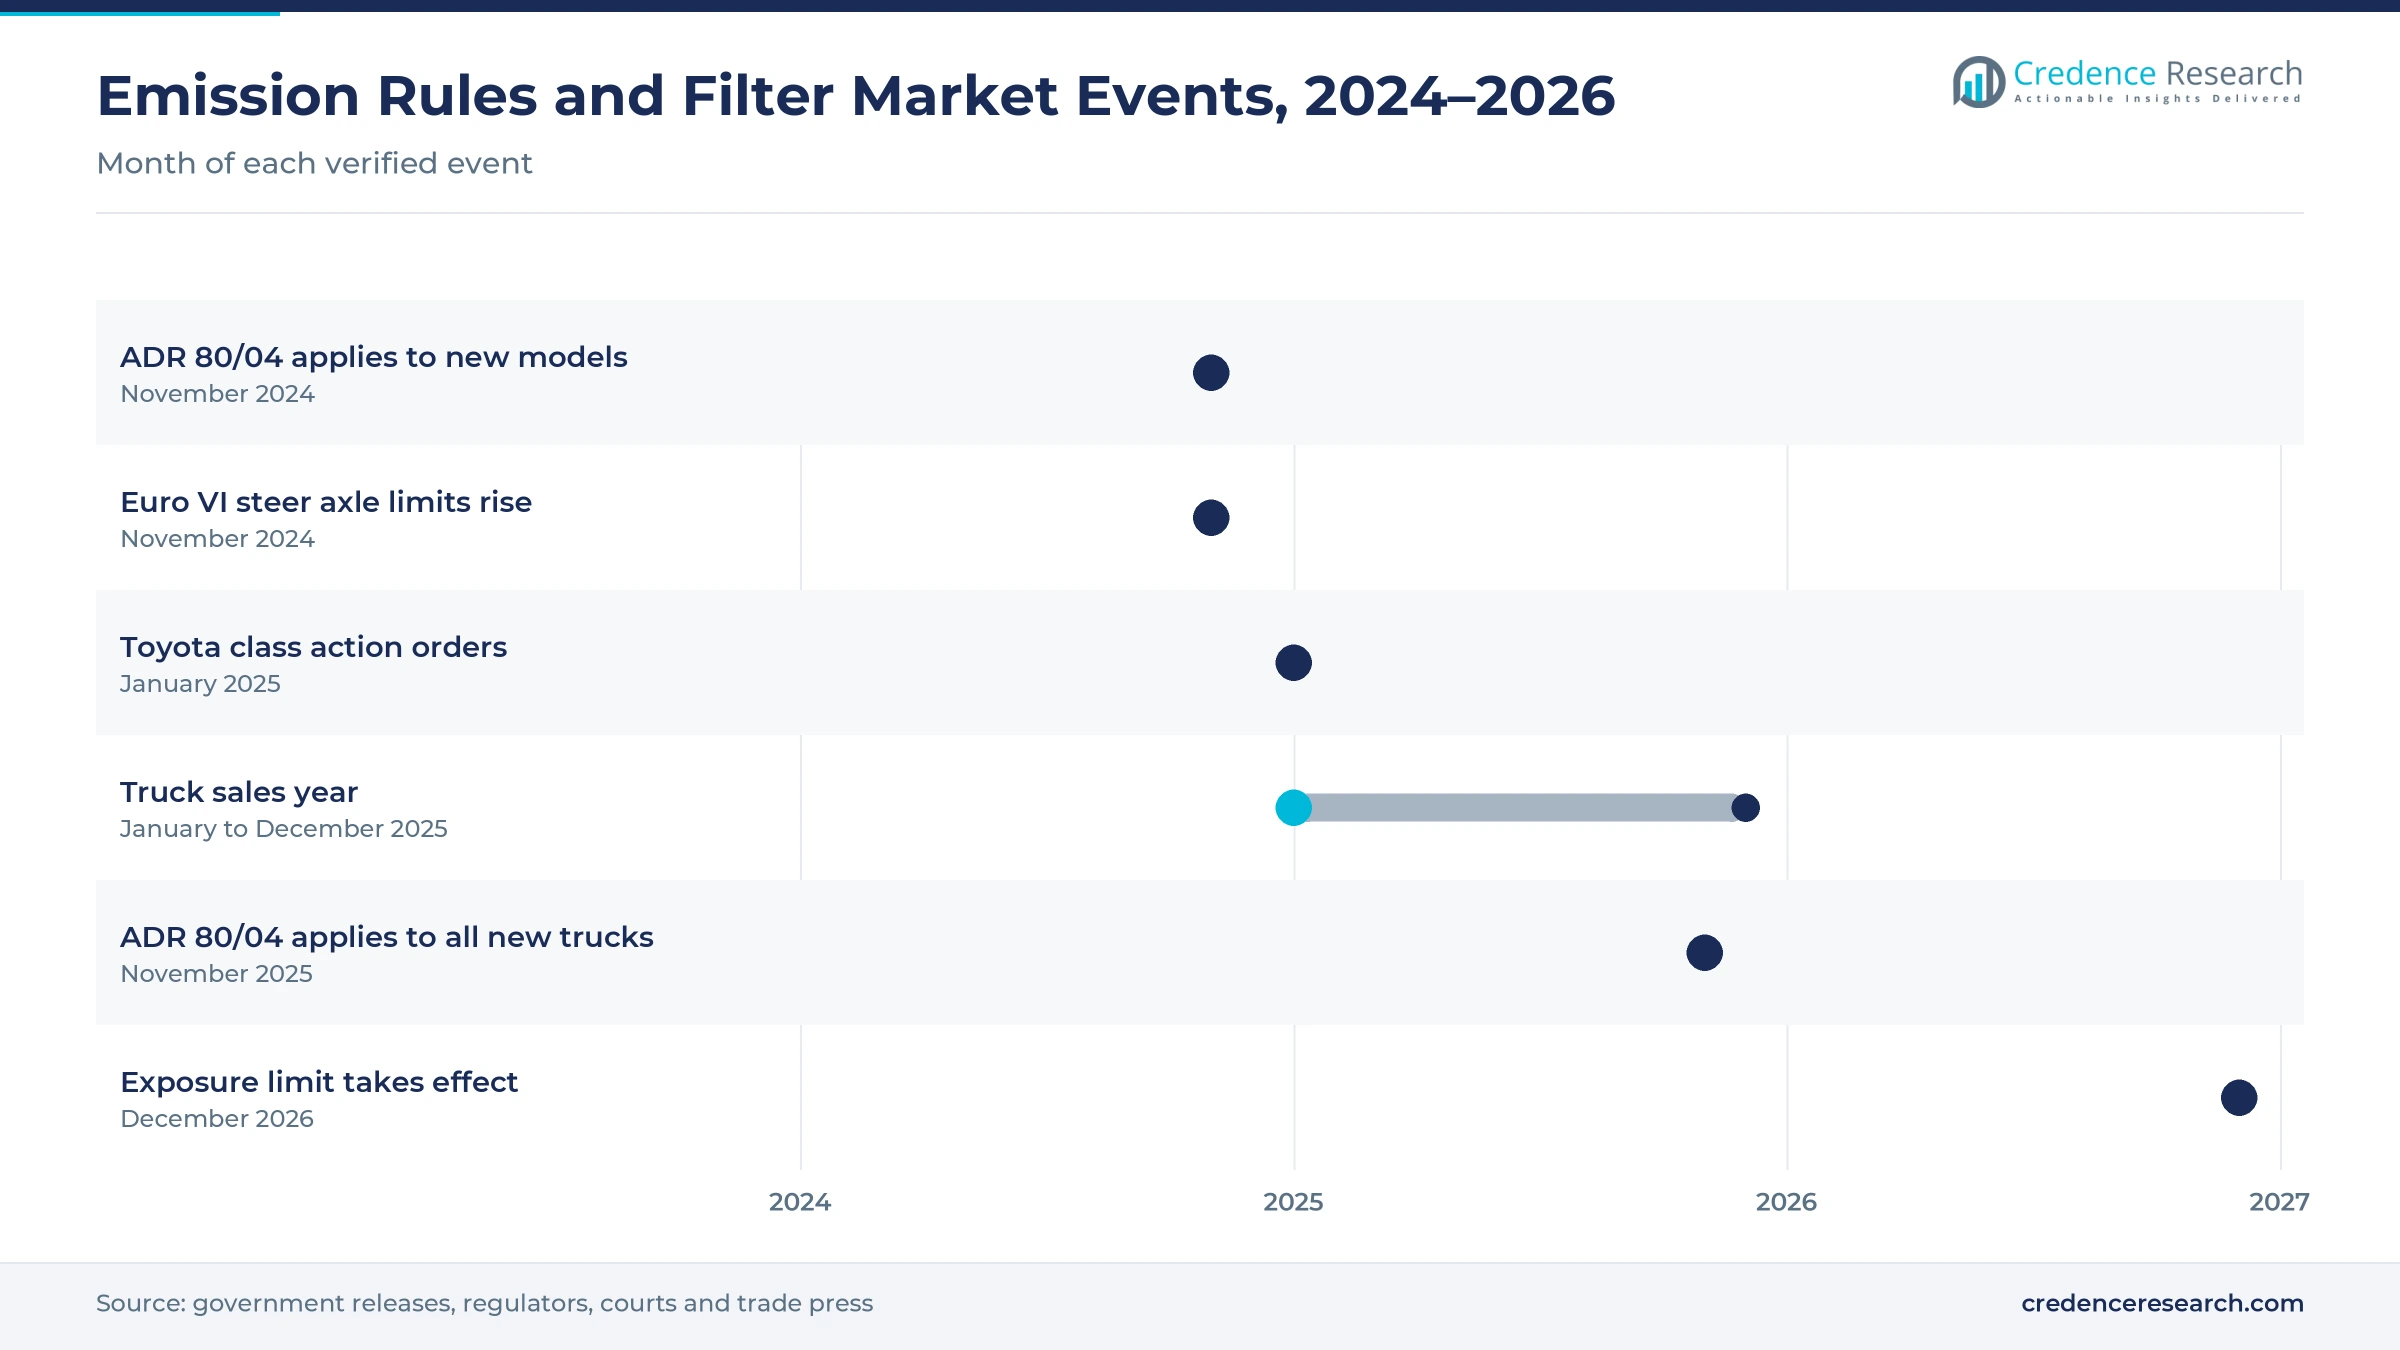
- ADR 80/04 applied Euro VI limits to new heavy vehicle models from Nov. 1, 2024, and to all new heavy vehicles supplied from Nov. 1, 2025.
- A workplace exposure limit of 0.01 mg/m3 for diesel particulate matter takes effect on Dec. 1, 2026, which raises filter use on mine and site machinery.
Replacement units lead as preventive service grows fastest
Why do replacement DPF units lead product demand?
Based on product type, the market is categorized into replacement DPF units, professional DPF services and DPF-related components. Replacement DPF Units led with a 52.0% share of 2025 value, because cracked or heavily blocked filters on older vehicles usually need a new unit. Professional DPF Services grow fastest at 9.41% a year, as fleets clean filters on a schedule to avoid the higher cost of replacement.
How do heavy road vehicles gain weight in demand?
Based on end-use industry, the market is categorized into light road vehicles, heavy road vehicles and off-road equipment. Light Road Vehicles led with 44.0% of 2025 value, because diesel utes and SUVs make up the largest filter-equipped fleet. Heavy Road Vehicles grow fastest at 9.38% a year, as Euro VI trucks with filters enter service and later need cleaning and parts.
Why does failure rectification lead filter spending?
Based on application, the market is categorized into failure rectification, preventive maintenance and identifiable local assembly supply. Failure Rectification led with 55.0% of 2025 value, because many owners act only after a warning light or limp mode appears. Preventive Maintenance grows fastest at 9.49% a year, as fleet managers plan filter cleaning around service intervals to protect uptime.
Why does wholesale distribution lead supply?
Based on sales channel, the market is categorized into wholesale distribution, direct technical supply and service provider fulfilment. Wholesale Distribution led with 46.0% of 2025 value, because parts distributors stock filters for thousands of independent workshops. Service Provider Fulfilment grows fastest at 9.31% a year, as cleaning centers supply exchange units and fitting as one job.
| Segment Group | Leading Sub-segment | Share, 2025 | Fastest-growing Sub-segment | CAGR, 2026–2035 |
|---|---|---|---|---|
| By Product Type | Replacement DPF Units | 52.0% | Professional DPF Services | 9.41% |
| By End-Use Industry | Light Road Vehicles | 44.0% | Heavy Road Vehicles | 9.38% |
| By Application | Failure Rectification | 55.0% | Preventive Maintenance | 9.49% |
| By Sales Channel | Wholesale Distribution | 46.0% | Service Provider Fulfilment | 9.31% |
Request a Free Sample
Fill in your details and we'll send you a free sample report.
- Sample data tables & charts
- Research methodology
Euro VI rules, fleet age and ute sales sustain demand
How does the heavy-vehicle emissions transition lift demand?
The heavy-vehicle emissions transition lifts filter demand, because every new Euro VI truck adds an exhaust filter that will need cleaning and parts later in its life. The Truck Industry Council announced in January 2026 that truck and heavy van sales reached 45,191 units in 2025, the third-best year on record, according to Big Rigs. Heavy-duty sales were 14,297 units, while light-duty trucks reached 13,712 units over the same year. Higher steer axle mass limits for Euro VI trucks also took effect on Nov. 1, 2024, which rewards operators that buy compliant models. As a result, heavy road vehicles grow fastest at 9.38% a year, as Euro VI fleets move from warranty into regular filter service.
Why does ADR 80/04 make filters standard on new trucks?
ADR 80/04 makes exhaust filtration standard on new trucks, because it sets Euro VI limits for all new heavy vehicles over 3.5 metric tons gross vehicle mass. The federal government signed the rule in February 2023, well before it applied. The rule applied to new models from Nov. 1, 2024, and to all new heavy vehicles supplied from Nov. 1, 2025, according to the federal transport department. Particulate mass limits fall to 10 mg/kWh, which is 50% to 66% lower than Euro V limits. The rule also adds a particle number limit, stricter on-board diagnostics and longer durability requirements for emission controls. In turn, workshops that service selective catalytic reduction systems also add filter work.
How does an ageing equipped fleet sustain replacement?
An ageing equipped fleet sustains replacement demand, because filters wear, crack or block as vehicles cover more kilometers. Trucks on Australian roads averaged about 16.2 years of age, light commercial vehicles about 11.4 years and buses about 13 years, based on federal transport statistics. Diesel vehicles also made up about 29% of the ageing fleet, which shows how many engines still rely on exhaust aftertreatment. The diesel Toyota Hilux, Prado and Fortuner models with 1GD-FTV or 2GD-FTV engines bought between October 2015 and April 2020 are covered by a filter class action. As a result, failure rectification held 55.0% of 2025 value, as owners of older vehicles replace failed units.
Why do diesel ute and SUV sales replenish the base?
Diesel ute and SUV sales replenish the filter-equipped base, because most light diesel models sold in Australia carry a factory filter. Diesel registrations reached 364,605 vehicles in 2025, including 231,630 light commercial vehicles and 122,603 SUVs, according to VFACTS data reported by The Canberra Times. Diesel SUV sales rose 6.0% over 2024, even as diesel light commercial sales fell 5.4%. The Ford Ranger was the top-selling vehicle in 2025 with 56,555 sales, while the Toyota HiLux sold 51,297 units. In turn, light road vehicles held 44.0% of 2025 value, as owners of pickup trucks return for filter cleaning and replacement.
Cleaning services and certified units reshape aftermarket
How is the shift toward cleaning services changing repairs?
The shift toward professional cleaning is changing repair choices, because cleaning a filter costs less than buying a new unit for many vehicles. Western Filters, based in Blacktown in Sydney, says it was the first company set up to clean these filters in Australia and has supplied aftermarket filters since 1981. Australian DPF Centre in Hallam, Victoria, cleans filters with ultrasonic and flash jet methods for vehicles from cars to heavy machinery. Diesel registrations of 364,605 vehicles in 2025 also give cleaning centers a large base of filters to service. As a result, professional DPF services grow fastest at 9.41% a year, while service provider fulfilment grows at 9.31% a year as cleaning centers ship exchange units.
Why is the rise of tested aftermarket units notable?
The rise of tested aftermarket units is notable, because workshops want filters that match original equipment performance and protect vehicle warranties. Ryco Filters sells particulate filters with platinum group metal loading set to original specification, and it says its range is tested and approved to EU emission standards. Ryco also supplies a fitting kit and a diagnosis chart with each unit, and it offers a 12-month warranty. The range is described as covering most vehicles in Australia, which widens access for independent workshops. In turn, wholesale distribution held 46.0% of 2025 value, as parts distributors stock branded units for fast fitting alongside exhaust systems.
Can preventive service programs open new fleet demand?
Preventive service programs can open new fleet demand, because planned cleaning avoids roadside failures and lost trips. Federal Court orders in the Toyota filter class action were made on Jan. 29, 2025, and a notice to group members followed on Feb. 21, 2025. The case covers diesel Hilux, Prado and Fortuner models sold over more than four years, which has raised owner awareness of filter faults. Australia also recorded mean annual PM2.5 exposure of about 6.41 micrograms per cubic meter in 2023, according to World Bank data. As a result, preventive maintenance grows fastest at 9.49% a year, as fleet managers book filter service into routine maintenance.
Is there room to grow in mine and site machinery?
Mine and site machinery leave room to grow, because a much lower workplace limit for diesel particulate matter is about to apply. NOPSEMA announced in July 2026 that a limit of 0.01 mg/m3, measured as respirable elemental carbon, takes effect on Dec. 1, 2026, according to its guidance. New South Wales mines currently work to a standard of 0.1 mg/m3, which is ten times higher than the new limit. Queensland mine inspectors also recommend 0.1 mg/m3 for underground coal and metal mines, which shows how far exposure must fall. In turn, off-road equipment grows at a strong pace, as owners of underground mining equipment fit and service filters to cut exposure.
Short-trip duty cycles and cost pressure weigh on buyers
How do short-trip duty cycles shorten filter life?
Short-trip duty cycles shorten filter life, because engines that rarely reach full temperature cannot burn off trapped soot. Urban utes and delivery trucks are most affected, since they make many short runs each day. As a result, owners face warning lights, forced regeneration and early filter failure. Workshops respond with driver advice, software checks and planned cleaning. Better owner education should reduce avoidable failures and repeat repairs over time.
Why does replacement cost delay owner decisions?
Replacement cost delays owner decisions, because a new filter can cost several thousand dollars before labor. Private owners of older utes feel this most, since the repair bill can approach the value of the vehicle. In turn, some owners delay repairs or look for illegal removal. Suppliers respond with cleaning services, exchange units and lower-cost aftermarket ranges. Clearer cost options should keep more owners on compliant repairs.
How does illegal filter removal hurt the market?
Illegal filter removal hurts the market, because some operators remove or bypass filters to avoid repair costs. Tampering lowers legitimate demand and raises particulate emissions in towns and work sites. As a result, compliant workshops lose jobs to operators that offer removal. Regulators respond with roadside checks and penalties, while industry groups promote legal repair. Stronger enforcement would protect demand for compliant parts and services.
Why do imported substrates expose supply to delays?
Imported substrates expose supply to delays, because ceramic cores and catalyst coatings are made mostly overseas. Local brands depend on shipping schedules and currency rates for every new batch. In turn, rare fitments can face long lead times when stock runs out. Suppliers respond with larger safety stock and broader cleaning capacity. Wider local stock should shorten waiting times for fleets and workshops.
New South Wales leads while Queensland grows fastest
| Region | Value, 2025 (USD million) | Share, 2025 | CAGR, 2026–2035 |
|---|---|---|---|
| New South Wales and Australian Capital Territory | 34.2 | 33.7% | 8.83% |
| Victoria and Tasmania | 25.0 | 24.6% | 8.73% |
| Western Australia and South Australia | 21.8 | 21.5% | 9.08% |
| Queensland and Northern Territory | 20.5 | 20.2% | 9.23% |
Why do new South Wales and the ACT hold the largest share?
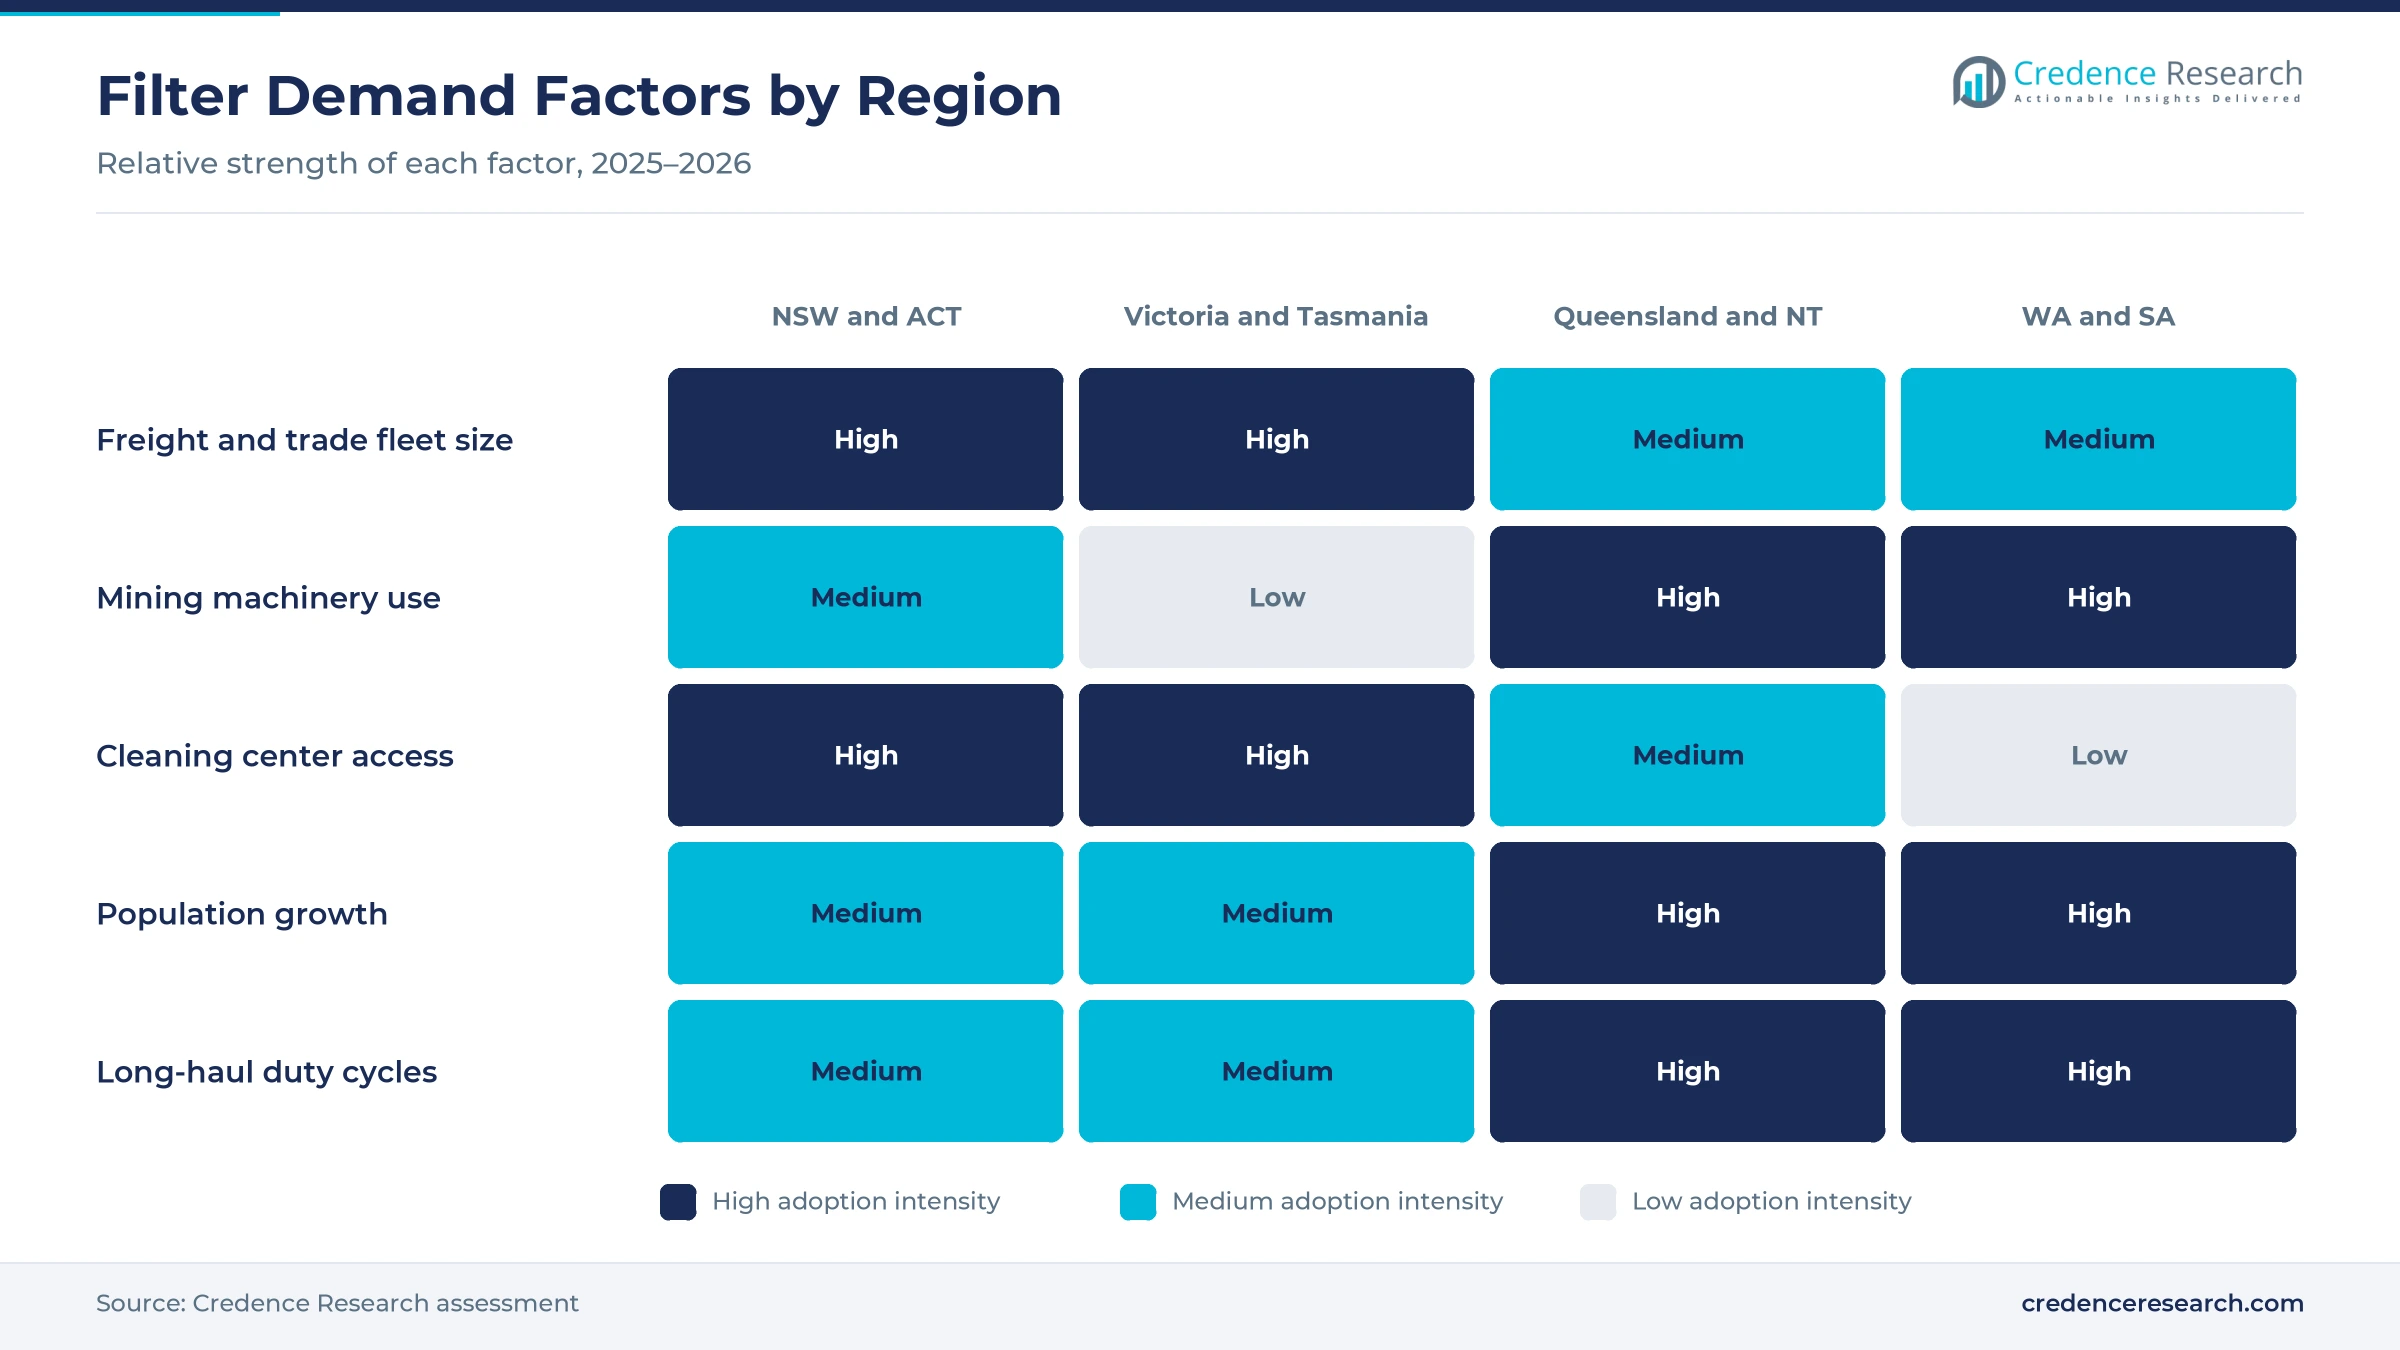
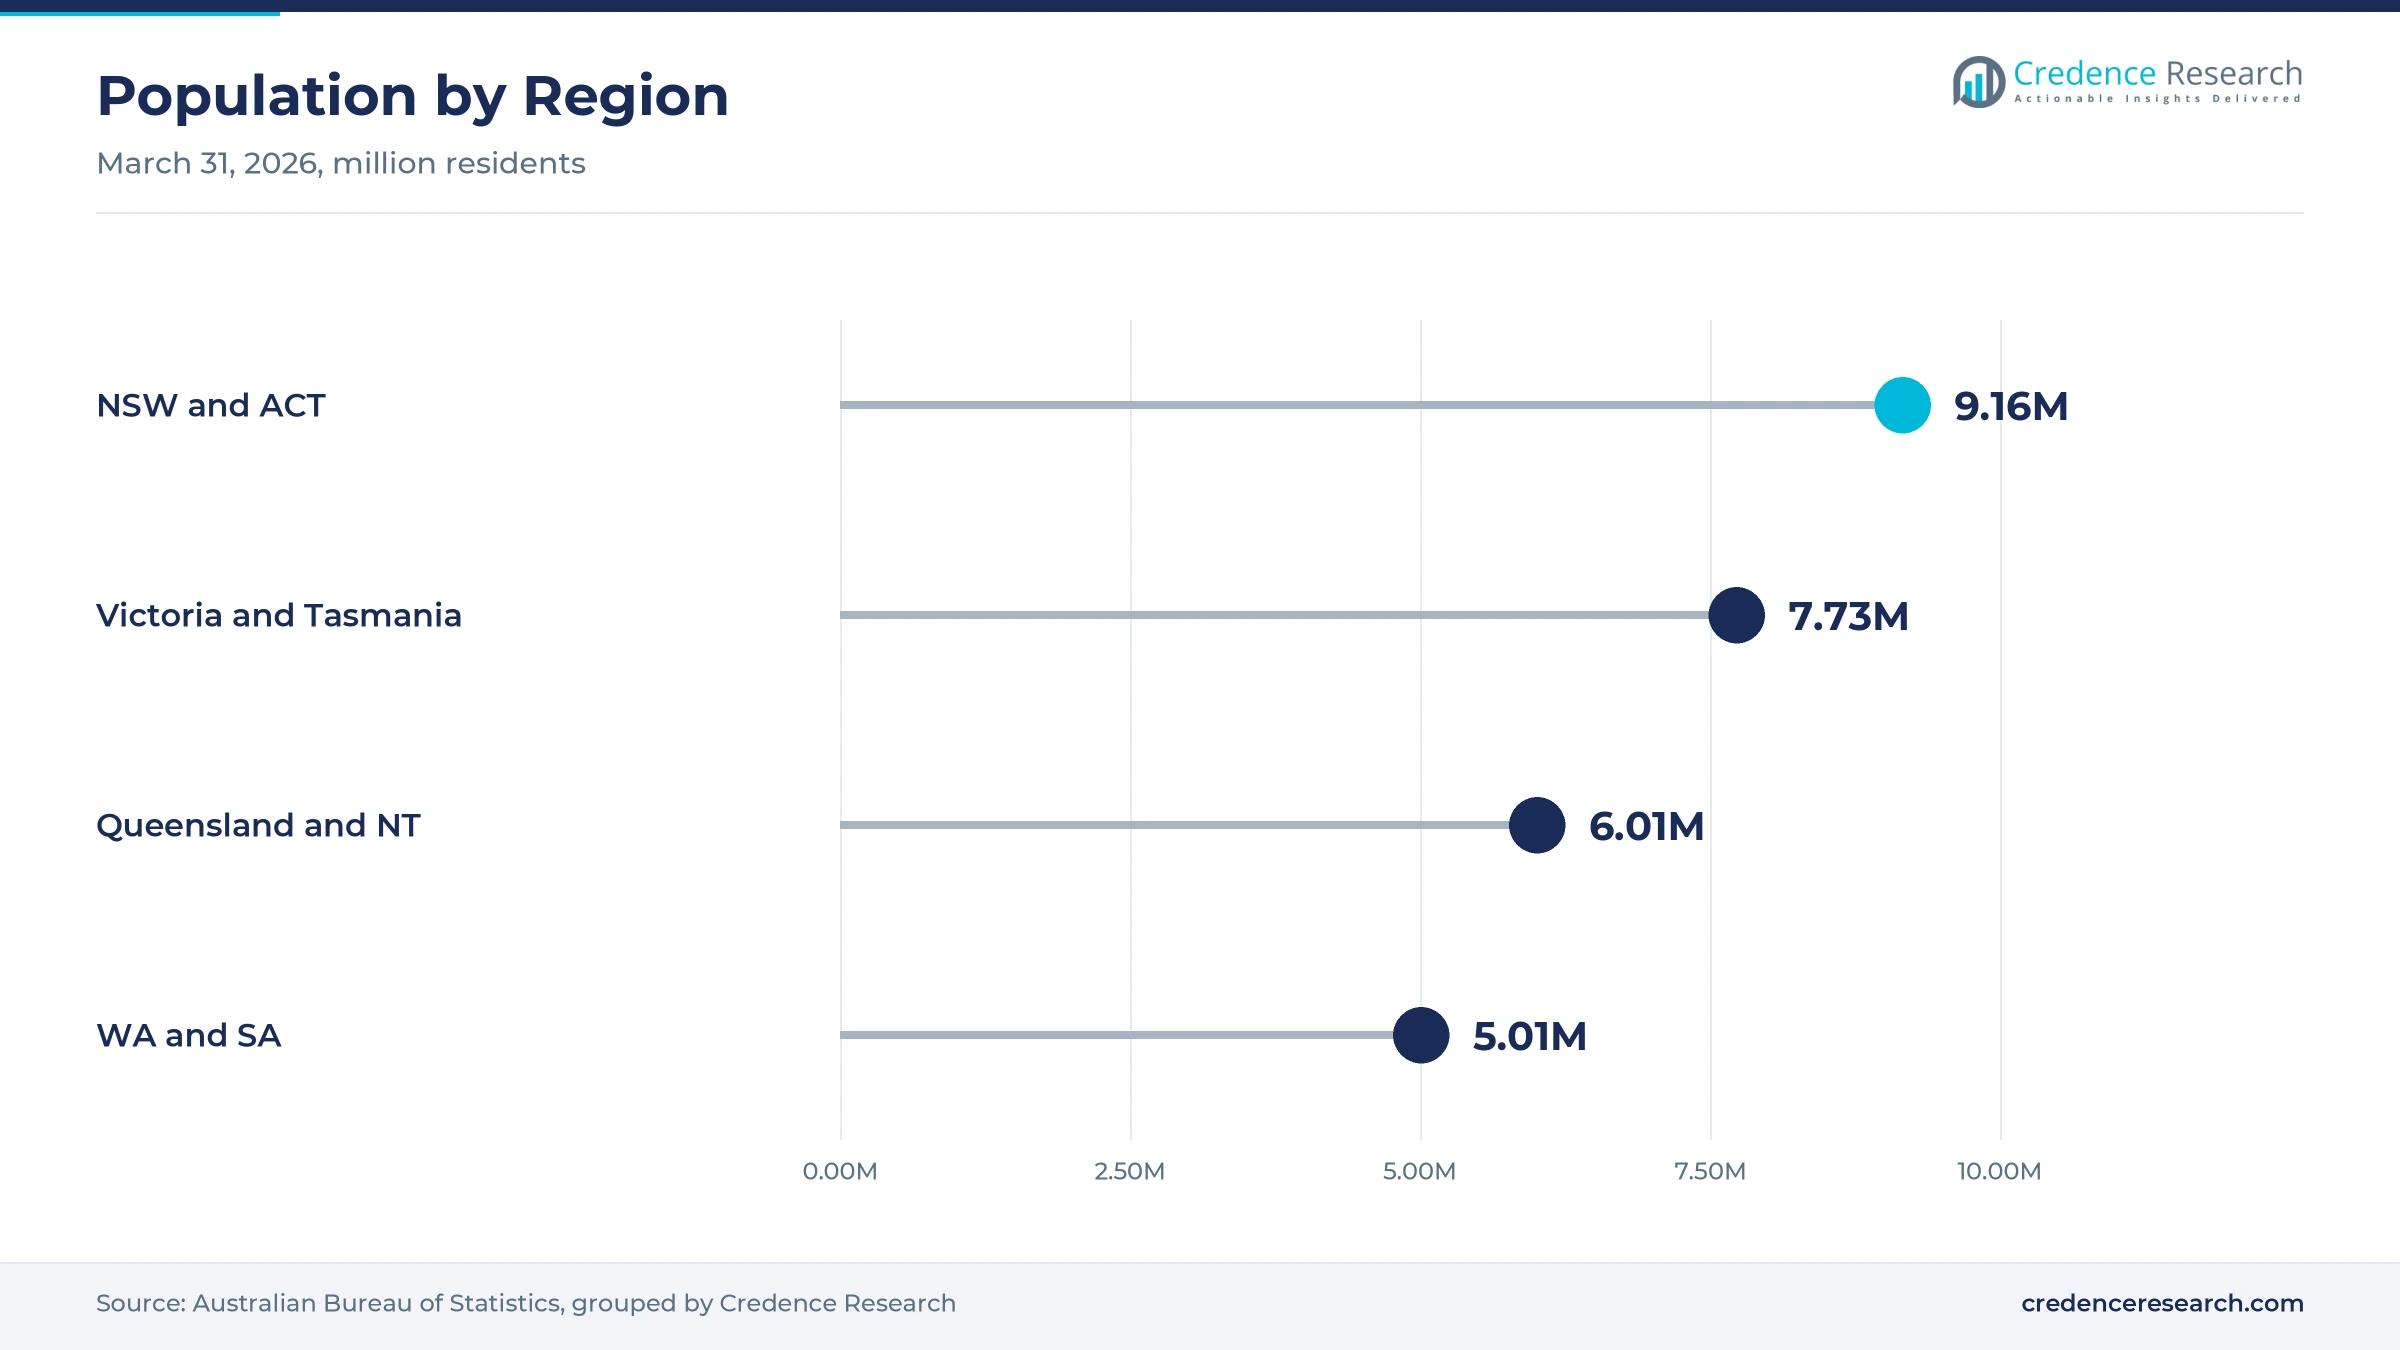
New South Wales and Australian Capital Territory held 33.7% of 2025 value and grow at 8.83% a year, because Sydney hosts the largest freight, trade and delivery fleet in the country. New South Wales had about 8.67 million residents at March 31, 2026, while the ACT had about 490,000. As a result, the region has the most workshops and cleaning centers. As the most populous region, it accounts for about a third of national filter demand in 2025. Western Filters in Blacktown and Sydney Diesel Centre in Smithfield both serve diesel users in western Sydney.
How do Victoria and Tasmania sustain filter demand?
Victoria and Tasmania held 24.6% of 2025 value and grow at 8.73% a year, because Melbourne is a major freight and logistics hub. Victoria added about 109,500 residents in the year to March 2026, the largest increase of any state. Australian DPF Centre in Hallam supports local cleaning capacity for cars and heavy machinery. Tasmania has an older vehicle fleet, which means more diesel vehicles reach the age when filters need service.
Why is Queensland and Northern Territory the fastest-growing region?
Queensland and Northern Territory held 20.2% of 2025 value and grow fastest at 9.23% a year, because coal mining, agriculture and long-haul freight keep diesel engines busy. Queensland added about 90,100 residents in the year to March 2026, growth of 1.6%. Queensland mine inspectors already recommend a 0.1 mg/m3 exposure limit for underground mines, and the new national limit is lower. In turn, mine operators and fleets plan more filter service.
How do western Australia and South Australia add demand?
Western Australia and South Australia held 21.5% of 2025 value and grow at 9.08% a year, because iron ore mining and long road trains rely on heavy diesel engines. Western Australia recorded the fastest state population growth at 2.1% in the year to March 2026. South Australia adds demand from agriculture and freight, while mine sites in both states prepare for the lower workplace exposure limit.
ADR 80/04 milestones defined 2024 and 2025
| Development | Status and market relevance |
|---|---|
| In November 2024, ADR 80/04 began to apply Euro VI emission limits to newly approved heavy vehicle models in Australia. | Makes exhaust filtration standard on new truck models |
| In November 2024, higher steer axle mass limits took effect for trucks that comply with ADR 80/04. | Rewards fleets that buy Euro VI trucks with filters |
| In January 2025, the Federal Court made orders in the Toyota diesel filter class action. | Raises owner awareness of filter faults on popular utes |
| In November 2025, ADR 80/04 began to apply to all new heavy vehicles supplied in Australia. | Completes the shift of new truck supply to Euro VI |
| In July 2026, NOPSEMA advised that the 0.01 mg/m3 diesel exposure limit takes effect in December 2026. | Pushes mine and site operators toward filter use |
Substrate choice and cleaning methods shape service
- Cordierite substrate systems use a lower-cost ceramic core, which suits many light diesel vehicles and keeps replacement prices lower.
- Silicon carbide substrate systems tolerate higher temperatures during regeneration, which suits heavy and hard-working engines.
- Alternative substrate systems include metal and specialty ceramic designs, which serve niche fitments and off-road machines.
- Ultrasonic and flash jet cleaning removes ash and soot from used filters, which lets fleets reuse units instead of buying new ones.
Need a Custom Version of This Report?
Tailor the scope, geography, or segments to your exact requirements.
- Custom geography or segment scope
- Direct access to our analyst team
Suppliers compete on fitment range, testing and turnaround
Competition centers on fitment range, product testing, cleaning turnaround and supply through parts distributors. Ryco Filters supplies particulate filters with platinum group metal loading set to original specification and says its range covers most vehicles in Australia. Western Filters runs a filter cleaning operation in Blacktown and has supplied aftermarket filters since 1981. Australian DPF Centre cleans filters in Hallam, Victoria, with ultrasonic and flash jet methods for cars and heavy machinery. Sydney Diesel Centre is a Kubota dealer in Smithfield that services diesel engines and generators. Suppliers that pair tested units with fast cleaning and exchange service win fleet accounts. Heavy-duty truck sales of 14,297 units in 2025 will add filter demand once these trucks leave warranty. Replacement DPF units held 52.0% of 2025 value, so brands with broad fitment ranges hold an advantage with independent workshops.
Companies profiled and their roles in this market
| Company | Type | Role in the market |
|---|---|---|
| Ryco Filters | Filter brand | Supplies tested replacement particulate filters for most vehicles |
| Western Filters | Cleaning and filter supplier | Cleans filters in Blacktown and supplies aftermarket filters |
| Australian DPF Centre | Cleaning center | Cleans filters with ultrasonic and flash jet methods in Hallam |
| Sydney Diesel Centre | Engine dealer and service | Services Kubota diesel engines and generators in Smithfield |
Credence Research view on Australian exhaust filtration
Credence Research's view is that Australian demand for exhaust filters and filter service will grow steadily because Euro VI trucks now carry filters and the diesel fleet keeps ageing. Replacement units keep the largest share, while professional cleaning grows faster as fleets plan service. Queensland and Northern Territory should grow fastest among the regions through 2035 as mining and freight expand. However, cost pressure and illegal removal will slow some demand. Suppliers with tested units, broad fitment and fast cleaning should gain share.
Vehicle rules and sales data anchor the filter model
The report uses 2025 as the base year on a calendar basis, and market values come from the Credence Research model. That model combines vehicle sales and registration data, truck sales data, the ADR 80/04 rule, workplace exposure limits, population data, World Bank air quality data and company information. Segment splits and regional growth rates are Credence Research estimates, while regional shares follow the client-defined split. Sources used are government releases, regulator bulletins, industry association releases, trade press and company pages, and no interviews or surveys were used.
Euro VI trucks and mine rules carry growth to 2035
Spending on these filters and services is expected to reach USD 238.1 million by 2035, an 8.94% CAGR during 2026–2035, as Euro VI trucks age and mine sites tighten exposure controls. Growth should be strongest after 2028, when the first Euro VI trucks leave warranty and need regular filter service. After that, the pace of truck electrification will set heavy vehicle demand. Faster fleet renewal would shift value toward cleaning, while slower renewal would keep replacement units in demand. Service provider fulfilment is expected to gain channel share through 2035, as exchange cleaning spreads.
Frequently Asked Questions
How big is the Australia diesel particulate filter market?
Which product type leads demand in Australia?
Which region leads the Australian market?
How does ADR 80/04 affect filter demand?
Why do older vehicles drive replacement demand?
Which application grows fastest?
Who are the leading suppliers in Australia?
What are the main challenges for suppliers?
Table of Content
Chapter 1 Market Segmentation
- 1.1 Segmentation Framework
- 1.1.1 Product and Service Classification
- 1.1.2 Application and End-Use Classification
- 1.1.3 Technology and Solution Classification
- 1.1.4 Customer and Distribution Channel Classification
- 1.1.5 Geographic Segmentation
- 1.1.6 Market Segment Definitions and Boundaries
- 1.2 By Product Type
- 1.2.1 Replacement DPF Units
- 1.2.2 Professional DPF Services
- 1.2.3 DPF-Related Components
- 1.3 By End-Use Industry
- 1.3.1 Light Road Vehicles
- 1.3.2 Heavy Road Vehicles
- 1.3.3 Off-Road Equipment
- 1.4 By Application
- 1.4.1 Failure Rectification
- 1.4.2 Preventive Maintenance
- 1.4.3 Identifiable Local Assembly Supply
- 1.5 By Sales Channel
- 1.5.1 Wholesale Distribution
- 1.5.2 Direct Technical Supply
- 1.5.3 Service Provider Fulfilment
Chapter 2 Introduction
- 2.1 Report Objectives and Scope
- 2.2 Product Definition and Industry Terminology
- 2.3 Market Inclusions and Exclusions
- 2.4 Research Process
- 2.4.1 Primary Research and Expert Interviews
- 2.4.2 Secondary Research and Source Review
- 2.4.3 Top-Down and Bottom-Up Estimation
- 2.4.4 Data Triangulation and Verification
- 2.5 Market Size Measurement Basis
- 2.5.1 2025: USD 101.5 million → 2035: USD 238.1 million
- 2.6 Historical and Forecast Reference Periods
- 2.6.1 Historical Period: 2018-2025
- 2.6.2 Base Year: 2025
- 2.6.3 Forecast Period: 2025-2035
- 2.7 Research Assumptions and Limitations
Chapter 3 Executive Summary
- 3.1 Market Snapshot and Key Findings
- 3.2 Base-Year Market Size, 2025
- 3.3 Forecast Market Size, 2035
- 3.4 Revenue and Volume Growth Outlook
- 3.5 Key Demand and Supply Indicators
- 3.6 Leading Market Segments
- 3.7 Fastest-Growing Market Opportunities
- 3.8 Regional Performance Highlights
- 3.9 Technology and Industry Transformation
- 3.10 Competitive Landscape Summary
- 3.11 Analyst View and Strategic Implications
Chapter 4 Australia Diesel Particulate Filter Market Trends and Developments
- 4.1 Historical Industry Development, 2018-2025
- 4.2 Recent Market Trends and Developments
- 4.3 Demand and Customer Behavior Trends
- 4.4 Technology and Product Innovation
- 4.5 Artificial Intelligence, Automation and Digitalization
- 4.6 Local Manufacturing and Supply Chain Realignment
- 4.7 Industry Partnerships, Mergers and Acquisitions
- 4.8 Sustainability and Circular Economy Developments
- 4.9 Government and Private Sector Investment Trends
- 4.10 Emerging Business Models and Commercialization
- 4.11 Industry Developments and Announcements
Chapter 5 Australia Diesel Particulate Filter Market Production, Supply and Demand Analysis
- 5.1 Demand Trend and Consumption Analysis, 2018-2025
- 5.2 Demand Forecast, 2025-2035
- 5.3 Production and Output Trend, 2018-2025
- 5.4 Production and Output Forecast, 2025-2035
- 5.5 Installed Capacity and Capacity Utilization
- 5.6 Company-Wise Production Plants and Statistics
- 5.6.1 Installed Production Capacity
- 5.6.2 Actual Production
- 5.6.3 Planned Capacity and Expansion Targets
- 5.7 Supply Chain Structure and Procurement Trends
- 5.8 Supply-Demand Gap and Bottlenecks
- 5.9 Import Dependence and Sourcing Structure
- 5.10 Contract Manufacturing and Outsourcing
- 5.11 Regional Supply and Demand Concentration
Chapter 6 Australia Diesel Particulate Filter Market Pricing Analysis
- 6.1 Pricing Structure and Measurement
- 6.2 Historical Pricing Trends, 2018-2025
- 6.3 Pricing Outlook, 2025-2035
- 6.4 Average Selling Price and Unit Economics
- 6.5 Pricing by Product and Market Segment
- 6.6 Geographic Pricing Differences
- 6.7 Key Input, Energy, Labor and Logistics Costs
- 6.8 Contract Pricing and Purchasing Models
- 6.9 Pricing Sensitivity and Competitive Positioning
- 6.10 Price, Margin and Profitability Implications
Chapter 7 Australia Diesel Particulate Filter Market Dynamics
- 7.1 Market Growth Drivers
- 7.1.1 Demand-Side Drivers
- 7.1.2 Technology and Innovation Drivers
- 7.1.3 Infrastructure and Investment Drivers
- 7.1.4 Regulatory and Policy Drivers
- 7.2 Market Restraints
- 7.2.1 Cost and Affordability Constraints
- 7.2.2 Technology and Adoption Barriers
- 7.2.3 Supply Chain and Operational Constraints
- 7.3 Market Challenges
- 7.3.1 Competitive Pressure and Margin Erosion
- 7.3.2 Skills, Infrastructure and Implementation Gaps
- 7.4 Emerging Market Opportunities
- 7.5 Market Dynamics Impact and Time-Horizon Assessment
Chapter 8 Australia Diesel Particulate Filter Value Chain Analysis
- 8.1 Industry Value Chain Overview
- 8.2 Upstream Suppliers and Critical Inputs
- 8.3 Technology and Component Providers
- 8.4 Manufacturing or Service Delivery
- 8.5 Distribution, Channel Partners and Integrators
- 8.6 Downstream Applications and End Users
- 8.7 Value Addition and Profit Pools
- 8.8 Vertical Integration and Outsourcing
- 8.9 Supplier Concentration and Risk
- 8.10 Supply Chain Localization and Resilience
Chapter 9 Australia Diesel Particulate Filter Market Regulations and Policies
- 9.1 Relevant Laws, Standards and Compliance Frameworks
- 9.2 Product, Service, Safety and Quality Requirements
- 9.3 Government Policies, Incentives and Subsidies
- 9.4 Imports, Exports and Trade Barriers
- 9.5 Public Procurement and Local Content Requirements
- 9.6 Environmental and Sustainability Compliance
- 9.7 Upcoming Policy Changes and Market Implications
Chapter 10 Australia Diesel Particulate Filter Market Hotspots and Opportunities
- 10.1 Market Opportunity Mapping and Growth Hotspots
- 10.2 High-Growth Applications and Customer Groups
- 10.3 Underserved Markets and White-Space Opportunities
- 10.4 Emerging Technology and Product Opportunities
- 10.5 New Capacity and Investment Hotspots
- 10.6 Market Entry and Expansion Opportunities
- 10.7 Distribution and Partnership Opportunities
- 10.8 Near-Term and Long-Term Commercial Potential
- 10.9 Opportunity Attractiveness and Execution Risks
Chapter 11 Australia Diesel Particulate Filter Market Outlook, 2025-2035
- 11.1 Market Size and Analysis
- 11.1.1 Revenue (Market Measurement: 2025: USD 101.5 million → 2035: USD 238.1 million)
- 11.1.2 Market Volume and Quantity Sold
- 11.1.3 Historical Market Size, 2018-2025
- 11.1.4 Base-Year Market Size, 2025
- 11.2 Market Forecast, 2025-2035
- 11.2.1 Revenue Forecast to 2035
- 11.2.2 Volume Forecast to 2035
- 11.2.3 CAGR and Year-on-Year Growth
- 11.2.4 Incremental Revenue Opportunity
- 11.3 Forecast Assumptions and Scenario Analysis
- 11.3.1 Base-Case Forecast
- 11.3.2 Optimistic and Conservative Scenarios
- 11.3.3 Technology, Pricing and Policy Sensitivities
- 11.4 Market Attractiveness and Growth Outlook
Chapter 12 Australia Diesel Particulate Filter Market Segmentation and Outlook
- 12.1 Segmentation Summary and Market Shares, 2025
- 12.2 Largest and Fastest-Growing Segments
- 12.3 By Product Type - Market Size and Forecast, 2025-2035
- 12.3.1 Segment Definition and Scope
- 12.3.2 Historical Market Size, 2018-2025
- 12.3.3 Revenue Forecast, 2025-2035
- 12.3.4 Volume Forecast, 2025-2035
- 12.3.5 Base-Year Market Share, 2025
- 12.3.6 Segment CAGR and Growth Drivers
- 12.3.7 Subsegment Market Size and Forecast
- 12.3.7.1 Replacement DPF Units
- 12.3.7.2 Professional DPF Services
- 12.3.7.3 DPF-Related Components
- 12.3.8 Subsegment Pricing and Adoption Trends
- 12.3.9 Leading Suppliers and Competition
- 12.3.10 Regional Demand and Opportunities
- 12.4 By End-Use Industry - Market Size and Forecast, 2025-2035
- 12.4.1 Segment Definition and Scope
- 12.4.2 Historical Market Size, 2018-2025
- 12.4.3 Revenue Forecast, 2025-2035
- 12.4.4 Volume Forecast, 2025-2035
- 12.4.5 Base-Year Market Share, 2025
- 12.4.6 Segment CAGR and Growth Drivers
- 12.4.7 Subsegment Market Size and Forecast
- 12.4.7.1 Light Road Vehicles
- 12.4.7.2 Heavy Road Vehicles
- 12.4.7.3 Off-Road Equipment
- 12.4.8 Subsegment Pricing and Adoption Trends
- 12.4.9 Leading Suppliers and Competition
- 12.4.10 Regional Demand and Opportunities
- 12.5 By Application - Market Size and Forecast, 2025-2035
- 12.5.1 Segment Definition and Scope
- 12.5.2 Historical Market Size, 2018-2025
- 12.5.3 Revenue Forecast, 2025-2035
- 12.5.4 Volume Forecast, 2025-2035
- 12.5.5 Base-Year Market Share, 2025
- 12.5.6 Segment CAGR and Growth Drivers
- 12.5.7 Subsegment Market Size and Forecast
- 12.5.7.1 Failure Rectification
- 12.5.7.2 Preventive Maintenance
- 12.5.7.3 Identifiable Local Assembly Supply
- 12.5.8 Subsegment Pricing and Adoption Trends
- 12.5.9 Leading Suppliers and Competition
- 12.5.10 Regional Demand and Opportunities
- 12.6 By Sales Channel - Market Size and Forecast, 2025-2035
- 12.6.1 Segment Definition and Scope
- 12.6.2 Historical Market Size, 2018-2025
- 12.6.3 Revenue Forecast, 2025-2035
- 12.6.4 Volume Forecast, 2025-2035
- 12.6.5 Base-Year Market Share, 2025
- 12.6.6 Segment CAGR and Growth Drivers
- 12.6.7 Subsegment Market Size and Forecast
- 12.6.7.1 Wholesale Distribution
- 12.6.7.2 Direct Technical Supply
- 12.6.7.3 Service Provider Fulfilment
- 12.6.8 Subsegment Pricing and Adoption Trends
- 12.6.9 Leading Suppliers and Competition
- 12.6.10 Regional Demand and Opportunities
- 12.7 Segment Growth Comparison
- 12.8 Segment Attractiveness and Priority Matrix
Chapter 13 Australia Diesel Particulate Filter End-Use and Application Market Outlook
- 13.1 End-Use Industry and Customer Demand Structure
- 13.2 Leading Applications and Customer Groups
- 13.3 End-Use Market Size, Share and Forecast
- 13.4 Major End-Use Industry Deep Dives
- 13.4.1 Customer Requirements and Use Cases
- 13.4.2 Demand and Replacement Cycles
- 13.4.3 Technical and Regulatory Considerations
- 13.4.4 Purchasing and Procurement Models
- 13.4.5 Leading Vendors and Distribution Channels
- 13.4.6 Forecast and Commercial Opportunities
- 13.5 Emerging Applications and Cross-Segment Demand
- 13.6 End-Use Industry Investment Priorities
Chapter 14 Australia Diesel Particulate Filter Geographic Market Outlook, 2025-2035
- 14.1 Domestic Market Distribution and Demand Clusters
- 14.2 State- or Province-Wise Market Size and Forecast, 2025-2035
- 14.3 City and Metropolitan Market Outlook
- 14.4 Industrial, Manufacturing and Commercial Clusters
- 14.5 Geographic Concentration of Key End Users
- 14.6 Local Pricing and Purchasing Differences
- 14.7 Domestic Production Facilities and Capacity Map
- 14.8 Local Infrastructure and Project Pipeline
- 14.9 State-Level Policy and Incentive Differences
- 14.10 Subnational Investment Hotspots and Opportunities
- 14.11 Distribution and Logistics Networks
- 14.12 Domestic Competitive Footprint
Chapter 15 Australia Diesel Particulate Filter Technology, Innovation and Sustainability Outlook
- 15.1 Technology Landscape and Maturity
- 15.2 Product, Process and Service Innovation
- 15.3 AI, Automation and Digital Tools in the Industry
- 15.4 Technology Adoption and Performance Benchmarking
- 15.5 Innovation Pipeline and R&D Investment
- 15.6 Patent and Intellectual Property Trends
- 15.7 Energy Efficiency and Resource Management
- 15.8 Sustainability, Recycling and Circularity
- 15.9 Technology Roadmap, 2025-2035
- 15.10 Risks of Obsolescence and Technology Substitution
Chapter 16 Australia Diesel Particulate Filter Market Key Strategic Imperatives
- 16.1 Growth and Market Entry Priorities
- 16.2 High-Return Products and Segments
- 16.3 Pricing, Profitability and Cost Optimization
- 16.4 Technology Investment and Product Differentiation
- 16.5 Supply Chain Localization and Resilience
- 16.6 Distribution and Customer Acquisition
- 16.7 Partnership, Acquisition and Capacity Strategy
- 16.8 Regional Expansion Priorities
- 16.9 Short-, Medium- and Long-Term Actions
Chapter 17 Competition Outlook
- 17.1 Industry Competition Characteristics
- 17.2 Market Structure and Concentration
- 17.3 Market Share and Competitive Positioning, 2025
- 17.4 Company-Wise Revenue and Product Benchmarking
- 17.5 Production and Service Capacity Benchmarking
- 17.6 Technology, Pricing and Differentiation
- 17.7 Regional Footprint and Distribution Strength
- 17.8 Mergers, Acquisitions and Strategic Alliances
- 17.9 New Entrants and Competitive Threats
- 17.10 Porter's Five Forces and Industry Attractiveness
- 17.11 Competitive Outlook, 2025-2035
Chapter 18 Company Profiles
- 18.1 Company Coverage and Selection Criteria
- 18.2 Ryco Filters
- 18.2.1 Business Description
- 18.2.2 Company Ownership and Geographic Presence
- 18.2.3 Product and Service Portfolio
- 18.2.4 Manufacturing and Operating Footprint
- 18.2.5 Production Capacity and Expansion Plans
- 18.2.6 Financial Performance and Investment
- 18.2.7 Market Share and Competitive Position
- 18.2.8 Technology and Innovation Capabilities
- 18.2.9 Strategic Alliances or Partnerships
- 18.2.10 Recent Developments
- 18.2.11 Growth Strategy and Outlook
- 18.3 Western Filters
- 18.4 Australian DPF Centre
- 18.5 Sydney Diesel Centre
- 18.6 DPF Centre
- 18.7 Other Relevant Market Participants
Note: Every listed company is profiled on the structure shown under the first company. The company list is preliminary and may change based on research findings, market developments, data availability and client requirements.
Chapter 19 Disclaimer
- 19.1 Research and Forecast Disclaimer
- 19.2 Data Source and Estimation Limitations
Note: The depth of individual sections depends on data availability for this market. Volume, capacity, trade and other unit-based metrics are included where applicable.

