
Postal fleet renewal turns trikes into delivery workhorses
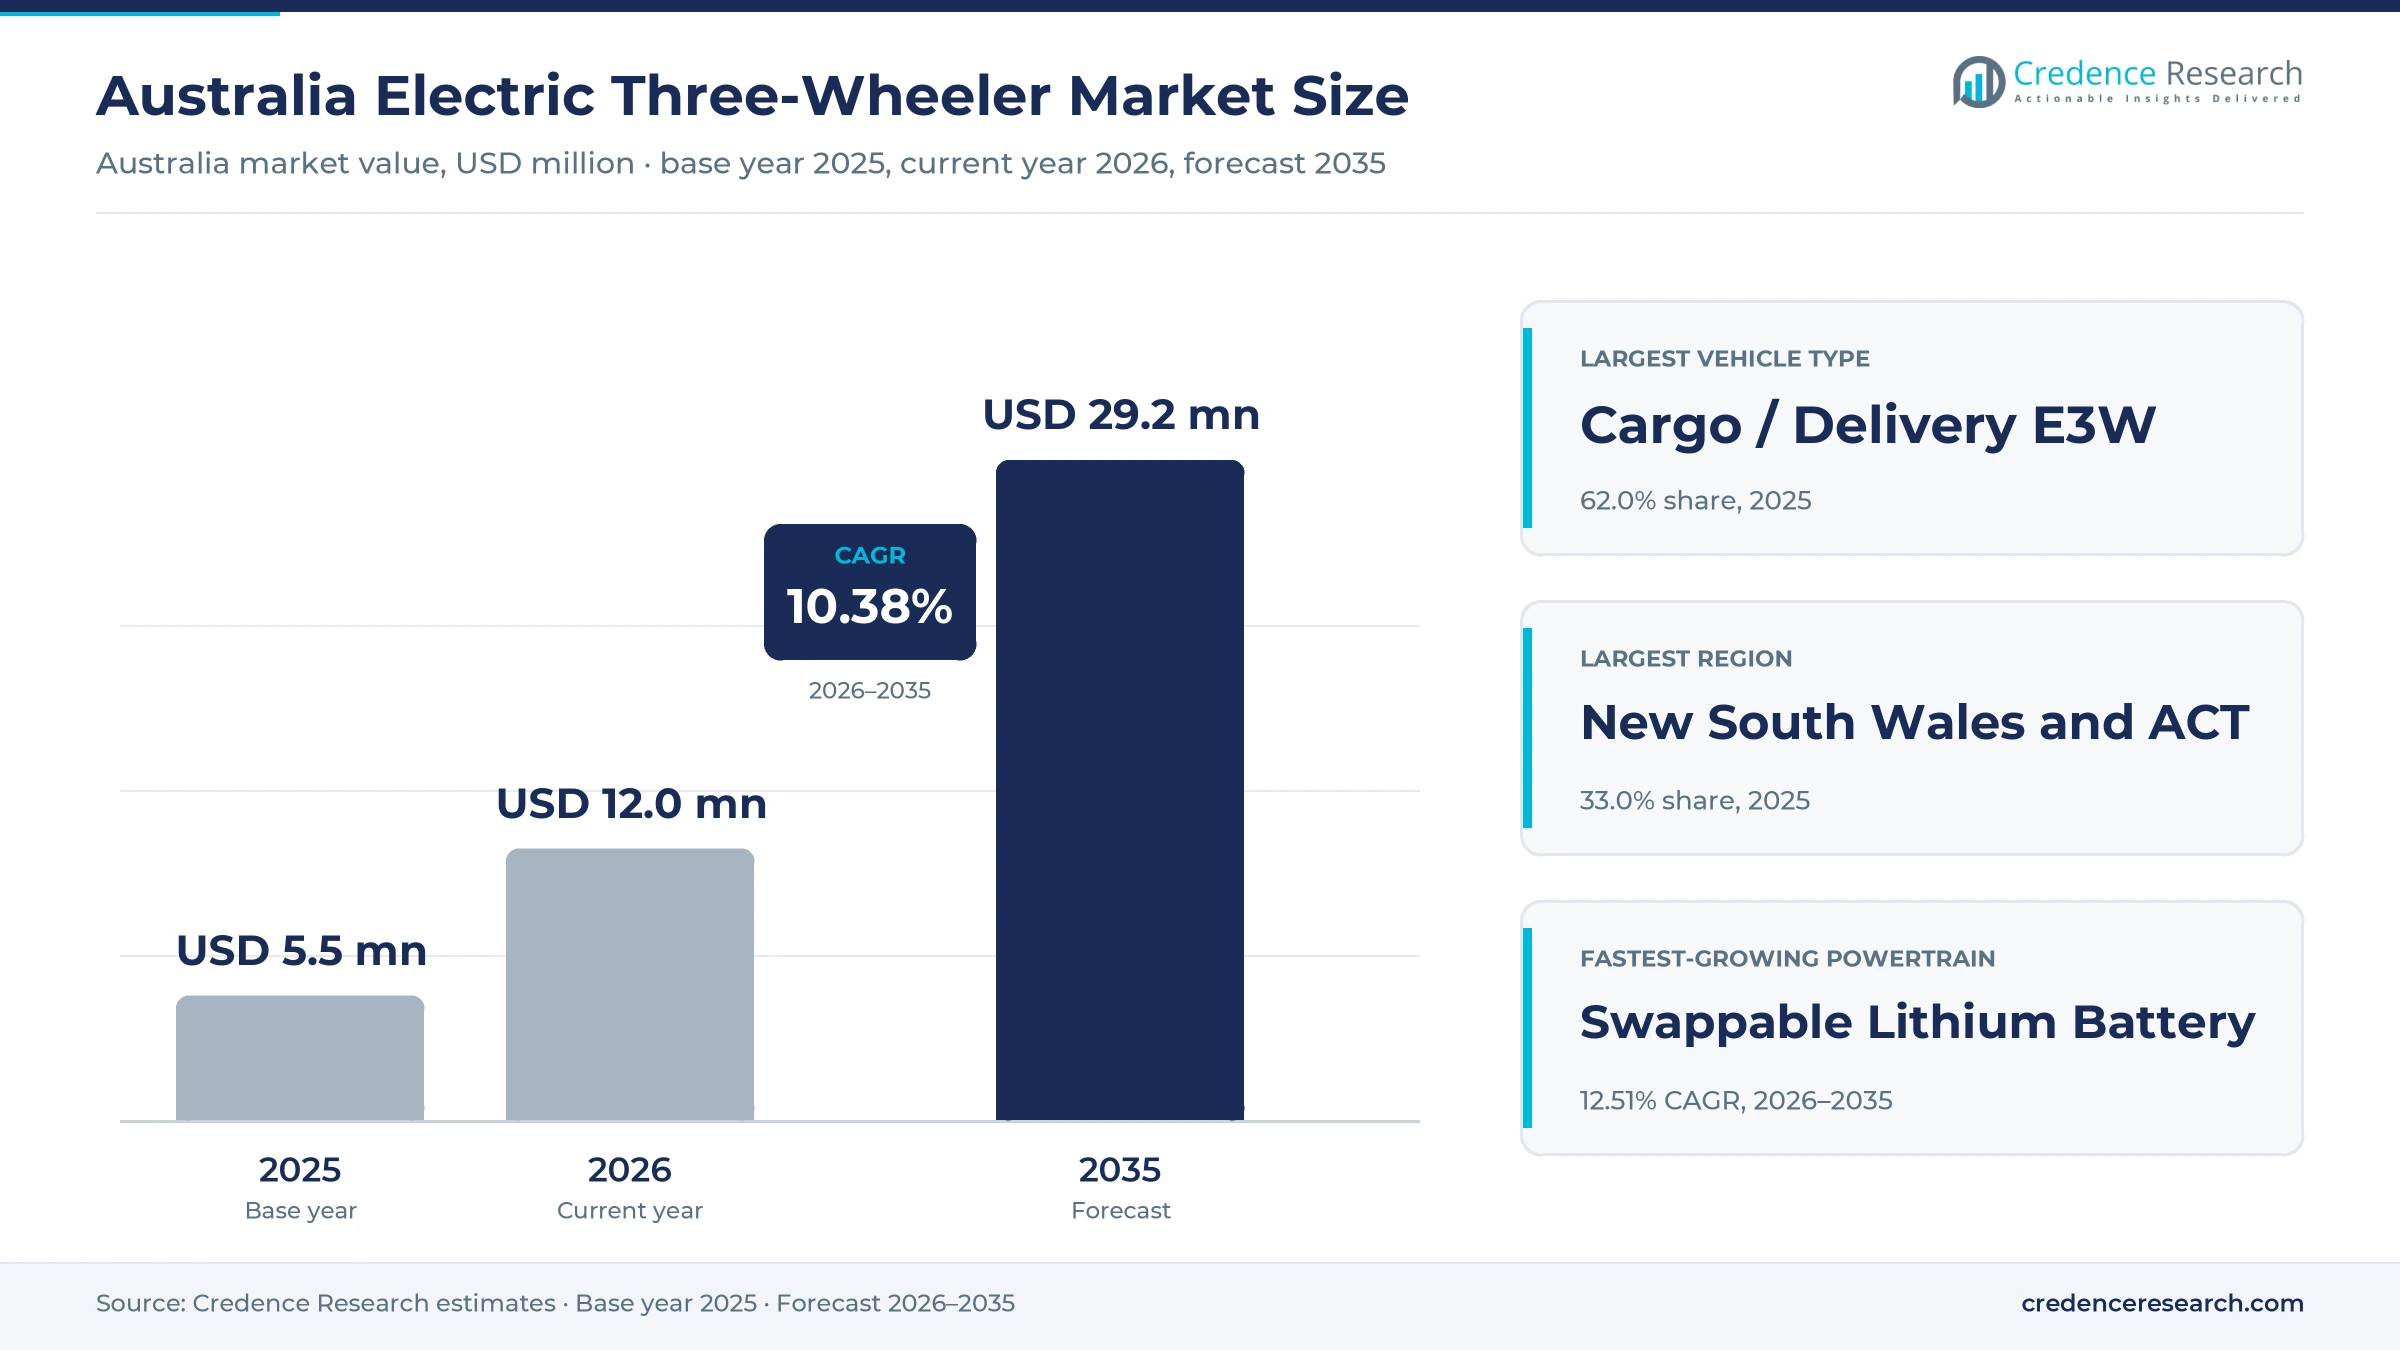
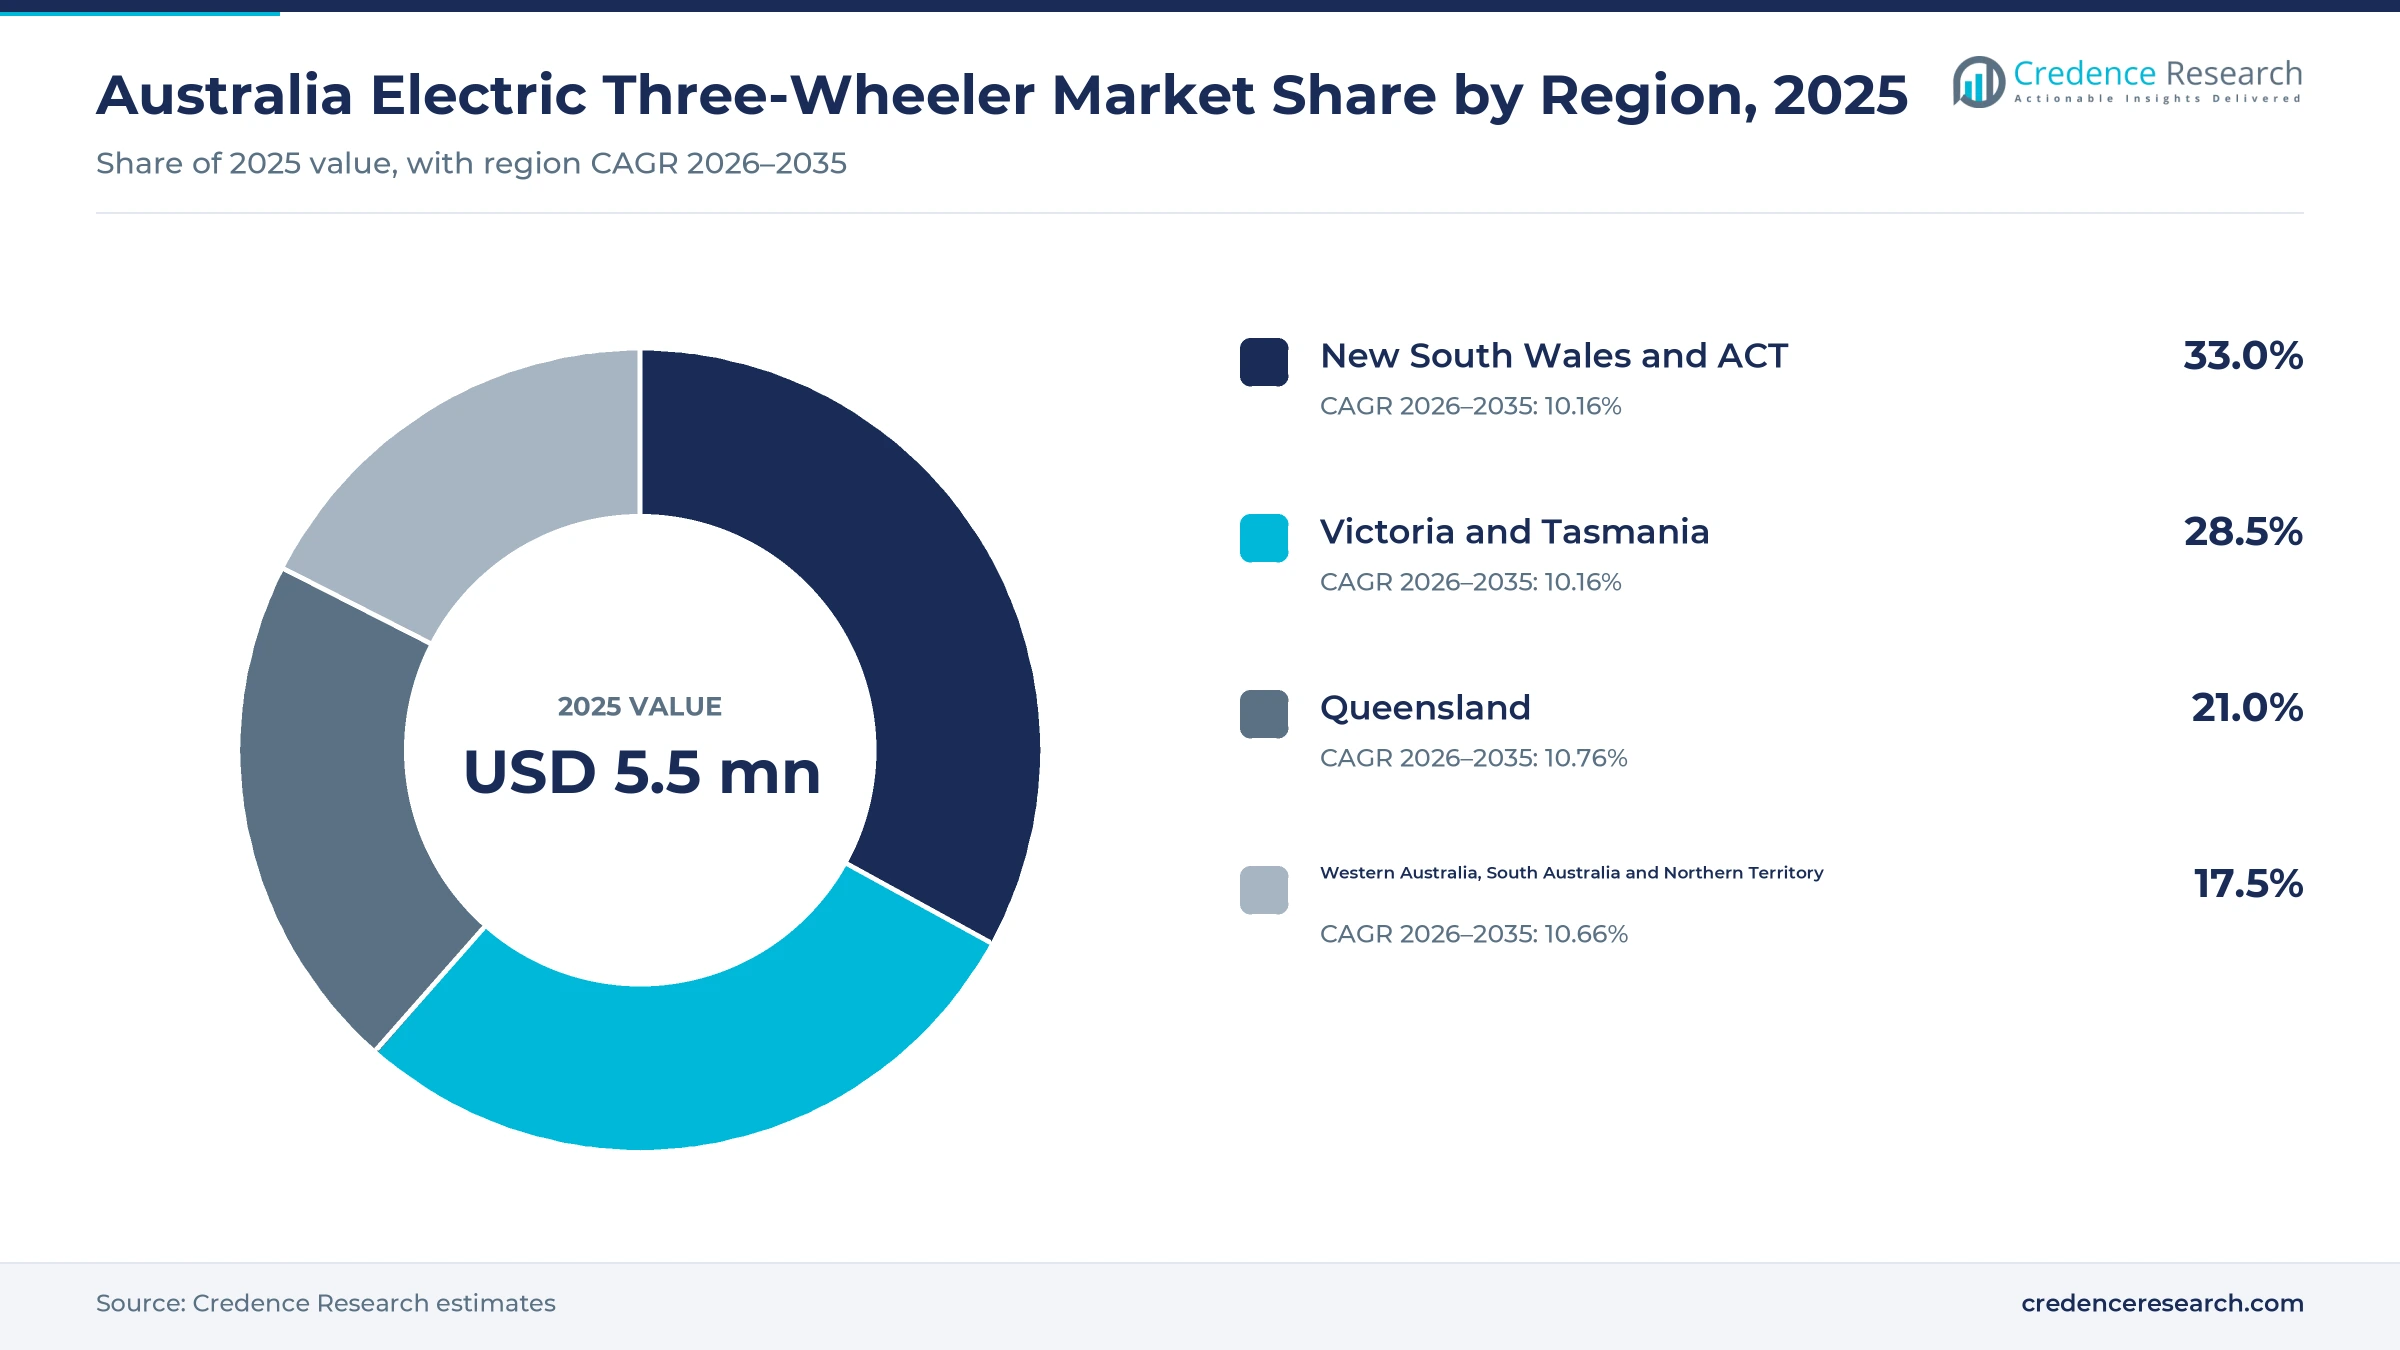
The Australia electric three-wheeler market was valued at USD 5.5 million in 2025 and is projected to increase from USD 12.0 million in 2026 to USD 29.2 million by 2035, registering a CAGR of 10.38% during 2026–2035. Demand comes from postal operators, private delivery fleets, leisure buyers and site operators that buy three-wheeled electric vehicles for short, stop-start routes. New South Wales and the ACT held the largest regional share, 33.0% in 2025, because Sydney has the largest delivery corridors and population. Queensland is the fastest-growing region at 10.76% a year, as population growth adds new suburban routes. In turn, the national postal operator began deploying 500 new three-wheeled delivery vehicles in October 2025 to replace petrol motorbikes, which lifted fleet spending sharply in the base and current years.
Which three-wheeled electric vehicles are counted in Australia?
The estimate measures spending in Australia on new three-wheeled electric vehicles used for cargo and delivery, passenger and recreational trips, golf and leisure transport, and specialty or utility work. It covers vehicles with fixed lithium, swappable lithium and lead-acid batteries sold through direct fleet contracts, specialist dealers and importer direct sales. Values are stated in USD million at current prices and exclude goods and services tax.
The estimate excludes electric bicycles, cargo bikes without a motor vehicle approval, four-wheeled golf carts, used vehicles, charging equipment and battery leasing fees. The value chain runs from overseas manufacturers through importers, distributors and specialist dealers to postal operators, delivery fleets, resorts and site operators.
Australia Electric Three-Wheeler Market Insights
- The Australia electric three-wheeler market was valued at USD 5.5 million in 2025 and is projected to reach USD 29.2 million by 2035, at a 10.38% CAGR during 2026–2035.
- New South Wales and the ACT held 33.0% of 2025 value, because Sydney and Canberra hold the largest delivery corridors and population.
- Cargo and delivery models led vehicle types with 62.0% of 2025 value, as postal operators replace petrol motorbikes on letter and parcel rounds.
- In October 2025, the national postal operator began rolling out 500 three-wheeled delivery vehicles that each carry up to 150 small parcels.
- Swappable lithium batteries grow fastest at 12.51% a year during 2026–2035, as delivery fleets look for shorter downtime between shifts.
Cargo models lead while swappable batteries grow fastest
Why do cargo and delivery models lead vehicle spending?
Based on vehicle type, the market is categorized into cargo and delivery, passenger and recreational, golf and leisure, and specialty and utility models. Cargo / Delivery E3W led with 62.0% of 2025 value, because postal and parcel fleets buy in large batches. Specialty / Utility E3W grows fastest at 10.93% a year, as campuses, ports and industrial sites test small electric haulers for internal logistics.
Which customers buy the most three-wheeled vehicles?
Based on customer type, the market is categorized into postal operators, private delivery fleets, leisure buyers and site operators. Postal Operators led with 52.0% of 2025 value, because the national postal network runs the largest electric delivery fleet in the country. Private Delivery Fleets grow fastest at 11.40% a year, as couriers and food delivery firms test electric vehicles in dense city centers.
How do fleet contracts shape the sales mix?
Based on sales channel, the market is categorized into direct fleet contracts, specialist dealers and importer direct sales. Direct Fleet Contracts led with 64.0% of 2025 value, because postal tenders cover hundreds of vehicles with service and training. Importer Direct Sales grows fastest at 11.17% a year, as new importers bring Asian models to smaller fleets without dealer networks.
Why do fixed lithium batteries dominate powertrains?
Based on powertrain, the market is categorized into fixed lithium battery, swappable lithium battery and lead-acid battery models. Fixed Lithium Battery led with 78.0% of 2025 value, because postal vehicles recharge at depots after each round. Swappable Lithium Battery grows fastest at 12.51% a year, as fleets running double shifts want fresh batteries in minutes.
| Segment Group | Leading Sub-segment | Share, 2025 | Fastest-growing Sub-segment | CAGR, 2026–2035 |
|---|---|---|---|---|
| By Vehicle Type | Cargo / Delivery E3W | 62.0% | Specialty / Utility E3W | 10.93% |
| By Customer Type | Postal Operators | 52.0% | Private Delivery Fleets | 11.40% |
| By Sales Channel | Direct Fleet Contracts | 64.0% | Importer Direct Sales | 11.17% |
| By Powertrain | Fixed Lithium Battery | 78.0% | Swappable Lithium Battery | 12.51% |
Request a Free Sample
Fill in your details and we'll send you a free sample report.
- Sample data tables & charts
- Research methodology
Postal renewal and delivery trials drive fleet demand
How does postal fleet replacement lift route productivity?
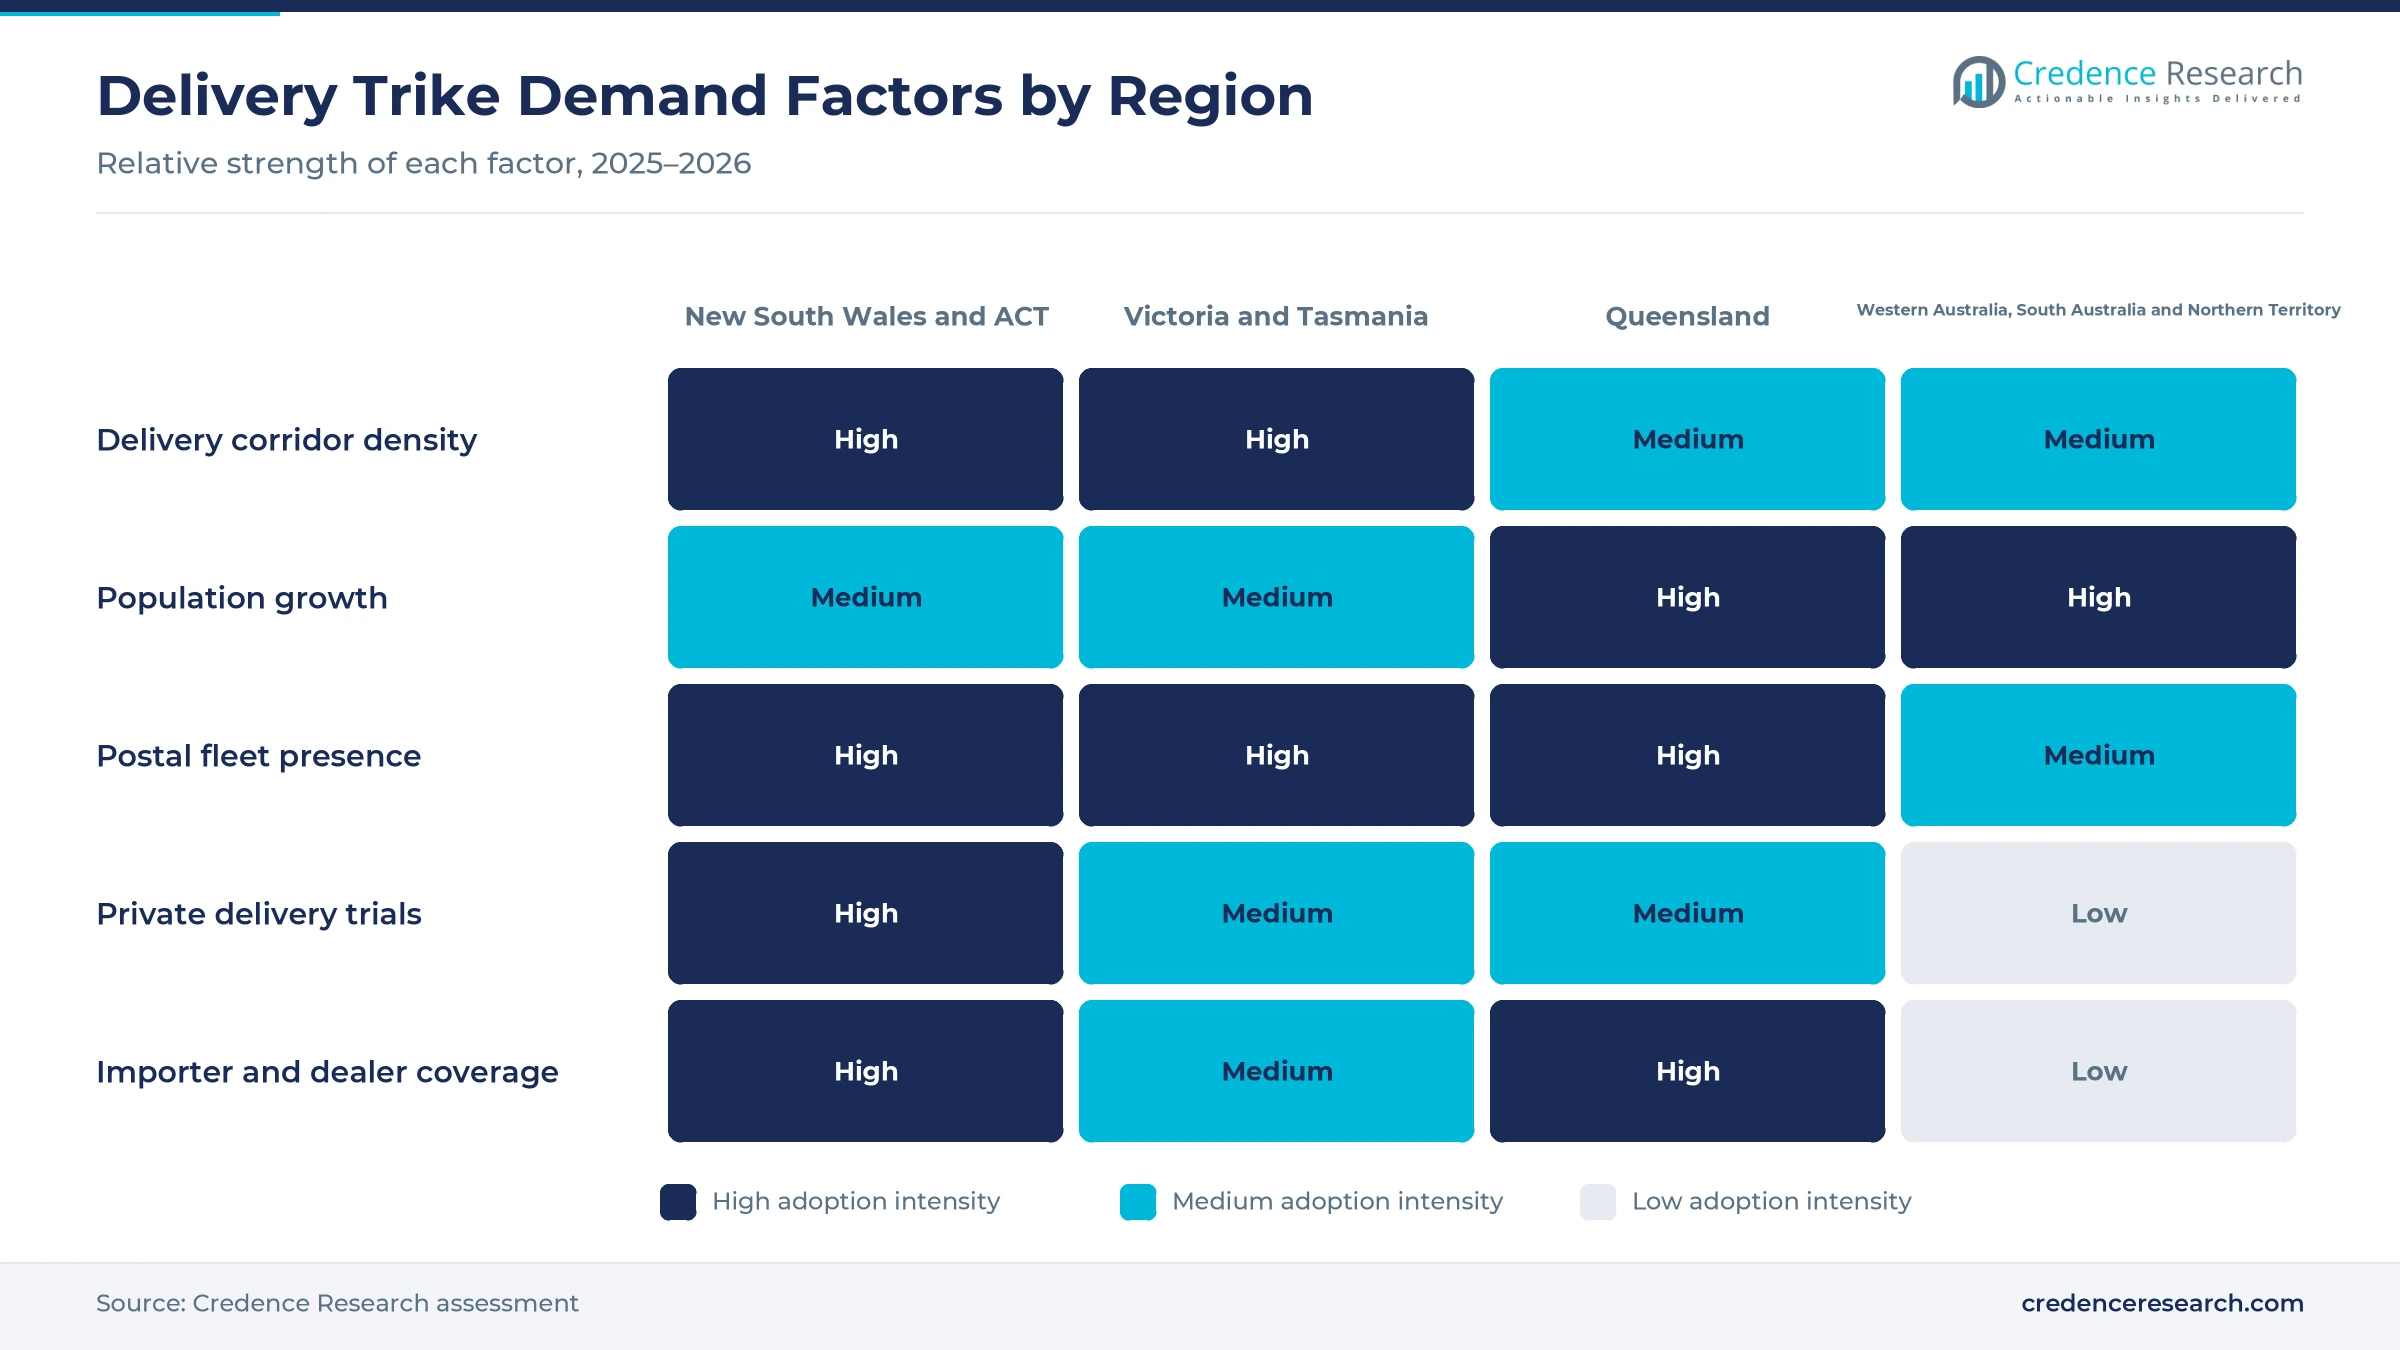
Postal fleet replacement lifts route productivity, because three-wheeled electric vehicles carry far more mail and parcels than the petrol motorbikes they replace. The national postal operator announced and began rolling out 500 Rapide 3 vehicles built by Gaius Automotive in October 2025, according to an industry report. Each vehicle carries up to 150 small parcels or 200 kg, a 400% capacity increase over the outgoing Honda motorbike. The new vehicles join a fleet of 5,600 electric vehicles, while KYBURZ had delivered over 3,600 vehicles to the operator since 2017, as its submission to a federal review shows. As a result, postal operators lead customer types with 52.0% of 2025 value.
Why do retail delivery trials widen contractor access?
Retail delivery trials widen contractor access, because couriers need proof that small electric vehicles work on Australian roads before they commit capital. A Sydney pilot planned for October 2023 ran for three months within about 5 km of the central business district, with access to a state freight hub. Its organizers cited research showing 40% of consumers want more sustainable delivery options. A last-mile specialist also announced a partnership with a Brisbane importer as its exclusive channel for BILITI Electric three-wheelers in November 2022, as reported by a retail trade publication. Consequently, private delivery fleets grow fastest at 11.40% a year as last-mile delivery operators copy postal routes.
How does fleet electrification know-how spread to new buyers?
Fleet electrification know-how spreads to new buyers, because postal experience shows how to charge, maintain and route small electric vehicles at scale. The national postal operator has purpose-built charging at more than 37 sites, and its electric delivery vehicles travel more than 29 million km a year. Its electric fleet already included 2,100 e-trikes and 1,400 electric bicycles in November 2021. The operator also targets net zero emissions by 2050, which keeps depot charging investment going. In turn, direct fleet contracts lead sales channels with 64.0% of 2025 value, as courier, express and parcel services providers adopt the same depot model.
Why does global supply scale lower vehicle costs?
Global supply scale lowers vehicle costs, because high-volume Asian and European production spreads battery and chassis costs across millions of units. Electric three-wheeler sales grew more than 10% to surpass one million vehicles worldwide in 2024, according to the International Energy Agency. Electric models reached almost one-quarter of all three-wheeler sales, up from one-fifth in 2023, and India posted a record electric share of 57%. Türkiye also sold 60,000 electric three-wheelers out of a European market of about 90,000. As a result, importer direct sales grow fastest among channels at 11.17% a year as new suppliers enter Australia with lower-cost cargo and passenger models.
Faster tilting trikes and battery swapping gain ground
How is the rise of battery swapping changing fleet design?
The rise of battery swapping is changing fleet design, because removable packs let delivery riders return to work in minutes rather than waiting for a full charge. Removable batteries have led to swapping stations for two- and three-wheelers used by taxis and delivery services, the International Energy Agency reports. India's PM E-DRIVE scheme also allocated 2024 funding for more than 300,000 electric three-wheelers for commercial use, which deepens supply of swappable models. The BILITI Electric TukTuk offered to Australian fleets in 2022 was described as the first fully electric last-mile model in the country with battery swap capability. Its Brisbane importer was also pursuing Australian Design Rules homologation at that time. Consequently, swappable lithium batteries grow fastest at 12.51% a year, as battery swapping networks spread.
Why is the shift to faster tilting delivery vehicles rising?
The shift to faster tilting delivery vehicles is rising, because newer models can keep up with suburban traffic on longer rounds. The Rapide 3, introduced to the postal fleet in 2025, reaches 80 km/h and covers up to 180 km per charge, while a 2019 KYBURZ model reached 45 km/h with a range of up to 100 km. The Rapide 3 also uses a patented 35-degree tilting system for cornering while fully loaded. The earlier model ran on a 240Ah lithium iron phosphate battery with a 10-hour recharge. As a result, fixed lithium batteries hold 78.0% of 2025 value, as fleets choose longer range over older lead-acid packs.
Can resort and island transport open new demand?
Resort and island transport opens new demand, because small communities and resorts want quiet vehicles for short trips. Lord Howe Island has used electric golf buggies since 1998, and two of them still operated in 2022. The island counted 12 electric vehicles in 2022 after three electric vans arrived in April that year, which shows how quickly small communities adopt electric transport. Electric Vehicles Oceania, based in Northmead in New South Wales, also sells personal transportation vehicles across Australia. In turn, golf and leisure models hold a steady niche, and resorts that run golf carts add three-wheeled models for staff and guest transport on short internal routes.
Is there room to grow along new suburban delivery routes?
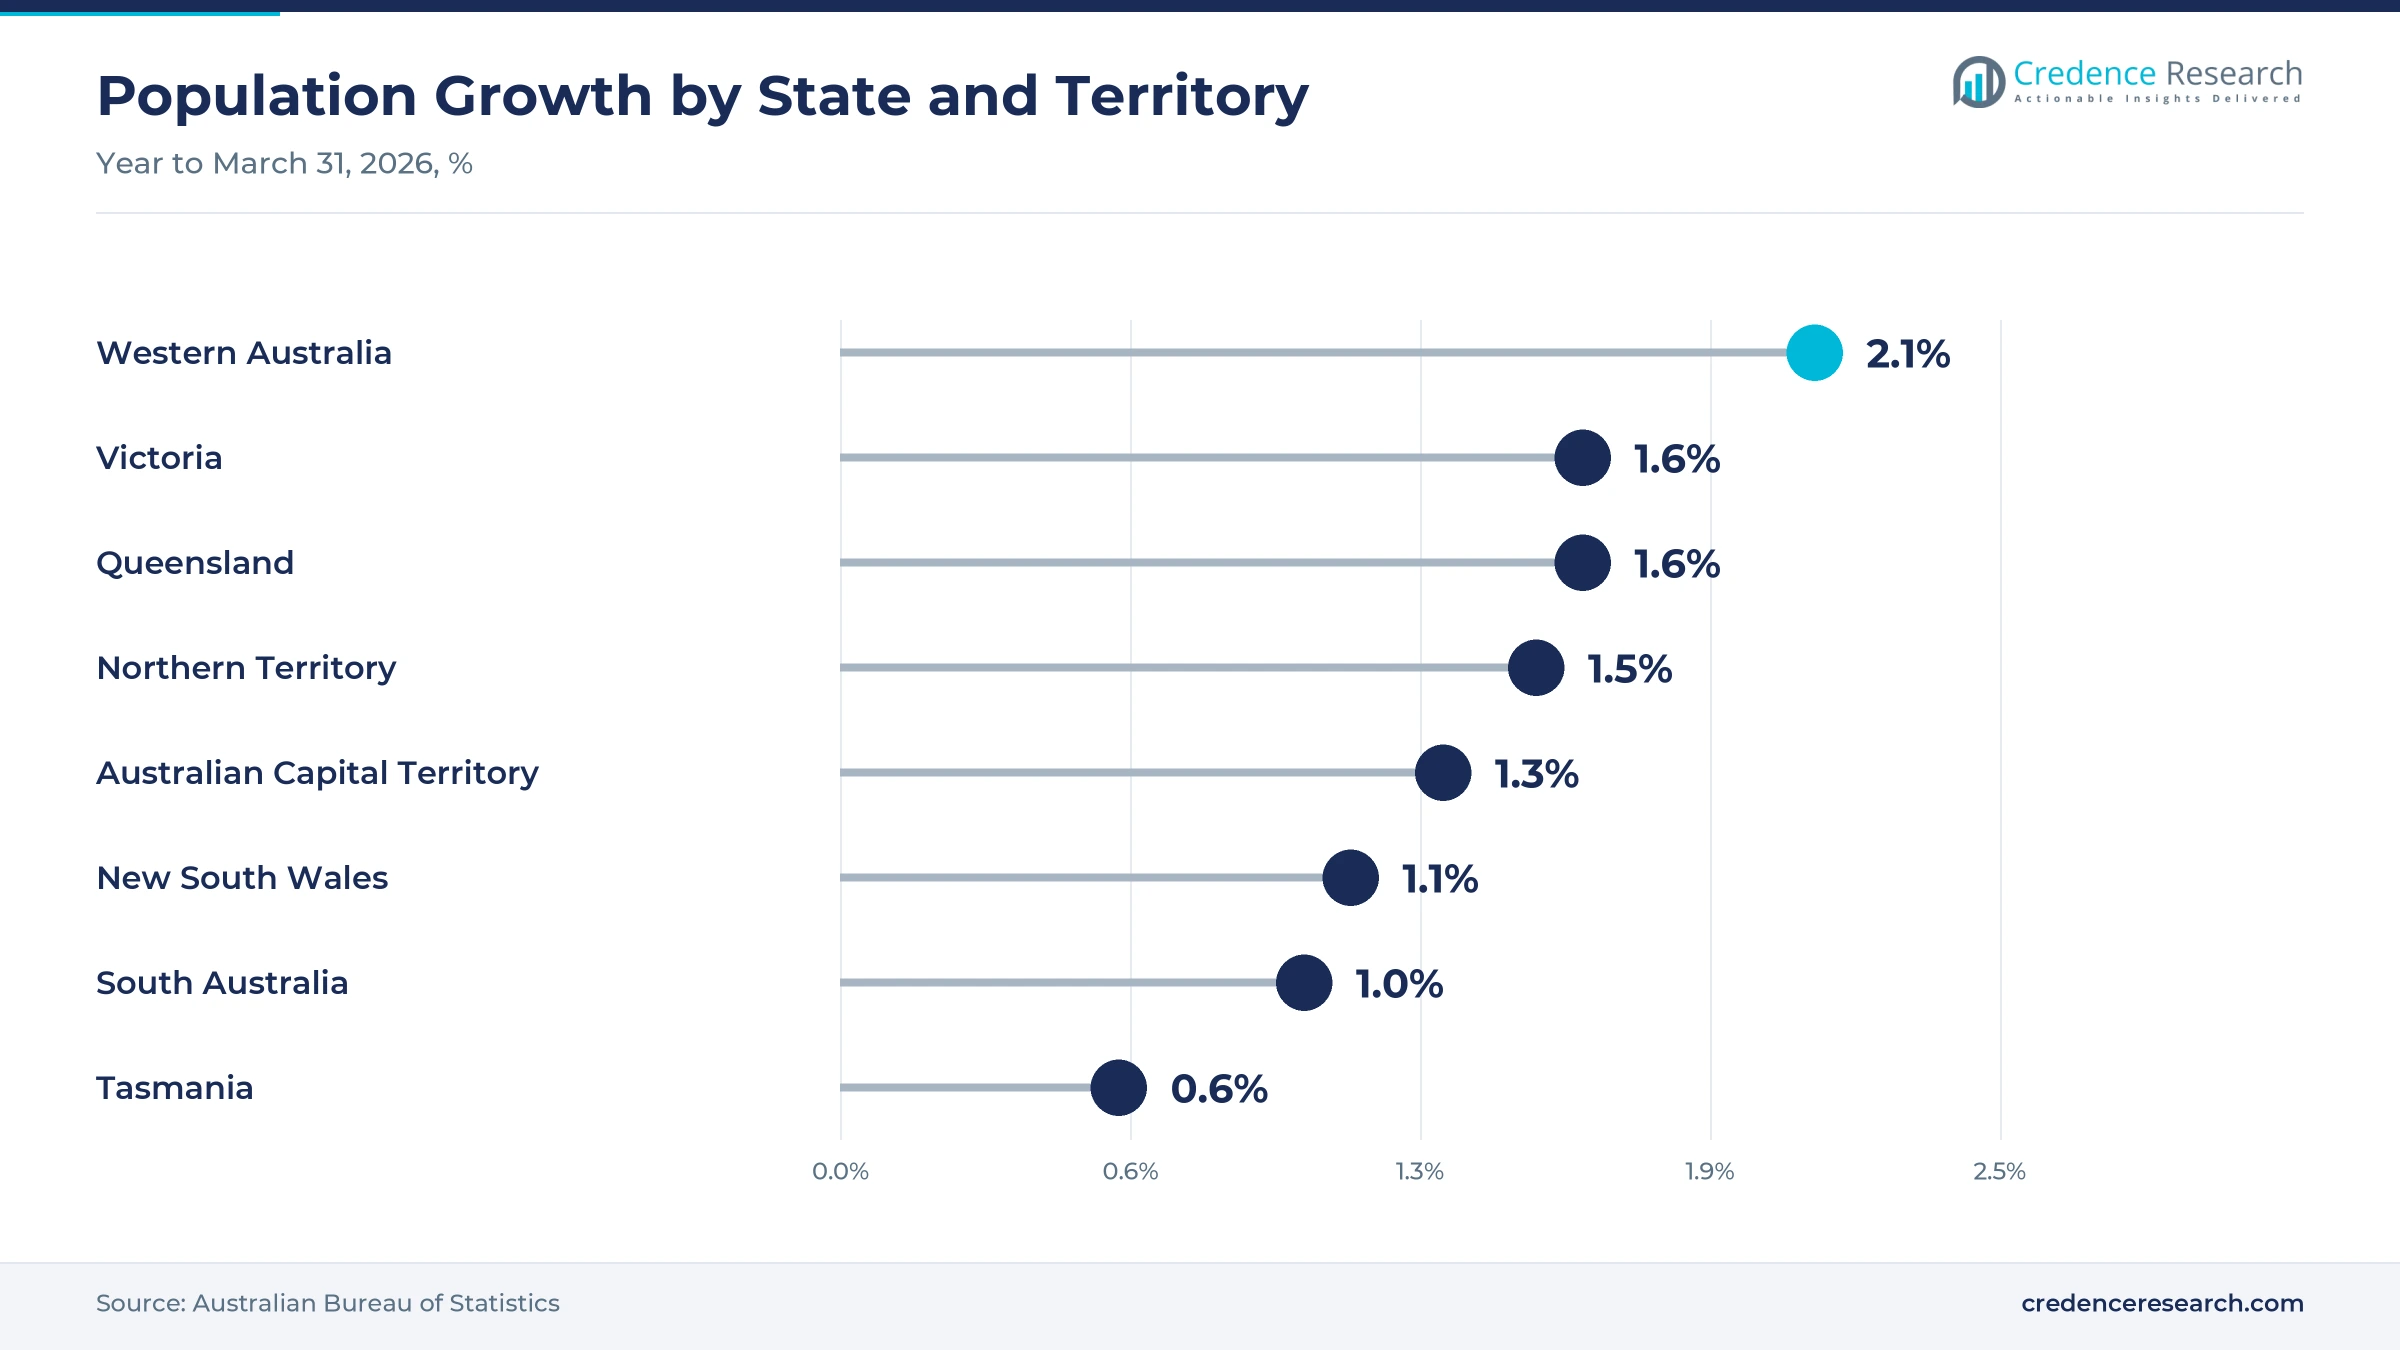
New suburban delivery routes offer a clear opening, because population growth keeps adding homes and parcel stops at the city edge. Australia's population grew 1.4% to 27.9 million in the year to March 2026, according to the national statistics office. Western Australia grew fastest at 2.1%, ahead of every other state and territory. Queensland reached 5,739.5 thousand residents, which adds routes around Brisbane, the Gold Coast and the Sunshine Coast. As a result, Queensland remains the fastest-growing zone in this market, as postal and courier fleets add vehicles to new suburbs and expand rounds into fast-growing corridors around the capital.
Homologation, upfront cost and depot charging slow uptake
How do homologation rules delay new models?
Homologation rules delay new models, because imported three-wheelers must meet Australian Design Rules before road registration. A Brisbane importer was still undergoing this process in late 2022 for its BILITI Electric model. As a result, new suppliers wait months before they can sell to fleets. Importers reduce this delay by choosing models already sold in Europe and by working with specialist compliance engineers early. Even so, each new model still needs testing time and paperwork.
Why does upfront cost slow private fleet uptake?
Upfront cost slows private fleet uptake, because a new electric three-wheeler costs far more than a used petrol motorbike or small van. Smaller couriers often lease vehicles or pay drivers who supply their own transport. Consequently, they hesitate to buy vehicles with uncertain resale value. Suppliers respond with leasing, battery subscriptions and fleet trials that let couriers test savings in fuel and maintenance first. These offers lower the entry cost, although they shift risk to suppliers.
How does depot charging limit expansion?
Depot charging limits expansion, because each vehicle needs a charging point and enough power at the end of every round. The national postal operator built charging at more than 37 sites to support its fleet. In turn, smaller fleets without their own depots struggle to charge many vehicles overnight. Battery swapping, shared hubs and smarter charging schedules help reduce the power upgrade needed at each site. Shared hubs also need landlords and councils to approve new electrical works.
Will thin dealer and parts networks hold back buyers?
Thin dealer and parts networks can hold back buyers, because few specialist dealers stock three-wheelers or their spare parts outside capital cities. A vehicle off the road for weeks hurts delivery schedules and customer service. As a result, regional fleets favor suppliers with local service partners. Importers address this by stocking common parts, training mechanics and using modular designs that are easier to repair. However, these steps add cost for suppliers with small sales volumes.
New South Wales leads as Queensland grows fastest
| Region | Value, 2025 (USD million) | Share, 2025 | CAGR, 2026–2035 |
|---|---|---|---|
| New South Wales and ACT | 1.8 | 33.0% | 10.16% |
| Victoria and Tasmania | 1.6 | 28.5% | 10.16% |
| Queensland | 1.2 | 21.0% | 10.76% |
| Western Australia, South Australia and Northern Territory | 1.0 | 17.5% | 10.66% |
Why do New South Wales and the ACT lead spending?
New South Wales and the ACT held a 33.0% share of 2025 value and grow at 10.16% a year. New South Wales had 8,670.1 thousand residents and the ACT had 489.7 thousand in March 2026. Sydney also hosted a three-month zero-emission delivery pilot around its central business district from October 2023. As a result, dense Sydney delivery corridors keep this zone in the lead, and Canberra adds smaller but steady fleet demand.
How do Victoria and Tasmania support fleet demand?
Victoria and Tasmania held a 28.5% share of 2025 value and grow at 10.16% a year. Victoria grew 1.6% to 7,154.2 thousand residents in the year to March 2026, while Tasmania grew 0.6%. The postal operator trialed an Australian-made three-wheeled delivery vehicle in Lilydale in 2019. Consequently, Melbourne's growing suburbs drive most fleet demand in this zone, while Tasmania's smaller cities add only modest demand from postal rounds and tourism operators.
Why is Queensland the fastest-growing zone?
Queensland held a 21.0% share of 2025 value and grows fastest at 10.76% a year. The state grew 1.6% in population in the year to March 2026, and Brisbane hosted the first postal trial of a KYBURZ vehicle in 2017. Queensland also received 182 postal e-trikes in a single 2019 delivery. In turn, suburban growth and a Brisbane importer base support faster fleet additions, as couriers extend electric rounds beyond the inner suburbs of Brisbane.
How do the western, southern and northern states add demand?
Western Australia, South Australia and the Northern Territory held a 17.5% share of 2025 value and grow at 10.66% a year. Western Australia led population growth at 2.1%, and postal three-wheelers already run as far as Bunbury. As a result, Perth suburbs add the most new routes in this zone, while Adelaide and Darwin add smaller fleets.
Postal rollout and vehicle policy events, 2025 to 2026
| Development | Status and market relevance |
|---|---|
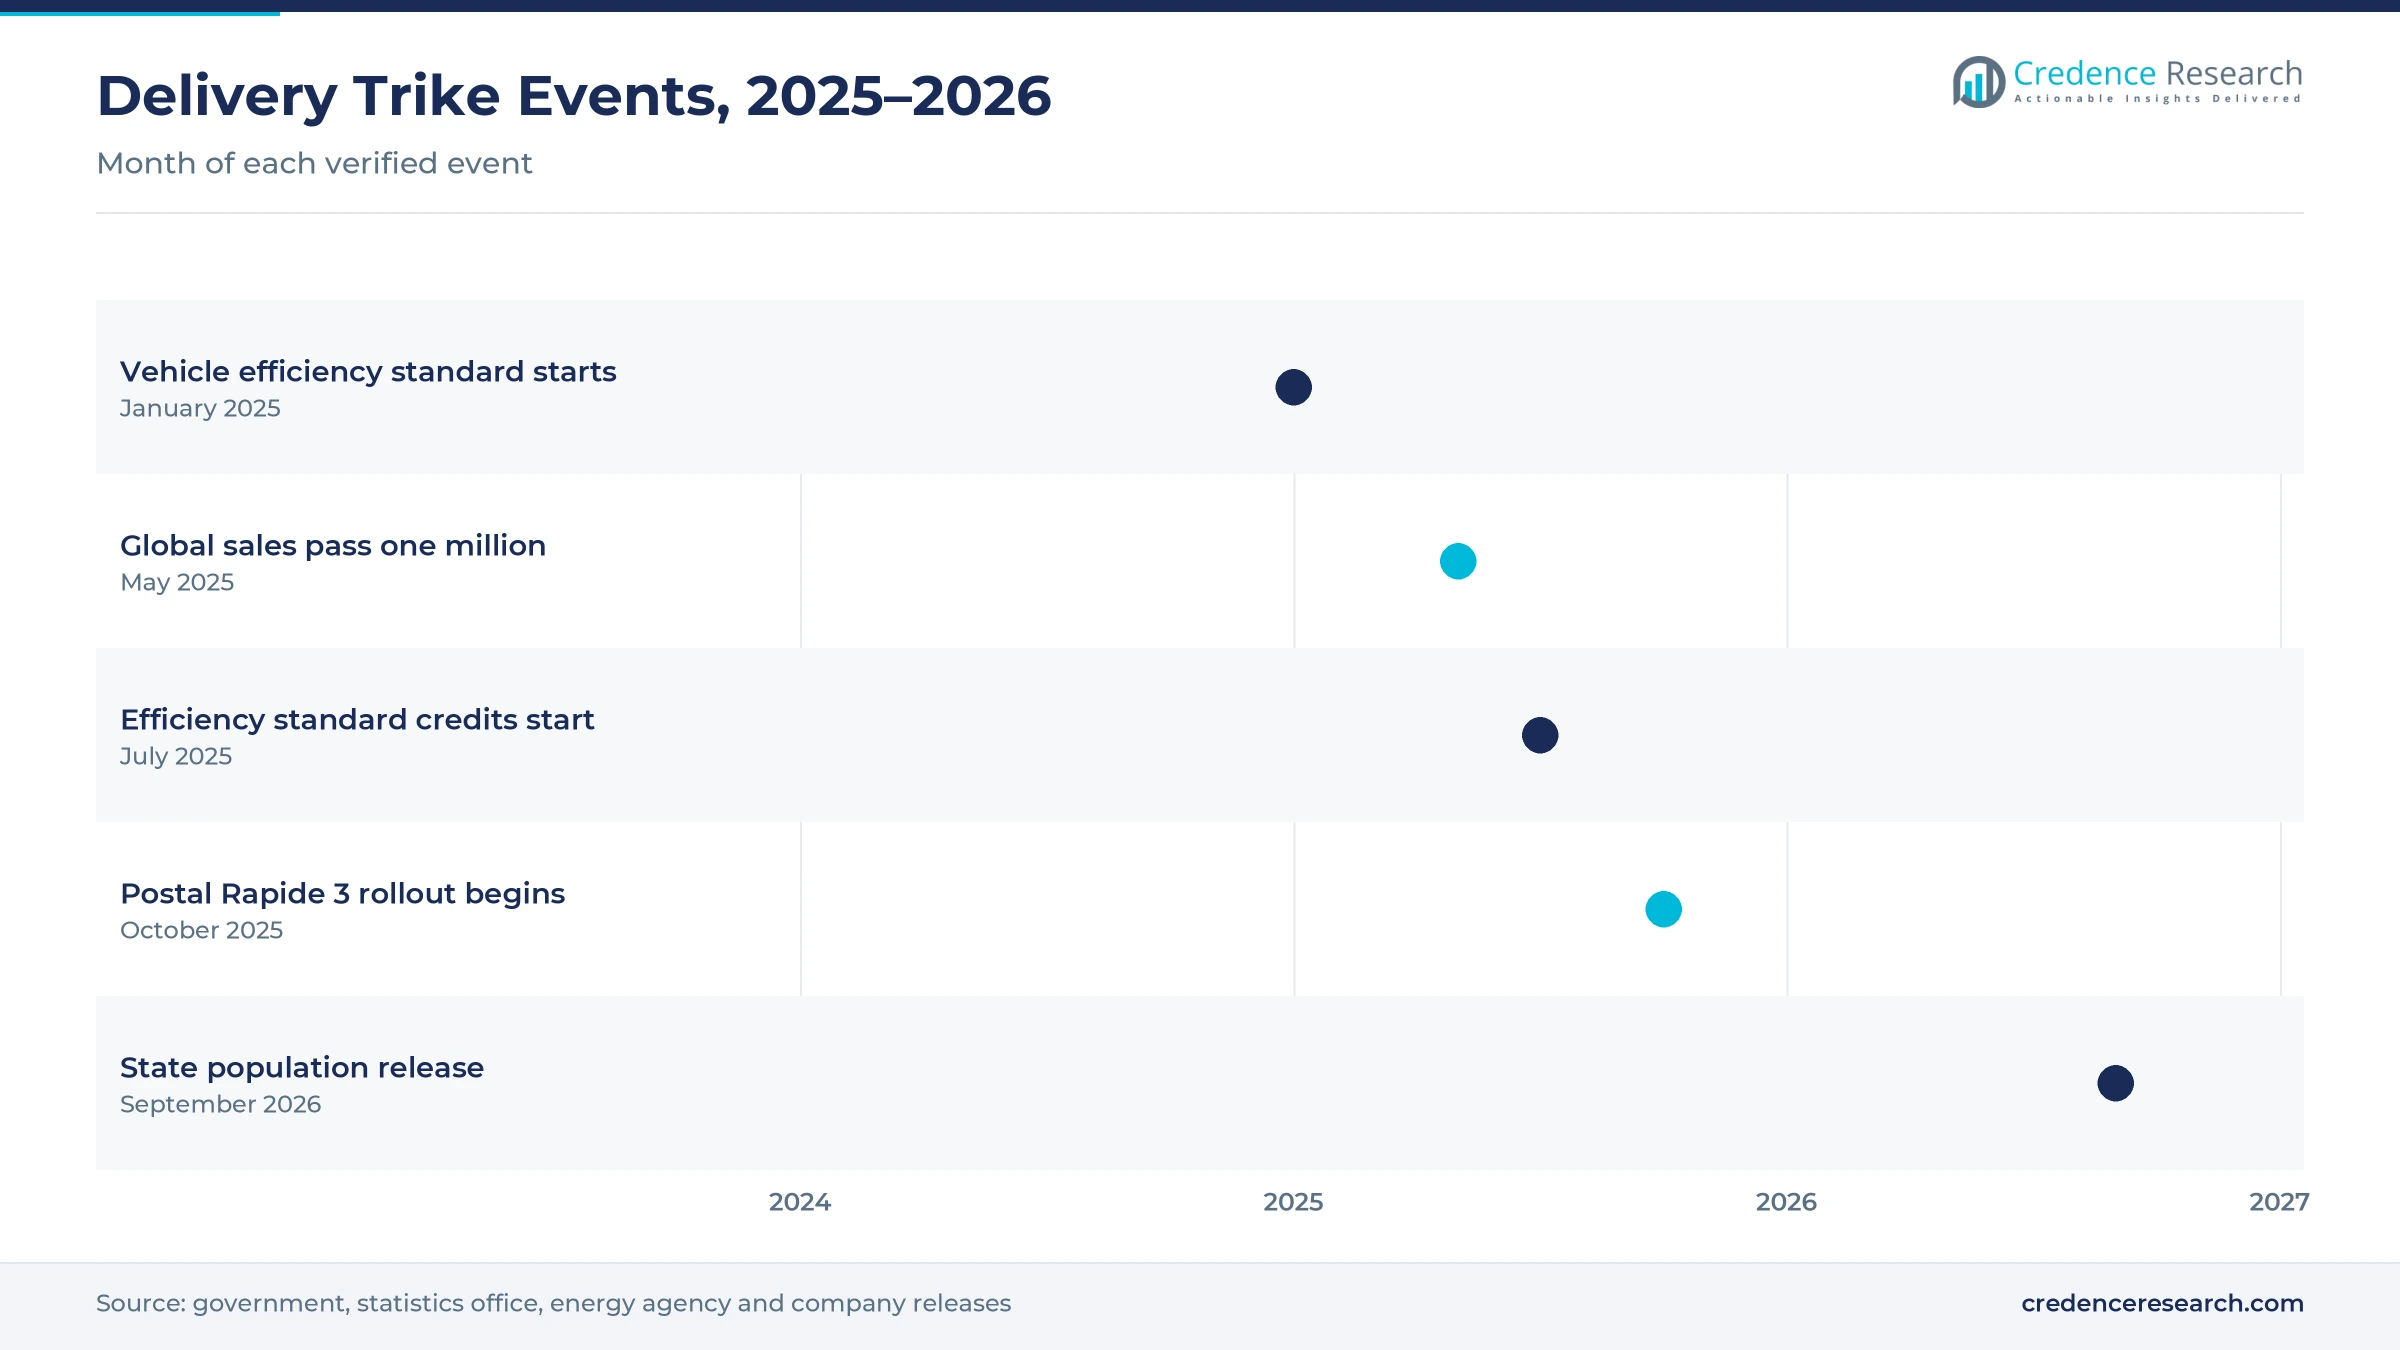
| In January 2025, the New Vehicle Efficiency Standard commenced for passenger and light commercial vehicles in Australia. | Credits accrue from July 2025 |
| In May 2025, the International Energy Agency reported that global electric three-wheeler sales passed one million in 2024. | Almost one-quarter of three-wheeler sales |
| In October 2025, Australia Post began deploying 500 Gaius Automotive Rapide 3 delivery vehicles to replace petrol motorbikes. | Up to 150 small parcels each |
| In September 2026, the Australian Bureau of Statistics reported 1.4% national population growth for the year to March 2026. | Western Australia grew fastest |
Tilting chassis, LFP packs and swap stations reshape trikes
- Tilting chassis designs let loaded vehicles corner safely at higher speeds, which suits mixed suburban roads and longer delivery rounds.
- Lithium iron phosphate packs offer long cycle life and stable chemistry, which suits vehicles that charge every day at depots.
- Removable battery packs let riders swap batteries at hubs in minutes, which keeps vehicles working across double shifts.
- Depot charging management spreads charging across the night, which limits the power upgrades needed at busy delivery sites.
Need a Custom Version of This Report?
Tailor the scope, geography, or segments to your exact requirements.
- Custom geography or segment scope
- Direct access to our analyst team
Postal suppliers and importers compete for fleet contracts
Competition centers on postal tenders, with a small group of overseas manufacturers and Australian importers competing for fleet contracts and niche buyers. KYBURZ supplied over 3,600 vehicles to the national postal operator from 2017, running from Mt Isa in Queensland to Bunbury in Western Australia. Gaius Automotive won the 2025 order for 500 Rapide 3 vehicles, which carry more parcels at higher speeds. BILITI Electric entered through EMoS, a Brisbane importer, with a battery swap model for last-mile delivery. Electric Vehicles Oceania sells personal transportation vehicles from Northmead in New South Wales. Suppliers compete on payload, range, speed, safety, homologation, local service and total cost of ownership, and the next postal tender shapes market shares for years.
Companies profiled and their roles in this market
| Company | Type | Role in the market |
|---|---|---|
| KYBURZ Switzerland AG | Manufacturer | Over 3,600 postal delivery vehicles supplied since 2017 |
| Gaius Automotive Inc. | Manufacturer | 500 Rapide 3 vehicles for the postal fleet from October 2025 |
| BILITI Electric | Manufacturer | Battery swap delivery TukTuk offered through an Australian importer |
| EMoS | Importer | Brisbane importer for BILITI Electric models in Australia and New Zealand |
| Electric Vehicles Oceania | Distributor | Personal transportation vehicles sold across Australia from Northmead |
Credence Research view on delivery trike demand
Credence Research's view is that Australian spending on three-wheeled electric vehicles will grow strongly through 2035, as postal fleets renew and private couriers follow their lead. Cargo and delivery models should keep the largest share, while swappable batteries grow fastest as double-shift fleets seek shorter downtime. Queensland will add demand fastest, although New South Wales keeps the largest share. However, homologation delays and thin service networks will reward suppliers that invest in local parts and support.
How the delivery trike estimate was built
The report uses 2025 as the base year, with values in USD million at current prices. Market values come from the Credence Research model, which combines fleet orders, vehicle prices, replacement cycles and import flows. The client supplied one regional label, so the four zone shares are Credence Research estimates based on state population, and segment splits by vehicle type, customer type, sales channel and powertrain are also estimates. Sources used are official statistics, government releases, company statements and news reports, and no interviews or surveys were used.
Postal renewal and private fleets shape demand to 2035
The market is expected to reach USD 29.2 million by 2035, a 10.38% CAGR during 2026–2035, as postal renewal and private delivery fleets keep demand rising. Growth should be strongest in swappable batteries, private delivery fleets, importer direct sales and Queensland, while New South Wales and the ACT keep the largest share. Battery swapping networks and faster tilting vehicles will widen use cases after 2026. In contrast, slow homologation or weak courier margins could delay private fleet orders.
Frequently Asked Questions
How big is the Australia electric three-wheeler market?
Which region leads delivery trike spending?
Which region grows fastest?
Which customer type holds the largest share?
Why did the postal operator order new three-wheelers?
Which powertrain grows fastest?
Who are the leading companies in this market?
What are the main risks to growth?
Table of Content
Chapter 1 Market Segmentation
- 1.1 Segmentation Framework
- 1.1.1 Product and Service Classification
- 1.1.2 Application and End-Use Classification
- 1.1.3 Technology and Solution Classification
- 1.1.4 Customer and Distribution Channel Classification
- 1.1.5 Geographic Segmentation
- 1.1.6 Market Segment Definitions and Boundaries
- 1.2 By Vehicle Type
- 1.2.1 Cargo / Delivery E3W
- 1.2.2 Passenger / Recreational E3W
- 1.2.3 Golf / Leisure E3W
- 1.2.4 Specialty / Utility E3W
- 1.3 By Customer Type
- 1.3.1 Postal Operators
- 1.3.2 Private Delivery Fleets
- 1.3.3 Leisure Buyers
- 1.3.4 Site Operators
- 1.4 By Sales Channel
- 1.4.1 Direct Fleet Contracts
- 1.4.2 Specialist Dealers
- 1.4.3 Importer Direct Sales
- 1.5 By Powertrain
- 1.5.1 Fixed Lithium Battery
- 1.5.2 Swappable Lithium Battery
- 1.5.3 Lead-Acid Battery
Chapter 2 Introduction
- 2.1 Report Objectives and Scope
- 2.2 Product Definition and Industry Terminology
- 2.3 Market Inclusions and Exclusions
- 2.4 Research Process
- 2.4.1 Primary Research and Expert Interviews
- 2.4.2 Secondary Research and Source Review
- 2.4.3 Top-Down and Bottom-Up Estimation
- 2.4.4 Data Triangulation and Verification
- 2.5 Market Size Measurement Basis
- 2.5.1 2025: USD 5.5 million → 2035: USD 29.2 million
- 2.6 Historical and Forecast Reference Periods
- 2.6.1 Historical Period: 2018-2025
- 2.6.2 Base Year: 2025
- 2.6.3 Forecast Period: 2025-2035
- 2.7 Research Assumptions and Limitations
Chapter 3 Executive Summary
- 3.1 Market Snapshot and Key Findings
- 3.2 Base-Year Market Size, 2025
- 3.3 Forecast Market Size, 2035
- 3.4 Revenue and Volume Growth Outlook
- 3.5 Key Demand and Supply Indicators
- 3.6 Leading Market Segments
- 3.7 Fastest-Growing Market Opportunities
- 3.8 Regional Performance Highlights
- 3.9 Technology and Industry Transformation
- 3.10 Competitive Landscape Summary
- 3.11 Analyst View and Strategic Implications
Chapter 4 Australia Electric Three-Wheeler Market Trends and Developments
- 4.1 Historical Industry Development, 2018-2025
- 4.2 Recent Market Trends and Developments
- 4.3 Demand and Customer Behavior Trends
- 4.4 Technology and Product Innovation
- 4.5 Artificial Intelligence, Automation and Digitalization
- 4.6 Local Manufacturing and Supply Chain Realignment
- 4.7 Industry Partnerships, Mergers and Acquisitions
- 4.8 Sustainability and Circular Economy Developments
- 4.9 Government and Private Sector Investment Trends
- 4.10 Emerging Business Models and Commercialization
- 4.11 Industry Developments and Announcements
Chapter 5 Australia Electric Three-Wheeler Market Production, Supply and Demand Analysis
- 5.1 Demand Trend and Consumption Analysis, 2018-2025
- 5.2 Demand Forecast, 2025-2035
- 5.3 Production and Output Trend, 2018-2025
- 5.4 Production and Output Forecast, 2025-2035
- 5.5 Installed Capacity and Capacity Utilization
- 5.6 Company-Wise Production Plants and Statistics
- 5.6.1 Installed Production Capacity
- 5.6.2 Actual Production
- 5.6.3 Planned Capacity and Expansion Targets
- 5.7 Supply Chain Structure and Procurement Trends
- 5.8 Supply-Demand Gap and Bottlenecks
- 5.9 Import Dependence and Sourcing Structure
- 5.10 Contract Manufacturing and Outsourcing
- 5.11 Regional Supply and Demand Concentration
Chapter 6 Australia Electric Three-Wheeler Market Pricing Analysis
- 6.1 Pricing Structure and Measurement
- 6.2 Historical Pricing Trends, 2018-2025
- 6.3 Pricing Outlook, 2025-2035
- 6.4 Average Selling Price and Unit Economics
- 6.5 Pricing by Product and Market Segment
- 6.6 Geographic Pricing Differences
- 6.7 Key Input, Energy, Labor and Logistics Costs
- 6.8 Contract Pricing and Purchasing Models
- 6.9 Pricing Sensitivity and Competitive Positioning
- 6.10 Price, Margin and Profitability Implications
Chapter 7 Australia Electric Three-Wheeler Market Dynamics
- 7.1 Market Growth Drivers
- 7.1.1 Demand-Side Drivers
- 7.1.2 Technology and Innovation Drivers
- 7.1.3 Infrastructure and Investment Drivers
- 7.1.4 Regulatory and Policy Drivers
- 7.2 Market Restraints
- 7.2.1 Cost and Affordability Constraints
- 7.2.2 Technology and Adoption Barriers
- 7.2.3 Supply Chain and Operational Constraints
- 7.3 Market Challenges
- 7.3.1 Competitive Pressure and Margin Erosion
- 7.3.2 Skills, Infrastructure and Implementation Gaps
- 7.4 Emerging Market Opportunities
- 7.5 Market Dynamics Impact and Time-Horizon Assessment
Chapter 8 Australia Electric Three-Wheeler Value Chain Analysis
- 8.1 Industry Value Chain Overview
- 8.2 Upstream Suppliers and Critical Inputs
- 8.3 Technology and Component Providers
- 8.4 Manufacturing or Service Delivery
- 8.5 Distribution, Channel Partners and Integrators
- 8.6 Downstream Applications and End Users
- 8.7 Value Addition and Profit Pools
- 8.8 Vertical Integration and Outsourcing
- 8.9 Supplier Concentration and Risk
- 8.10 Supply Chain Localization and Resilience
Chapter 9 Australia Electric Three-Wheeler Market Regulations and Policies
- 9.1 Relevant Laws, Standards and Compliance Frameworks
- 9.2 Product, Service, Safety and Quality Requirements
- 9.3 Government Policies, Incentives and Subsidies
- 9.4 Imports, Exports and Trade Barriers
- 9.5 Public Procurement and Local Content Requirements
- 9.6 Environmental and Sustainability Compliance
- 9.7 Upcoming Policy Changes and Market Implications
Chapter 10 Australia Electric Three-Wheeler Market Hotspots and Opportunities
- 10.1 Market Opportunity Mapping and Growth Hotspots
- 10.2 High-Growth Applications and Customer Groups
- 10.3 Underserved Markets and White-Space Opportunities
- 10.4 Emerging Technology and Product Opportunities
- 10.5 New Capacity and Investment Hotspots
- 10.6 Market Entry and Expansion Opportunities
- 10.7 Distribution and Partnership Opportunities
- 10.8 Near-Term and Long-Term Commercial Potential
- 10.9 Opportunity Attractiveness and Execution Risks
Chapter 11 Australia Electric Three-Wheeler Market Outlook, 2025-2035
- 11.1 Market Size and Analysis
- 11.1.1 Revenue (Market Measurement: 2025: USD 5.5 million → 2035: USD 29.2 million)
- 11.1.2 Market Volume and Quantity Sold
- 11.1.3 Historical Market Size, 2018-2025
- 11.1.4 Base-Year Market Size, 2025
- 11.2 Market Forecast, 2025-2035
- 11.2.1 Revenue Forecast to 2035
- 11.2.2 Volume Forecast to 2035
- 11.2.3 CAGR and Year-on-Year Growth
- 11.2.4 Incremental Revenue Opportunity
- 11.3 Forecast Assumptions and Scenario Analysis
- 11.3.1 Base-Case Forecast
- 11.3.2 Optimistic and Conservative Scenarios
- 11.3.3 Technology, Pricing and Policy Sensitivities
- 11.4 Market Attractiveness and Growth Outlook
Chapter 12 Australia Electric Three-Wheeler Market Segmentation and Outlook
- 12.1 Segmentation Summary and Market Shares, 2025
- 12.2 Largest and Fastest-Growing Segments
- 12.3 By Vehicle Type - Market Size and Forecast, 2025-2035
- 12.3.1 Segment Definition and Scope
- 12.3.2 Historical Market Size, 2018-2025
- 12.3.3 Revenue Forecast, 2025-2035
- 12.3.4 Volume Forecast, 2025-2035
- 12.3.5 Base-Year Market Share, 2025
- 12.3.6 Segment CAGR and Growth Drivers
- 12.3.7 Subsegment Market Size and Forecast
- 12.3.7.1 Cargo / Delivery E3W
- 12.3.7.2 Passenger / Recreational E3W
- 12.3.7.3 Golf / Leisure E3W
- 12.3.7.4 Specialty / Utility E3W
- 12.3.8 Subsegment Pricing and Adoption Trends
- 12.3.9 Leading Suppliers and Competition
- 12.3.10 Regional Demand and Opportunities
- 12.4 By Customer Type - Market Size and Forecast, 2025-2035
- 12.4.1 Segment Definition and Scope
- 12.4.2 Historical Market Size, 2018-2025
- 12.4.3 Revenue Forecast, 2025-2035
- 12.4.4 Volume Forecast, 2025-2035
- 12.4.5 Base-Year Market Share, 2025
- 12.4.6 Segment CAGR and Growth Drivers
- 12.4.7 Subsegment Market Size and Forecast
- 12.4.7.1 Postal Operators
- 12.4.7.2 Private Delivery Fleets
- 12.4.7.3 Leisure Buyers
- 12.4.7.4 Site Operators
- 12.4.8 Subsegment Pricing and Adoption Trends
- 12.4.9 Leading Suppliers and Competition
- 12.4.10 Regional Demand and Opportunities
- 12.5 By Sales Channel - Market Size and Forecast, 2025-2035
- 12.5.1 Segment Definition and Scope
- 12.5.2 Historical Market Size, 2018-2025
- 12.5.3 Revenue Forecast, 2025-2035
- 12.5.4 Volume Forecast, 2025-2035
- 12.5.5 Base-Year Market Share, 2025
- 12.5.6 Segment CAGR and Growth Drivers
- 12.5.7 Subsegment Market Size and Forecast
- 12.5.7.1 Direct Fleet Contracts
- 12.5.7.2 Specialist Dealers
- 12.5.7.3 Importer Direct Sales
- 12.5.8 Subsegment Pricing and Adoption Trends
- 12.5.9 Leading Suppliers and Competition
- 12.5.10 Regional Demand and Opportunities
- 12.6 By Powertrain - Market Size and Forecast, 2025-2035
- 12.6.1 Segment Definition and Scope
- 12.6.2 Historical Market Size, 2018-2025
- 12.6.3 Revenue Forecast, 2025-2035
- 12.6.4 Volume Forecast, 2025-2035
- 12.6.5 Base-Year Market Share, 2025
- 12.6.6 Segment CAGR and Growth Drivers
- 12.6.7 Subsegment Market Size and Forecast
- 12.6.7.1 Fixed Lithium Battery
- 12.6.7.2 Swappable Lithium Battery
- 12.6.7.3 Lead-Acid Battery
- 12.6.8 Subsegment Pricing and Adoption Trends
- 12.6.9 Leading Suppliers and Competition
- 12.6.10 Regional Demand and Opportunities
- 12.7 Segment Growth Comparison
- 12.8 Segment Attractiveness and Priority Matrix
Chapter 13 Australia Electric Three-Wheeler End-Use and Application Market Outlook
- 13.1 End-Use Industry and Customer Demand Structure
- 13.2 Leading Applications and Customer Groups
- 13.3 End-Use Market Size, Share and Forecast
- 13.4 Major End-Use Industry Deep Dives
- 13.4.1 Customer Requirements and Use Cases
- 13.4.2 Demand and Replacement Cycles
- 13.4.3 Technical and Regulatory Considerations
- 13.4.4 Purchasing and Procurement Models
- 13.4.5 Leading Vendors and Distribution Channels
- 13.4.6 Forecast and Commercial Opportunities
- 13.5 Emerging Applications and Cross-Segment Demand
- 13.6 End-Use Industry Investment Priorities
Chapter 14 Australia Electric Three-Wheeler Geographic Market Outlook, 2025-2035
- 14.1 Domestic Market Distribution and Demand Clusters
- 14.2 State- or Province-Wise Market Size and Forecast, 2025-2035
- 14.3 City and Metropolitan Market Outlook
- 14.4 Industrial, Manufacturing and Commercial Clusters
- 14.5 Geographic Concentration of Key End Users
- 14.6 Local Pricing and Purchasing Differences
- 14.7 Domestic Production Facilities and Capacity Map
- 14.8 Local Infrastructure and Project Pipeline
- 14.9 State-Level Policy and Incentive Differences
- 14.10 Subnational Investment Hotspots and Opportunities
- 14.11 Distribution and Logistics Networks
- 14.12 Domestic Competitive Footprint
Chapter 15 Australia Electric Three-Wheeler Technology, Innovation and Sustainability Outlook
- 15.1 Technology Landscape and Maturity
- 15.2 Product, Process and Service Innovation
- 15.3 AI, Automation and Digital Tools in the Industry
- 15.4 Technology Adoption and Performance Benchmarking
- 15.5 Innovation Pipeline and R&D Investment
- 15.6 Patent and Intellectual Property Trends
- 15.7 Energy Efficiency and Resource Management
- 15.8 Sustainability, Recycling and Circularity
- 15.9 Technology Roadmap, 2025-2035
- 15.10 Risks of Obsolescence and Technology Substitution
Chapter 16 Australia Electric Three-Wheeler Market Key Strategic Imperatives
- 16.1 Growth and Market Entry Priorities
- 16.2 High-Return Products and Segments
- 16.3 Pricing, Profitability and Cost Optimization
- 16.4 Technology Investment and Product Differentiation
- 16.5 Supply Chain Localization and Resilience
- 16.6 Distribution and Customer Acquisition
- 16.7 Partnership, Acquisition and Capacity Strategy
- 16.8 Regional Expansion Priorities
- 16.9 Short-, Medium- and Long-Term Actions
Chapter 17 Competition Outlook
- 17.1 Industry Competition Characteristics
- 17.2 Market Structure and Concentration
- 17.3 Market Share and Competitive Positioning, 2025
- 17.4 Company-Wise Revenue and Product Benchmarking
- 17.5 Production and Service Capacity Benchmarking
- 17.6 Technology, Pricing and Differentiation
- 17.7 Regional Footprint and Distribution Strength
- 17.8 Mergers, Acquisitions and Strategic Alliances
- 17.9 New Entrants and Competitive Threats
- 17.10 Porter's Five Forces and Industry Attractiveness
- 17.11 Competitive Outlook, 2025-2035
Chapter 18 Company Profiles
- 18.1 Company Coverage and Selection Criteria
- 18.2 KYBURZ Switzerland AG
- 18.2.1 Business Description
- 18.2.2 Company Ownership and Geographic Presence
- 18.2.3 Product and Service Portfolio
- 18.2.4 Manufacturing and Operating Footprint
- 18.2.5 Production Capacity and Expansion Plans
- 18.2.6 Financial Performance and Investment
- 18.2.7 Market Share and Competitive Position
- 18.2.8 Technology and Innovation Capabilities
- 18.2.9 Strategic Alliances or Partnerships
- 18.2.10 Recent Developments
- 18.2.11 Growth Strategy and Outlook
- 18.3 Gaius Automotive Inc.
- 18.4 BILITI Electric
- 18.5 EMoS
- 18.6 Electric Vehicles Oceania / Lordco (Australia) Pty Ltd
- 18.7 Other Relevant Market Participants
Note: Every listed company is profiled on the structure shown under the first company. The company list is preliminary and may change based on research findings, market developments, data availability and client requirements.
Chapter 19 Disclaimer
- 19.1 Research and Forecast Disclaimer
- 19.2 Data Source and Estimation Limitations
Note: The depth of individual sections depends on data availability for this market. Volume, capacity, trade and other unit-based metrics are included where applicable.

