
Permanent state rules turn council trials into contracts
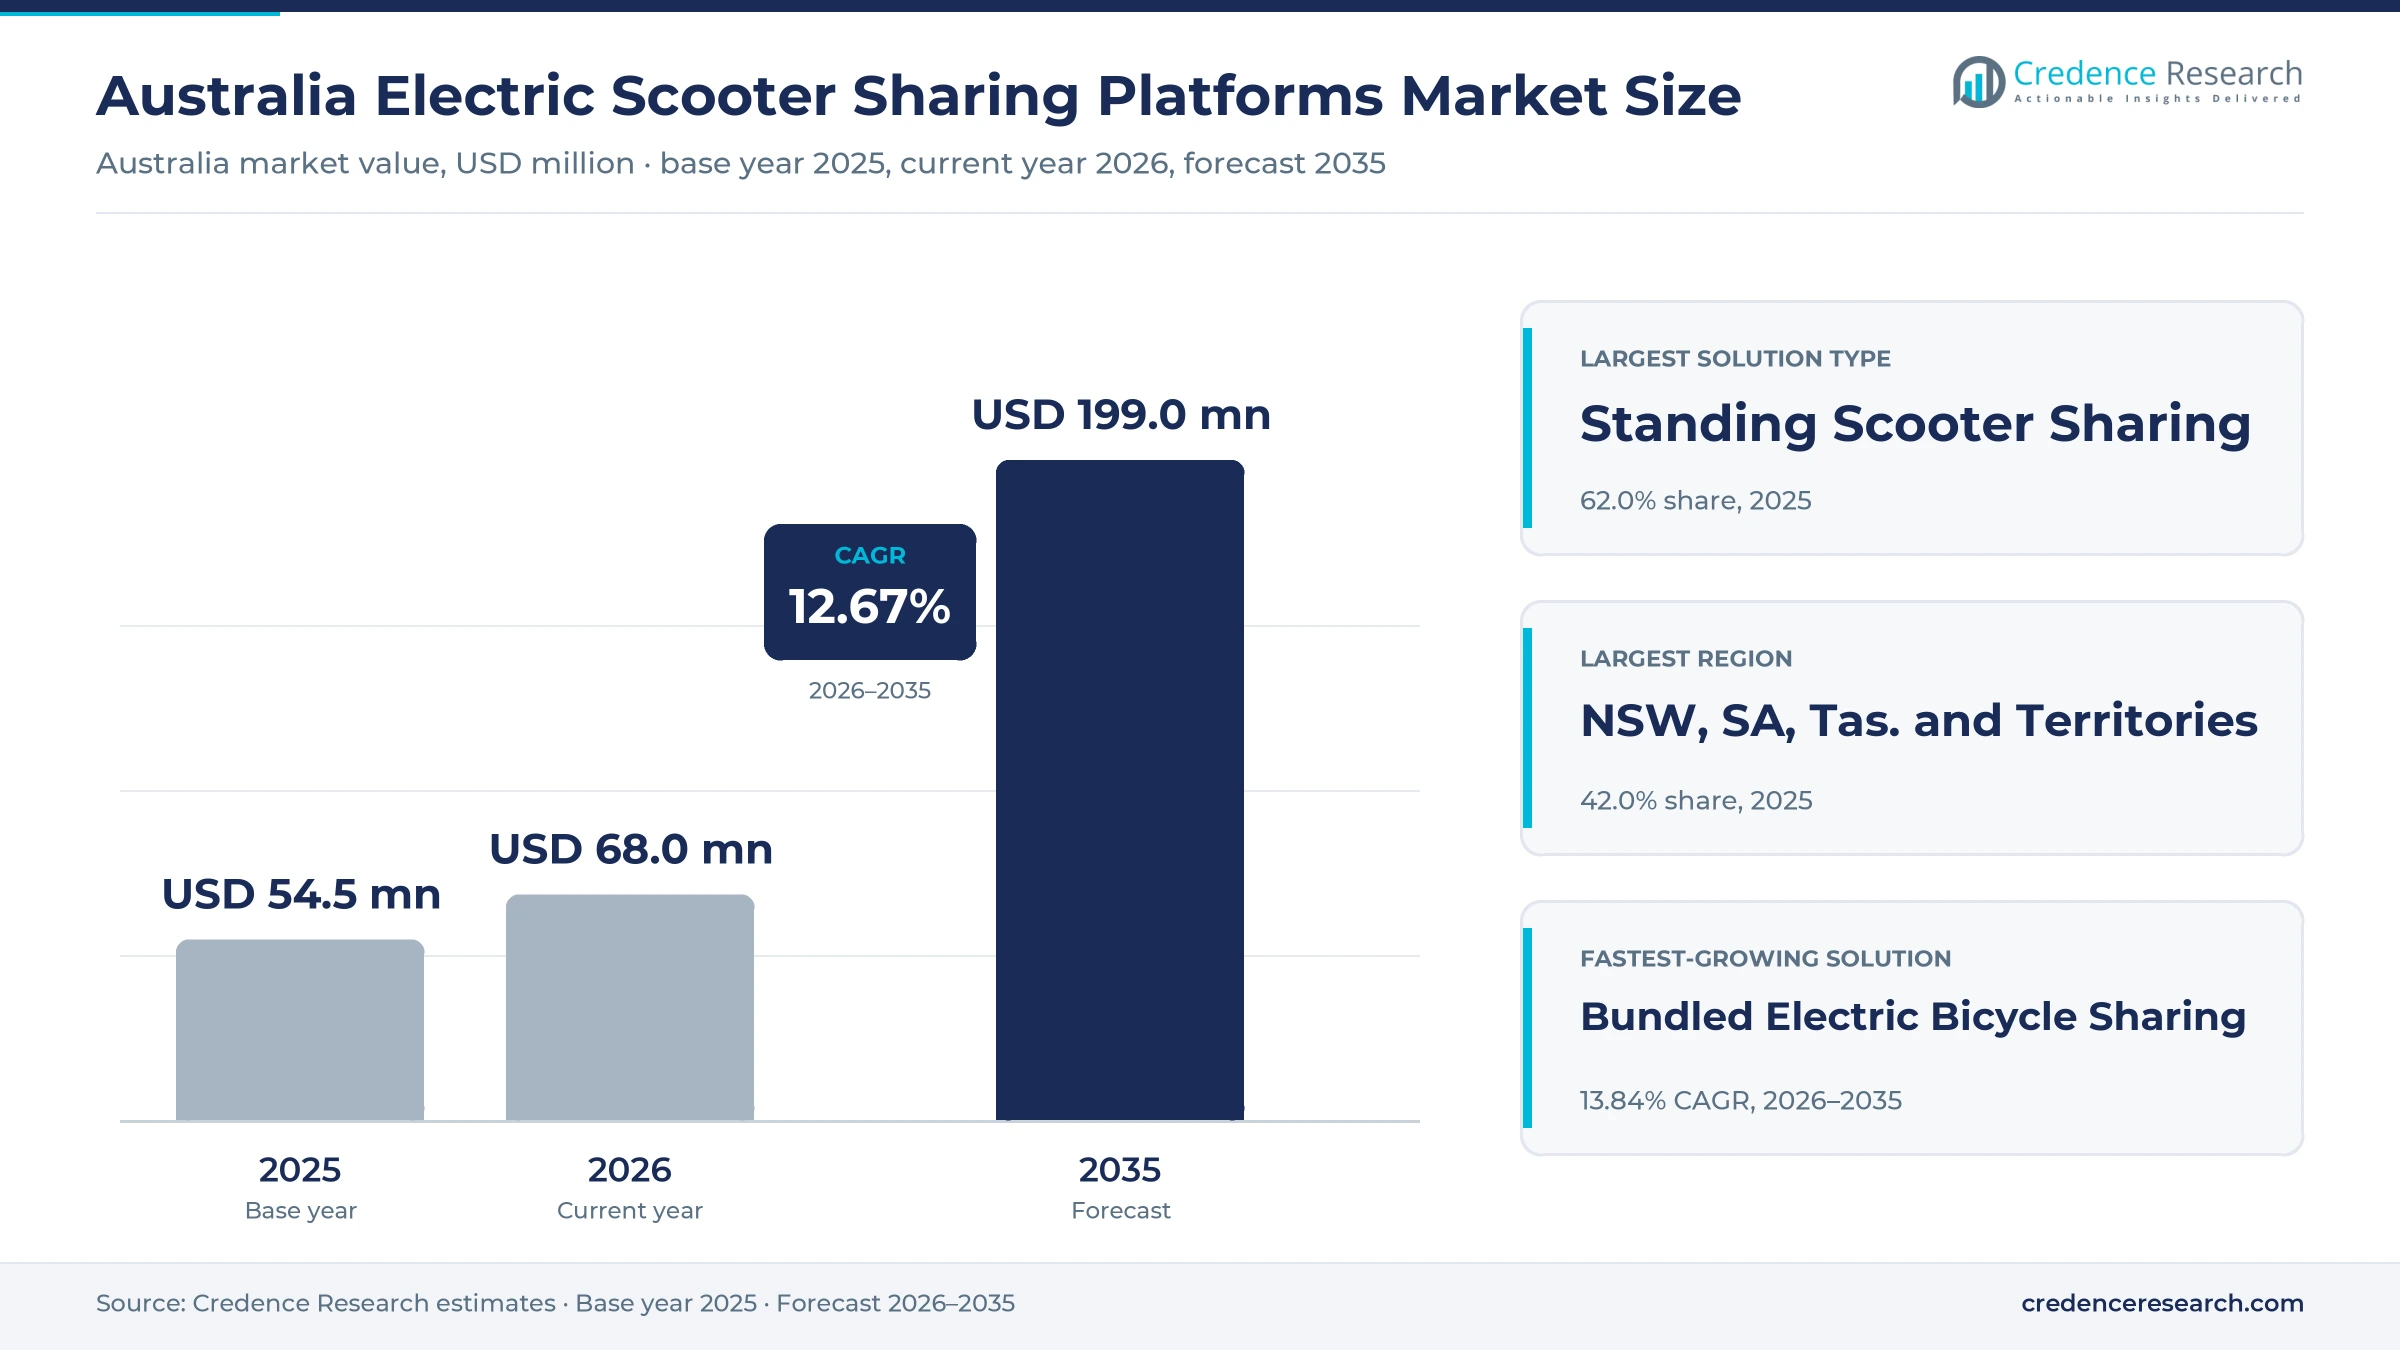
The Australia electric scooter sharing platforms market was valued at USD 54.5 million in 2025 and is projected to increase from USD 68.0 million in 2026 to USD 199.0 million by 2035, registering a CAGR of 12.67% during 2026–2035. Demand comes from residents, students and visitors who unlock app-based e-scooters and e-bikes for short trips to work, to train and bus stops, and for errands and leisure in city centers. New South Wales, South Australia, Tasmania and Territories held the largest regional share, 42.0% in 2025, because Sydney hosts large shared e-bike fleets while Adelaide and Canberra run e-scooter hire fleets. The same group is the fastest-growing region at 13.05% a year, as South Australia and the ACT widen legal access. In turn, compliance technology has become a condition of entry, because Victoria now requires hire operators to gain state approval and fit footpath detection and helmet verification.
Which hire services and fees fall inside the scope?
The estimate measures spending by riders in Australia on app-based shared e-scooters and bundled shared e-bikes run by licensed operators under council or territory agreements. It counts unlock fees, per-minute and per-trip charges, prepaid passes and monthly subscriptions for standing and seated scooters, whether vehicles park freely, in designated bays or under a mix of both rules.
The estimate excludes sales of private e-scooters and e-bikes, docked bicycle schemes without electric vehicles, and fines paid to councils or police. The value chain runs from vehicle makers and connected hardware suppliers through operators that charge, repair and move fleets, to councils that set permits, fleet caps and parking zones, and then to riders who pay through mobile apps.
Australia Electric Scooter Sharing Platforms Market Insights
- The Australia electric scooter sharing platforms market was valued at USD 54.5 million in 2025 and is projected to reach USD 199.0 million by 2035, registering a CAGR of 12.67% during 2026–2035.
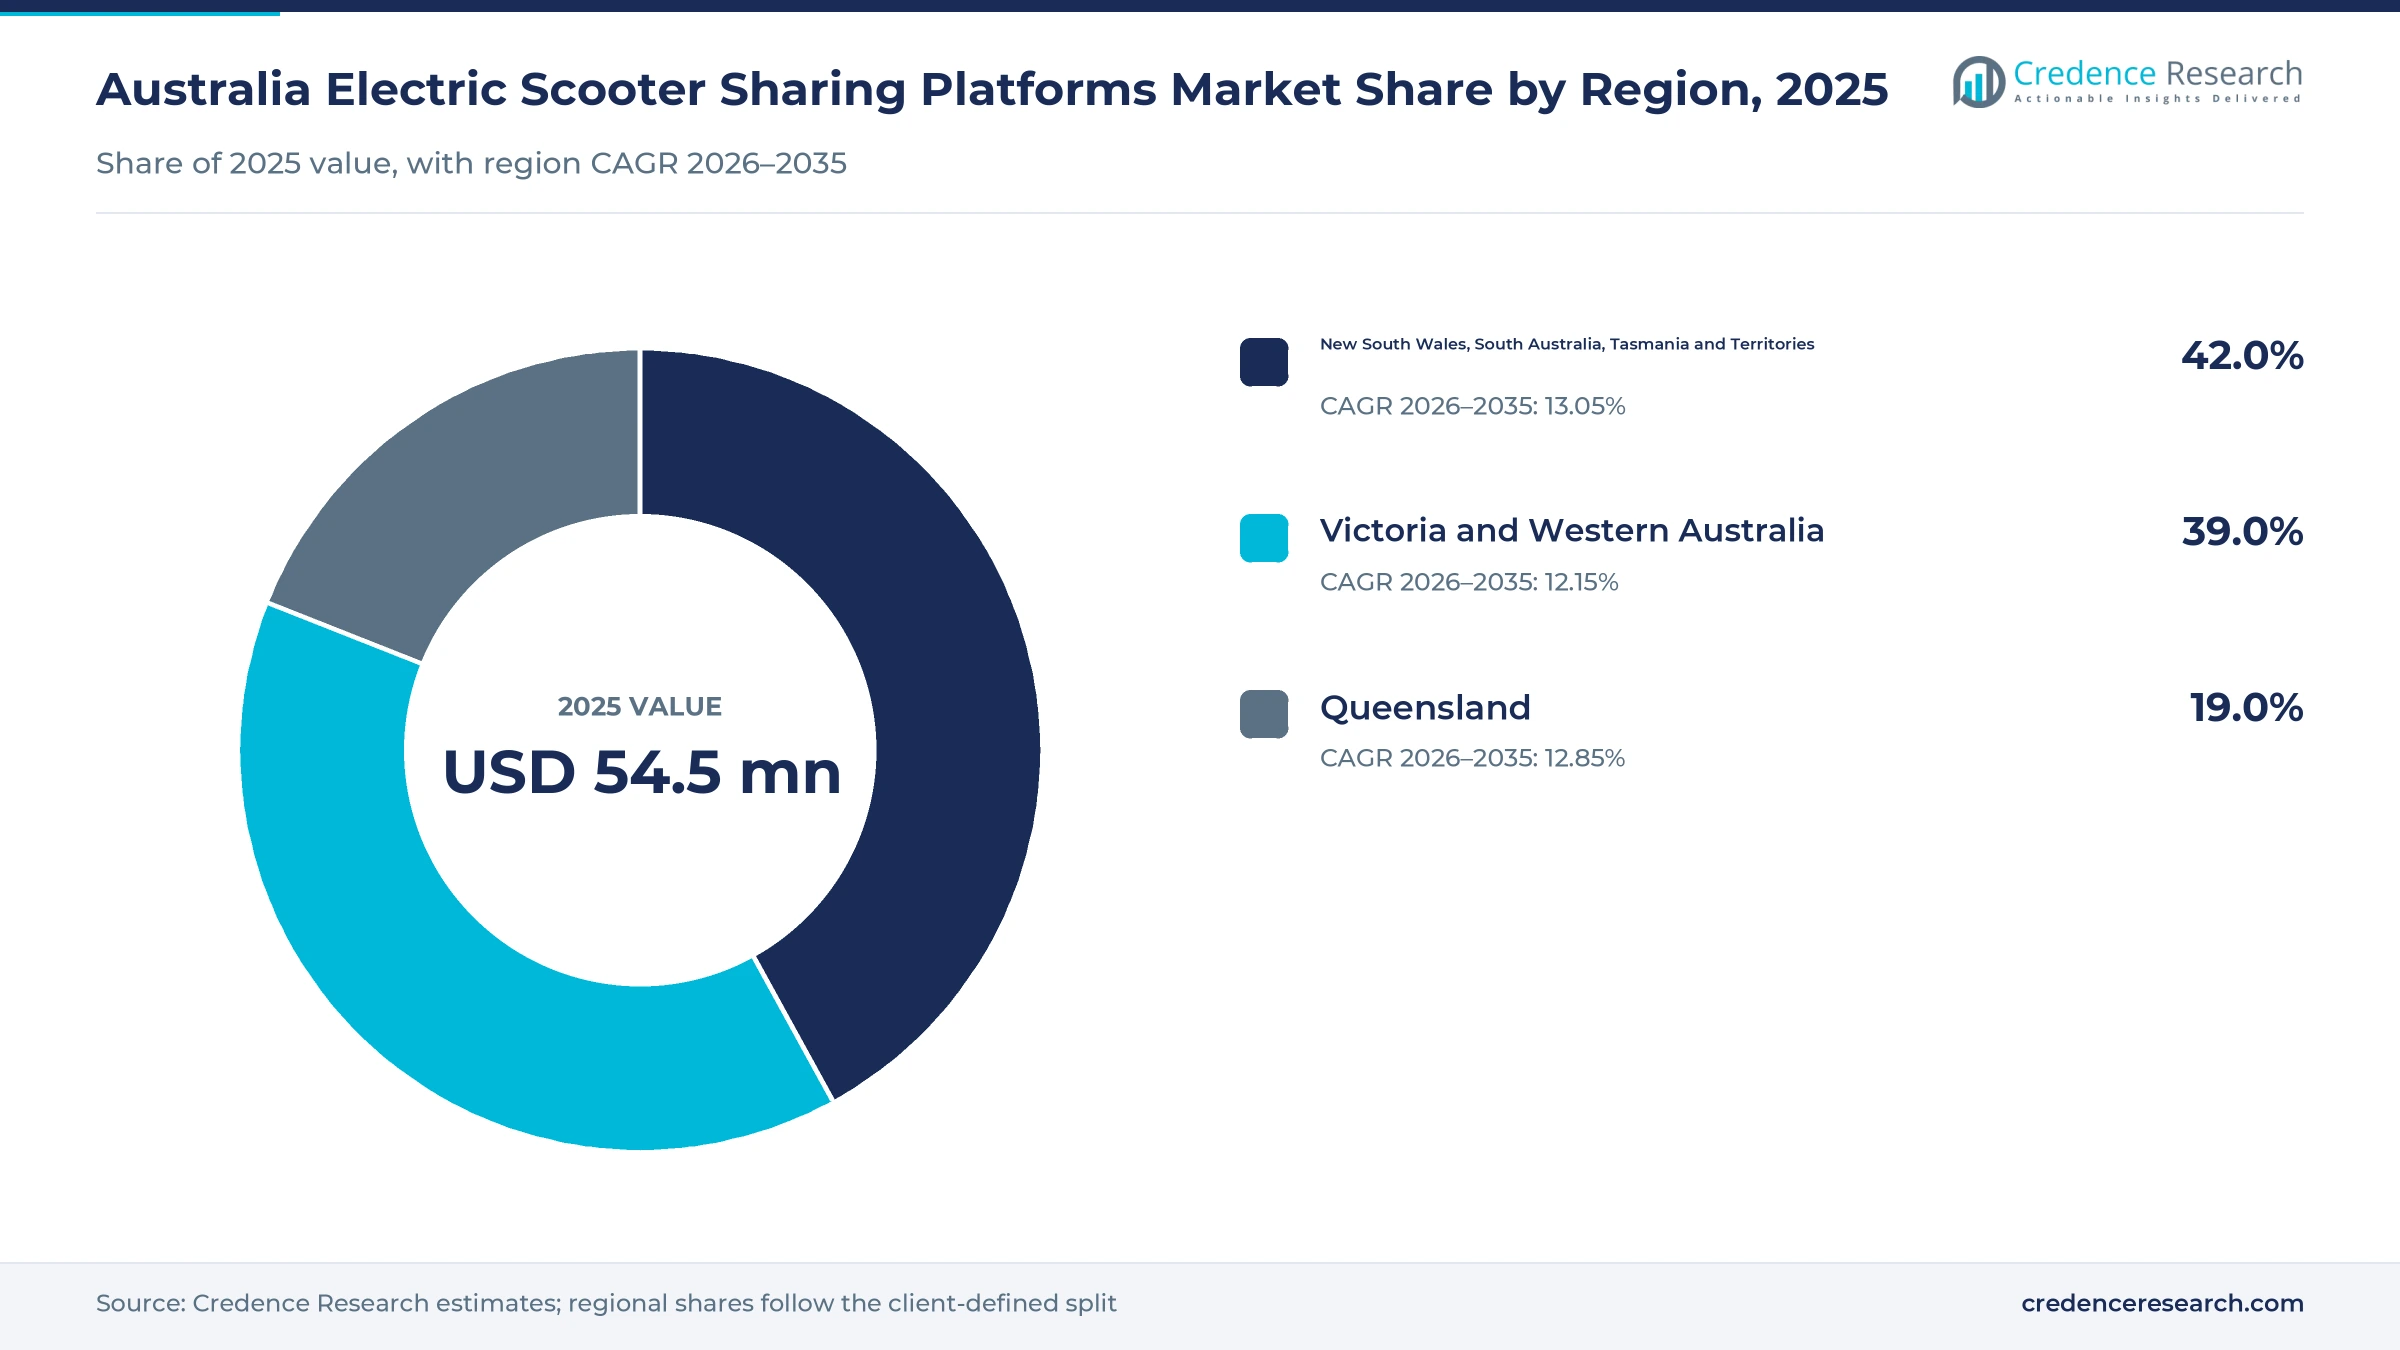
- New South Wales, South Australia, Tasmania and Territories held a 42.0% share of 2025 value, led by Sydney e-bike fleets and Adelaide and Canberra e-scooter hire.
- Standing Scooter Sharing led with a 62.0% share of 2025 value, because stand-up scooters still make up most hire fleets in capital cities.
- South Australia allowed riders over 16 to use e-scooters on public roads and paths from July 13, 2025, which widened the legal base for hire fleets.
- Recurring Subscriptions grow fastest at 14.70% a year during 2026–2035, as monthly ride plans give frequent riders flat prices for short trips.
Standing scooters lead while bundled e-bikes gain ground
Why do standing scooters still hold the largest share?
Based on solution type, the market is categorized into Standing Scooter Sharing, Seated Scooter Sharing and Bundled Electric Bicycle Sharing. Standing Scooter Sharing led with a 62.0% share of 2025 value, because stand-up scooters dominate most capital city fleets. Bundled Electric Bicycle Sharing grows fastest at 13.84% a year, as councils add e-bikes and link permits with public bicycle hire services.
How fast are councils moving riders into parking bays?
Based on deployment model, the market is categorized into Free-Floating Parking, Designated Parking and Hybrid Parking. Free-Floating Parking led with a 46.0% share of 2025 value, because many suburban permits still let riders end trips at the curb. Designated Parking grows fastest at 13.74% a year, as city centers require riders to finish trips in marked bays.
Which trip purposes generate most rides?
Based on application, the market is categorized into Direct Commuting, Public Transport Connections and Leisure and Errands. Leisure and Errands led with a 43.0% share of 2025 value, because weekend, tourist and shopping trips fill much of each fleet. Public Transport Connections grows fastest at 13.53% a year, as transport agencies link hire fleets with train, bus and mobility-as-a-service apps.
How are monthly plans changing rider payments?
Based on revenue model, the market is categorized into Pay-As-You-Go Rides, Prepaid Passes and Recurring Subscriptions. Pay-As-You-Go Rides led with a 64.0% share of 2025 value, because occasional riders and visitors pay per minute after an unlock fee. Recurring Subscriptions grows fastest at 14.70% a year, as operators offer flat monthly plans with discounted short trips.
| Segment Group | Leading Sub-segment | Share, 2025 | Fastest-growing Sub-segment | CAGR, 2026–2035 |
|---|---|---|---|---|
| By Solution Type | Standing Scooter Sharing | 62.0% | Bundled Electric Bicycle Sharing | 13.84% |
| By Deployment Model | Free-Floating Parking | 46.0% | Designated Parking | 13.74% |
| By Application | Leisure and Errands | 43.0% | Public Transport Connections | 13.53% |
| By Revenue Model | Pay-As-You-Go Rides | 64.0% | Recurring Subscriptions | 14.70% |
Request a Free Sample
Fill in your details and we'll send you a free sample report.
- Sample data tables & charts
- Research methodology
Legal certainty, new paths and rider habits lift demand
Why does legal certainty lift operator investment?
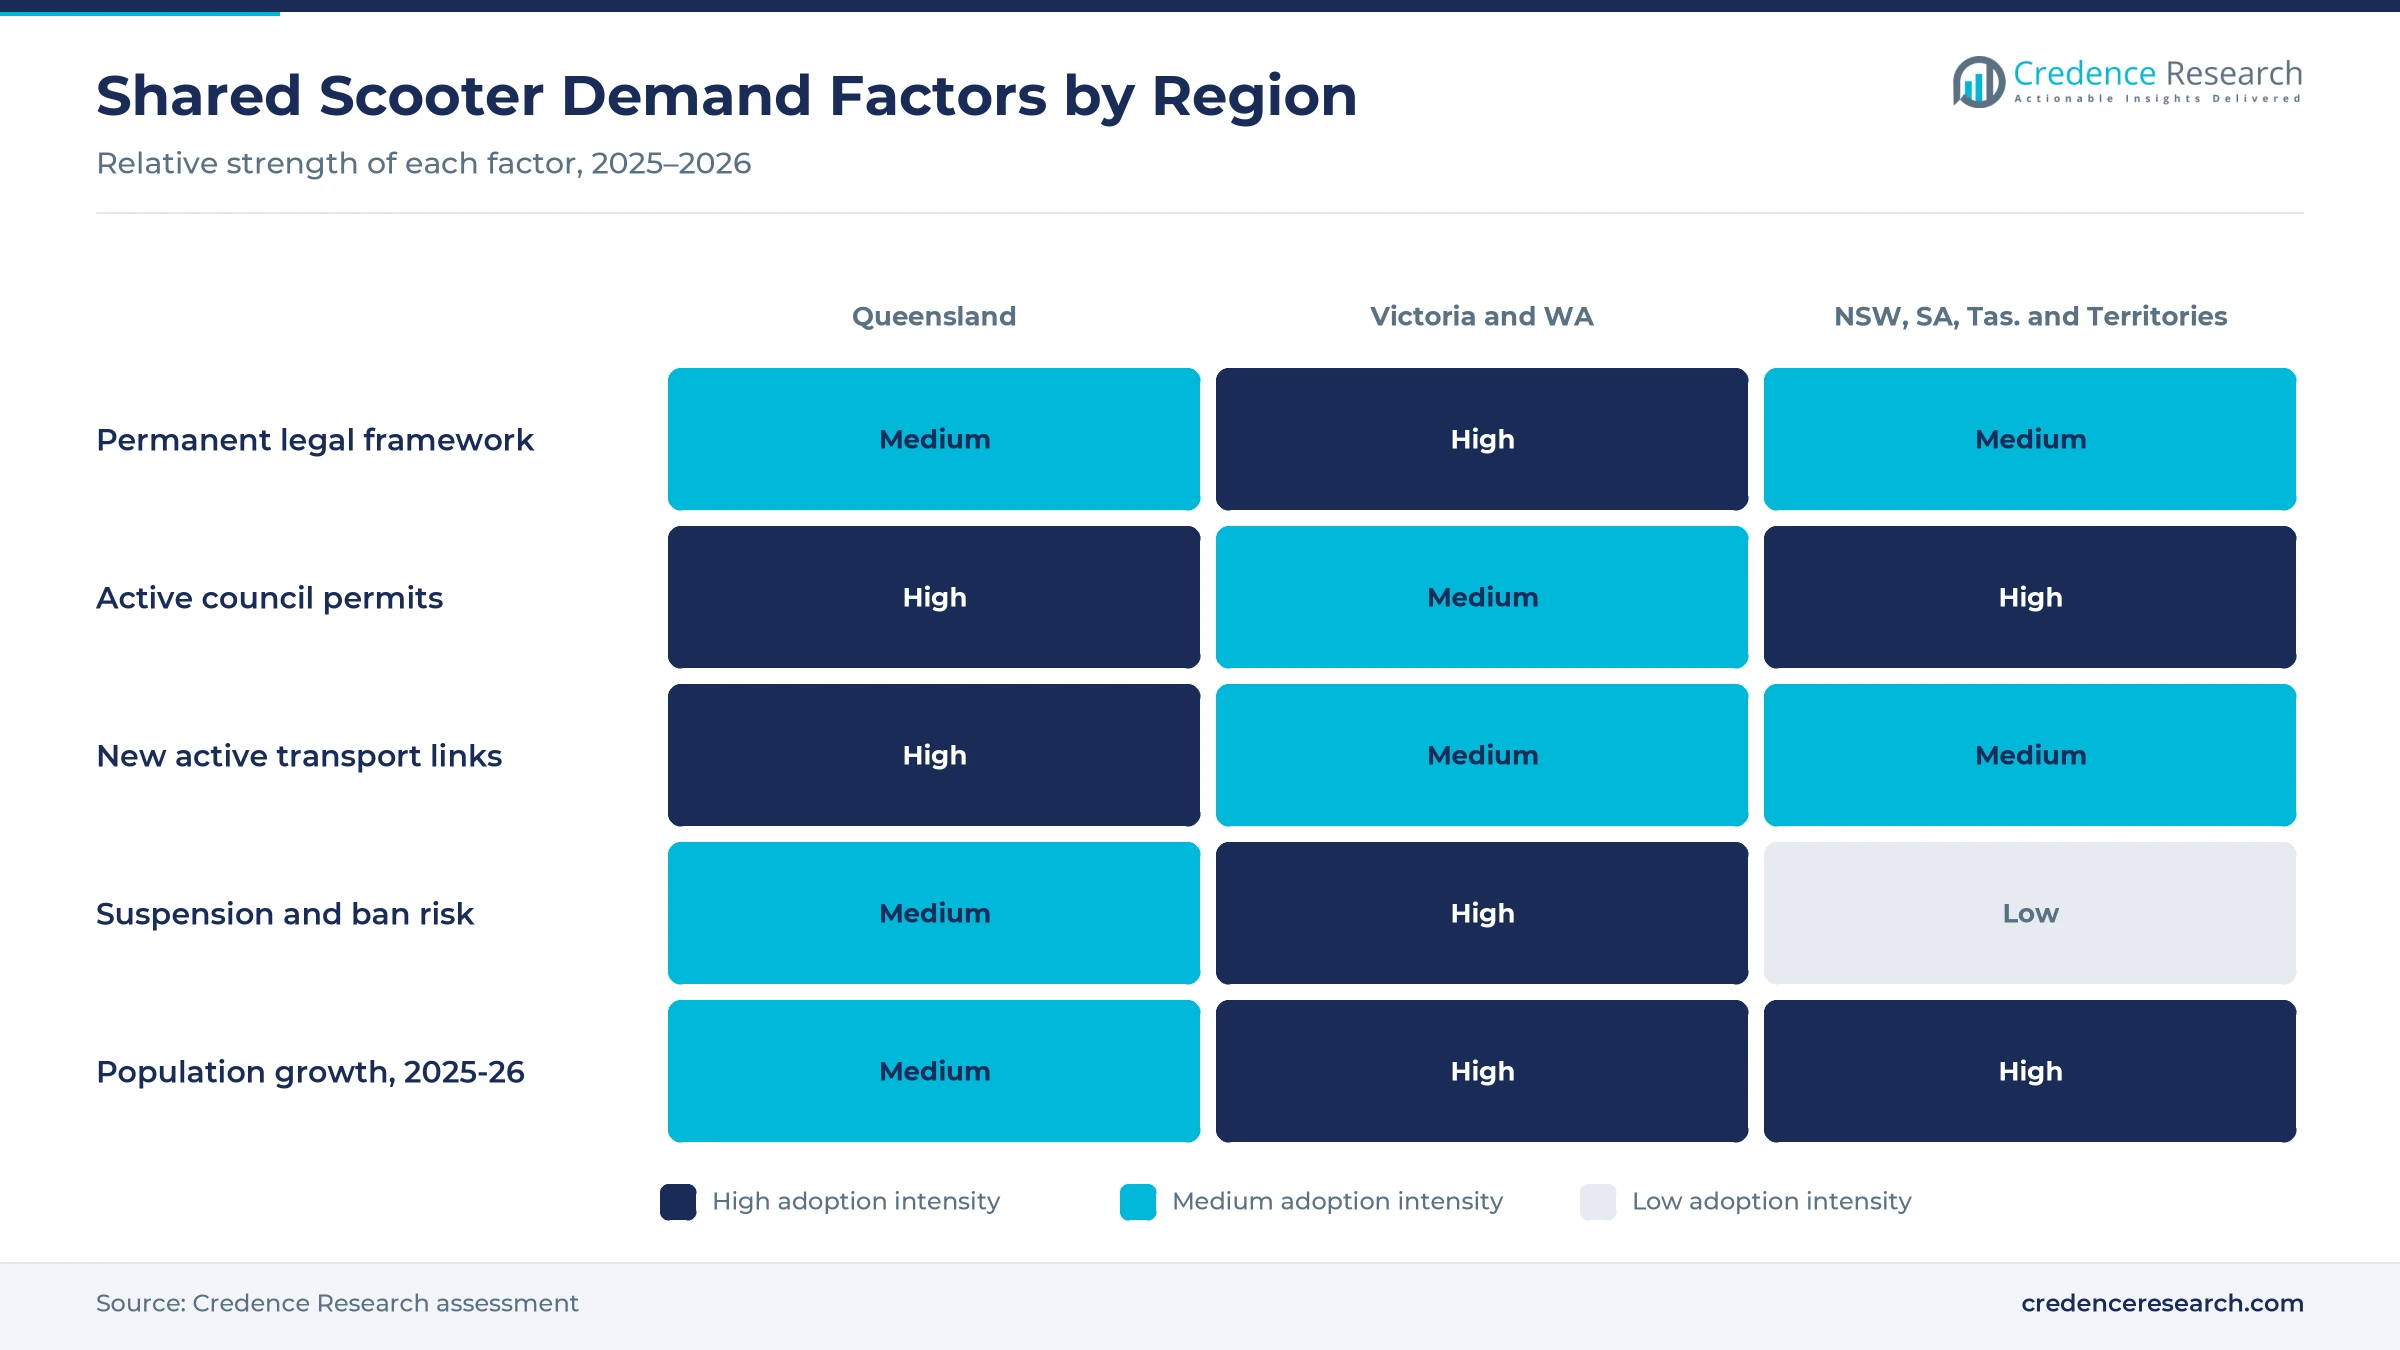
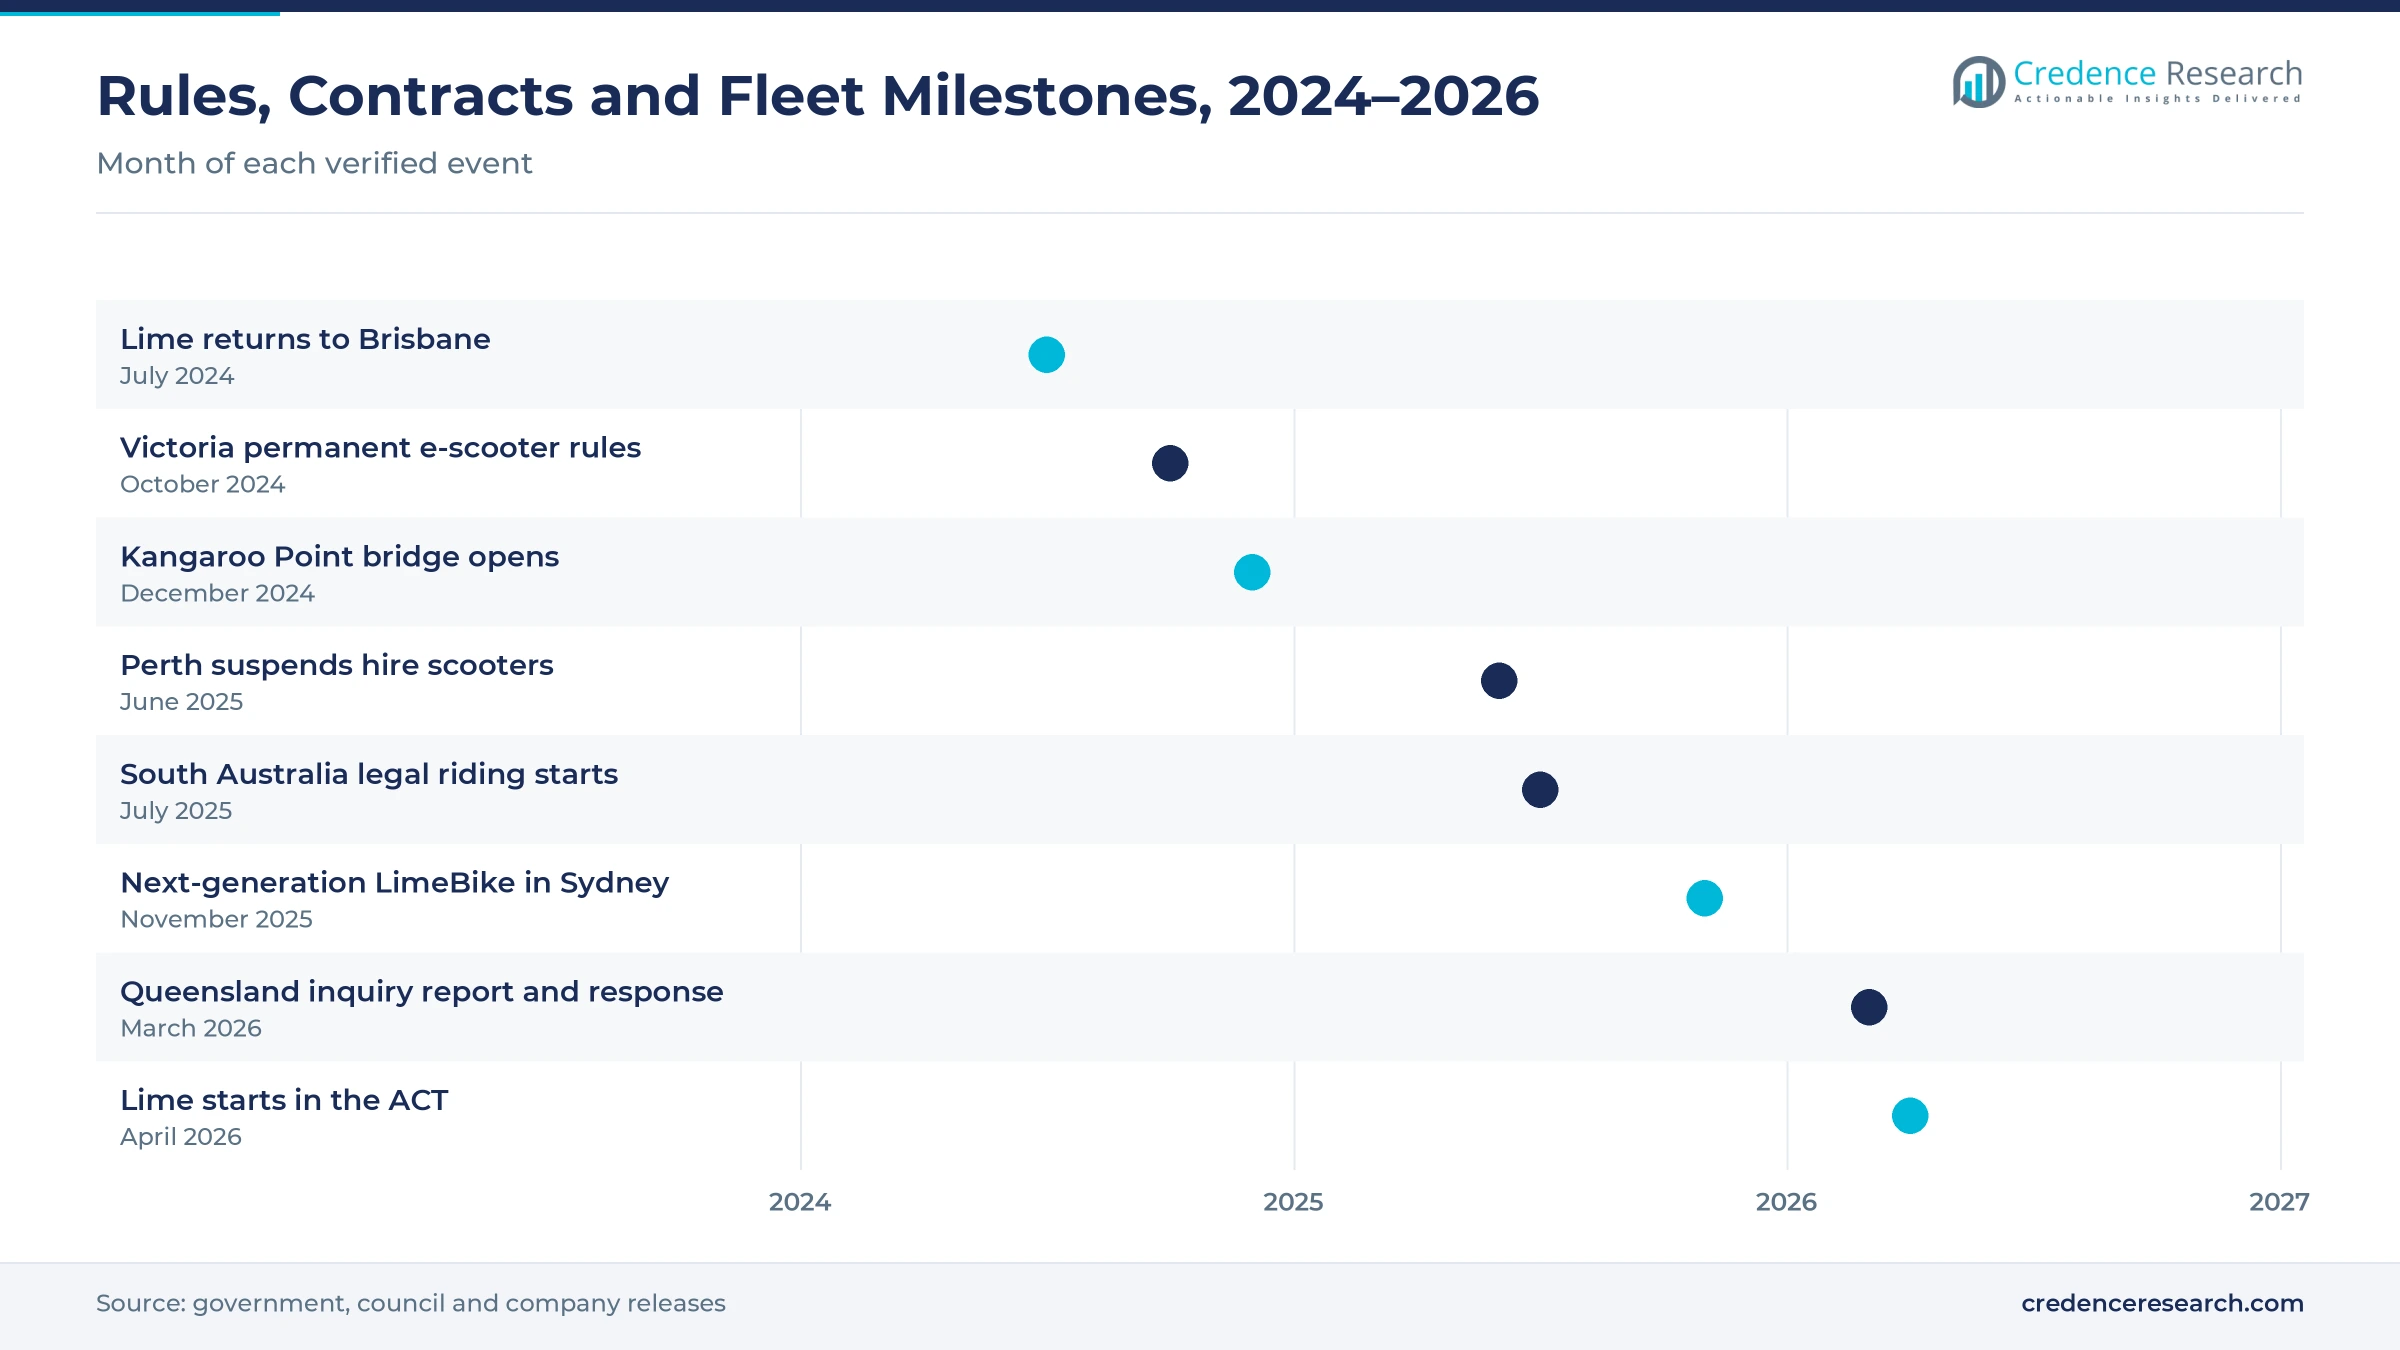
Permanent state rules are replacing short trials, which lets councils sign longer operator agreements and lets operators commit fleets, depots and staff. Victoria ended its two-year trial and made e-scooters permanently legal from October 2024, with share hire allowed only in council areas that hold an operator agreement, according to the Victorian Government. South Australia allowed riders over 16 to use e-scooters on public roads and paths from July 13, 2025, while hire companies keep operating under business permits, according to the Department for Infrastructure and Transport. The ACT also selected Lime to replace Neuron from April 16, 2026, with a fleet of 1,500 to 3,500 devices, according to The Canberra Times. As a result, longer permits now support larger fleets and local depots in the smaller states and territories.
Why do new paths and bridges widen ride catchments?
New protected paths, shared trails and river crossings extend the distance riders can cover safely, which widens the catchment for every parked vehicle. The federal Active Transport Fund allocated more than AUD 96 million across 80 projects by March 2025, including 25 Queensland projects worth AUD 24 million and 19 Victorian projects worth AUD 21 million, according to Bicycle Network. Brisbane opened the Breakfast Creek bridge in February 2024 and the Kangaroo Point active transport bridge in December 2024, according to Brisbane City Council. A new Brisbane operating agreement also started on July 22, 2024, under which Lime brought 1,700 e-scooters and 400 e-bikes, according to Micromobility Report. In turn, Queensland grows at 12.85% a year during 2026–2035.
How does wider device ownership build a ready rider base?
Wider ownership of private e-scooters and e-bikes is building a large pool of riders who already understand the controls, speed limits and road rules. About 1.35 million e-micromobility devices, including 460,000 e-scooters, were in use across New South Wales, according to Government News reporting on the state response to a parliamentary inquiry. The same data show that 47% of users ride to connect with public transport, while 34% of Greater Sydney trips replace a car trip. Urban residents also made up about 87.7% of the national population in 2025, according to World Bank data, which concentrates potential riders in dense corridors. As a result, Public Transport Connections grows fastest at 13.53% a year during 2026–2035.
Why do safety tools help operators win council permits?
Councils now award permits to operators that can prove control over footpath riding, parking and helmet use, which rewards spending on vehicle technology. Beam tested camera-based footpath detection on 150 e-scooters with the City of Melton in 2023, according to Inside Local Government. Neuron Mobility then began fitting AI cameras that detect footpath riding in under a second to its full Melbourne fleet of 1,250 scooters in July 2024, according to ZAG Daily. Victorian rules reported in May 2026 require share hire operators to gain state approval and fit footpath detection, helmet verification and geofencing, with new applications decided within 60 days, according to Bicycle Network. In turn, operators with proven compliance tools can win longer agreements and higher fleet caps.
Mixed fleets, parking bays and ride plans gain traction
Why is the shift toward mixed e-bike fleets gaining pace?
Councils are shifting permits from scooter-only fleets toward mixed or e-bike-led fleets, because e-bikes face fewer footpath complaints and suit hilly routes. The City of Hobart moved to an e-bike-only model in 2026, and its scheme had recorded more than 800,000 trips since December 2021, with about 45% replacing a car trip, according to the City of Hobart. Lime then planned about 350 shared e-bikes for Hobart under a 12-month permit in August 2026, according to Pulse Tasmania. Brisbane already includes 400 Lime e-bikes beside its scooters, and the ACT is negotiating the e-bike split in its new contract. As a result, Bundled Electric Bicycle Sharing grows fastest at 13.84% a year during 2026–2035.
How is the rise of designated parking reshaping fleets?
Parking rules are shifting from free curbside drop-offs toward marked bays and no-parking zones, because cluttered footpaths drive most council complaints. The City of Perth required riders to return scooters to mandatory parking locations or keep paying for the trip, and capped footpath speeds at 10 km/h, according to the city. Hobart also wrote designated parking requirements and no-terminate zones into the Lime permit it issued in 2026, according to Pulse Tasmania. A 2023 Melbourne camera trial found that over half of detected footpath riding happened at the start or end of trips near parking spots, according to AAP. Port Phillip has also installed 50 no-riding footpath decals at activity centers and high streets, according to the council. In turn, Designated Parking grows fastest at 13.74% a year during 2026–2035.
Can flat-fee memberships lift rider frequency?
Monthly ride plans give operators an opening to turn occasional users into frequent riders with predictable spending. LimePrime in Sydney charges a flat monthly fee of AUD 4.99, then AUD 2.75 for trips of up to 20 minutes and AUD 1.50 for rides under five minutes, according to FutureFive Australia. Lime said on Feb. 26, 2026, that an upgraded LimePrime with unlimited free unlocks would reach Australia within weeks. Neuron Mobility also sells three-day, weekly and monthly passes alongside pay-per-ride rates in Australian cities, according to the company. As a result, Recurring Subscriptions grows fastest at 14.70% a year, while Pay-As-You-Go Rides still holds 64.0% of 2025 value.
Can NSW and Queensland reforms open new council markets?
Pending reforms in the two most populous eastern states give operators an opening to bid for many new council permits. New South Wales runs shared e-scooter trials in Forster-Tuncurry and Wollongong until Jan. 22, 2027, and Transport for NSW released its trial report in July 2025, according to the state government. The NSW Government has also proposed legal riding on shared paths at 10 to 20 km/h and on 50 km/h roads at 20 km/h. In Queensland, an e-mobility inquiry report was tabled on March 4, 2026, and the government responded on March 25, 2026, according to the Department of Transport and Main Roads. In turn, suppliers of geofencing tools and compliance hardware gain new buyers.
Safety incidents, bans and contract churn test operators
How do serious incidents trigger sudden suspensions?
Safety risk remains the largest barrier, because a single serious crash can halt a whole scheme overnight and strand fleets, staff and depots. The City of Perth stopped hire e-scooters on June 5, 2025, after a pedestrian was killed, and the City of Vincent suspended its Neuron and Beam trial the next day. As a result, operators lost two council markets with no notice. Operators respond with rider checks, night-time slow zones and data sharing that helps councils review safety before restarting.
How does losing central Melbourne hurt operator returns?
City center bans are a costly restraint, because central business districts produce dense, short and profitable trips, so losing them hurts operator returns more than losing suburbs. City of Melbourne councillors voted 6-4 in August 2024 to end the Lime and Neuron contracts, after Neuron scooters had carried about 4.7 million trips since 2022, according to InDaily. In turn, operators lost their densest trip zone in Victoria. Operators respond with camera-based footpath detection and parking bays to rebuild council trust.
How does contract churn raise operator costs?
Contract churn puts pressure on operators, because councils re-tender permits every few years, and losing a contract forces an operator to remove or relocate its whole local fleet. Neuron left Brisbane when Lime returned in July 2024, and Lime replaced Neuron in the ACT in April 2026. Beam also ended its Hobart service when its permit expired on June 30, 2026. As a result, operators write off depots and local hiring. They respond by bidding with modular vehicles that can move between cities.
Why do prequalification rules raise entry costs?
Prequalification is a new barrier to entry, because state rules add approval, insurance and hardware costs before an operator can bid for a council permit. Victoria now requires a maintenance plan, minimum insurance, a fit-and-proper person test and footpath detection for share hire, according to Bicycle Network. In turn, smaller entrants struggle to fund the technology across a full fleet. Larger operators respond by spreading hardware and software costs across several cities and countries.
New South Wales and smaller states lead as Victoria slows
| Region | Value, 2025 (USD million) | Share, 2025 | CAGR, 2026–2035 |
|---|---|---|---|
| New South Wales, South Australia, Tasmania and Territories | 22.9 | 42.0% | 13.05% |
| Victoria and Western Australia | 21.3 | 39.0% | 12.15% |
| Queensland | 10.4 | 19.0% | 12.85% |
Sydney e-bikes and Adelaide and Canberra scooters lead
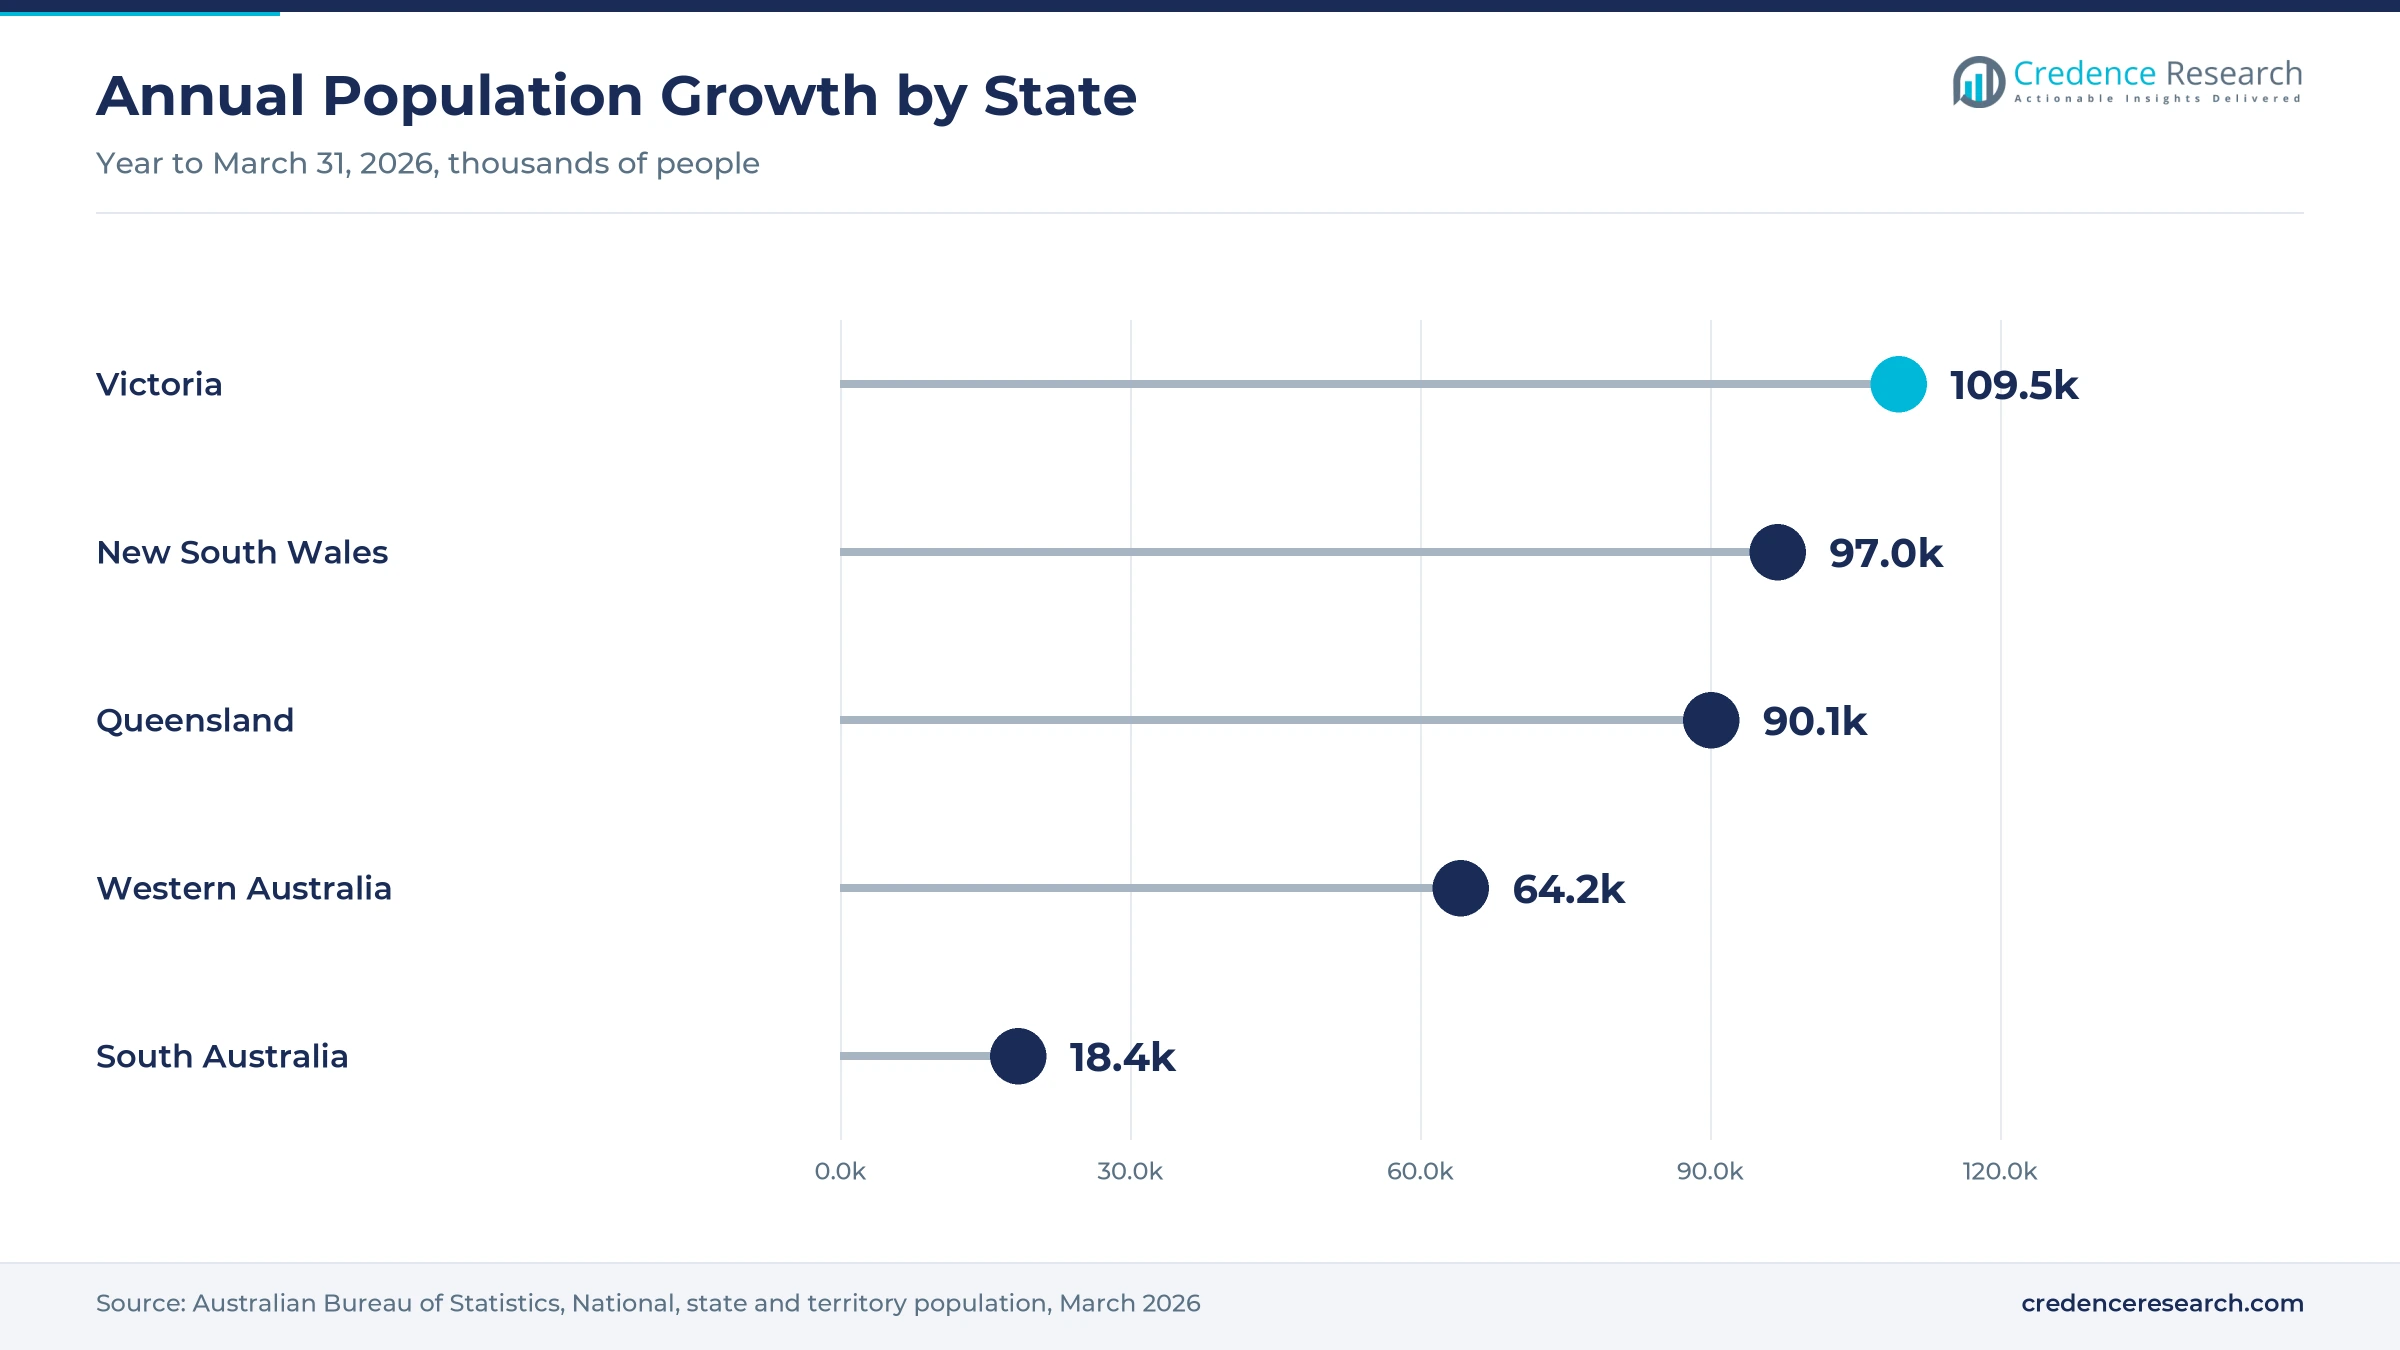
New South Wales, South Australia, Tasmania and Territories held a 42.0% share of 2025 value and grow at 13.05% a year. Sydney hosts Lime e-bikes, including the LimeBike model added in November 2025. South Australia legalized public e-scooter riding from July 13, 2025, while Canberra raised its permitted fleet to between 1,500 and 3,500 devices in April 2026. As a result, this group gains the most new riders.
Why do Melbourne and Perth decisions slow the second region?
Victoria and Western Australia held a 39.0% share of 2025 value and grow at 12.15% a year, the slowest of the three regions. Port Phillip riders took more than 1.5 million trips on Lime and Neuron scooters since February 2022, according to the City of Port Phillip. However, Melbourne ended central city hire in 2024, and Perth suspended hire scooters in June 2025. In turn, growth depends on suburban councils and any Perth restart.
How do Brisbane bridges and fleets support Queensland?
Queensland held a 19.0% share of 2025 value and grows at 12.85% a year. Brisbane runs one of the country's largest hire programs, with Lime bringing 1,700 e-scooters and 400 e-bikes in July 2024 alongside Beam. The city also opened active transport bridges at Breakfast Creek and Kangaroo Point in 2024, which link riverside suburbs with the center. As a result, Queensland gains steady demand while state e-mobility reforms move through parliament.
Contract changes and safety upgrades, 2024 to 2026
| Development | Status and market relevance |
|---|---|
| In July 2024, Lime returned to Brisbane under a new council agreement with 1,700 e-scooters and 400 e-bikes. | Replaced Neuron as one of two Brisbane operators |
| In July 2024, Neuron Mobility began fitting AI footpath-detection cameras to its 1,250-scooter Melbourne fleet. | Gives councils real-time evidence of compliance |
| In October 2024, Victoria made e-scooters permanently legal and kept share hire under council agreements. | Turned a two-year trial into a lasting framework |
| In July 2025, South Australia allowed riders over 16 to use e-scooters on public roads and paths. | Widened the legal base for Adelaide hire fleets |
| In April 2026, Lime began operating in the ACT with a fleet of 1,500 to 3,500 devices. | Replaced Neuron as the territory operator |
Cameras, helmet locks and precise location shape fleets
- Conventional geofencing uses GPS zones to cap speeds, block no-ride areas and set parking rules, and operators run it through micromobility operations software that also manages their fleets.
- Precision positioning relies on upgraded location hardware, such as the onboard units in the LimeBike launched in Sydney in November 2025, which lets operators enforce small parking bays and slow zones more accurately.
- Camera-assisted compliance uses forward-facing cameras and computer vision to detect footpath riding in under a second, which allows real-time warnings and speed cuts.
- Helmet locks and verification keep a helmet attached to each vehicle and can stop a ride when no helmet is present, which matches Victorian helmet verification rules and the built-in helmets required in Perth.
Need a Custom Version of This Report?
Tailor the scope, geography, or segments to your exact requirements.
- Custom geography or segment scope
- Direct access to our analyst team
Lime, Neuron and Beam compete for council permits
Competition centers on council and territory permits rather than open streets, so operators win by meeting safety, parking and reporting terms. Lime holds agreements in Brisbane, Port Phillip and the ACT, sells monthly LimePrime plans in Sydney and won the Hobart e-bike permit in 2026. Neuron Mobility designs its own scooters with helmet locks, topple detection and geofencing, and fitted AI cameras to its Melbourne fleet in 2024, although it lost Brisbane in 2024 and the ACT in 2026. Beam Mobility operated in Brisbane, Perth and Vincent, and ended its Hobart service in June 2026. Rivals compete on compliance technology, local depots, rider pricing and data sharing with councils, which favors operators that can spread hardware costs across many cities.
Which companies operate shared scooter fleets in Australia?
| Company | Type | Role in the market |
|---|---|---|
| Neuron Mobility Holdings | Shared e-scooter and e-bike operator | Port Phillip fleet and AI footpath cameras |
| Lime | Shared e-scooter and e-bike operator | Brisbane and ACT permits, Sydney and Hobart e-bikes |
| Beam Mobility | Shared e-scooter and e-bike operator | Brisbane operator; exited Hobart in 2026 |
Compliance tools decide who keeps council permits
Credence Research's view is that the Australia electric scooter sharing platforms market will grow strongly because states are moving from short trials to permanent rules that support longer council permits. Standing Scooter Sharing remains the largest value pool, while Bundled Electric Bicycle Sharing adds the fastest growth. Operators that can prove footpath detection, helmet checks and parking control should keep and widen their permits. Serious crashes and city center bans will remain the main risk, because one incident can stop a whole scheme.
Model built from official rules and council records
The report uses 2025 as the base year on a calendar basis, and market values come from the Credence Research model. That model draws on state road rules and transport department releases, council permits and fleet caps, national population statistics and company announcements on launches, pricing and contracts. Segment splits and regional growth rates are Credence Research estimates, while regional shares follow the Credence Research regional split. Sources used are official statistics, government and council releases, parliamentary records, trade press and company releases, and no interviews or surveys were used.
Wider legal access carries growth through 2035
The Australia electric scooter sharing platforms market is expected to reach USD 199.0 million by 2035, a 12.67% CAGR during 2026–2035, as permanent rules spread and councils sign longer permits. Growth should be strongest through 2029 while South Australia, the ACT and possibly New South Wales and Queensland widen legal access. After that, monthly plans and e-bike fleets will carry more of the value. A wave of suspensions after serious crashes would slow growth, while legal e-scooter riding in Sydney would lift it.
Frequently Asked Questions
How big is the Australia electric scooter sharing platforms market?
Which solution type leads Australian shared micromobility?
Which region leads the Australian market?
How did Victoria change its e-scooter rules?
Why are councils adding e-bikes to hire schemes?
Which revenue model is growing fastest?
Who are the leading companies in Australian scooter hire?
What are the main challenges for operators?
Table of Content
Chapter 1 Market Segmentation
- 1.1 Segmentation Framework
- 1.1.1 Product and Service Classification
- 1.1.2 Application and End-Use Classification
- 1.1.3 Technology and Solution Classification
- 1.1.4 Customer and Distribution Channel Classification
- 1.1.5 Geographic Segmentation
- 1.1.6 Market Segment Definitions and Boundaries
- 1.2 By Solution Type
- 1.2.1 Standing Scooter Sharing
- 1.2.2 Seated Scooter Sharing
- 1.2.3 Bundled Electric Bicycle Sharing
- 1.3 By Deployment Model
- 1.3.1 Free-Floating Parking
- 1.3.2 Designated Parking
- 1.3.3 Hybrid Parking
- 1.4 By Application
- 1.4.1 Direct Commuting
- 1.4.2 Public Transport Connections
- 1.4.3 Leisure and Errands
- 1.5 By Revenue Model
- 1.5.1 Pay-As-You-Go Rides
- 1.5.2 Prepaid Passes
- 1.5.3 Recurring Subscriptions
Chapter 2 Introduction
- 2.1 Report Objectives and Scope
- 2.2 Product Definition and Industry Terminology
- 2.3 Market Inclusions and Exclusions
- 2.4 Research Process
- 2.4.1 Primary Research and Expert Interviews
- 2.4.2 Secondary Research and Source Review
- 2.4.3 Top-Down and Bottom-Up Estimation
- 2.4.4 Data Triangulation and Verification
- 2.5 Market Size Measurement Basis
- 2.5.1 2025: USD 54.5 million → 2035: USD 199.0 million
- 2.6 Historical and Forecast Reference Periods
- 2.6.1 Historical Period: 2018-2025
- 2.6.2 Base Year: 2025
- 2.6.3 Forecast Period: 2025-2035
- 2.7 Research Assumptions and Limitations
Chapter 3 Executive Summary
- 3.1 Market Snapshot and Key Findings
- 3.2 Base-Year Market Size, 2025
- 3.3 Forecast Market Size, 2035
- 3.4 Revenue and Volume Growth Outlook
- 3.5 Key Demand and Supply Indicators
- 3.6 Leading Market Segments
- 3.7 Fastest-Growing Market Opportunities
- 3.8 Regional Performance Highlights
- 3.9 Technology and Industry Transformation
- 3.10 Competitive Landscape Summary
- 3.11 Analyst View and Strategic Implications
Chapter 4 Australia Electric Scooter Sharing Platforms Market Trends and Developments
- 4.1 Historical Industry Development, 2018-2025
- 4.2 Recent Market Trends and Developments
- 4.3 Demand and Customer Behavior Trends
- 4.4 Technology and Product Innovation
- 4.5 Artificial Intelligence, Automation and Digitalization
- 4.6 Local Manufacturing and Supply Chain Realignment
- 4.7 Industry Partnerships, Mergers and Acquisitions
- 4.8 Sustainability and Circular Economy Developments
- 4.9 Government and Private Sector Investment Trends
- 4.10 Emerging Business Models and Commercialization
- 4.11 Industry Developments and Announcements
Chapter 5 Australia Electric Scooter Sharing Platforms Market Production, Supply and Demand Analysis
- 5.1 Demand Trend and Consumption Analysis, 2018-2025
- 5.2 Demand Forecast, 2025-2035
- 5.3 Production and Output Trend, 2018-2025
- 5.4 Production and Output Forecast, 2025-2035
- 5.5 Installed Capacity and Capacity Utilization
- 5.6 Company-Wise Production Plants and Statistics
- 5.6.1 Installed Production Capacity
- 5.6.2 Actual Production
- 5.6.3 Planned Capacity and Expansion Targets
- 5.7 Supply Chain Structure and Procurement Trends
- 5.8 Supply-Demand Gap and Bottlenecks
- 5.9 Import Dependence and Sourcing Structure
- 5.10 Contract Manufacturing and Outsourcing
- 5.11 Regional Supply and Demand Concentration
Chapter 6 Australia Electric Scooter Sharing Platforms Market Pricing Analysis
- 6.1 Pricing Structure and Measurement
- 6.2 Historical Pricing Trends, 2018-2025
- 6.3 Pricing Outlook, 2025-2035
- 6.4 Average Selling Price and Unit Economics
- 6.5 Pricing by Product and Market Segment
- 6.6 Geographic Pricing Differences
- 6.7 Key Input, Energy, Labor and Logistics Costs
- 6.8 Contract Pricing and Purchasing Models
- 6.9 Pricing Sensitivity and Competitive Positioning
- 6.10 Price, Margin and Profitability Implications
Chapter 7 Australia Electric Scooter Sharing Platforms Market Dynamics
- 7.1 Market Growth Drivers
- 7.1.1 Demand-Side Drivers
- 7.1.2 Technology and Innovation Drivers
- 7.1.3 Infrastructure and Investment Drivers
- 7.1.4 Regulatory and Policy Drivers
- 7.2 Market Restraints
- 7.2.1 Cost and Affordability Constraints
- 7.2.2 Technology and Adoption Barriers
- 7.2.3 Supply Chain and Operational Constraints
- 7.3 Market Challenges
- 7.3.1 Competitive Pressure and Margin Erosion
- 7.3.2 Skills, Infrastructure and Implementation Gaps
- 7.4 Emerging Market Opportunities
- 7.5 Market Dynamics Impact and Time-Horizon Assessment
Chapter 8 Australia Electric Scooter Sharing Platforms Value Chain Analysis
- 8.1 Industry Value Chain Overview
- 8.2 Upstream Suppliers and Critical Inputs
- 8.3 Technology and Component Providers
- 8.4 Manufacturing or Service Delivery
- 8.5 Distribution, Channel Partners and Integrators
- 8.6 Downstream Applications and End Users
- 8.7 Value Addition and Profit Pools
- 8.8 Vertical Integration and Outsourcing
- 8.9 Supplier Concentration and Risk
- 8.10 Supply Chain Localization and Resilience
Chapter 9 Australia Electric Scooter Sharing Platforms Market Regulations and Policies
- 9.1 Relevant Laws, Standards and Compliance Frameworks
- 9.2 Product, Service, Safety and Quality Requirements
- 9.3 Government Policies, Incentives and Subsidies
- 9.4 Imports, Exports and Trade Barriers
- 9.5 Public Procurement and Local Content Requirements
- 9.6 Environmental and Sustainability Compliance
- 9.7 Upcoming Policy Changes and Market Implications
Chapter 10 Australia Electric Scooter Sharing Platforms Market Hotspots and Opportunities
- 10.1 Market Opportunity Mapping and Growth Hotspots
- 10.2 High-Growth Applications and Customer Groups
- 10.3 Underserved Markets and White-Space Opportunities
- 10.4 Emerging Technology and Product Opportunities
- 10.5 New Capacity and Investment Hotspots
- 10.6 Market Entry and Expansion Opportunities
- 10.7 Distribution and Partnership Opportunities
- 10.8 Near-Term and Long-Term Commercial Potential
- 10.9 Opportunity Attractiveness and Execution Risks
Chapter 11 Australia Electric Scooter Sharing Platforms Market Outlook, 2025-2035
- 11.1 Market Size and Analysis
- 11.1.1 Revenue (Market Measurement: 2025: USD 54.5 million → 2035: USD 199.0 million)
- 11.1.2 Market Volume and Quantity Sold
- 11.1.3 Historical Market Size, 2018-2025
- 11.1.4 Base-Year Market Size, 2025
- 11.2 Market Forecast, 2025-2035
- 11.2.1 Revenue Forecast to 2035
- 11.2.2 Volume Forecast to 2035
- 11.2.3 CAGR and Year-on-Year Growth
- 11.2.4 Incremental Revenue Opportunity
- 11.3 Forecast Assumptions and Scenario Analysis
- 11.3.1 Base-Case Forecast
- 11.3.2 Optimistic and Conservative Scenarios
- 11.3.3 Technology, Pricing and Policy Sensitivities
- 11.4 Market Attractiveness and Growth Outlook
Chapter 12 Australia Electric Scooter Sharing Platforms Market Segmentation and Outlook
- 12.1 Segmentation Summary and Market Shares, 2025
- 12.2 Largest and Fastest-Growing Segments
- 12.3 By Solution Type - Market Size and Forecast, 2025-2035
- 12.3.1 Segment Definition and Scope
- 12.3.2 Historical Market Size, 2018-2025
- 12.3.3 Revenue Forecast, 2025-2035
- 12.3.4 Volume Forecast, 2025-2035
- 12.3.5 Base-Year Market Share, 2025
- 12.3.6 Segment CAGR and Growth Drivers
- 12.3.7 Subsegment Market Size and Forecast
- 12.3.7.1 Standing Scooter Sharing
- 12.3.7.2 Seated Scooter Sharing
- 12.3.7.3 Bundled Electric Bicycle Sharing
- 12.3.8 Subsegment Pricing and Adoption Trends
- 12.3.9 Leading Suppliers and Competition
- 12.3.10 Regional Demand and Opportunities
- 12.4 By Deployment Model - Market Size and Forecast, 2025-2035
- 12.4.1 Segment Definition and Scope
- 12.4.2 Historical Market Size, 2018-2025
- 12.4.3 Revenue Forecast, 2025-2035
- 12.4.4 Volume Forecast, 2025-2035
- 12.4.5 Base-Year Market Share, 2025
- 12.4.6 Segment CAGR and Growth Drivers
- 12.4.7 Subsegment Market Size and Forecast
- 12.4.7.1 Free-Floating Parking
- 12.4.7.2 Designated Parking
- 12.4.7.3 Hybrid Parking
- 12.4.8 Subsegment Pricing and Adoption Trends
- 12.4.9 Leading Suppliers and Competition
- 12.4.10 Regional Demand and Opportunities
- 12.5 By Application - Market Size and Forecast, 2025-2035
- 12.5.1 Segment Definition and Scope
- 12.5.2 Historical Market Size, 2018-2025
- 12.5.3 Revenue Forecast, 2025-2035
- 12.5.4 Volume Forecast, 2025-2035
- 12.5.5 Base-Year Market Share, 2025
- 12.5.6 Segment CAGR and Growth Drivers
- 12.5.7 Subsegment Market Size and Forecast
- 12.5.7.1 Direct Commuting
- 12.5.7.2 Public Transport Connections
- 12.5.7.3 Leisure and Errands
- 12.5.8 Subsegment Pricing and Adoption Trends
- 12.5.9 Leading Suppliers and Competition
- 12.5.10 Regional Demand and Opportunities
- 12.6 By Revenue Model - Market Size and Forecast, 2025-2035
- 12.6.1 Segment Definition and Scope
- 12.6.2 Historical Market Size, 2018-2025
- 12.6.3 Revenue Forecast, 2025-2035
- 12.6.4 Volume Forecast, 2025-2035
- 12.6.5 Base-Year Market Share, 2025
- 12.6.6 Segment CAGR and Growth Drivers
- 12.6.7 Subsegment Market Size and Forecast
- 12.6.7.1 Pay-As-You-Go Rides
- 12.6.7.2 Prepaid Passes
- 12.6.7.3 Recurring Subscriptions
- 12.6.8 Subsegment Pricing and Adoption Trends
- 12.6.9 Leading Suppliers and Competition
- 12.6.10 Regional Demand and Opportunities
- 12.7 Segment Growth Comparison
- 12.8 Segment Attractiveness and Priority Matrix
Chapter 13 Australia Electric Scooter Sharing Platforms End-Use and Application Market Outlook
- 13.1 End-Use Industry and Customer Demand Structure
- 13.2 Leading Applications and Customer Groups
- 13.3 End-Use Market Size, Share and Forecast
- 13.4 Major End-Use Industry Deep Dives
- 13.4.1 Customer Requirements and Use Cases
- 13.4.2 Demand and Replacement Cycles
- 13.4.3 Technical and Regulatory Considerations
- 13.4.4 Purchasing and Procurement Models
- 13.4.5 Leading Vendors and Distribution Channels
- 13.4.6 Forecast and Commercial Opportunities
- 13.5 Emerging Applications and Cross-Segment Demand
- 13.6 End-Use Industry Investment Priorities
Chapter 14 Australia Electric Scooter Sharing Platforms Geographic Market Outlook, 2025-2035
- 14.1 Domestic Market Distribution and Demand Clusters
- 14.2 State- or Province-Wise Market Size and Forecast, 2025-2035
- 14.3 City and Metropolitan Market Outlook
- 14.4 Industrial, Manufacturing and Commercial Clusters
- 14.5 Geographic Concentration of Key End Users
- 14.6 Local Pricing and Purchasing Differences
- 14.7 Domestic Production Facilities and Capacity Map
- 14.8 Local Infrastructure and Project Pipeline
- 14.9 State-Level Policy and Incentive Differences
- 14.10 Subnational Investment Hotspots and Opportunities
- 14.11 Distribution and Logistics Networks
- 14.12 Domestic Competitive Footprint
Chapter 15 Australia Electric Scooter Sharing Platforms Technology, Innovation and Sustainability Outlook
- 15.1 Technology Landscape and Maturity
- 15.2 Product, Process and Service Innovation
- 15.3 AI, Automation and Digital Tools in the Industry
- 15.4 Technology Adoption and Performance Benchmarking
- 15.5 Innovation Pipeline and R&D Investment
- 15.6 Patent and Intellectual Property Trends
- 15.7 Energy Efficiency and Resource Management
- 15.8 Sustainability, Recycling and Circularity
- 15.9 Technology Roadmap, 2025-2035
- 15.10 Risks of Obsolescence and Technology Substitution
Chapter 16 Australia Electric Scooter Sharing Platforms Market Key Strategic Imperatives
- 16.1 Growth and Market Entry Priorities
- 16.2 High-Return Products and Segments
- 16.3 Pricing, Profitability and Cost Optimization
- 16.4 Technology Investment and Product Differentiation
- 16.5 Supply Chain Localization and Resilience
- 16.6 Distribution and Customer Acquisition
- 16.7 Partnership, Acquisition and Capacity Strategy
- 16.8 Regional Expansion Priorities
- 16.9 Short-, Medium- and Long-Term Actions
Chapter 17 Competition Outlook
- 17.1 Industry Competition Characteristics
- 17.2 Market Structure and Concentration
- 17.3 Market Share and Competitive Positioning, 2025
- 17.4 Company-Wise Revenue and Product Benchmarking
- 17.5 Production and Service Capacity Benchmarking
- 17.6 Technology, Pricing and Differentiation
- 17.7 Regional Footprint and Distribution Strength
- 17.8 Mergers, Acquisitions and Strategic Alliances
- 17.9 New Entrants and Competitive Threats
- 17.10 Porter's Five Forces and Industry Attractiveness
- 17.11 Competitive Outlook, 2025-2035
Chapter 18 Company Profiles
- 18.1 Company Coverage and Selection Criteria
- 18.2 Neuron Mobility Holdings
- 18.2.1 Business Description
- 18.2.2 Company Ownership and Geographic Presence
- 18.2.3 Product and Service Portfolio
- 18.2.4 Manufacturing and Operating Footprint
- 18.2.5 Production Capacity and Expansion Plans
- 18.2.6 Financial Performance and Investment
- 18.2.7 Market Share and Competitive Position
- 18.2.8 Technology and Innovation Capabilities
- 18.2.9 Strategic Alliances or Partnerships
- 18.2.10 Recent Developments
- 18.2.11 Growth Strategy and Outlook
- 18.3 Lime
- 18.4 Beam Mobility
- 18.5 Other Relevant Market Participants
Note: Every listed company is profiled on the structure shown under the first company. The company list is preliminary and may change based on research findings, market developments, data availability and client requirements.
Chapter 19 Disclaimer
- 19.1 Research and Forecast Disclaimer
- 19.2 Data Source and Estimation Limitations
Note: The depth of individual sections depends on data availability for this market. Volume, capacity, trade and other unit-based metrics are included where applicable.

