
Outsourced warehousing is core to regional supply chains
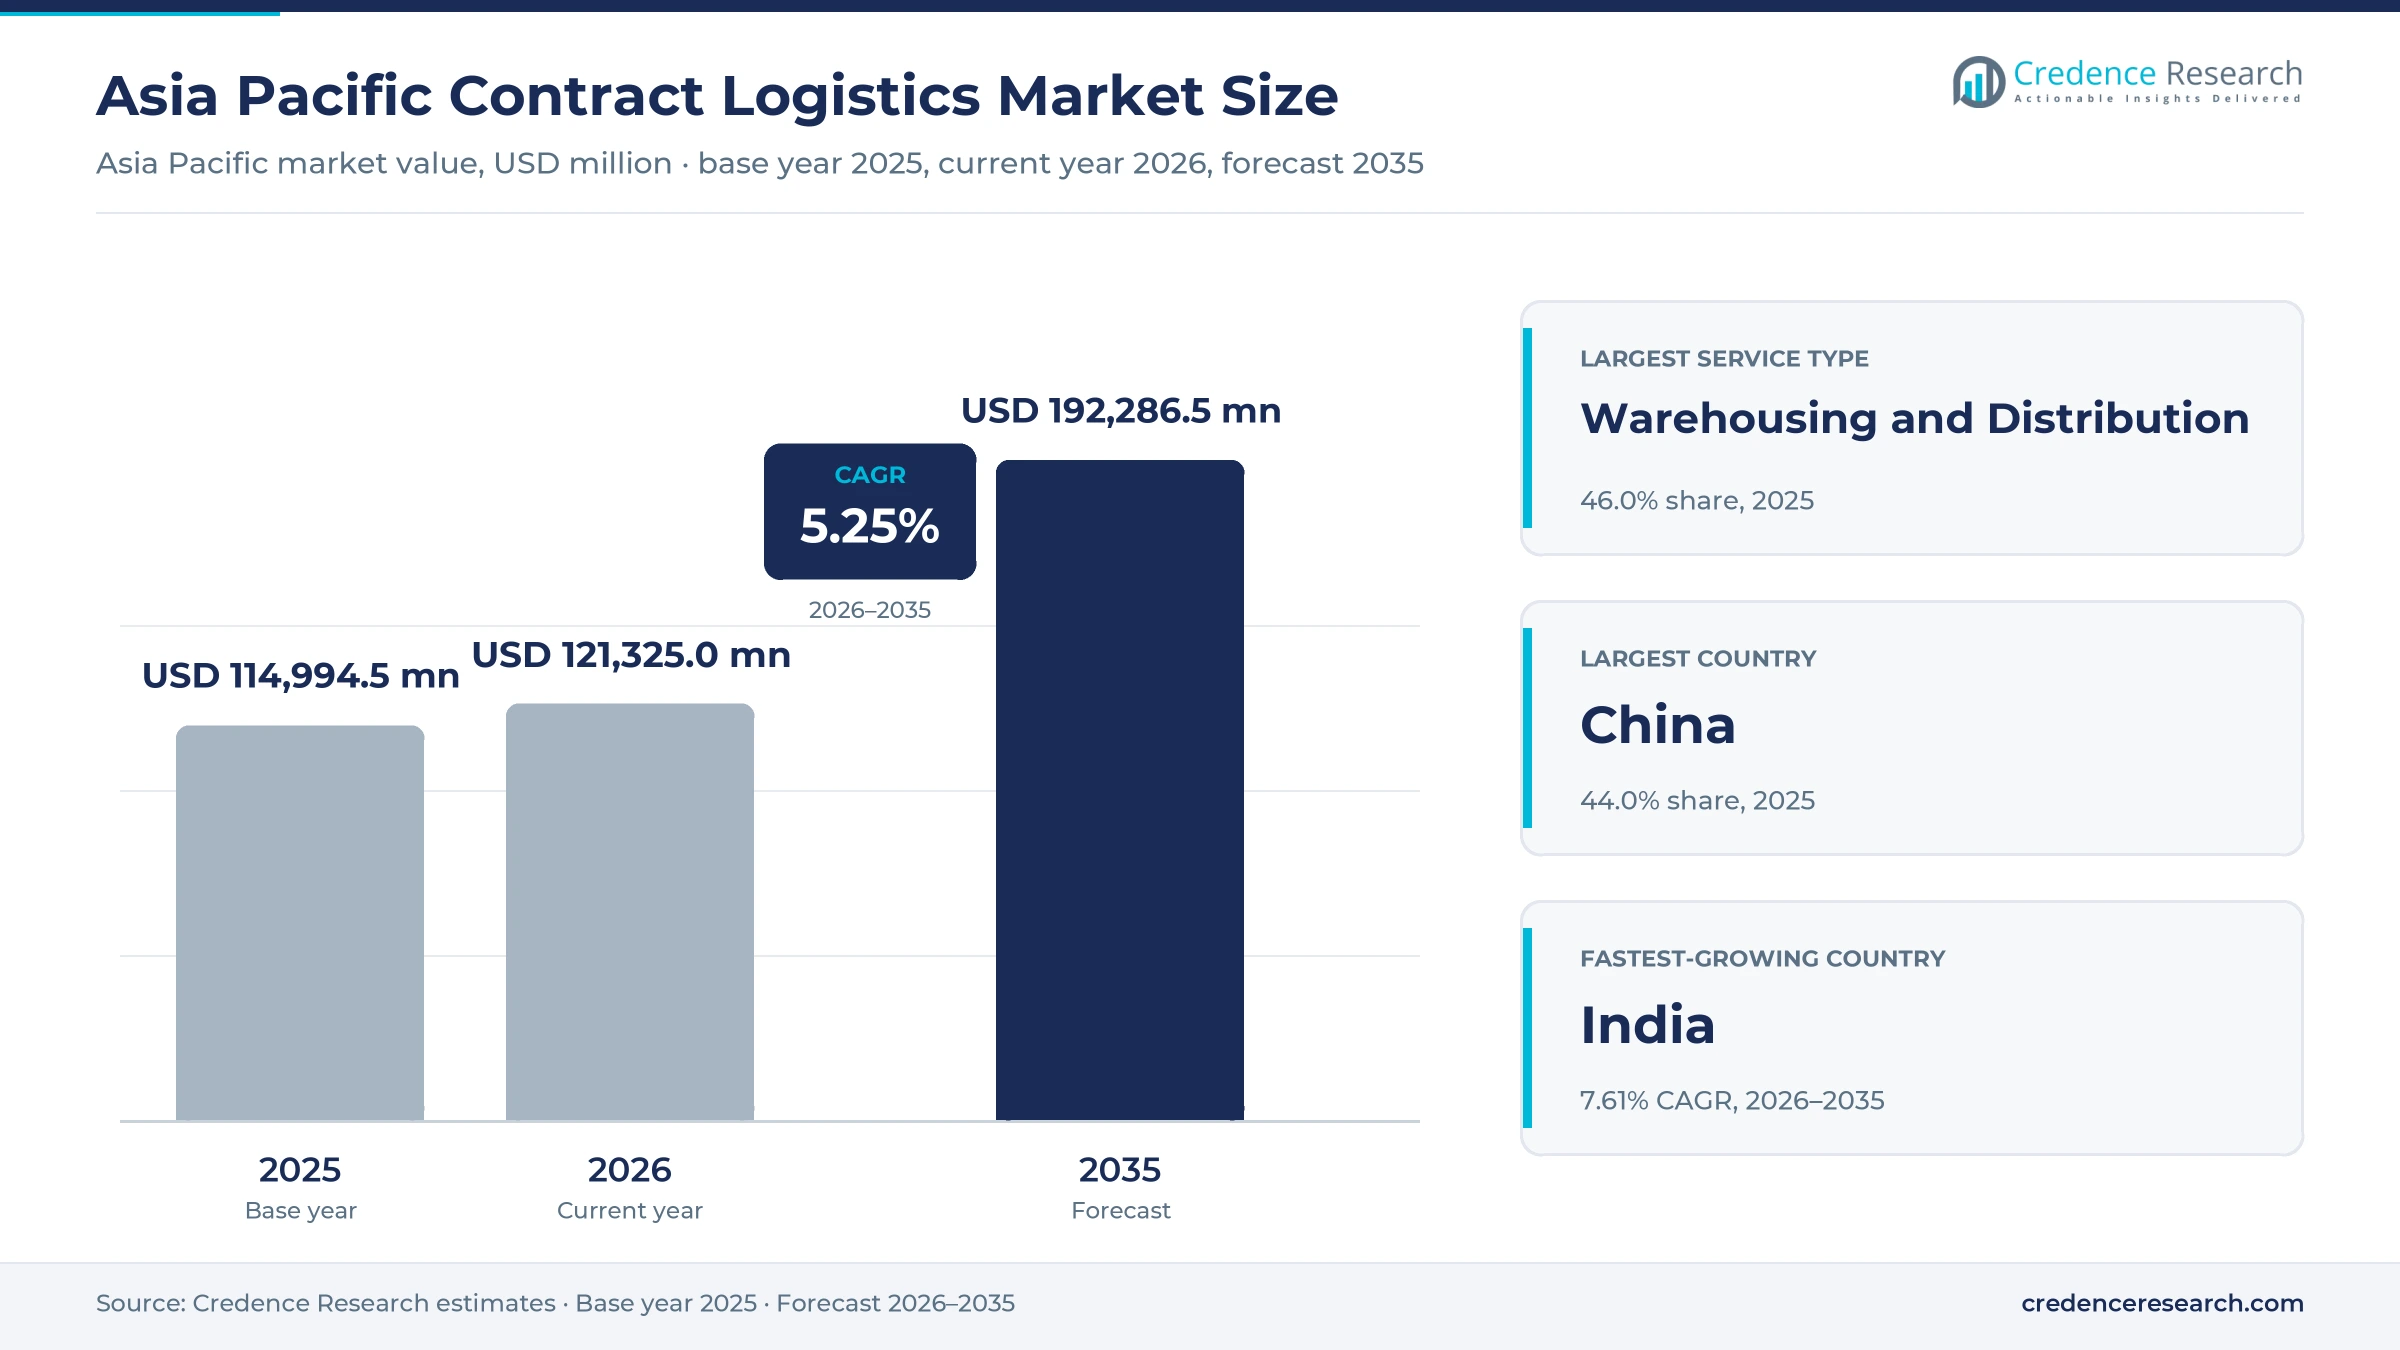
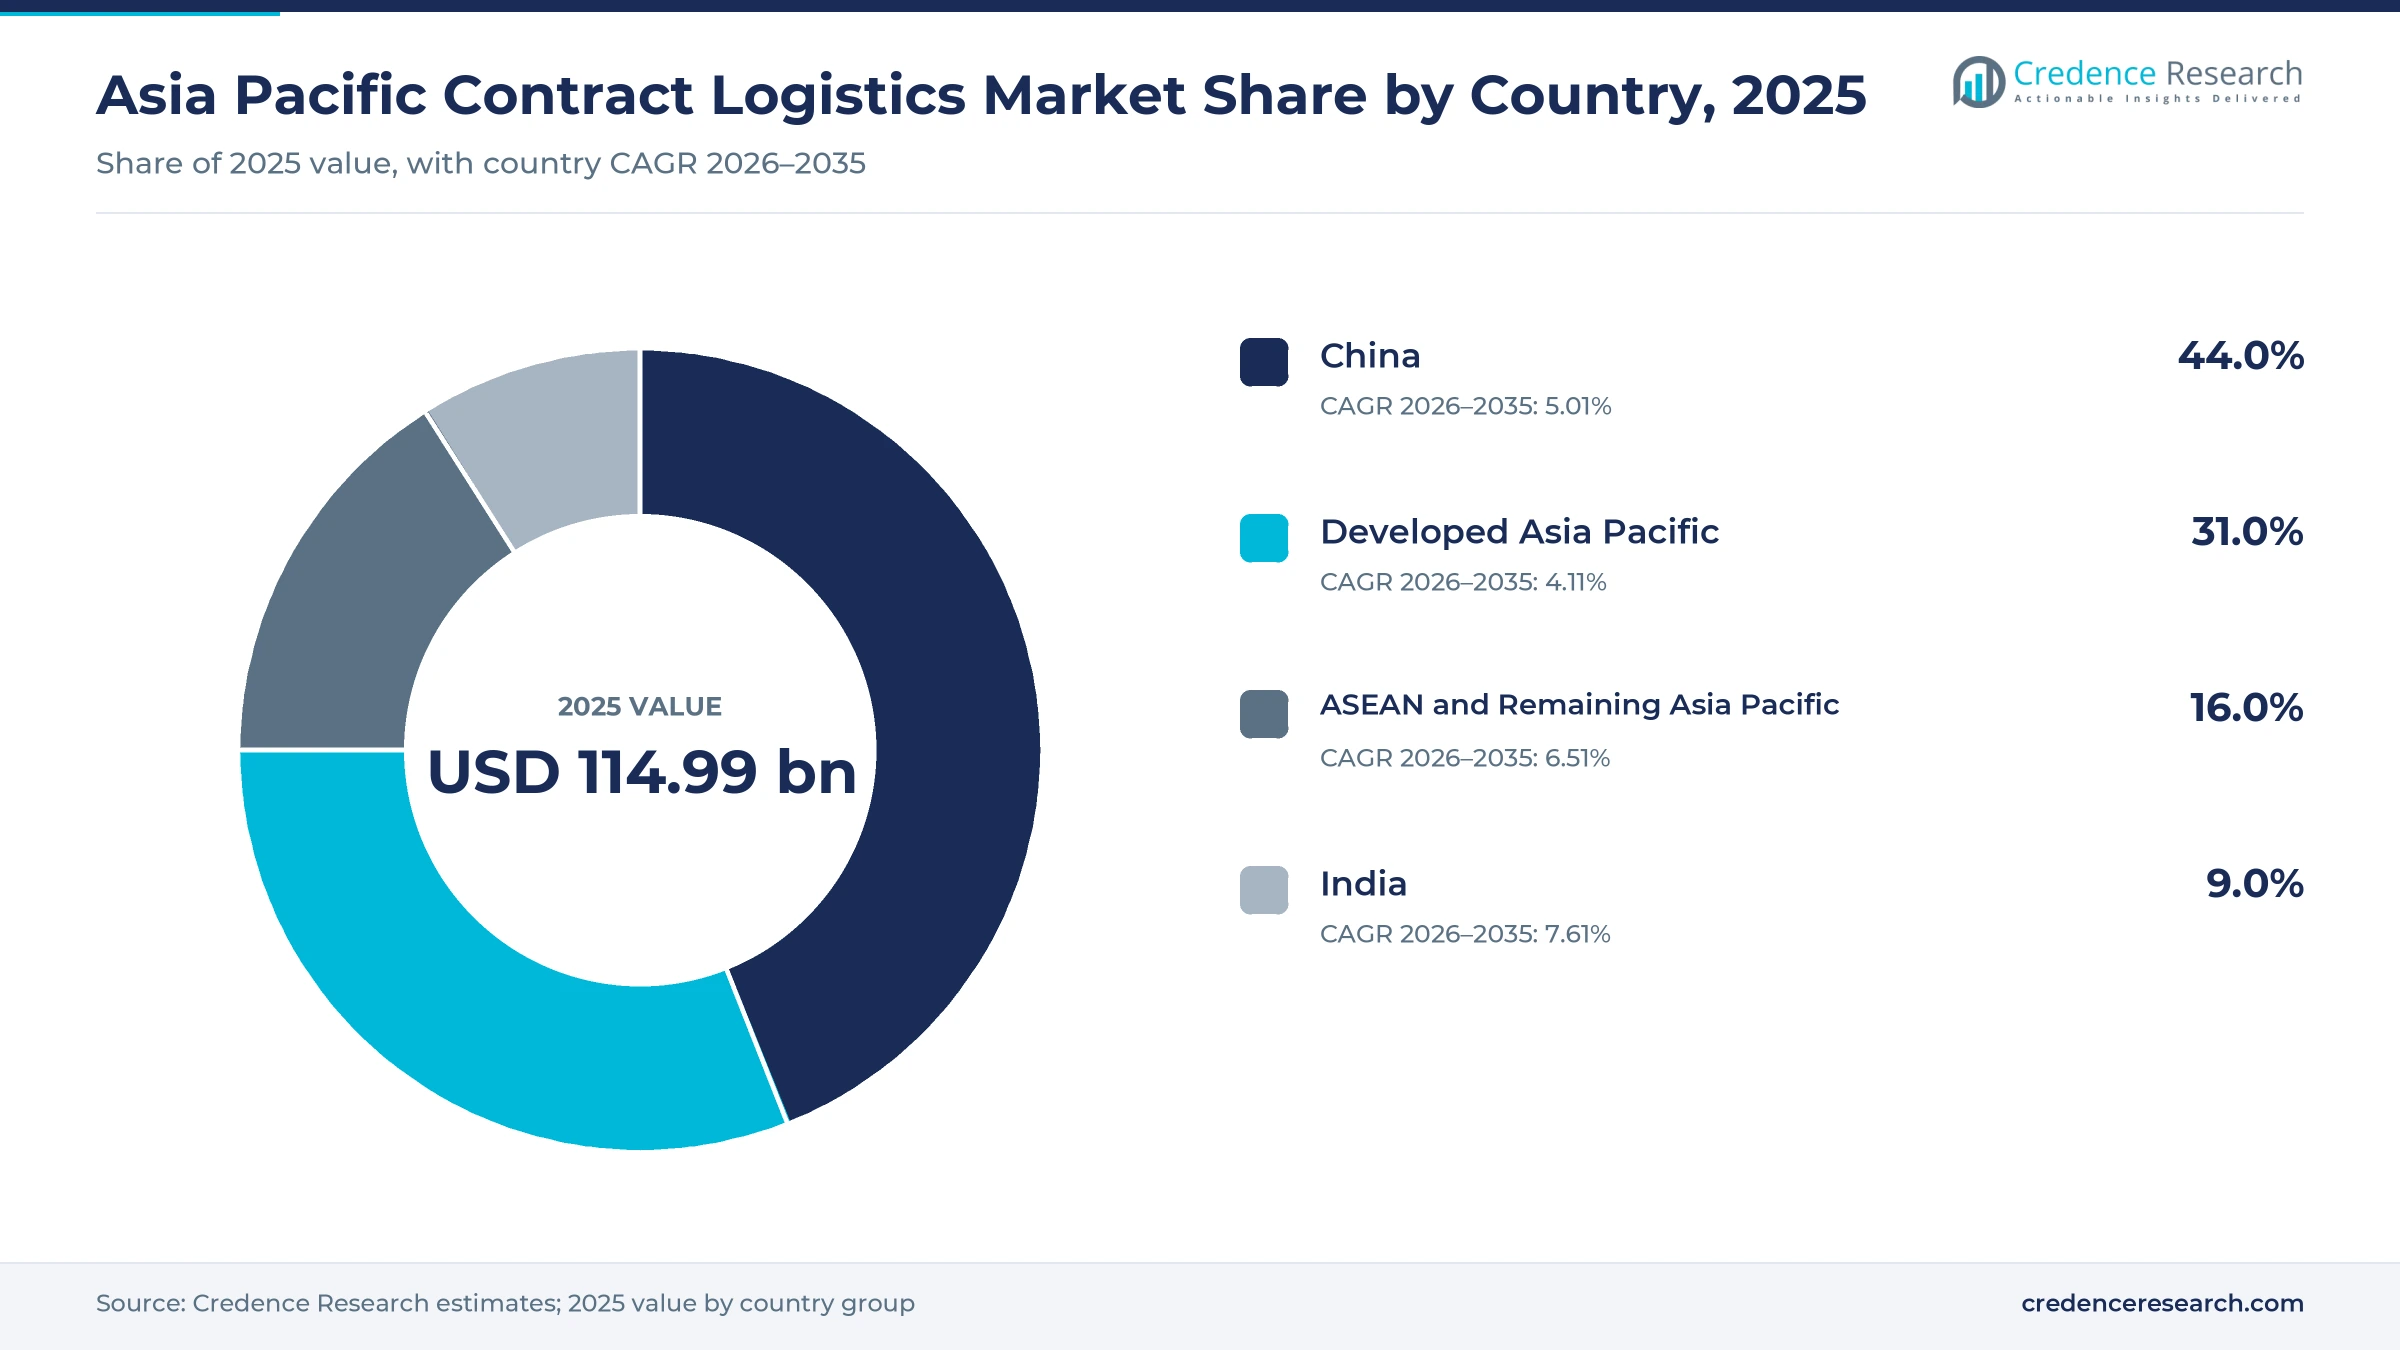
The Asia Pacific contract logistics market was valued at USD 114.99 billion in 2025 and is projected to increase from USD 121.33 billion in 2026 to USD 192.29 billion by 2035, registering a CAGR of 5.25% during 2026–2035. Demand comes from manufacturers, retailers, online platforms and drug makers that hand warehousing, transport planning and value-added work to specialist providers under multi-year agreements. China held the largest share, 44.0% in 2025, because it combines the region's largest factory base with very high parcel volumes. India is the fastest-growing country at 7.61% a year, as electronics assembly, organized retail and online orders expand faster than in mature economies. The provider landscape also changed on April 30, 2025, when DSV completed its acquisition of Schenker and formed a group of close to 160,000 employees in more than 90 countries. As a result, shippers in the region now compare fewer but larger providers with wider multi-country networks.
Which outsourced logistics services are counted?
The estimate measures fees paid to third-party providers for multi-year warehousing and distribution, transportation management, value-added services and aftermarket and reverse logistics in China, India, Developed Asia Pacific and ASEAN and Remaining Asia Pacific. It counts dedicated sites, shared-user sites and lead logistics programs run for manufacturers, retailers, distributors and public-sector bodies.
The estimate excludes spot freight forwarding, standalone parcel delivery bought without a warehousing contract, in-house operations run by shippers and real estate rent paid directly by shippers. The value chain runs from warehouse developers and equipment suppliers through contract providers to the brands that own the goods.
Asia Pacific Contract Logistics Market Insights
- The Asia Pacific contract logistics market was valued at USD 114.99 billion in 2025 and is projected to reach USD 192.29 billion by 2035, registering a CAGR of 5.25% during 2026–2035.
- China held 44.0% of 2025 value, as its express parcel volume rose 13.7% to about 199 billion items in 2025.
- Warehousing and distribution led with 46.0% of 2025 value, because storage, picking and dispatch anchor most outsourcing contracts.
- DHL Group earmarked EUR 500 million in April 2025 for Asia Pacific healthcare logistics by 2030, which lifts validated warehouse capacity.
- JD Logistics doubled its self-operated overseas warehouse area in 2025, which shows Asian providers following their clients abroad.
Warehousing, factory flows and dedicated sites lead value
Why does warehousing lead service value?
Based on service type, the market is categorized into Transportation Management, Warehousing and Distribution, Value-Added Services and Aftermarket and Reverse Logistics. Warehousing and Distribution led with 46.0% of 2025 value, because storage, picking and dispatch form the core of most contracts. Aftermarket and Reverse Logistics grows fastest at 6.24% a year, as electronics and appliance brands outsource repairs, spare parts and returns handling.
Which industries buy the most outsourced services?
Based on end-use industry, the market is categorized into Manufacturing and Automotive, Retail and E-commerce, Consumer Goods and Electronics and Regulated and Specialist Industries. Manufacturing and Automotive led with 33.0% of 2025 value, because plants need steady parts supply and finished vehicle flows. Regulated and Specialist Industries grows fastest at 6.04% a year, as drug makers move pharmaceutical distribution into validated third-party sites.
How do dedicated and shared sites compare?
Based on business model, the market is categorized into Dedicated Operations, Shared-User Operations and Lead Logistics Orchestration. Dedicated Operations led with 52.0% of 2025 value, because large manufacturers and retailers want sites, staff and systems set up only for their own goods. Shared-User Operations grows fastest at 5.79% a year, as mid-sized brands buy pooled space and transport capacity.
Which shippers sign the largest contracts?
Based on customer type, the market is categorized into Manufacturer-Led Shippers, Retailer-Led Shippers, Distributor-Led Shippers and Public-Sector Shippers. Manufacturer-Led Shippers led with 45.0% of 2025 value, because factories outsource both inbound parts and outbound finished goods. Retailer-Led Shippers grows fastest at 5.82% a year, as store chains and online sellers hand peak-season fulfillment to providers with spare capacity.
| Segment Group | Leading Sub-segment | Share, 2025 | Fastest-growing Sub-segment | CAGR, 2026–2035 |
|---|---|---|---|---|
| By Service Type | Warehousing and Distribution | 46.0% | Aftermarket and Reverse Logistics | 6.24% |
| By End-Use Industry | Manufacturing and Automotive | 33.0% | Regulated and Specialist Industries | 6.04% |
| By Business Model | Dedicated Operations | 52.0% | Shared-User Operations | 5.79% |
| By Customer Type | Manufacturer-Led Shippers | 45.0% | Retailer-Led Shippers | 5.82% |
Request a Free Sample
Fill in your details and we'll send you a free sample report.
- Sample data tables & charts
- Research methodology
Parcels, new factories and pharma rules lift outsourcing
How does e-commerce complexity push fulfillment outsourcing?
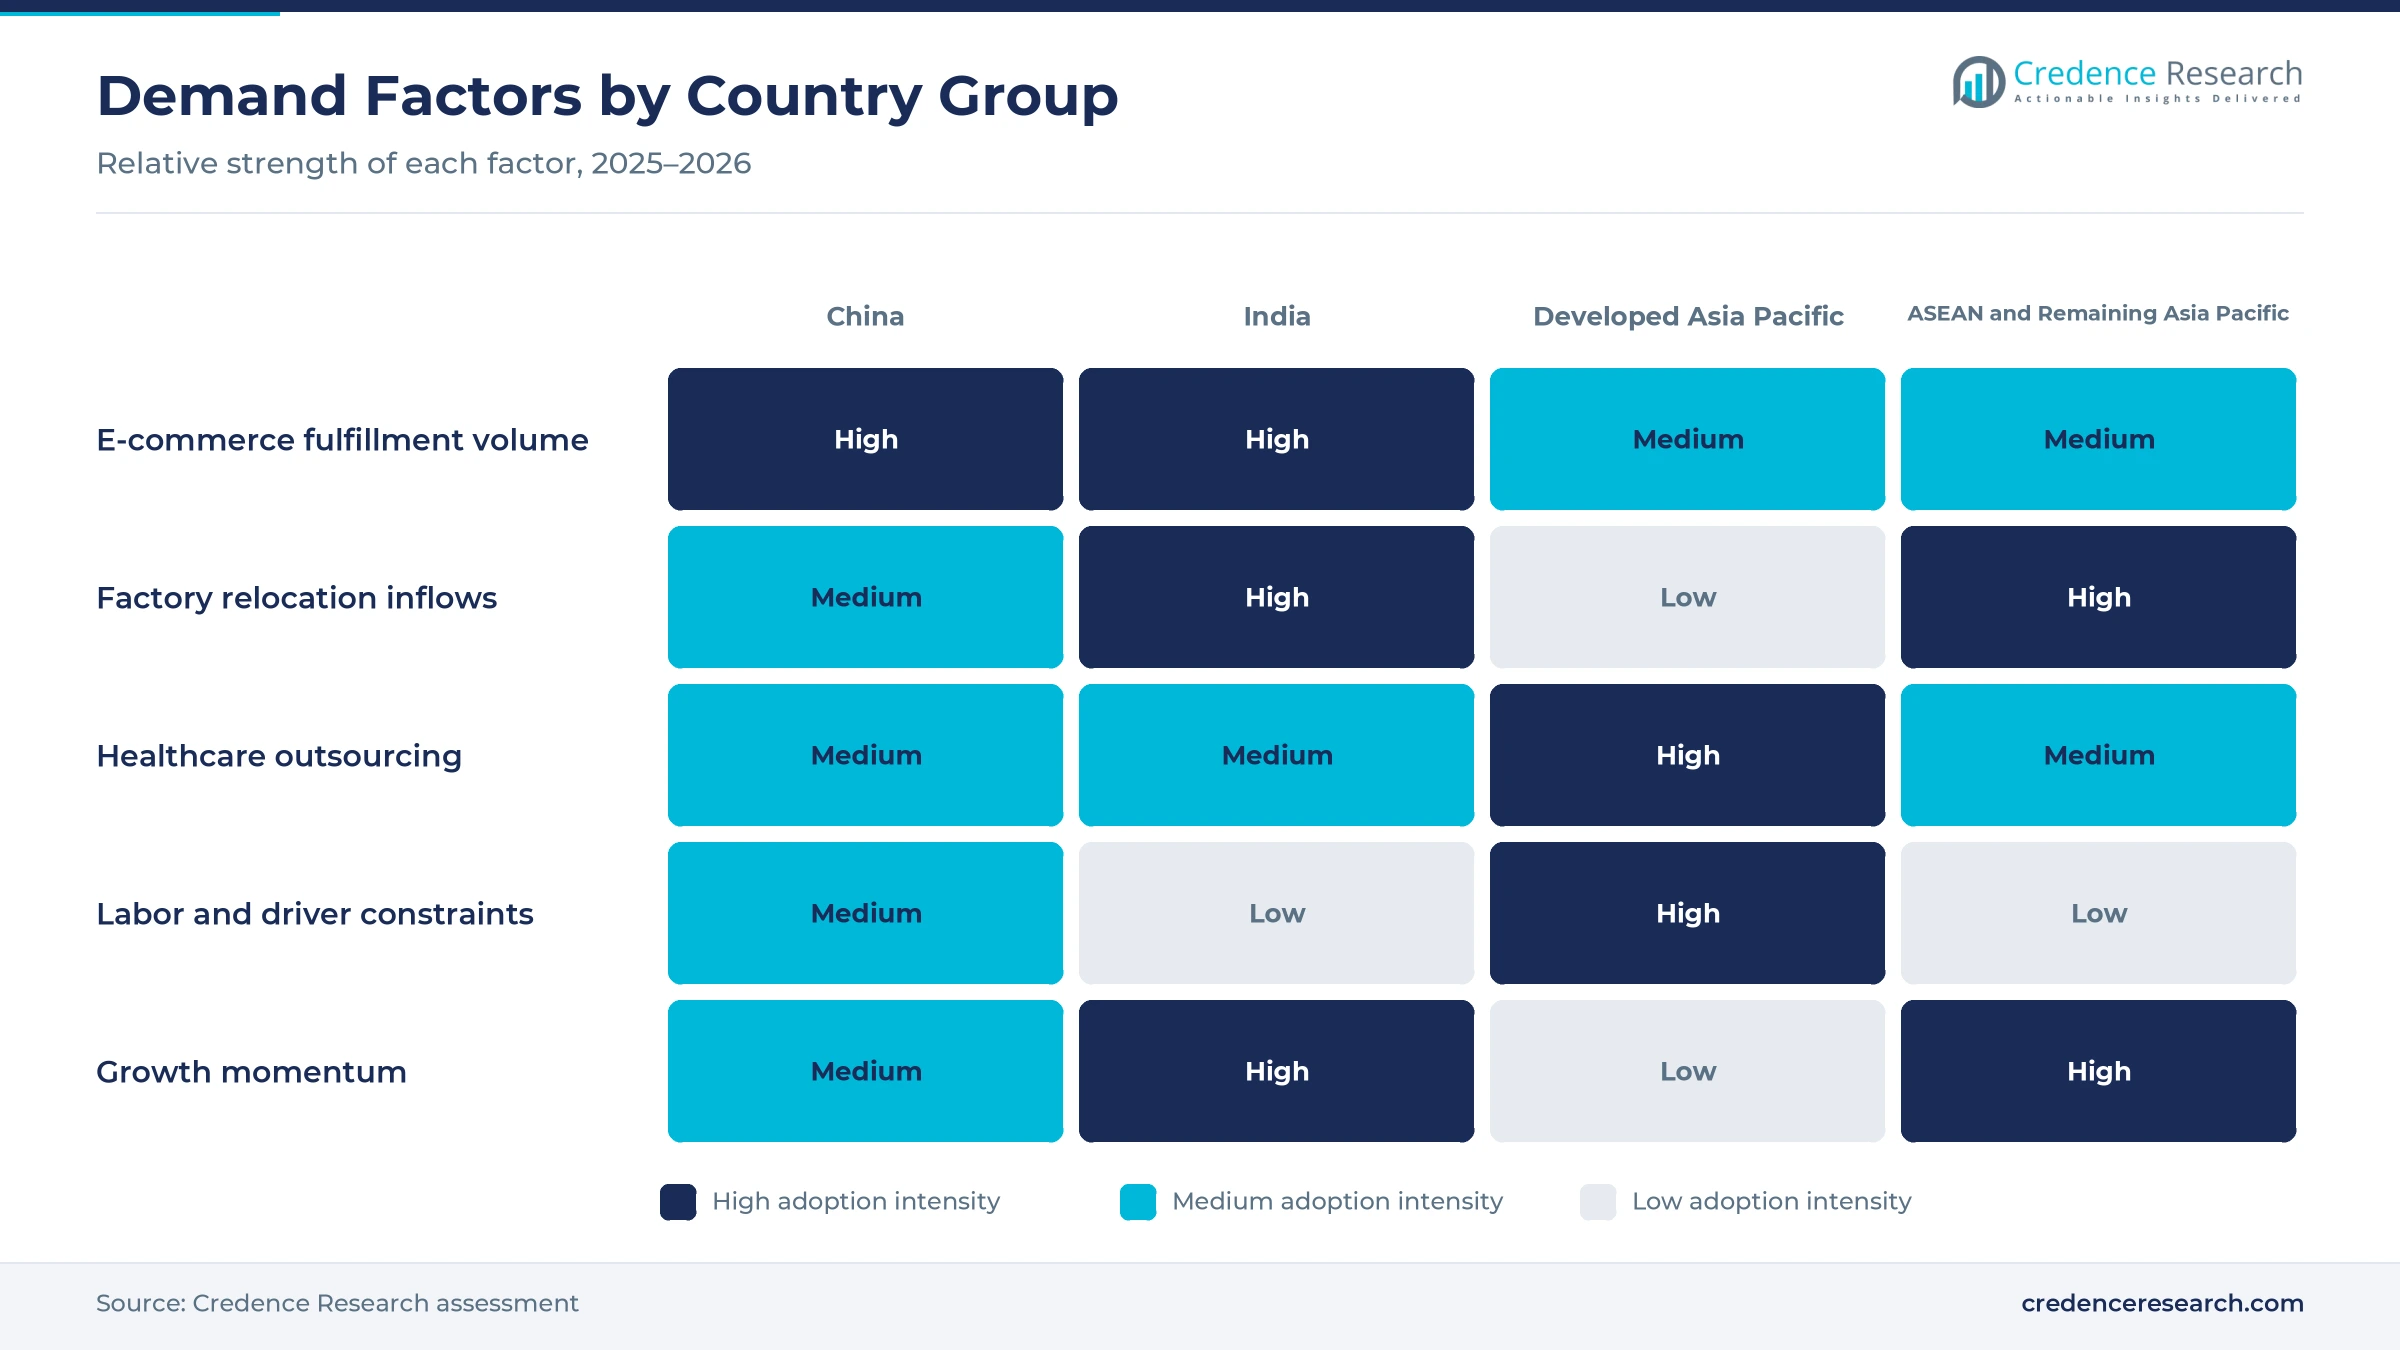
Online retail has turned warehousing into a high-frequency operation with many small orders, and many brands prefer to hand that work to specialist operators. China's online retail sales of physical goods reached 13,092.3 billion yuan in 2025, equal to 26.1% of total retail sales, according to the National Bureau of Statistics of China. The State Post Bureau reported that express parcel volume rose 13.7% to about 199 billion items in 2025, as reported by Asia News Network. In India, Blinkit ran 1,007 dark stores at the end of December 2024 and aimed for 2,000 by December 2025, according to Outlook Business. As a result, warehousing and distribution leads service value with 46.0% of 2025 value.
Why does factory diversification create new contracts?
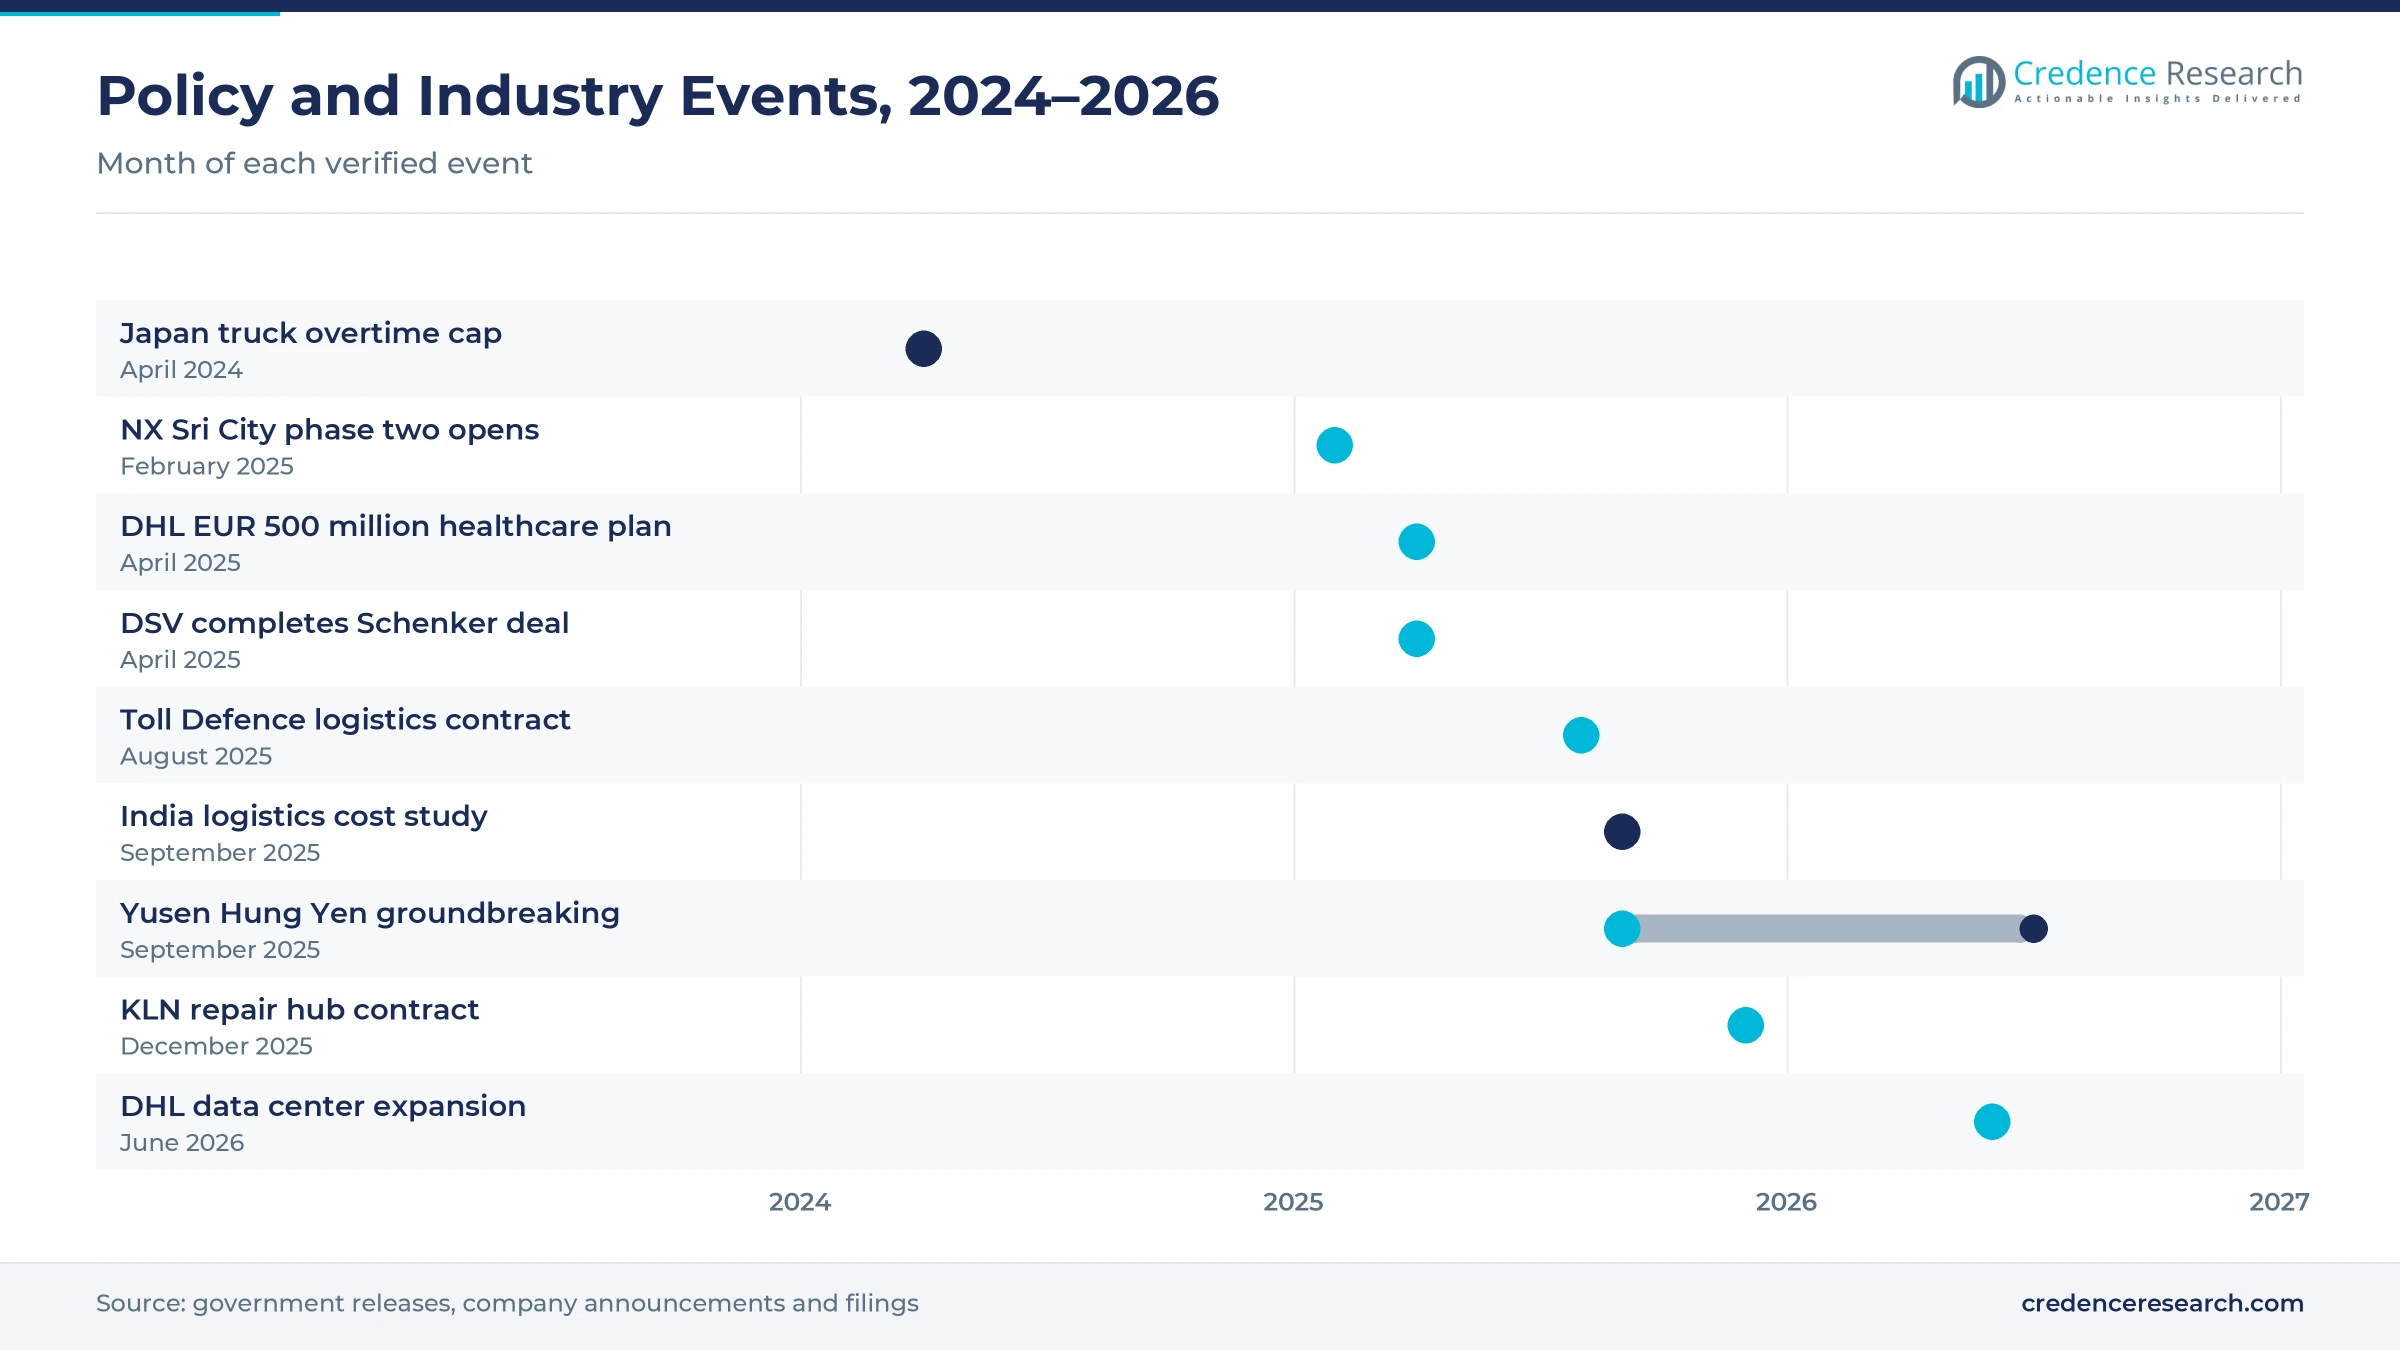
Manufacturers that add plants in India and Southeast Asia need new inbound and outbound networks, and they usually outsource them to providers that already run sites in the host country. Vietnam drew about $38.4 billion of registered foreign direct investment in 2025, with manufacturing and processing taking 59.2% of new and adjusted capital, according to Viet Nam News, citing the National Statistics Office. India's smartphone exports reached a record of about $30 billion in 2025, up about 47%, according to IANS. NX Logistics India opened a second-phase warehouse of about 21,024 square meters at Sri City in February 2025 for mobility and technology customers. Therefore, India's share is set to rise from 9.0% of 2025 value.
How do healthcare quality rules lift outsourced demand?
Drug and device makers increasingly outsource storage and distribution, because good distribution practice rules require validated temperature zones, audit trails and trained staff. DHL Group said on April 7, 2025, that it would invest EUR 500 million in Asia Pacific healthcare logistics by 2030, adding to more than 300,000 square meters of compliant warehousing across 15 countries in the region. DHL Supply Chain then announced a second Singapore pharma hub of over 8,000 square meters with about 7,680 pallet positions in September 2026. India's pharmaceutical exports reached $30.47 billion in 2024-25, up 9.4%, according to IANS, citing the Commerce Secretary. As a result, regulated and specialist industries grow fastest at 6.04% a year.
How do driver limits and cost targets push outsourcing?
Shippers that face driver shortages and high logistics costs often hand transport and storage to providers that can pool volume and plan loads across many customers. Japan capped truck driver overtime at 960 hours a year from April 2024, and a government expert panel warned that freight capacity could fall 14.2% below the fiscal 2019 level without countermeasures, as reported by The Japan News. India's first official estimate put logistics costs at 7.97% of GDP in 2023-24, according to a DPIIT and NCAER study reported by Outlook Business. Both figures push shippers toward providers that fill trucks and share warehouse space more efficiently. Therefore, shared-user operations grow fastest at 5.79% a year among business models.
Robots, repair hubs and overseas warehouses reshape work
How is the rise of goods-to-person robots changing sites?
Providers are shifting from manual pick faces to robot-based goods-to-person systems, because labor is scarce in mature markets and parcel peaks keep rising. JD Logistics said in its 2025 annual results that it ran LangzuTech goods-to-person automated warehouses at more than 20 sites in nearly 20 Chinese cities at the end of 2025. CJ Logistics opened a 20,000-square-meter center in Icheon for Crocs in 2024 that uses more than 50 robotic mini automated guided vehicles and handles up to 50,000 boxes a day, according to Korea JoongAng Daily. DSV and LOGOS also began building the 720,000-square-foot DSV Pearl in Singapore with advanced automation, according to Singapore's Economic Development Board. As a result, dedicated operations keep 52.0% of 2025 value.
Why are repair and returns joining distribution contracts?
Consumer electronics and appliance brands are moving repairs, spare parts and returns into the same contracts that cover outbound distribution, which widens the scope of each deal. KLN won a contract in December 2025 to set up a repair hub of about 15,000 square feet for Arcelik Hitachi in Hong Kong, handling around 800 aftersales delivery orders a month, according to KLN. JD Logistics reported a closed-loop reverse recycling project for a home appliance brand in its 2025 annual results. DHL Supply Chain added rack assembly, functional testing and secure packaging for data center equipment in June 2026. As a result, aftermarket and reverse logistics is the fastest-growing service type at 6.24% a year.
Is white-glove server handling an opening for providers?
Data center construction in Malaysia, Thailand and other markets is creating demand for secure storage, white-glove delivery and rack integration that general warehouses rarely offer. DHL Supply Chain said on June 9, 2026, that it runs more than 30,000 square meters of dedicated data center warehousing in Asia Pacific. The company also committed 130,000 square meters of new capacity over two years, including built-to-suit sites in Malaysia and Thailand. Its services include site surveys, cage management, part-number checks and rack installation, which command higher fees than standard storage. Therefore, ASEAN and Remaining Asia Pacific, which grows at 6.51% a year, gains a high-value specialist niche.
Can overseas warehouses for Asian brands open new demand?
Chinese and Korean brands selling abroad are opening a new client base for providers that can run bonded and overseas warehouses across several countries. JD Logistics said it doubled the area of its self-operated overseas warehouses in 2025, with nearly 200 bonded, direct distribution and overseas warehouses covering nearly 2 million square meters in 25 countries and regions, according to its 2025 annual results. The company opened new warehouses in Vietnam and South Korea during the year. It also served 91,161 external integrated supply chain customers in 2025, up 13.0%. As a result, Chinese providers win more cross-border work and keep the country at the center of regional demand.
Thin margins and uneven country rules test providers
Why are fixed-price agreements under strain?
Contract providers work on thin margins, so wage increases, driver shortages and higher rents at prime warehouse sites quickly erode profit on fixed-price agreements. Modern warehouses near ports and city ring roads are scarce in several large cities, which raises rents when contracts come up for renewal. As a result, providers push for open-book pricing and cost indexation clauses, which lengthen talks with cost-focused shippers. Automation, shared sites and multi-client transport planning help offset part of this pressure.
Why do large acquisitions unsettle customers?
Large deals such as the DSV purchase of Schenker reshape provider networks, but they can unsettle customers while systems, sites and teams are merged. During such integrations, shippers may tender contracts again or split volume between providers to limit their own risk. This means that the acquiring group can lose accounts even as its network grows. Providers that keep account teams stable and publish clear migration plans reduce customer churn during the integration period.
How do differing country rules complicate regional deals?
Customs procedures, labor laws, drug distribution standards and road quality differ widely across the region, so a regional contract rarely runs on a single operating model. Multinational shippers often need separate site designs, compliance files and carrier panels for each country. In turn, regional rollouts take longer, and setup costs are higher than in one domestic market. Providers with local licenses, bonded facilities and standard operating playbooks can reuse more of each design across countries.
Why do in-house networks limit outsourced volume?
Large retailers and online platforms that build their own warehouse and delivery networks reduce the volume they hand to third-party providers. Some of these platform networks also sell spare capacity to outside brands, which adds a new type of rival for traditional providers. As a result, independent providers face price pressure in online fulfillment, especially in China. Specialist skills in healthcare, aftersales and multi-country programs help them defend margins against platform-owned networks.
China leads while India grows fastest to 2035
| Country | Value, 2025 (USD billion) | Share, 2025 | CAGR, 2026–2035 |
|---|---|---|---|
| China | 50.60 | 44.0% | 5.01% |
| Developed Asia Pacific | 35.65 | 31.0% | 4.11% |
| ASEAN and Remaining Asia Pacific | 18.40 | 16.0% | 6.51% |
| India | 10.35 | 9.0% | 7.61% |
Why does China hold the largest share?
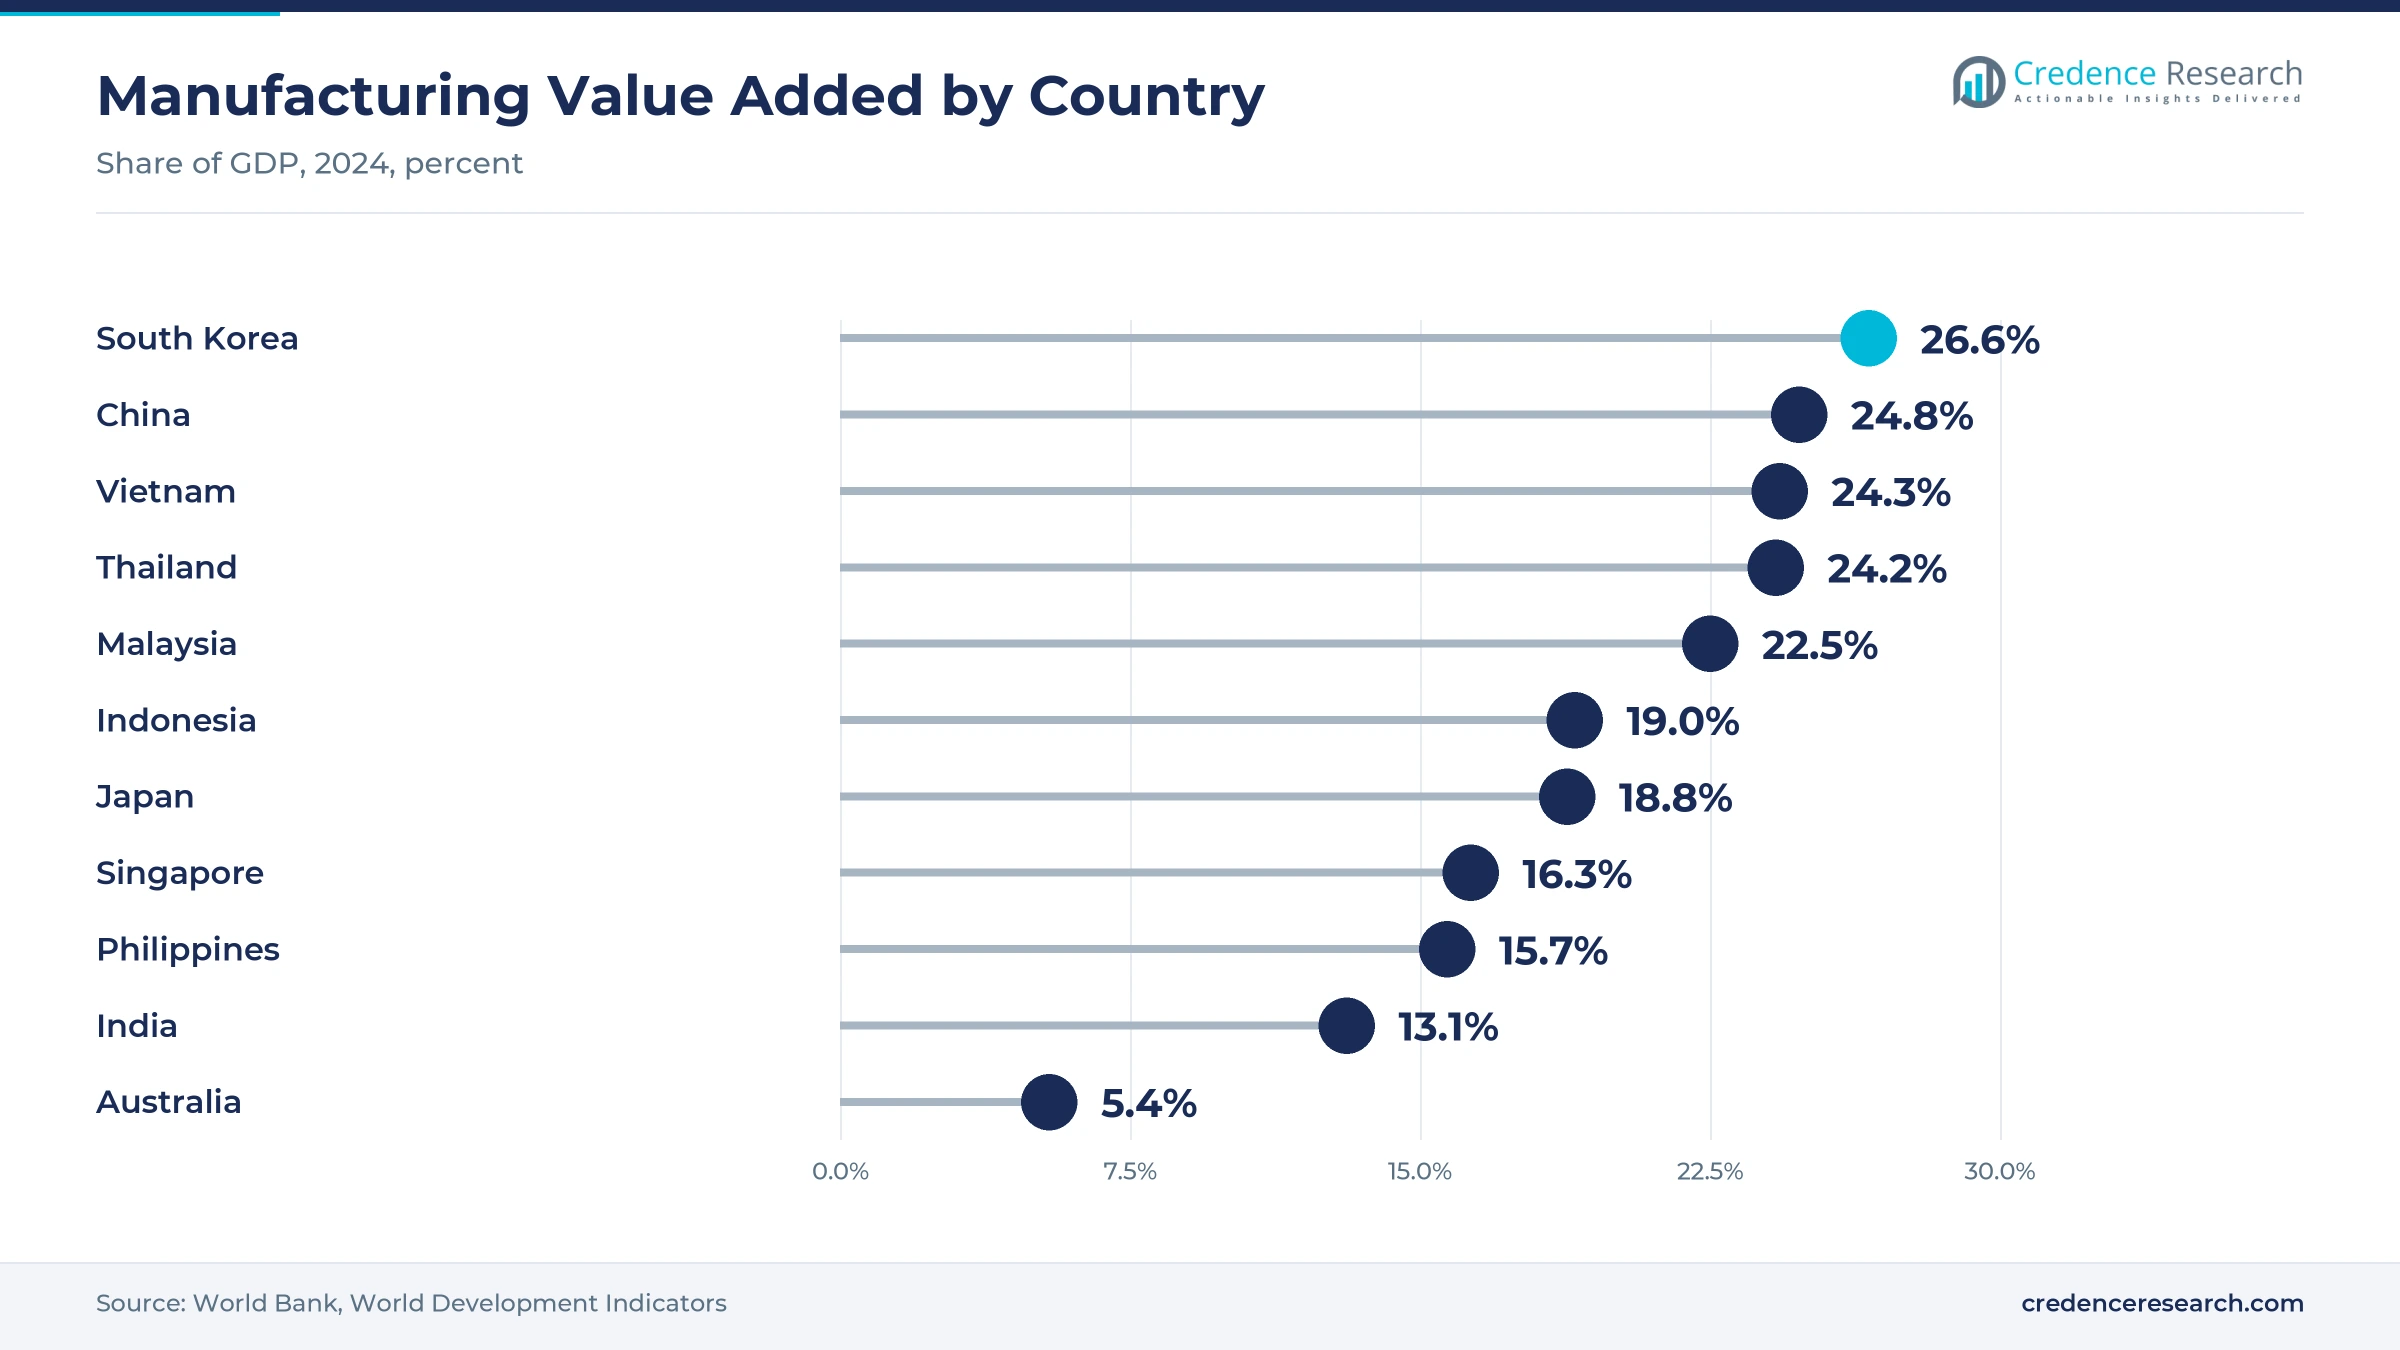
China held 44.0% of 2025 value and grows at 5.01% a year, below the regional rate, as manufacturing's share of its GDP edges down. Manufacturing equaled 24.8% of China's GDP in 2024, according to World Bank data, which keeps inbound production work large. JD Logistics alone ran more than 1,600 self-operated warehouses at the end of 2025. As a result, China combines the region's largest factory base with its most intense parcel and fulfillment demand.
Why do automation and public contracts drive mature markets?
Developed Asia Pacific held 31.0% of 2025 value and grows at 4.11% a year. The group covers Japan, South Korea, Australia, New Zealand, Singapore, Taiwan and Hong Kong in this report. Outsourcing is already widespread here, so growth comes from automation, healthcare hubs and public contracts. Toll Group was named partner for a Department of Defence logistics contract covering 18 main sites and 38 support warehouses in August 2025, while retailers rely on Australian online order fulfillment specialists.
How do new plants in Vietnam and Malaysia add demand?
ASEAN and Remaining Asia Pacific held 16.0% of 2025 value and grows at 6.51% a year, the second-fastest rate in the region. Vietnam, Malaysia, Thailand and Indonesia attract new electronics and component plants, and Vietnam disbursed about $27.6 billion of foreign direct investment in 2025, a five-year high. Yusen Logistics broke ground on an 18,634-square-meter center in Hung Yen in September 2025, with operations due from July 2026. These new sites serve plants in nearby industrial zones with co-packing, labeling and nationwide distribution.
Why is India growing fastest in the region?
India held 9.0% of 2025 value and grows fastest at 7.61% a year, well above the regional rate. A rising factory base, a national push to cut logistics costs and fast growth in online retail all lift outsourced demand. CEVA Logistics opened a corporate office in Mumbai in 2025 to run its Indian subcontinent operations, where it employs nearly 10,000 people. NX Logistics India also expanded at Sri City, which deepens the pool of third-party providers in India serving global shippers.
Warehouse openings and large contracts from 2025 to 2026
| Development | Status and market relevance |
|---|---|
| In February 2025, NX Logistics India opened the second phase of its Sri City Logistics Center in Andhra Pradesh. | About 21,024 square meters for mobility and technology customers |
| In August 2025, Toll Group was named partner for a Department of Defence logistics contract in Australia. | Covers warehousing at 18 main sites and 38 support warehouses |
| In September 2025, Yusen Logistics broke ground on a new logistics center in Hung Yen, northern Vietnam. | An 18,634-square-meter warehouse due to start operations in July 2026 |
| In December 2025, KLN won a contract to set up a repair hub for Arcelik Hitachi in Hong Kong. | Adds aftersales delivery, installation and warehousing services |
| In June 2026, DHL Supply Chain expanded data center logistics capacity across Asia Pacific. | Plans 130,000 square meters more, including sites in Malaysia and Thailand |
Robots, unmanned vehicles and control towers spread
- Goods-to-person systems bring shelves or totes to pickers, and they connect with warehouse robots that sort and pack orders at peak times.
- Unmanned vehicles move parcels between stations and delivery zones, and JD Logistics said more than 1,000 were in regular operation in 2025.
- Control towers give lead logistics teams one view of carriers, sites and orders across several countries, which supports faster decisions when lanes are disrupted.
- Validated temperature zones let healthcare warehouses hold products at 15 to 25 degrees Celsius with humidity control, which meets good distribution practice audits.
Need a Custom Version of This Report?
Tailor the scope, geography, or segments to your exact requirements.
- Custom geography or segment scope
- Direct access to our analyst team
Global networks and Asian specialists compete on reach
Competition combines global networks with Asian specialists that know local customers and labor markets. DHL Supply Chain competes on healthcare and data center capability and is adding pharma hubs in Singapore. JD Logistics brings platform scale in China and a growing overseas warehouse network. KLN Logistics Group pairs contract operations with aftersales services in Hong Kong. Nippon Express Holdings and Yusen Logistics follow Japanese manufacturers into India and Vietnam with new built-for-purpose sites. CJ Logistics automates fulfillment in South Korea, while CEVA Logistics is expanding its Indian base. DSV is integrating Schenker and building a large automated site in Singapore with LOGOS. Toll Group serves Australian public and private shippers, and GEODIS expanded in Singapore, Malaysia and Australia through its Keppel Logistics purchase. Providers compete on site quality, automation, sector compliance and the ability to run one program across several countries.
Companies profiled and their roles in this market
| Company | Type | Role in the market |
|---|---|---|
| DHL Supply Chain | Global contract provider | Announced a second Singapore pharma hub in September 2026 and data center sites in Malaysia and Thailand |
| JD Logistics | Platform-backed provider | Ran more than 1,600 self-operated warehouses and opened sites in Vietnam and South Korea in 2025 |
| KLN Logistics Group | Regional contract provider | Won a repair hub and aftersales contract for Arcelik Hitachi in Hong Kong in December 2025 |
| Nippon Express Holdings | Japanese logistics group | NX Logistics India opened its Sri City second-phase warehouse in February 2025 |
| CJ Logistics | Korean logistics group | Runs a robot-equipped 20,000-square-meter Icheon center for Crocs |
| CEVA Logistics | Global contract provider | Opened a Mumbai corporate office in 2025 with nearly 10,000 staff in India |
| Yusen Logistics | Japanese logistics group | Broke ground on an 18,634-square-meter Hung Yen center in September 2025 |
| DSV | Global logistics group | Completed the Schenker deal in April 2025 and is building DSV Pearl in Singapore with LOGOS |
| Toll Group | Australian logistics group | Named partner for a Department of Defence logistics contract covering 18 main sites and 38 support warehouses in August 2025 |
| GEODIS | Global contract provider | Added about 200,000 square meters of warehouse space through Keppel Logistics in Singapore, Malaysia and Australia |
Credence Research view on multi-country outsourcing
Credence Research's view is that Asia Pacific contract logistics value will grow on supply chain complexity rather than on volume alone. China remains the anchor because of its factory base and parcel flows, while India adds the most new demand as electronics assembly and organized retail expand. Healthcare, data center and aftersales programs carry higher fees and longer contracts than general storage. Providers that combine automation, sector compliance and a multi-country footprint are best placed as shippers consolidate their provider panels.
How the regional estimate was built
The report uses 2025 as the base year and presents market values in USD billion through 2035. Market values come from the Credence Research model, and country, service type, end-use industry, business model and customer type splits are Credence Research estimates. Country shares were set from World Bank manufacturing value added, national parcel and online retail statistics and the maturity of outsourcing in each group. Inputs also include government releases, stock exchange filings, company announcements and national media reports. No interviews or surveys were used in preparing these estimates.
India, healthcare and aftersales lead growth to 2035
The Asia Pacific contract logistics market is expected to reach USD 192.29 billion by 2035, a 5.25% CAGR during 2026–2035, as shippers outsource more complex warehousing, transport and aftersales work. India should gain the most share, while China stays the largest country market. Regulated industries, shared-user sites and repair and returns services are expected to grow faster than the regional average. Weaker trade, platform insourcing or rising labor costs would lower this outlook, while faster factory relocation and stricter drug distribution rules would raise it.
Frequently Asked Questions
How big is the Asia Pacific contract logistics market?
Which country leads regional demand?
Which country grows fastest?
Which service type holds the largest share?
Which service type grows fastest?
Why is healthcare demand rising?
Which business model leads the market?
Who are the main companies in the market?
Table of Content
Chapter 1 Market Segmentation
- 1.1 Segmentation Framework
- 1.1.1 Product and Service Classification
- 1.1.2 Application and End-Use Classification
- 1.1.3 Technology and Solution Classification
- 1.1.4 Customer and Distribution Channel Classification
- 1.1.5 Geographic Segmentation
- 1.1.6 Market Segment Definitions and Boundaries
- 1.2 By Service Type
- 1.2.1 Warehousing and Distribution
- 1.2.2 Transportation Management
- 1.2.3 Value-Added Services
- 1.2.4 Aftermarket and Reverse Logistics
- 1.3 By End-Use Industry
- 1.3.1 Manufacturing and Automotive
- 1.3.2 Retail and E-commerce
- 1.3.3 Consumer Goods and Electronics
- 1.3.4 Regulated and Specialist Industries
- 1.4 By Business Model
- 1.4.1 Dedicated Operations
- 1.4.2 Shared-User Operations
- 1.4.3 Lead Logistics Orchestration
- 1.5 By Customer Type
- 1.5.1 Manufacturer-Led Shippers
- 1.5.2 Retailer-Led Shippers
- 1.5.3 Distributor-Led Shippers
- 1.5.4 Public-Sector Shippers
- 1.6 By Country
- 1.6.1 China
- 1.6.2 India
- 1.6.3 Developed Asia Pacific
- 1.6.4 ASEAN and Remaining Asia Pacific
Chapter 2 Introduction
- 2.1 Report Objectives and Scope
- 2.2 Product Definition and Industry Terminology
- 2.3 Market Inclusions and Exclusions
- 2.4 Research Process
- 2.4.1 Primary Research and Expert Interviews
- 2.4.2 Secondary Research and Source Review
- 2.4.3 Top-Down and Bottom-Up Estimation
- 2.4.4 Data Triangulation and Verification
- 2.5 Market Size Measurement Basis
- 2.5.1 2025: USD 114.99 billion → 2035: USD 192.29 billion
- 2.6 Historical and Forecast Reference Periods
- 2.6.1 Historical Period: 2018-2025
- 2.6.2 Base Year: 2025
- 2.6.3 Forecast Period: 2025-2035
- 2.7 Research Assumptions and Limitations
Chapter 3 Executive Summary
- 3.1 Market Snapshot and Key Findings
- 3.2 Base-Year Market Size, 2025
- 3.3 Forecast Market Size, 2035
- 3.4 Revenue and Volume Growth Outlook
- 3.5 Key Demand and Supply Indicators
- 3.6 Leading Market Segments
- 3.7 Fastest-Growing Market Opportunities
- 3.8 Regional Performance Highlights
- 3.9 Technology and Industry Transformation
- 3.10 Competitive Landscape Summary
- 3.11 Analyst View and Strategic Implications
Chapter 4 Asia Pacific Contract Logistics Market Trends and Developments
- 4.1 Historical Industry Development, 2018-2025
- 4.2 Recent Market Trends and Developments
- 4.3 Demand and Customer Behavior Trends
- 4.4 Technology and Product Innovation
- 4.5 Artificial Intelligence, Automation and Digitalization
- 4.6 Local Manufacturing and Supply Chain Realignment
- 4.7 Industry Partnerships, Mergers and Acquisitions
- 4.8 Sustainability and Circular Economy Developments
- 4.9 Government and Private Sector Investment Trends
- 4.10 Emerging Business Models and Commercialization
- 4.11 Industry Developments and Announcements
Chapter 5 Asia Pacific Contract Logistics Market Production, Supply and Demand Analysis
- 5.1 Demand Trend and Consumption Analysis, 2018-2025
- 5.2 Demand Forecast, 2025-2035
- 5.3 Production and Output Trend, 2018-2025
- 5.4 Production and Output Forecast, 2025-2035
- 5.5 Installed Capacity and Capacity Utilization
- 5.6 Company-Wise Production Plants and Statistics
- 5.6.1 Installed Production Capacity
- 5.6.2 Actual Production
- 5.6.3 Planned Capacity and Expansion Targets
- 5.7 Supply Chain Structure and Procurement Trends
- 5.8 Supply-Demand Gap and Bottlenecks
- 5.9 Import Dependence and Sourcing Structure
- 5.10 Contract Manufacturing and Outsourcing
- 5.11 Regional Supply and Demand Concentration
Chapter 6 Asia Pacific Contract Logistics Market Pricing Analysis
- 6.1 Pricing Structure and Measurement
- 6.2 Historical Pricing Trends, 2018-2025
- 6.3 Pricing Outlook, 2025-2035
- 6.4 Average Selling Price and Unit Economics
- 6.5 Pricing by Product and Market Segment
- 6.6 Geographic Pricing Differences
- 6.7 Key Input, Energy, Labor and Logistics Costs
- 6.8 Contract Pricing and Purchasing Models
- 6.9 Pricing Sensitivity and Competitive Positioning
- 6.10 Price, Margin and Profitability Implications
Chapter 7 Asia Pacific Contract Logistics Market Dynamics
- 7.1 Market Growth Drivers
- 7.1.1 Demand-Side Drivers
- 7.1.2 Technology and Innovation Drivers
- 7.1.3 Infrastructure and Investment Drivers
- 7.1.4 Regulatory and Policy Drivers
- 7.2 Market Restraints
- 7.2.1 Cost and Affordability Constraints
- 7.2.2 Technology and Adoption Barriers
- 7.2.3 Supply Chain and Operational Constraints
- 7.3 Market Challenges
- 7.3.1 Competitive Pressure and Margin Erosion
- 7.3.2 Skills, Infrastructure and Implementation Gaps
- 7.4 Emerging Market Opportunities
- 7.5 Market Dynamics Impact and Time-Horizon Assessment
Chapter 8 Asia Pacific Contract Logistics Value Chain Analysis
- 8.1 Industry Value Chain Overview
- 8.2 Upstream Suppliers and Critical Inputs
- 8.3 Technology and Component Providers
- 8.4 Manufacturing or Service Delivery
- 8.5 Distribution, Channel Partners and Integrators
- 8.6 Downstream Applications and End Users
- 8.7 Value Addition and Profit Pools
- 8.8 Vertical Integration and Outsourcing
- 8.9 Supplier Concentration and Risk
- 8.10 Supply Chain Localization and Resilience
Chapter 9 Asia Pacific Contract Logistics Market Regulations and Policies
- 9.1 Relevant Laws, Standards and Compliance Frameworks
- 9.2 Product, Service, Safety and Quality Requirements
- 9.3 Government Policies, Incentives and Subsidies
- 9.4 Imports, Exports and Trade Barriers
- 9.5 Public Procurement and Local Content Requirements
- 9.6 Environmental and Sustainability Compliance
- 9.7 Upcoming Policy Changes and Market Implications
Chapter 10 Asia Pacific Contract Logistics Market Hotspots and Opportunities
- 10.1 Market Opportunity Mapping and Growth Hotspots
- 10.2 High-Growth Applications and Customer Groups
- 10.3 Underserved Markets and White-Space Opportunities
- 10.4 Emerging Technology and Product Opportunities
- 10.5 New Capacity and Investment Hotspots
- 10.6 Market Entry and Expansion Opportunities
- 10.7 Distribution and Partnership Opportunities
- 10.8 Near-Term and Long-Term Commercial Potential
- 10.9 Opportunity Attractiveness and Execution Risks
Chapter 11 Asia Pacific Contract Logistics Market Outlook, 2025-2035
- 11.1 Market Size and Analysis
- 11.1.1 Revenue (Market Measurement: 2025: USD 114.99 billion → 2035: USD 192.29 billion)
- 11.1.2 Market Volume and Quantity Sold
- 11.1.3 Historical Market Size, 2018-2025
- 11.1.4 Base-Year Market Size, 2025
- 11.2 Market Forecast, 2025-2035
- 11.2.1 Revenue Forecast to 2035
- 11.2.2 Volume Forecast to 2035
- 11.2.3 CAGR and Year-on-Year Growth
- 11.2.4 Incremental Revenue Opportunity
- 11.3 Forecast Assumptions and Scenario Analysis
- 11.3.1 Base-Case Forecast
- 11.3.2 Optimistic and Conservative Scenarios
- 11.3.3 Technology, Pricing and Policy Sensitivities
- 11.4 Market Attractiveness and Growth Outlook
Chapter 12 Asia Pacific Contract Logistics Market Segmentation and Outlook
- 12.1 Segmentation Summary and Market Shares, 2025
- 12.2 Largest and Fastest-Growing Segments
- 12.3 By Service Type - Market Size and Forecast, 2025-2035
- 12.3.1 Segment Definition and Scope
- 12.3.2 Historical Market Size, 2018-2025
- 12.3.3 Revenue Forecast, 2025-2035
- 12.3.4 Volume Forecast, 2025-2035
- 12.3.5 Base-Year Market Share, 2025
- 12.3.6 Segment CAGR and Growth Drivers
- 12.3.7 Subsegment Market Size and Forecast
- 12.3.7.1 Warehousing and Distribution
- 12.3.7.2 Transportation Management
- 12.3.7.3 Value-Added Services
- 12.3.7.4 Aftermarket and Reverse Logistics
- 12.3.8 Subsegment Pricing and Adoption Trends
- 12.3.9 Leading Suppliers and Competition
- 12.3.10 Regional Demand and Opportunities
- 12.4 By End-Use Industry - Market Size and Forecast, 2025-2035
- 12.4.1 Segment Definition and Scope
- 12.4.2 Historical Market Size, 2018-2025
- 12.4.3 Revenue Forecast, 2025-2035
- 12.4.4 Volume Forecast, 2025-2035
- 12.4.5 Base-Year Market Share, 2025
- 12.4.6 Segment CAGR and Growth Drivers
- 12.4.7 Subsegment Market Size and Forecast
- 12.4.7.1 Manufacturing and Automotive
- 12.4.7.2 Retail and E-commerce
- 12.4.7.3 Consumer Goods and Electronics
- 12.4.7.4 Regulated and Specialist Industries
- 12.4.8 Subsegment Pricing and Adoption Trends
- 12.4.9 Leading Suppliers and Competition
- 12.4.10 Regional Demand and Opportunities
- 12.5 By Business Model - Market Size and Forecast, 2025-2035
- 12.5.1 Segment Definition and Scope
- 12.5.2 Historical Market Size, 2018-2025
- 12.5.3 Revenue Forecast, 2025-2035
- 12.5.4 Volume Forecast, 2025-2035
- 12.5.5 Base-Year Market Share, 2025
- 12.5.6 Segment CAGR and Growth Drivers
- 12.5.7 Subsegment Market Size and Forecast
- 12.5.7.1 Dedicated Operations
- 12.5.7.2 Shared-User Operations
- 12.5.7.3 Lead Logistics Orchestration
- 12.5.8 Subsegment Pricing and Adoption Trends
- 12.5.9 Leading Suppliers and Competition
- 12.5.10 Regional Demand and Opportunities
- 12.6 By Customer Type - Market Size and Forecast, 2025-2035
- 12.6.1 Segment Definition and Scope
- 12.6.2 Historical Market Size, 2018-2025
- 12.6.3 Revenue Forecast, 2025-2035
- 12.6.4 Volume Forecast, 2025-2035
- 12.6.5 Base-Year Market Share, 2025
- 12.6.6 Segment CAGR and Growth Drivers
- 12.6.7 Subsegment Market Size and Forecast
- 12.6.7.1 Manufacturer-Led Shippers
- 12.6.7.2 Retailer-Led Shippers
- 12.6.7.3 Distributor-Led Shippers
- 12.6.7.4 Public-Sector Shippers
- 12.6.8 Subsegment Pricing and Adoption Trends
- 12.6.9 Leading Suppliers and Competition
- 12.6.10 Regional Demand and Opportunities
- 12.7 By Country - Market Size and Forecast, 2025-2035
- 12.7.1 Segment Definition and Scope
- 12.7.2 Historical Market Size, 2018-2025
- 12.7.3 Revenue Forecast, 2025-2035
- 12.7.4 Volume Forecast, 2025-2035
- 12.7.5 Base-Year Market Share, 2025
- 12.7.6 Segment CAGR and Growth Drivers
- 12.7.7 Subsegment Market Size and Forecast
- 12.7.7.1 China
- 12.7.7.2 India
- 12.7.7.3 Developed Asia Pacific
- 12.7.7.4 ASEAN and Remaining Asia Pacific
- 12.7.8 Subsegment Pricing and Adoption Trends
- 12.7.9 Leading Suppliers and Competition
- 12.7.10 Regional Demand and Opportunities
- 12.8 Segment Growth Comparison
- 12.9 Segment Attractiveness and Priority Matrix
Chapter 13 Asia Pacific Contract Logistics End-Use and Application Market Outlook
- 13.1 End-Use Industry and Customer Demand Structure
- 13.2 Leading Applications and Customer Groups
- 13.3 End-Use Market Size, Share and Forecast
- 13.4 Major End-Use Industry Deep Dives
- 13.4.1 Customer Requirements and Use Cases
- 13.4.2 Demand and Replacement Cycles
- 13.4.3 Technical and Regulatory Considerations
- 13.4.4 Purchasing and Procurement Models
- 13.4.5 Leading Vendors and Distribution Channels
- 13.4.6 Forecast and Commercial Opportunities
- 13.5 Emerging Applications and Cross-Segment Demand
- 13.6 End-Use Industry Investment Priorities
Chapter 14 Asia Pacific Contract Logistics Geographic Market Outlook, 2025-2035
- 14.1 Regional Market Size and Country-Level Shares, 2025
- 14.2 Country Market Size Comparison, 2025
- 14.3 Country Market Forecasts, 2025-2035
- 14.4 Subregional Industrial and Demand Clusters
- 14.5 Intra-Regional Pricing and Cost Differences
- 14.6 Cross-Border Trade and Supply Networks
- 14.7 Regional Supply and Demand Balances
- 14.8 Country Opportunity Comparison and Prioritization
Note: Every listed country is covered on the structure shown under the first country.
Chapter 15 Asia Pacific Contract Logistics Technology, Innovation and Sustainability Outlook
- 15.1 Technology Landscape and Maturity
- 15.2 Product, Process and Service Innovation
- 15.3 AI, Automation and Digital Tools in the Industry
- 15.4 Technology Adoption and Performance Benchmarking
- 15.5 Innovation Pipeline and R&D Investment
- 15.6 Patent and Intellectual Property Trends
- 15.7 Energy Efficiency and Resource Management
- 15.8 Sustainability, Recycling and Circularity
- 15.9 Technology Roadmap, 2025-2035
- 15.10 Risks of Obsolescence and Technology Substitution
Chapter 16 Asia Pacific Contract Logistics Market Key Strategic Imperatives
- 16.1 Growth and Market Entry Priorities
- 16.2 High-Return Products and Segments
- 16.3 Pricing, Profitability and Cost Optimization
- 16.4 Technology Investment and Product Differentiation
- 16.5 Supply Chain Localization and Resilience
- 16.6 Distribution and Customer Acquisition
- 16.7 Partnership, Acquisition and Capacity Strategy
- 16.8 Regional Expansion Priorities
- 16.9 Short-, Medium- and Long-Term Actions
Chapter 17 Competition Outlook
- 17.1 Industry Competition Characteristics
- 17.2 Market Structure and Concentration
- 17.3 Market Share and Competitive Positioning, 2025
- 17.4 Company-Wise Revenue and Product Benchmarking
- 17.5 Production and Service Capacity Benchmarking
- 17.6 Technology, Pricing and Differentiation
- 17.7 Regional Footprint and Distribution Strength
- 17.8 Mergers, Acquisitions and Strategic Alliances
- 17.9 New Entrants and Competitive Threats
- 17.10 Porter's Five Forces and Industry Attractiveness
- 17.11 Competitive Outlook, 2025-2035
Chapter 18 Company Profiles
- 18.1 Company Coverage and Selection Criteria
- 18.2 DHL Supply Chain
- 18.2.1 Business Description
- 18.2.2 Company Ownership and Geographic Presence
- 18.2.3 Product and Service Portfolio
- 18.2.4 Manufacturing and Operating Footprint
- 18.2.5 Production Capacity and Expansion Plans
- 18.2.6 Financial Performance and Investment
- 18.2.7 Market Share and Competitive Position
- 18.2.8 Technology and Innovation Capabilities
- 18.2.9 Strategic Alliances or Partnerships
- 18.2.10 Recent Developments
- 18.2.11 Growth Strategy and Outlook
- 18.3 JD Logistics
- 18.4 KLN Logistics Group
- 18.5 Nippon Express Holdings
- 18.6 CJ Logistics
- 18.7 CEVA Logistics
- 18.8 Yusen Logistics
- 18.9 DSV
- 18.10 Toll Group
- 18.11 GEODIS
- 18.12 Other Relevant Market Participants
Note: Every listed company is profiled on the structure shown under the first company. The company list is preliminary and may change based on research findings, market developments, data availability and client requirements.
Chapter 19 Disclaimer
- 19.1 Research and Forecast Disclaimer
- 19.2 Data Source and Estimation Limitations
Note: The depth of individual sections depends on data availability for this market. Volume, capacity, trade and other unit-based metrics are included where applicable.

