
Mining wear parts and defense work keep plating lines busy
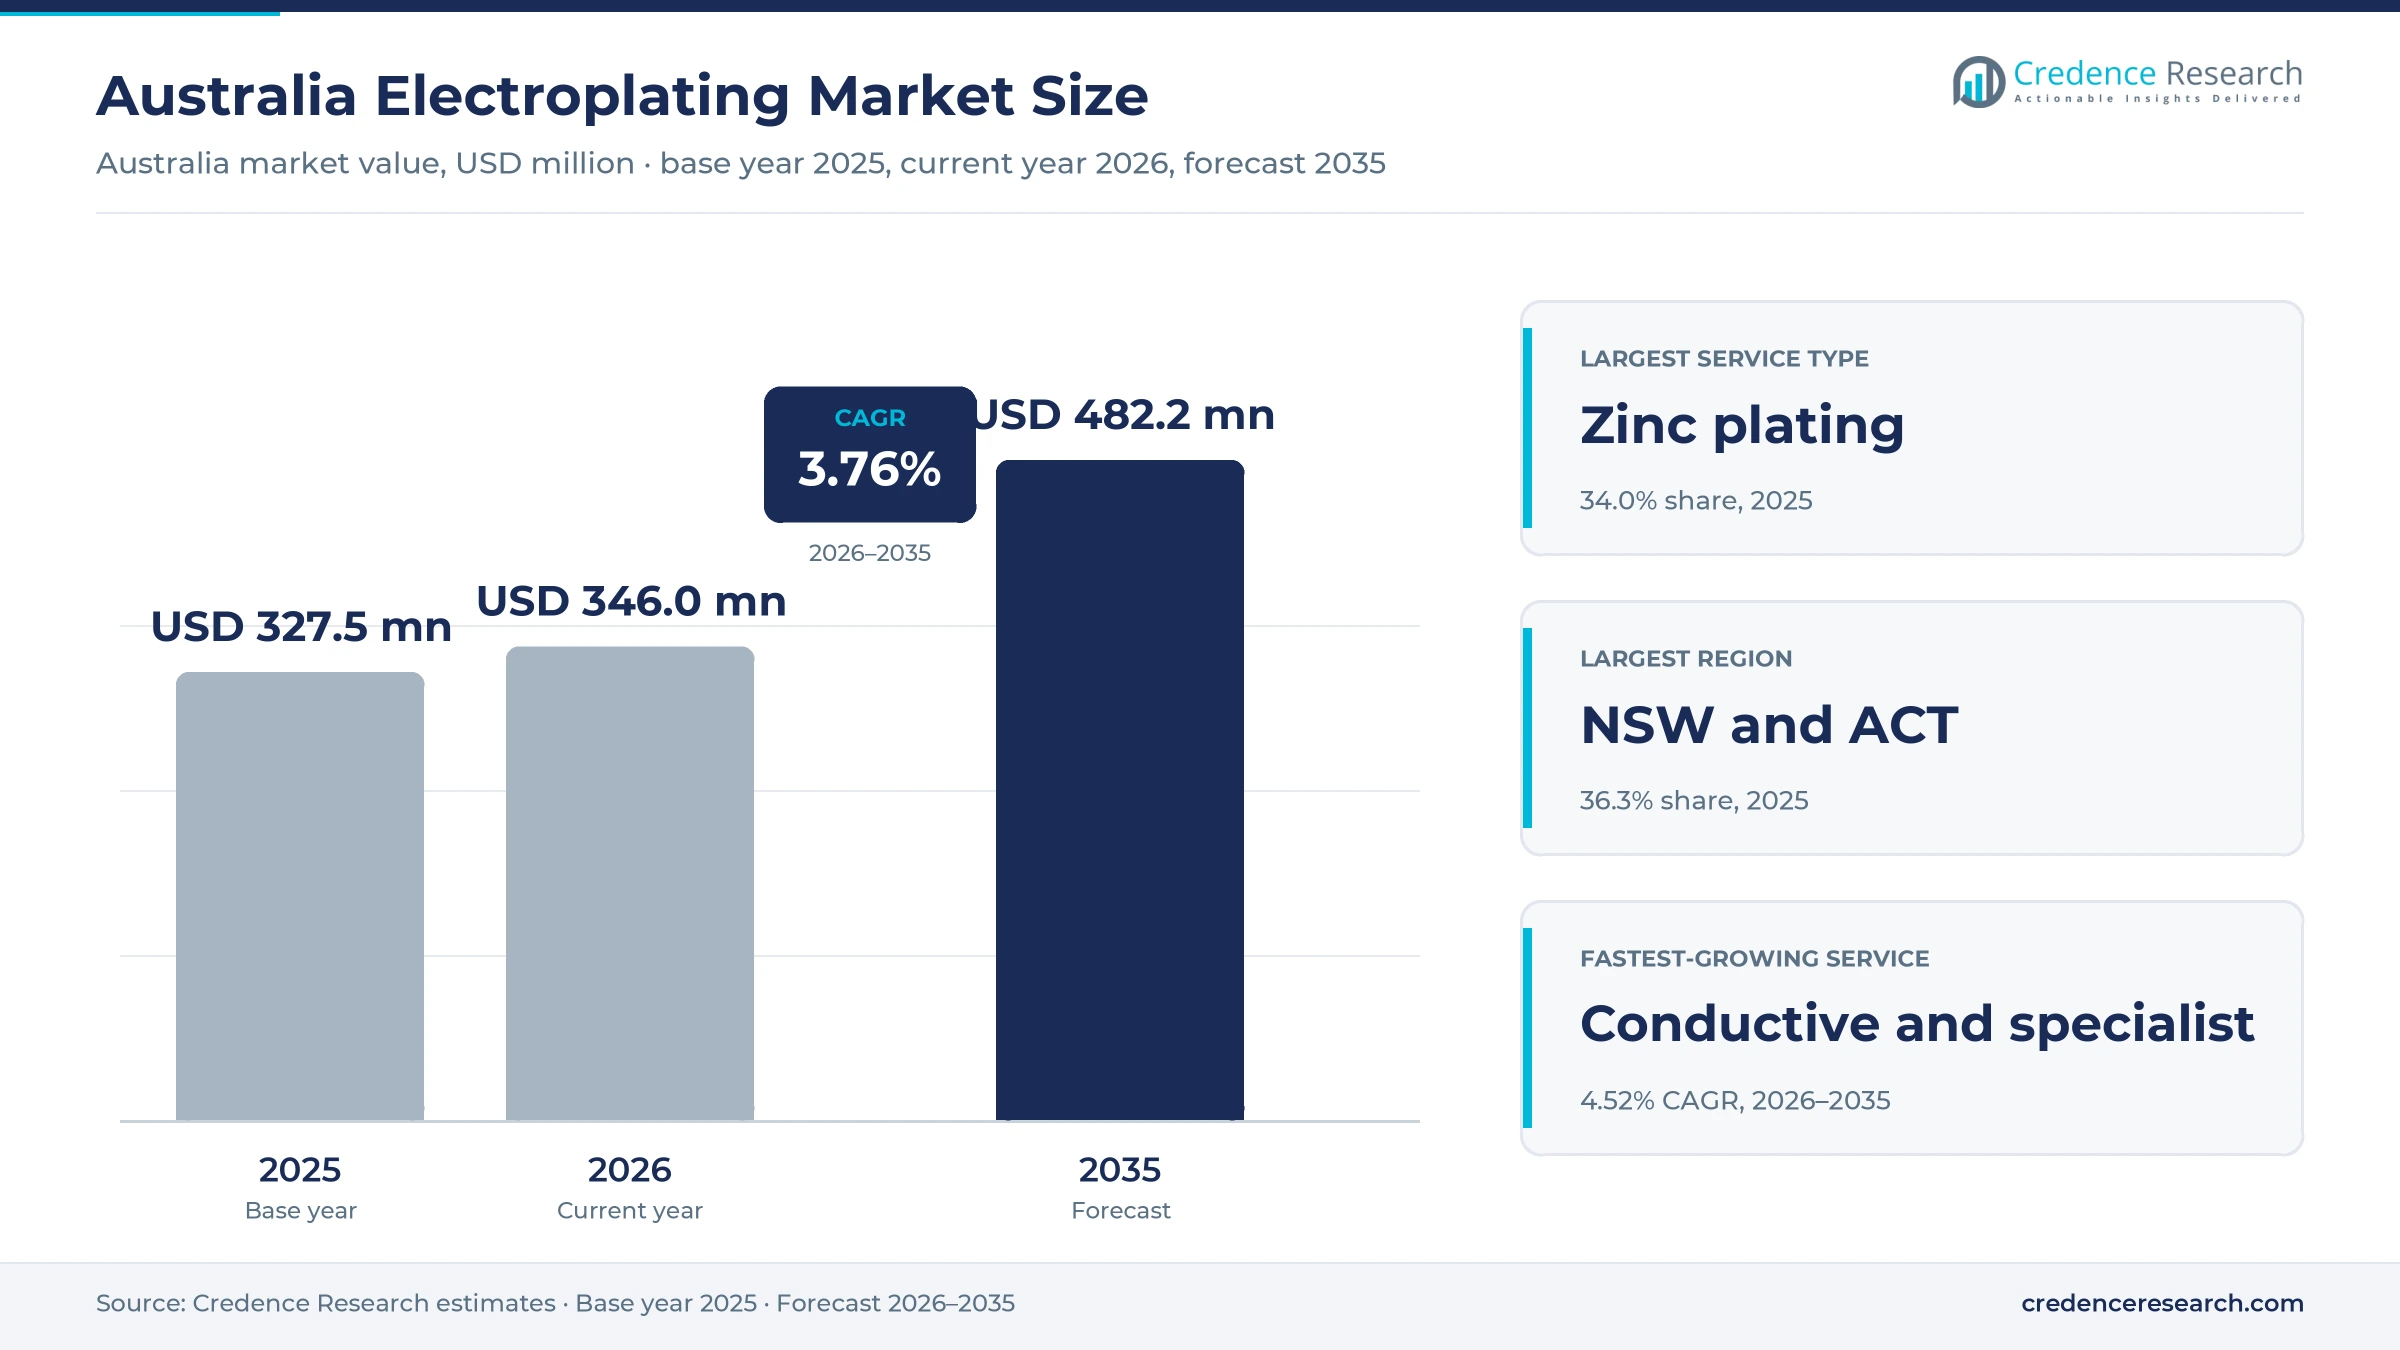
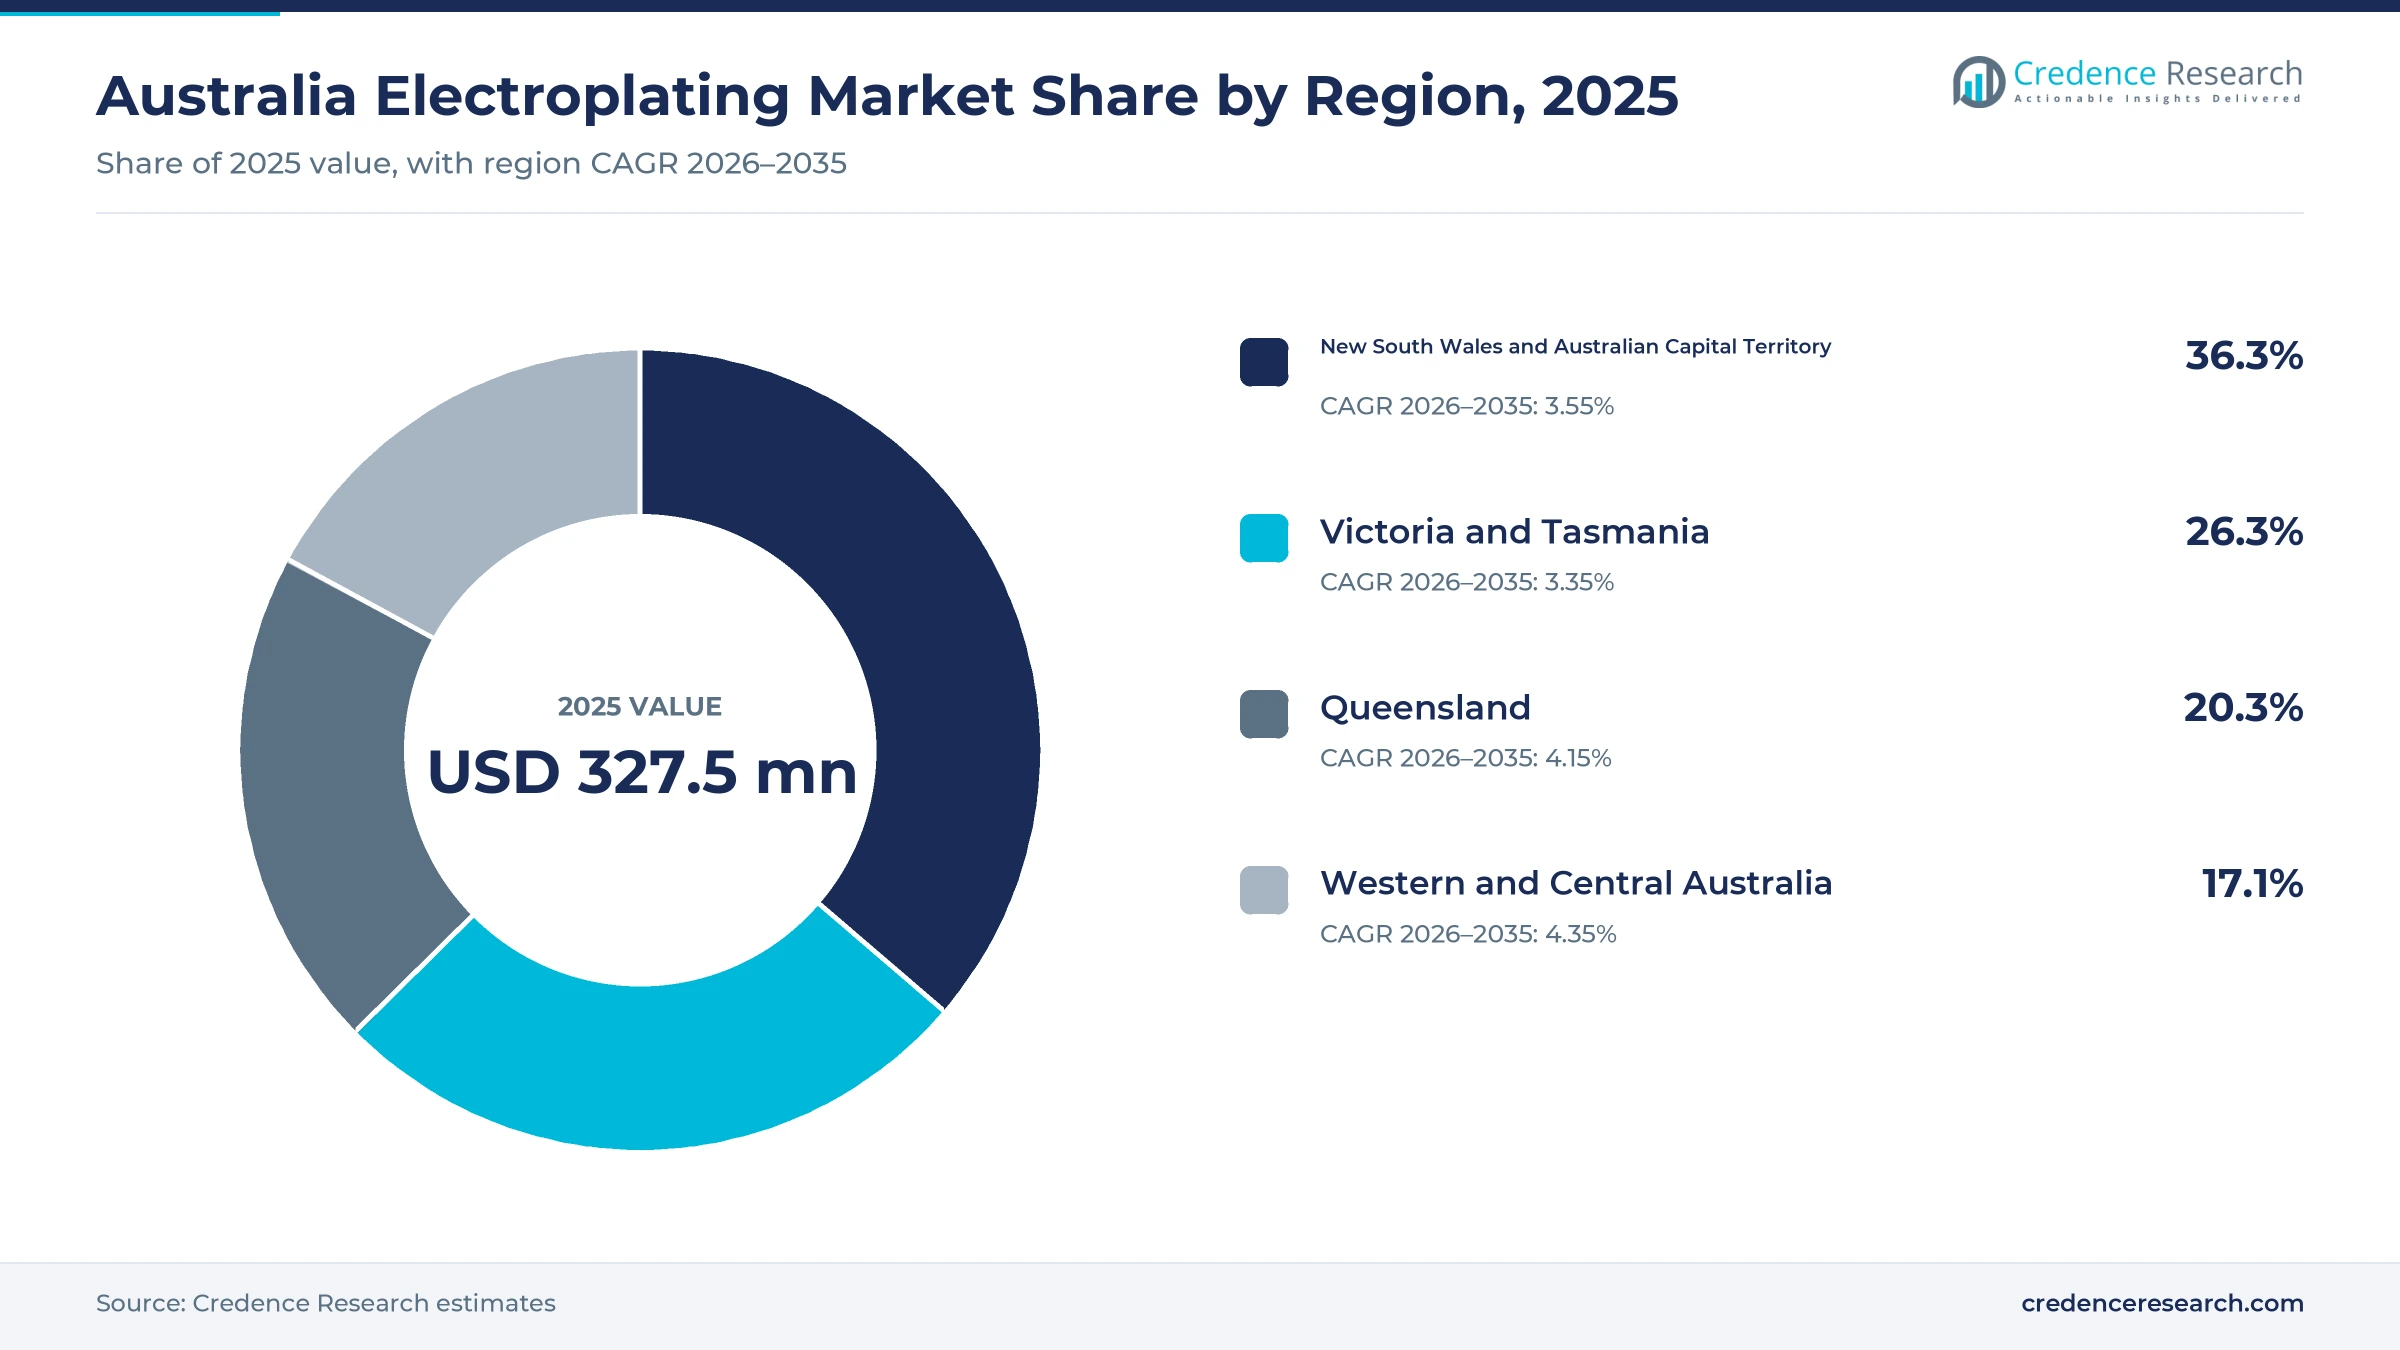
The Australia electroplating market was valued at USD 327.5 million in 2025 and is projected to increase from USD 346.0 million in 2026 to USD 482.2 million by 2035, registering a CAGR of 3.76% during 2026–2035. Demand comes from mining contractors, defense suppliers, component makers and asset owners that send steel, brass and aluminum parts to job shops for zinc, nickel, chrome and specialist coatings. New South Wales and the Australian Capital Territory held the largest regional share, 36.3% in 2025, because Sydney hosts many long-established plating shops and defense suppliers. Western and Central Australia is the fastest-growing region at 4.35% a year, as mine operators restore hydraulic and wear parts closer to site. In turn, shops are investing in fume control and monitoring, because national workplace exposure standards move to a new list of exposure limits on Dec. 1, 2026.
Which plating services are counted in Australia?
The estimate measures spending in Australia on contract electroplating and electroless plating services, including zinc, nickel, hard and decorative chrome, copper, tin, silver, gold and other specialist deposits. It covers work bought by aerospace and defense, automotive, mining, manufacturing and specialist service customers through direct accounts, tenders, engineering intermediaries and spot quotes. Values are stated in USD million at current prices and exclude goods and services tax.
The estimate excludes plating chemicals sold separately, painting, powder coating, hot-dip galvanizing and thermal spray work that is not bundled with plating. The value chain runs from chemical and anode suppliers through job shops and in-house lines to fabricators, maintenance contractors, original equipment makers and asset owners.
Australia Electroplating Market Insights
- The Australia electroplating market was valued at USD 327.5 million in 2025 and is projected to reach USD 482.2 million by 2035, at a 3.76% CAGR during 2026–2035.
- New South Wales and the Australian Capital Territory held 36.3% of 2025 value, supported by a dense base of Sydney plating shops.
- Mining led end-use industries with 31.0% of 2025 value, as hard chrome and nickel restore worn hydraulic and wear parts.
- Defense named aircraft maintenance, repair and overhaul as a sovereign industrial priority on Feb. 29, 2024, which favors qualified local finishing shops.
- Conductive and specialist plating grows fastest at 4.52% a year during 2026–2035, as electrical and precision parts need silver, tin and gold deposits.
Zinc plating leads while specialist plating grows fastest
Why does zinc plating lead service demand?
Based on service type, the market is categorized into zinc plating, nickel plating, chrome plating and conductive and specialist plating. Zinc plating led with 34.0% of 2025 value, because fasteners, brackets and fabricated steel need low-cost corrosion protection in large batches. Conductive and specialist plating grows fastest at 4.52% a year, as electrical and precision parts need silver, tin, copper and gold deposits.
Which industries send the most parts for plating?
Based on end-use industry, the market is categorized into aerospace and defense, automotive, mining and manufacturing and specialist services. Mining led with 31.0% of 2025 value, because hydraulic rods, pins and wear parts are re-chromed and returned to service. Aerospace and defence grows fastest at 4.67% a year, as aircraft sustainment work moves to qualified local suppliers.
Why does corrosion protection dominate applications?
Based on application, the market is categorized into corrosion protection, wear resistance and restoration, electrical functionality and decorative finishing. Corrosion protection led with 44.0% of 2025 value, because zinc and nickel deposits protect steel parts in coastal, mining and outdoor service. Electrical functionality grows fastest at 4.42% a year, as conductive coatings support switchgear, connectors and electronics.
How do customers buy plating services?
Based on sales channel, the market is categorized into direct account contracts, competitive tenders, engineering intermediaries and spot quotations. Direct account contracts led with 46.0% of 2025 value, because component makers keep repeat batches with approved shops. Competitive tenders grow fastest at 4.22% a year, as defense primes and mine operators tender multi-year finishing packages.
| Segment Group | Leading Sub-segment | Share, 2025 | Fastest-growing Sub-segment | CAGR, 2026–2035 |
|---|---|---|---|---|
| By Service Type | Zinc plating | 34.0% | Conductive and specialist plating | 4.52% |
| By End-Use Industry | Mining | 31.0% | Aerospace and defence | 4.67% |
| By Application | Corrosion protection | 44.0% | Electrical functionality | 4.42% |
| By Sales Channel | Direct account contracts | 46.0% | Competitive tenders | 4.22% |
Request a Free Sample
Fill in your details and we'll send you a free sample report.
- Sample data tables & charts
- Research methodology
Defense sustainment and mine part restoration lift demand
How does defense supplier qualification lift plating work?
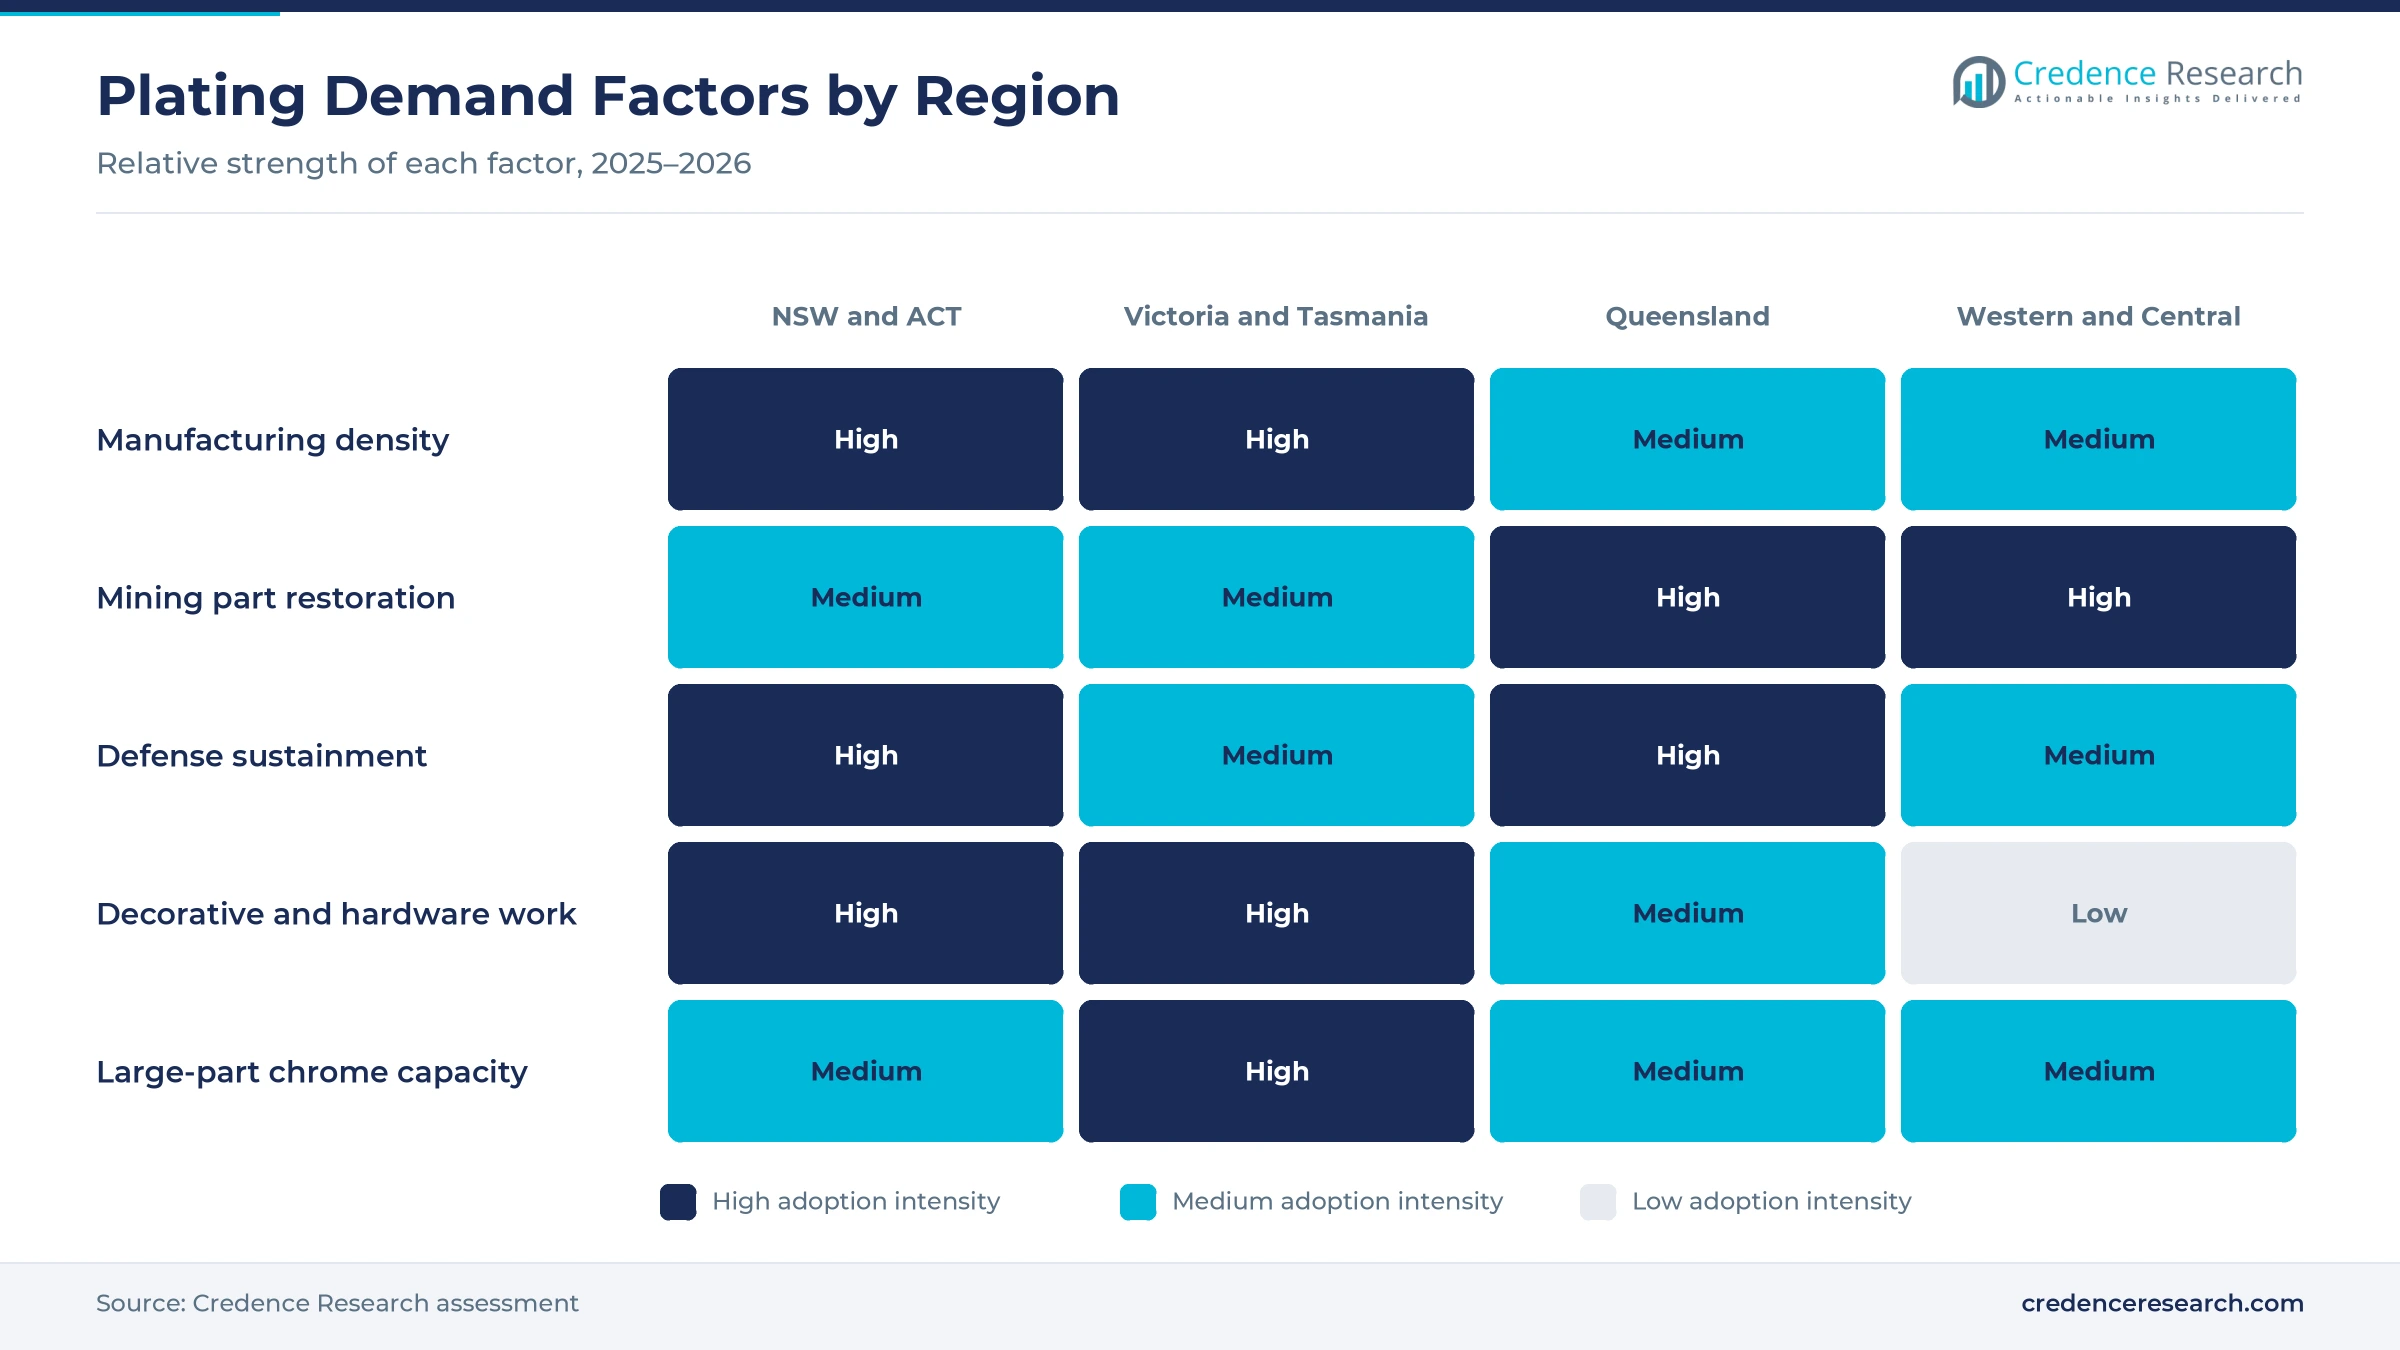
Defense supplier qualification lifts plating work, because aircraft, vehicle and naval parts need approved finishes before they return to service. The national defense industry strategy, released on Feb. 29, 2024, named seven sovereign industrial priorities, including maintenance, repair, overhaul and upgrade of military aircraft, according to the federal defense minister. The same strategy backed defense industry grants worth AUD 183.8 million, and the sector employs more than 100,000 people. The 2024 investment program then set AUD 330 billion for capability over the decade to 2033-34. As a result, aerospace and defense grows fastest among end-use industries at 4.67% a year, as primes qualify local shops for chrome, zinc and nickel work on aircraft parts.
Why does mining component restoration sustain chrome demand?
Mining component restoration sustains chrome demand, because operators re-plate worn rods, pins and shafts instead of buying new parts. Resources and energy export earnings reached an estimated AUD 385 billion in 2024-25, according to the federal industry minister, which keeps fleets running at high utilization. Gold earnings are forecast to rise from AUD 47 billion in 2024-25 to AUD 60 billion in 2025-26, which supports new and expanded mine sites. A Melbourne hard chrome specialist states that its plating can extend component life up to ten times in most cases. Consequently, mining leads end-use industries with 31.0% of 2025 value, as hydraulic cylinders from underground mining equipment return for rework.
How does local hard chrome capacity anchor heavy-part repair?
Local hard chrome capacity anchors heavy-part repair, because large rods and rolls are costly to ship offshore and downtime is expensive. Hardchrome Engineering reports plating sites at Clayton and Yallourn of 3,000 and 21,000 square meters, with capacity for parts up to 50 metric tons. The company quotes hard chrome hardness of 850 to 1,050 HV, with deposits from 0.25 to 1,000 microns thick. In Sydney, S E C Plating, founded in 1971, is listed as the Australian licensee of a U.S. engineered coating process. As a result, Victoria and Tasmania hold 26.3% of 2025 value in the Australia electroplating market, supported by large-part chrome and electroless nickel lines.
Why does the manufacturing base keep zinc and nickel volumes steady?
The manufacturing base keeps zinc and nickel volumes steady, because fabricators, hardware makers and equipment builders need corrosion protection on every batch of steel parts. Manufacturing value added equaled 5.3% of national GDP in 2025, according to the World Bank, or about USD 95.6 billion. Precision Plating, established in 1973 in Dandenong South, describes itself as the largest plating company in Australia and offers zinc, decorative finishes and electrophoretic paint. Industrial & Decorative Plating in Sydney reports more than 50 years of nickel, copper, tin and silver work for manufacturing and mining clients. Consequently, zinc plating leads service types with 34.0% of 2025 value.
Chromium controls, cladding and functional finishes rise
How are tighter chromium controls shifting plating lines?
Tighter chromium controls are shifting plating lines, because hexavalent chromium is a known carcinogen and regulators are watching chrome baths closely. The current exposure standard for chromium (VI) is 0.05 mg per cubic meter over eight hours, and air monitoring records must be kept for 30 years, according to SafeWork NSW. Workers exposed to chromium also need weekly skin checks by a trained person. National exposure standards move to a new limits list on Dec. 1, 2026, while European regulators proposed a chromium (VI) restriction with an 18-month transition in April 2025. As a result, shops in the Australia electroplating market add fume extraction, mist suppressants and trivalent chrome lines for decorative work.
Why is laser cladding rising beside hard chrome?
Laser cladding is rising beside hard chrome, because mine operators want thicker and harder layers on parts that face heavy abrasion. Hardchrome Engineering operates two 6 kW and two 4 kW laser systems, and some units can be taken to mine sites. Its tungsten carbide cladding reaches 2,200 HV, compared with 850 to 1,050 HV for hard chrome. The same company applies electroless nickel that passes a 1,000-hour salt-spray test for corrosion resistance. In turn, wear resistance and restoration work blends plating with cladding, and shops that offer both methods win whole repair packages for bucket teeth, mill liners and slurry parts.
Can population growth open decorative and hardware finishing work?
Population growth opens decorative and hardware finishing work, because new homes need tapware, door hardware and fittings with durable plated finishes. The national population reached 27.9 million in March 2026 after 1.4% annual growth, according to the Australian Bureau of Statistics. Western Australia grew fastest at 2.1%, while Queensland and Victoria each grew 1.6% over the same 12 months. Precision Plating offers decorative electroplated finishes, physical vapor deposition and polishing for plumbing, hardware, automotive and jewelry customers. Consequently, local shops can win short-run decorative batches from fittings makers that need fast turnaround, while plating on plastics widens the range of parts.
Is there room to grow in conductive and precision plating?
Conductive and precision plating offers a clear opening, because electrical, scientific and defense parts need silver, tin, copper and gold deposits with tight thickness control. Industrial & Decorative Plating in Sydney specializes in silver, bright tin, nickel and copper work, with more than 50 years in the trade. In South Australia, A Class Plating lists decorative and functional gold for industrial and scientific use, plus electroless nickel and barrel plating. That Lonsdale shop, which began in 1989, changed ownership in late July 2024, which kept its plating equipment in service. Therefore, electrical functionality grows fastest among applications at 4.42% a year, while nickel deposits remain the base layer under many precious metal finishes.
Compliance costs, skills and wastewater limits weigh
How do compliance costs squeeze small job shops?
Compliance costs squeeze small job shops, because fume extraction, air monitoring and health checks add fixed costs to every chrome and nickel line. Smaller shops spread these costs over fewer jobs than large plants can. As a result, some owners close lines or sell equipment rather than upgrade. Shops reduce this pressure by sharing testing services, switching decorative work to trivalent chrome and pricing compliance into long-term contracts.
Why does a thin skills pipeline limit capacity?
A thin skills pipeline limits capacity, because experienced platers manage bath chemistry, current density and masking that take years to learn. Many founders and senior platers are close to retirement in family-owned shops. Consequently, shops can turn away complex aerospace and mining jobs when key staff leave. Training through industry bodies and structured mentoring helps owners keep process knowledge inside the business.
How do wastewater and energy costs affect margins?
Wastewater and energy costs affect margins, because plating lines use heated tanks, rectifiers and treatment plants that run every day. Trade waste rules require shops to remove metals before discharge to sewers. In turn, rising power and sludge disposal costs lift the price of each plated part. Shops respond with drag-out recovery, efficient rectifiers and closed-loop rinsing that cut water and chemical use.
Will offshore competition hold down commodity prices?
Offshore competition can hold down commodity prices, because finished fasteners and hardware often arrive already plated from Asian suppliers. Local shops then compete mainly on repair, urgent and qualified work. As a result, zinc plating volumes depend on local fabrication rather than imported components. Shops protect margins by focusing on large parts, short lead times and certified processes that importers cannot easily match.
New South Wales leads as western zones add demand fastest
| Region | Value, 2025 (USD million) | Share, 2025 | CAGR, 2026–2035 |
|---|---|---|---|
| New South Wales and Australian Capital Territory | 118.9 | 36.3% | 3.55% |
| Victoria and Tasmania | 86.1 | 26.3% | 3.35% |
| Queensland | 66.5 | 20.3% | 4.15% |
| Western and Central Australia | 56.0 | 17.1% | 4.35% |
Why do New South Wales and the ACT lead plating demand?
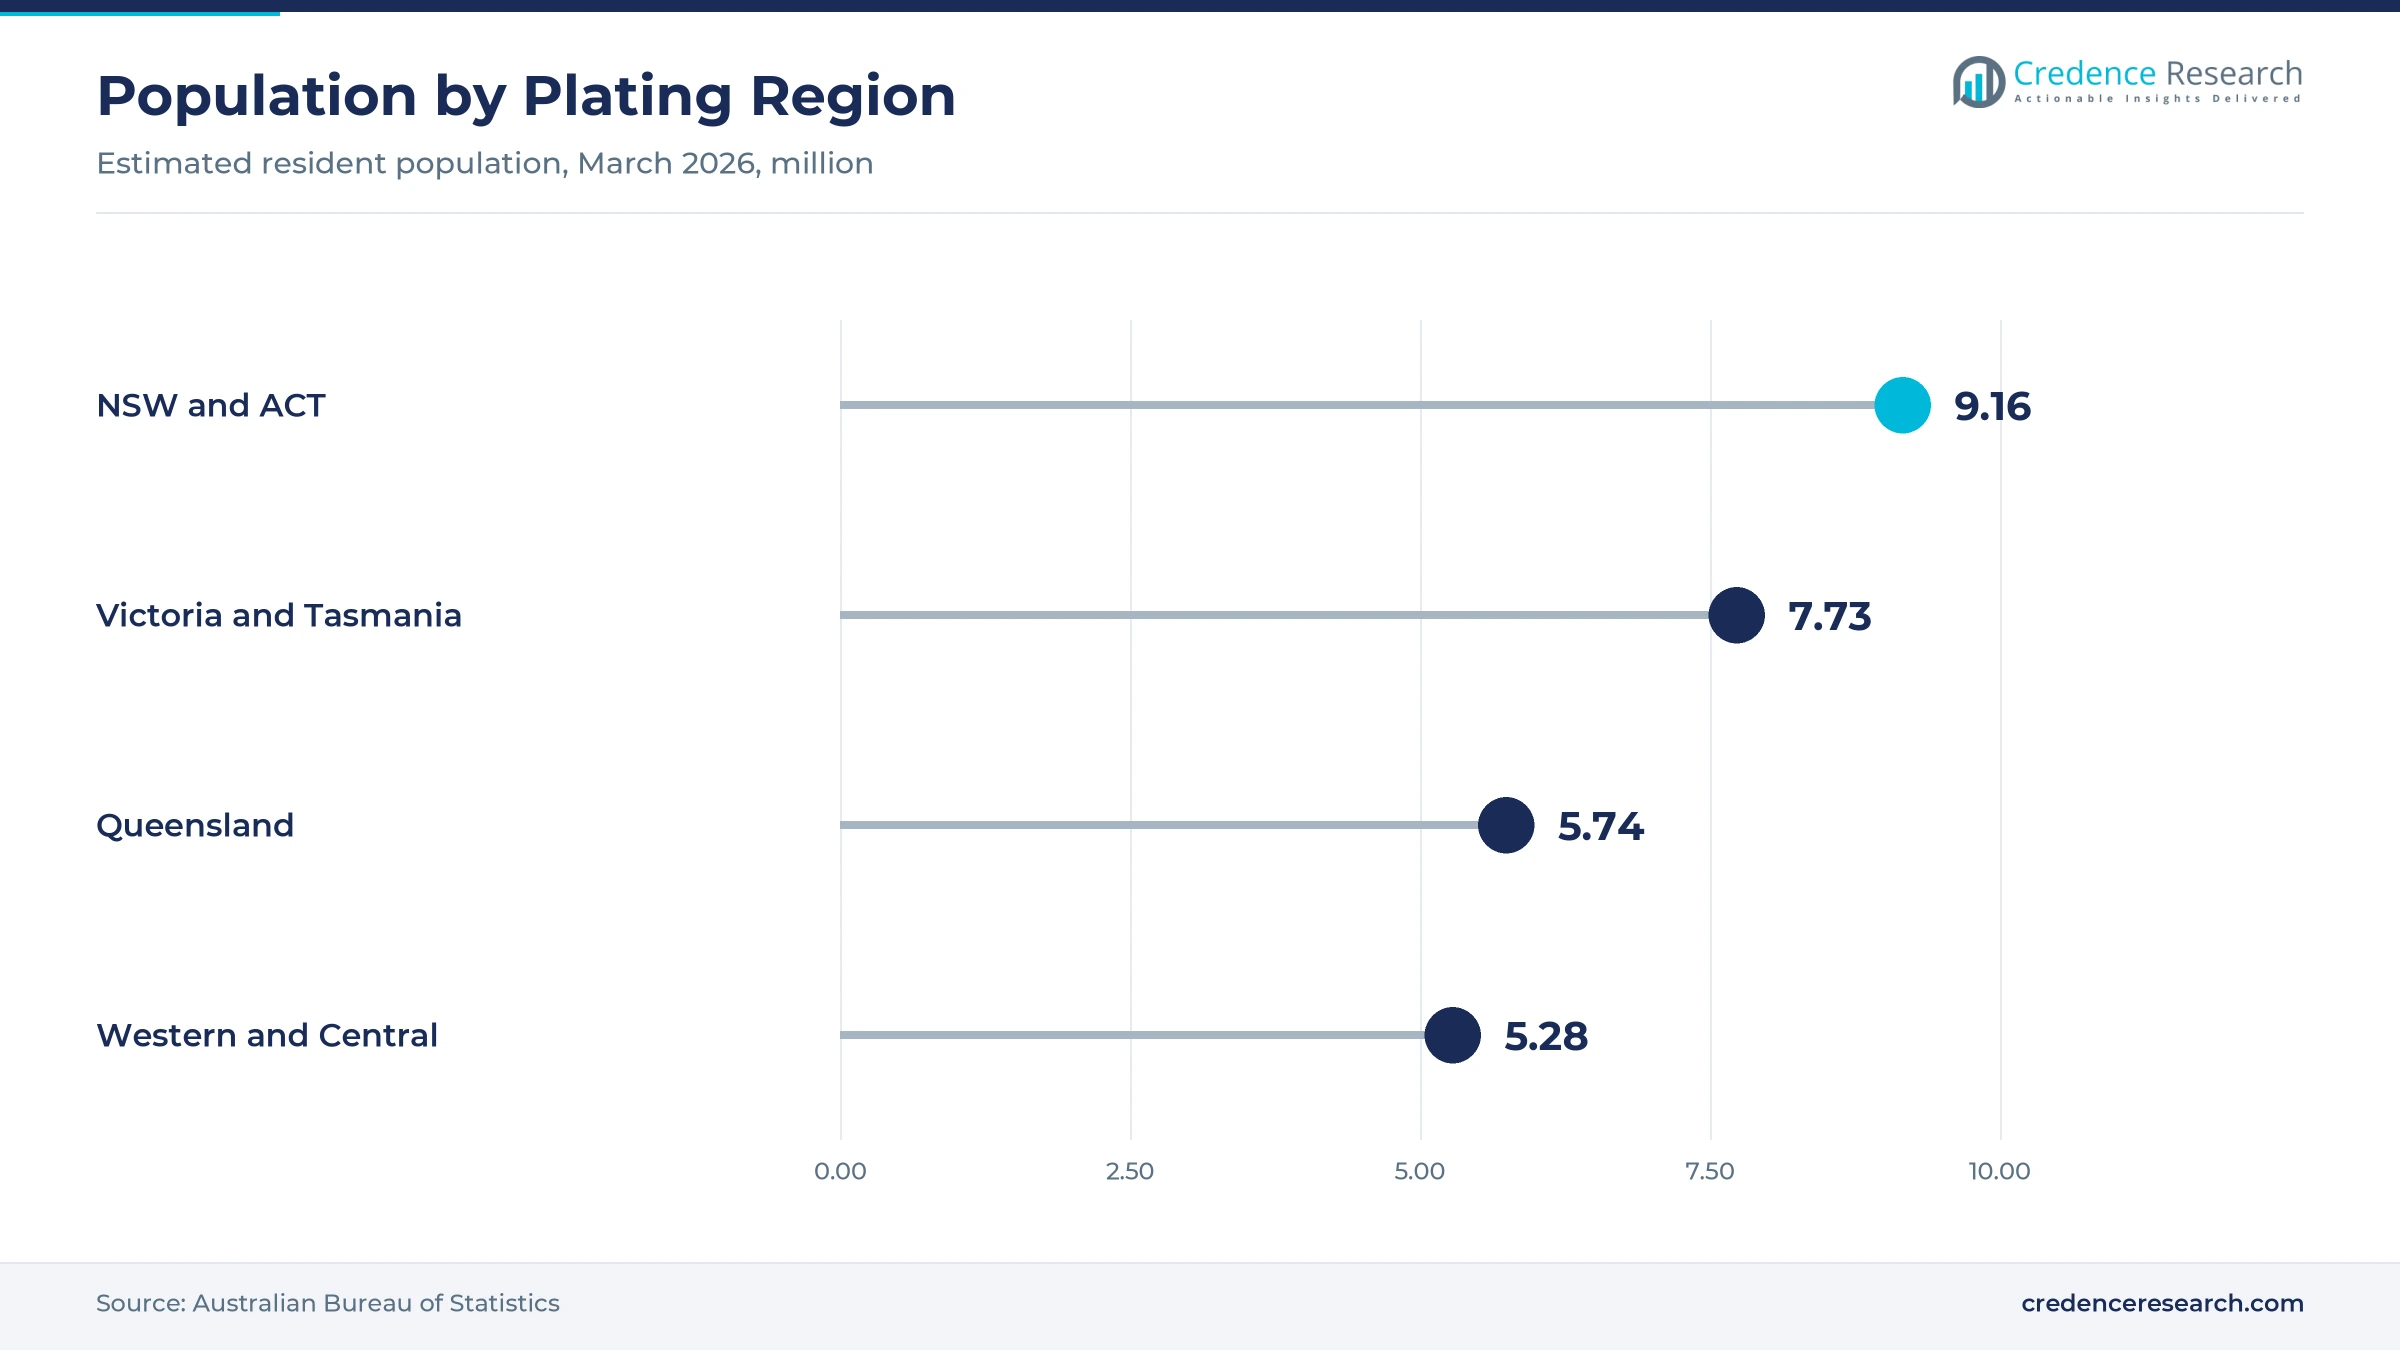
New South Wales and the Australian Capital Territory held 36.3% of 2025 value and grow at 3.55% a year. The zone had about 9.16 million residents in March 2026, which gives the region the largest base of plating demand. It also hosts long-established Sydney shops such as S E C Plating and Industrial & Decorative Plating. Defense offices in Canberra and suppliers around Sydney also support qualified finishing work. As a result, the zone keeps the largest share of plating spending through 2035.
How do Victoria and Tasmania support heavy-part plating?
Victoria and Tasmania held 26.3% of 2025 value and grow at 3.35% a year. The zone had about 7.73 million residents in March 2026, and its Melbourne manufacturing base adds steady plating demand. Precision Plating operates in Dandenong South, while Hardchrome Engineering runs large-part chrome sites at Clayton and Yallourn. Consequently, Victoria handles much of the decorative and heavy hard chrome work in the country.
Why does Queensland add mining and defense work?
Queensland held 20.3% of 2025 value and grows at 4.15% a year, because coal and metal mines send hydraulic and wear parts to coastal repair shops. The state had about 5.74 million residents in March 2026 and grew 1.6% over the year. Defense bases and aircraft sustainment in the state add qualified plating jobs. In turn, Queensland gains share as mining and defense repair volumes rise.
Why are western and central zones the fastest growing?
Western and Central Australia held 17.1% of 2025 value and grows fastest at 4.35% a year. The zone had about 5.28 million residents in March 2026, and Western Australia grew fastest of all states at 2.1%. Iron ore and gold mines create steady demand for rod and pin restoration near Perth, and gold earnings are forecast to reach AUD 60 billion in 2025-26. A Class Plating also serves South Australian customers from Lonsdale.
Defense plans, chromium rules and shop sales from 2024
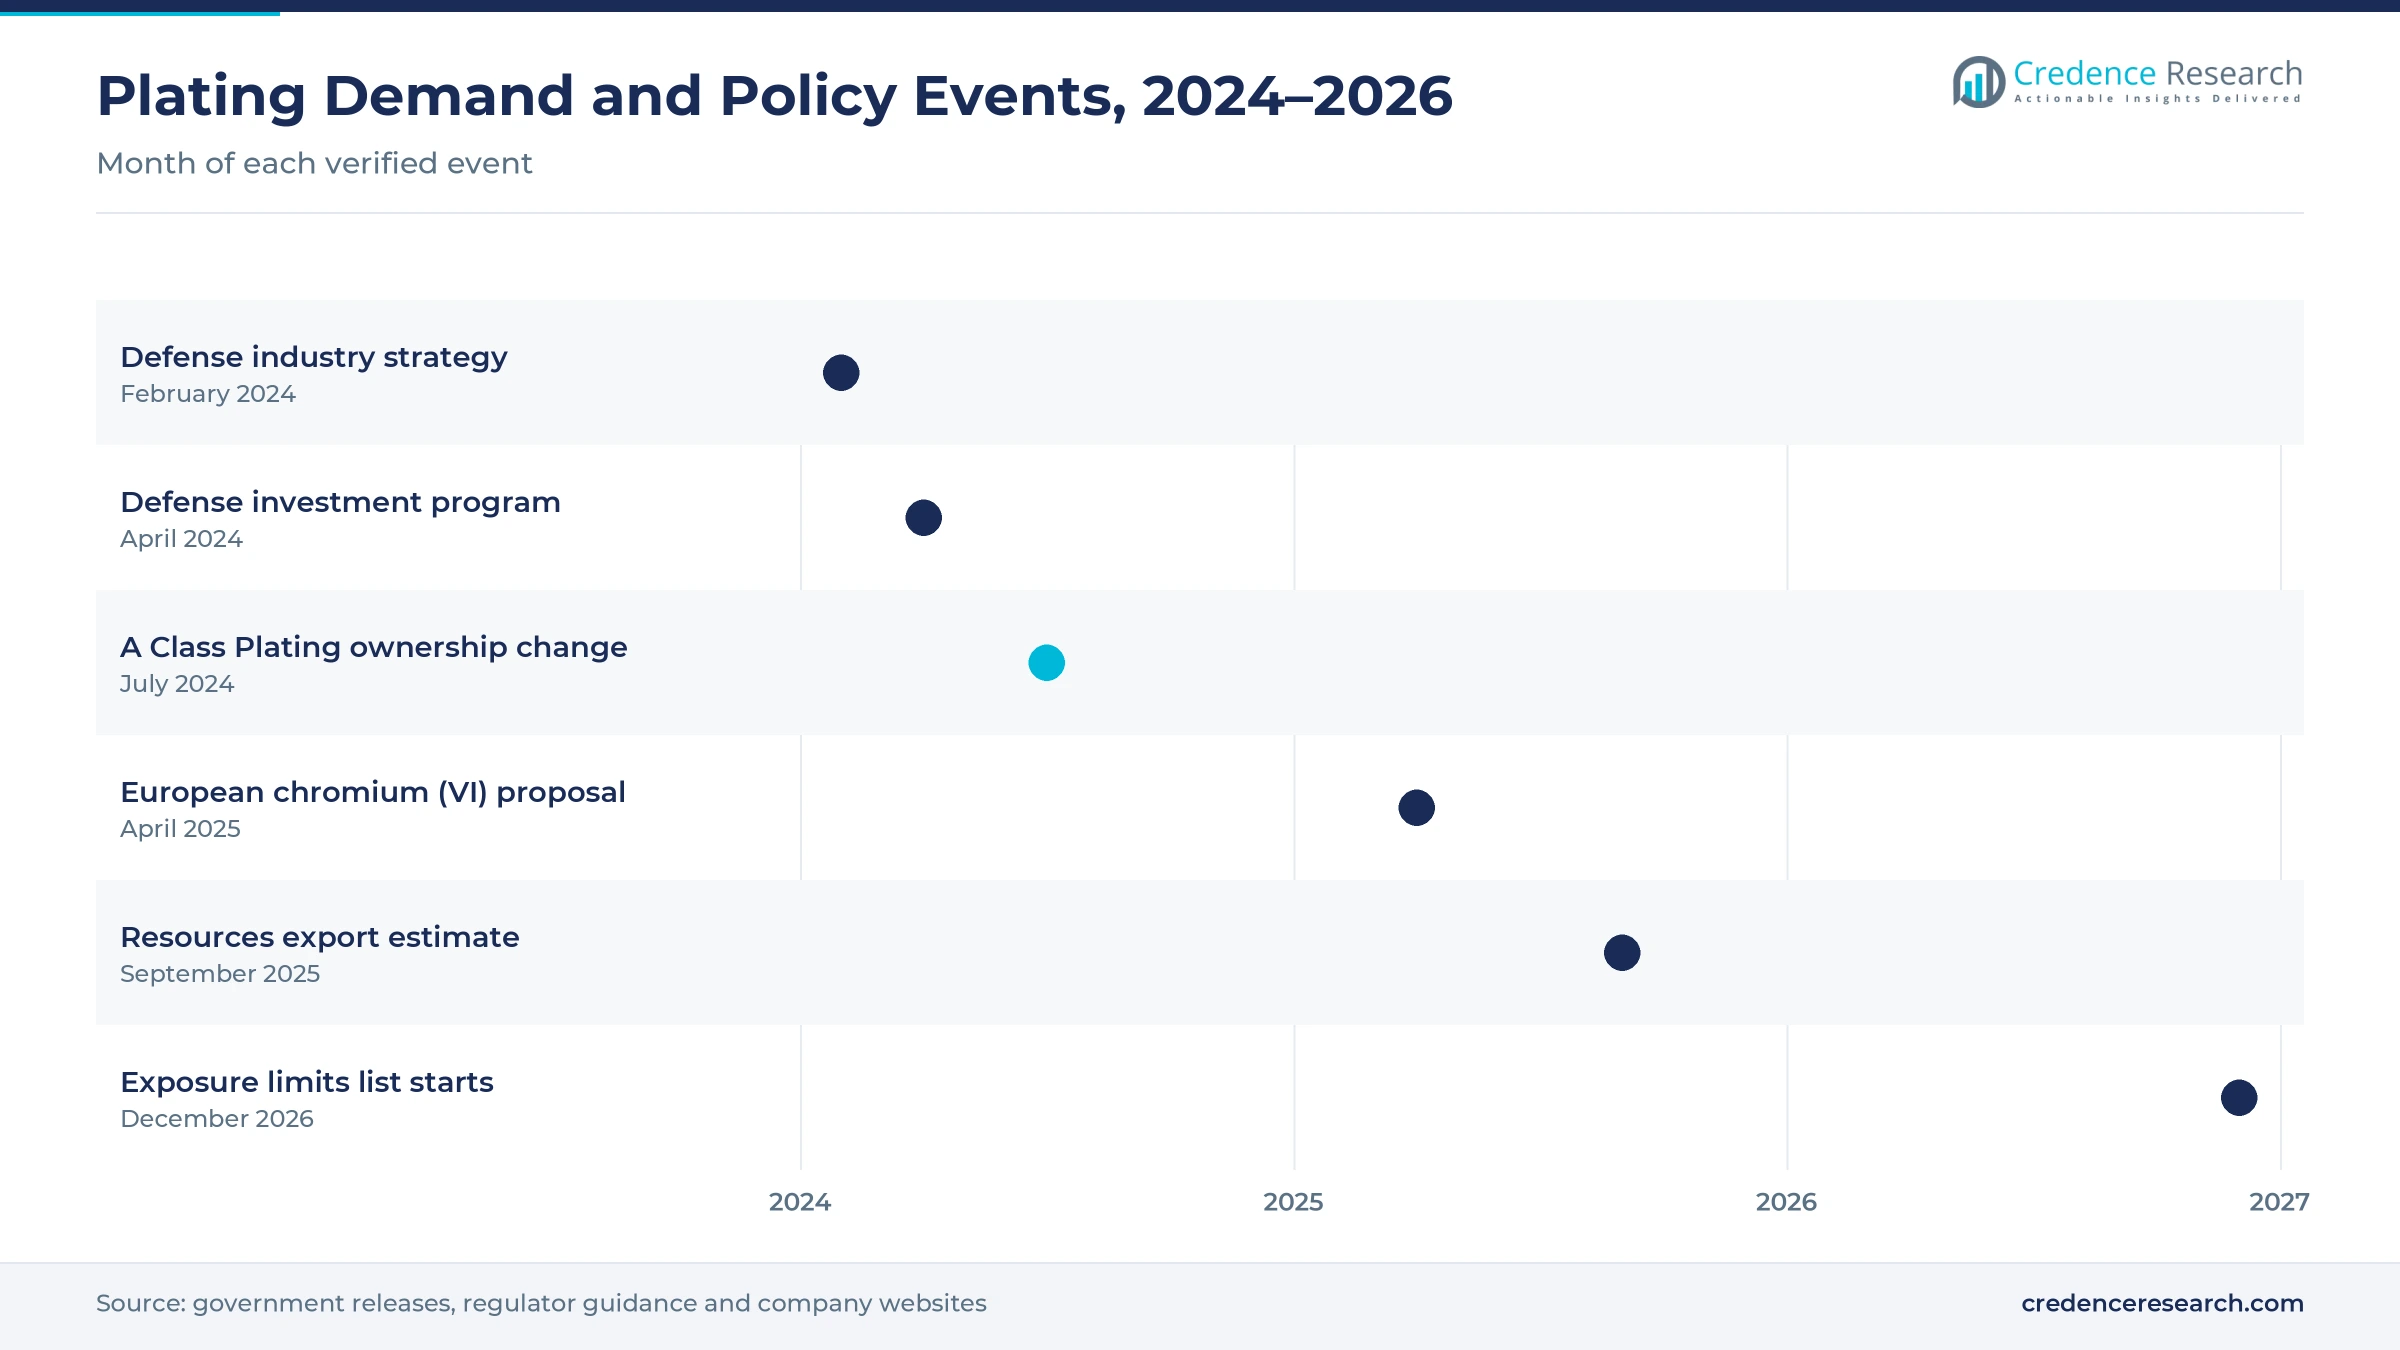
| Development | Status and market relevance |
|---|---|
| In February 2024, the federal defense minister released the defense industry strategy with seven sovereign industrial priorities, including military aircraft maintenance, repair and overhaul. | Supports qualified local finishing work |
| In April 2024, the government released a defense investment program worth AUD 330 billion over the decade to 2033-34. | Lifts long-term sustainment demand |
| In July 2024, a new owner bought two of three buildings and the plating equipment of A Class Metal Finishers in Lonsdale, which became A Class Plating. | Kept South Australian plating capacity in service |
| In April 2025, European regulators proposed a chromium (VI) restriction with an 18-month transition period. | Signals tighter controls on chrome baths |
| In September 2025, the federal resources outlook estimated resource and energy export earnings at AUD 385 billion for 2024-25. | Supports mining equipment repair demand |
Rack, barrel and electroless lines reshape plating work
- Rack plating holds large or delicate parts on fixtures, which suits hard chrome rods, aerospace parts and decorative fittings that need even coverage.
- Barrel plating tumbles small fasteners and fittings in rotating drums, which keeps zinc and nickel costs low for high-volume batches.
- Electroless nickel deposits nickel-phosphorus without current, which gives uniform coverage on bores and complex shapes for mining and oil parts.
- Trivalent chrome and fume control replace or contain hexavalent baths, which helps shops meet tighter exposure limits for decorative and functional work.
Need a Custom Version of This Report?
Tailor the scope, geography, or segments to your exact requirements.
- Custom geography or segment scope
- Direct access to our analyst team
Job shops compete on approvals, capacity and turnaround
Competition is fragmented across family-owned job shops, specialist hard chrome plants and in-house lines at equipment makers. Precision Plating, established in 1973 in Dandenong South, describes itself as the largest plating company in Australia and holds ISO 9001 accreditation. Industrial & Decorative Plating in Sydney focuses on silver, bright tin, nickel and copper for manufacturing and mining clients. S E C Plating, founded in 1971 in Sydney, is listed as the Australian licensee of a U.S. engineered coating process. Shops compete on process approvals, tank size, turnaround, masking skill and compliance records. Larger plants also bundle polishing, painting and assembly, which helps them keep direct accounts with component makers. Specialist shops win restoration work by handling long rods and heavy parts that smaller lines cannot fit.
Companies profiled and their roles in this market
| Company | Type | Role in the market |
|---|---|---|
| Precision Plating (Aust) Pty Ltd | Decorative and functional job shop | Dandenong South plant, established 1973, ISO 9001 |
| Industrial & Decorative Plating Co Pty Ltd | Functional job shop | Silver, bright tin, nickel and copper in Sydney |
| S E C Plating Pty Ltd | Engineered coating job shop | Sydney shop founded 1971; licensed coating process |
Credence Research view on metal finishing services
Credence Research's view is that Australian plating demand will grow steadily through 2035, as mining and defense customers keep repairing high-value parts locally. Zinc plating should keep the largest service share, while conductive and specialist plating gains most from electrical and precision work. Mining will remain the largest end use, although defense sustainment adds the fastest growth. However, tighter chromium controls and skills shortages will reward shops that invest in compliance, training and larger tanks.
How the plating services estimate was built
The report uses 2025 as the base year, with values in USD million at current prices. Market values come from the Credence Research model, which combines manufacturing output, mining and defense maintenance activity and service price tiers. Regional shares follow the client region split, and segment splits by service type, end-use industry, application and sales channel are Credence Research estimates. Sources used are official statistics, government releases, regulator guidance, company websites and trade news, and no interviews or surveys were used.
Defense and mining work shape plating demand to 2035
The market is expected to reach USD 482.2 million by 2035, a 3.76% CAGR during 2026–2035, as defense sustainment and mining repair keep plating lines busy. Growth should be strongest in conductive and specialist plating, aerospace and defense work and the western and central zones, while New South Wales and the ACT keep the largest share. Investment in fume control and trivalent chrome will shape capacity after 2026. In contrast, weaker commodity prices or shop closures could slow restoration spending.
Frequently Asked Questions
How big is the Australia electroplating market?
Which region leads plating demand?
Which region grows fastest?
Which service type holds the largest share?
Why does mining matter so much for plating?
Which end-use industry grows fastest?
Who are the leading companies in this market?
What are the main risks to growth?
Table of Content
Chapter 1 Market Segmentation
- 1.1 Segmentation Framework
- 1.1.1 Product and Service Classification
- 1.1.2 Application and End-Use Classification
- 1.1.3 Technology and Solution Classification
- 1.1.4 Customer and Distribution Channel Classification
- 1.1.5 Geographic Segmentation
- 1.1.6 Market Segment Definitions and Boundaries
- 1.2 By Service Type
- 1.2.1 Zinc plating
- 1.2.2 Nickel plating
- 1.2.3 Chrome plating
- 1.2.4 Conductive and specialist plating
- 1.3 By End-Use Industry
- 1.3.1 Aerospace and defence
- 1.3.2 Automotive
- 1.3.3 Mining
- 1.3.4 Manufacturing and specialist services
- 1.4 By Application
- 1.4.1 Corrosion protection
- 1.4.2 Wear resistance and restoration
- 1.4.3 Electrical functionality
- 1.4.4 Decorative finishing
- 1.5 By Sales Channel
- 1.5.1 Direct account contracts
- 1.5.2 Competitive tenders
- 1.5.3 Engineering intermediaries
- 1.5.4 Spot quotations
Chapter 2 Introduction
- 2.1 Report Objectives and Scope
- 2.2 Product Definition and Industry Terminology
- 2.3 Market Inclusions and Exclusions
- 2.4 Research Process
- 2.4.1 Primary Research and Expert Interviews
- 2.4.2 Secondary Research and Source Review
- 2.4.3 Top-Down and Bottom-Up Estimation
- 2.4.4 Data Triangulation and Verification
- 2.5 Market Size Measurement Basis
- 2.5.1 2025: USD 327.5 million → 2035: USD 482.2 million
- 2.6 Historical and Forecast Reference Periods
- 2.6.1 Historical Period: 2018-2025
- 2.6.2 Base Year: 2025
- 2.6.3 Forecast Period: 2025-2035
- 2.7 Research Assumptions and Limitations
Chapter 3 Executive Summary
- 3.1 Market Snapshot and Key Findings
- 3.2 Base-Year Market Size, 2025
- 3.3 Forecast Market Size, 2035
- 3.4 Revenue and Volume Growth Outlook
- 3.5 Key Demand and Supply Indicators
- 3.6 Leading Market Segments
- 3.7 Fastest-Growing Market Opportunities
- 3.8 Regional Performance Highlights
- 3.9 Technology and Industry Transformation
- 3.10 Competitive Landscape Summary
- 3.11 Analyst View and Strategic Implications
Chapter 4 Australia Electroplating Market Trends and Developments
- 4.1 Historical Industry Development, 2018-2025
- 4.2 Recent Market Trends and Developments
- 4.3 Demand and Customer Behavior Trends
- 4.4 Technology and Product Innovation
- 4.5 Artificial Intelligence, Automation and Digitalization
- 4.6 Local Manufacturing and Supply Chain Realignment
- 4.7 Industry Partnerships, Mergers and Acquisitions
- 4.8 Sustainability and Circular Economy Developments
- 4.9 Government and Private Sector Investment Trends
- 4.10 Emerging Business Models and Commercialization
- 4.11 Industry Developments and Announcements
Chapter 5 Australia Electroplating Market Production, Supply and Demand Analysis
- 5.1 Demand Trend and Consumption Analysis, 2018-2025
- 5.2 Demand Forecast, 2025-2035
- 5.3 Production and Output Trend, 2018-2025
- 5.4 Production and Output Forecast, 2025-2035
- 5.5 Installed Capacity and Capacity Utilization
- 5.6 Company-Wise Production Plants and Statistics
- 5.6.1 Installed Production Capacity
- 5.6.2 Actual Production
- 5.6.3 Planned Capacity and Expansion Targets
- 5.7 Supply Chain Structure and Procurement Trends
- 5.8 Supply-Demand Gap and Bottlenecks
- 5.9 Import Dependence and Sourcing Structure
- 5.10 Contract Manufacturing and Outsourcing
- 5.11 Regional Supply and Demand Concentration
Chapter 6 Australia Electroplating Market Pricing Analysis
- 6.1 Pricing Structure and Measurement
- 6.2 Historical Pricing Trends, 2018-2025
- 6.3 Pricing Outlook, 2025-2035
- 6.4 Average Selling Price and Unit Economics
- 6.5 Pricing by Product and Market Segment
- 6.6 Geographic Pricing Differences
- 6.7 Key Input, Energy, Labor and Logistics Costs
- 6.8 Contract Pricing and Purchasing Models
- 6.9 Pricing Sensitivity and Competitive Positioning
- 6.10 Price, Margin and Profitability Implications
Chapter 7 Australia Electroplating Market Dynamics
- 7.1 Market Growth Drivers
- 7.1.1 Demand-Side Drivers
- 7.1.2 Technology and Innovation Drivers
- 7.1.3 Infrastructure and Investment Drivers
- 7.1.4 Regulatory and Policy Drivers
- 7.2 Market Restraints
- 7.2.1 Cost and Affordability Constraints
- 7.2.2 Technology and Adoption Barriers
- 7.2.3 Supply Chain and Operational Constraints
- 7.3 Market Challenges
- 7.3.1 Competitive Pressure and Margin Erosion
- 7.3.2 Skills, Infrastructure and Implementation Gaps
- 7.4 Emerging Market Opportunities
- 7.5 Market Dynamics Impact and Time-Horizon Assessment
Chapter 8 Australia Electroplating Value Chain Analysis
- 8.1 Industry Value Chain Overview
- 8.2 Upstream Suppliers and Critical Inputs
- 8.3 Technology and Component Providers
- 8.4 Manufacturing or Service Delivery
- 8.5 Distribution, Channel Partners and Integrators
- 8.6 Downstream Applications and End Users
- 8.7 Value Addition and Profit Pools
- 8.8 Vertical Integration and Outsourcing
- 8.9 Supplier Concentration and Risk
- 8.10 Supply Chain Localization and Resilience
Chapter 9 Australia Electroplating Market Regulations and Policies
- 9.1 Relevant Laws, Standards and Compliance Frameworks
- 9.2 Product, Service, Safety and Quality Requirements
- 9.3 Government Policies, Incentives and Subsidies
- 9.4 Imports, Exports and Trade Barriers
- 9.5 Public Procurement and Local Content Requirements
- 9.6 Environmental and Sustainability Compliance
- 9.7 Upcoming Policy Changes and Market Implications
Chapter 10 Australia Electroplating Market Hotspots and Opportunities
- 10.1 Market Opportunity Mapping and Growth Hotspots
- 10.2 High-Growth Applications and Customer Groups
- 10.3 Underserved Markets and White-Space Opportunities
- 10.4 Emerging Technology and Product Opportunities
- 10.5 New Capacity and Investment Hotspots
- 10.6 Market Entry and Expansion Opportunities
- 10.7 Distribution and Partnership Opportunities
- 10.8 Near-Term and Long-Term Commercial Potential
- 10.9 Opportunity Attractiveness and Execution Risks
Chapter 11 Australia Electroplating Market Outlook, 2025-2035
- 11.1 Market Size and Analysis
- 11.1.1 Revenue (Market Measurement: 2025: USD 327.5 million → 2035: USD 482.2 million)
- 11.1.2 Market Volume and Quantity Sold
- 11.1.3 Historical Market Size, 2018-2025
- 11.1.4 Base-Year Market Size, 2025
- 11.2 Market Forecast, 2025-2035
- 11.2.1 Revenue Forecast to 2035
- 11.2.2 Volume Forecast to 2035
- 11.2.3 CAGR and Year-on-Year Growth
- 11.2.4 Incremental Revenue Opportunity
- 11.3 Forecast Assumptions and Scenario Analysis
- 11.3.1 Base-Case Forecast
- 11.3.2 Optimistic and Conservative Scenarios
- 11.3.3 Technology, Pricing and Policy Sensitivities
- 11.4 Market Attractiveness and Growth Outlook
Chapter 12 Australia Electroplating Market Segmentation and Outlook
- 12.1 Segmentation Summary and Market Shares, 2025
- 12.2 Largest and Fastest-Growing Segments
- 12.3 By Service Type - Market Size and Forecast, 2025-2035
- 12.3.1 Segment Definition and Scope
- 12.3.2 Historical Market Size, 2018-2025
- 12.3.3 Revenue Forecast, 2025-2035
- 12.3.4 Volume Forecast, 2025-2035
- 12.3.5 Base-Year Market Share, 2025
- 12.3.6 Segment CAGR and Growth Drivers
- 12.3.7 Subsegment Market Size and Forecast
- 12.3.7.1 Zinc plating
- 12.3.7.2 Nickel plating
- 12.3.7.3 Chrome plating
- 12.3.7.4 Conductive and specialist plating
- 12.3.8 Subsegment Pricing and Adoption Trends
- 12.3.9 Leading Suppliers and Competition
- 12.3.10 Regional Demand and Opportunities
- 12.4 By End-Use Industry - Market Size and Forecast, 2025-2035
- 12.4.1 Segment Definition and Scope
- 12.4.2 Historical Market Size, 2018-2025
- 12.4.3 Revenue Forecast, 2025-2035
- 12.4.4 Volume Forecast, 2025-2035
- 12.4.5 Base-Year Market Share, 2025
- 12.4.6 Segment CAGR and Growth Drivers
- 12.4.7 Subsegment Market Size and Forecast
- 12.4.7.1 Aerospace and defence
- 12.4.7.2 Automotive
- 12.4.7.3 Mining
- 12.4.7.4 Manufacturing and specialist services
- 12.4.8 Subsegment Pricing and Adoption Trends
- 12.4.9 Leading Suppliers and Competition
- 12.4.10 Regional Demand and Opportunities
- 12.5 By Application - Market Size and Forecast, 2025-2035
- 12.5.1 Segment Definition and Scope
- 12.5.2 Historical Market Size, 2018-2025
- 12.5.3 Revenue Forecast, 2025-2035
- 12.5.4 Volume Forecast, 2025-2035
- 12.5.5 Base-Year Market Share, 2025
- 12.5.6 Segment CAGR and Growth Drivers
- 12.5.7 Subsegment Market Size and Forecast
- 12.5.7.1 Corrosion protection
- 12.5.7.2 Wear resistance and restoration
- 12.5.7.3 Electrical functionality
- 12.5.7.4 Decorative finishing
- 12.5.8 Subsegment Pricing and Adoption Trends
- 12.5.9 Leading Suppliers and Competition
- 12.5.10 Regional Demand and Opportunities
- 12.6 By Sales Channel - Market Size and Forecast, 2025-2035
- 12.6.1 Segment Definition and Scope
- 12.6.2 Historical Market Size, 2018-2025
- 12.6.3 Revenue Forecast, 2025-2035
- 12.6.4 Volume Forecast, 2025-2035
- 12.6.5 Base-Year Market Share, 2025
- 12.6.6 Segment CAGR and Growth Drivers
- 12.6.7 Subsegment Market Size and Forecast
- 12.6.7.1 Direct account contracts
- 12.6.7.2 Competitive tenders
- 12.6.7.3 Engineering intermediaries
- 12.6.7.4 Spot quotations
- 12.6.8 Subsegment Pricing and Adoption Trends
- 12.6.9 Leading Suppliers and Competition
- 12.6.10 Regional Demand and Opportunities
- 12.7 Segment Growth Comparison
- 12.8 Segment Attractiveness and Priority Matrix
Chapter 13 Australia Electroplating End-Use and Application Market Outlook
- 13.1 End-Use Industry and Customer Demand Structure
- 13.2 Leading Applications and Customer Groups
- 13.3 End-Use Market Size, Share and Forecast
- 13.4 Major End-Use Industry Deep Dives
- 13.4.1 Customer Requirements and Use Cases
- 13.4.2 Demand and Replacement Cycles
- 13.4.3 Technical and Regulatory Considerations
- 13.4.4 Purchasing and Procurement Models
- 13.4.5 Leading Vendors and Distribution Channels
- 13.4.6 Forecast and Commercial Opportunities
- 13.5 Emerging Applications and Cross-Segment Demand
- 13.6 End-Use Industry Investment Priorities
Chapter 14 Australia Electroplating Geographic Market Outlook, 2025-2035
- 14.1 Domestic Market Distribution and Demand Clusters
- 14.2 State- or Province-Wise Market Size and Forecast, 2025-2035
- 14.3 City and Metropolitan Market Outlook
- 14.4 Industrial, Manufacturing and Commercial Clusters
- 14.5 Geographic Concentration of Key End Users
- 14.6 Local Pricing and Purchasing Differences
- 14.7 Domestic Production Facilities and Capacity Map
- 14.8 Local Infrastructure and Project Pipeline
- 14.9 State-Level Policy and Incentive Differences
- 14.10 Subnational Investment Hotspots and Opportunities
- 14.11 Distribution and Logistics Networks
- 14.12 Domestic Competitive Footprint
Chapter 15 Australia Electroplating Technology, Innovation and Sustainability Outlook
- 15.1 Technology Landscape and Maturity
- 15.2 Product, Process and Service Innovation
- 15.3 AI, Automation and Digital Tools in the Industry
- 15.4 Technology Adoption and Performance Benchmarking
- 15.5 Innovation Pipeline and R&D Investment
- 15.6 Patent and Intellectual Property Trends
- 15.7 Energy Efficiency and Resource Management
- 15.8 Sustainability, Recycling and Circularity
- 15.9 Technology Roadmap, 2025-2035
- 15.10 Risks of Obsolescence and Technology Substitution
Chapter 16 Australia Electroplating Market Key Strategic Imperatives
- 16.1 Growth and Market Entry Priorities
- 16.2 High-Return Products and Segments
- 16.3 Pricing, Profitability and Cost Optimization
- 16.4 Technology Investment and Product Differentiation
- 16.5 Supply Chain Localization and Resilience
- 16.6 Distribution and Customer Acquisition
- 16.7 Partnership, Acquisition and Capacity Strategy
- 16.8 Regional Expansion Priorities
- 16.9 Short-, Medium- and Long-Term Actions
Chapter 17 Competition Outlook
- 17.1 Industry Competition Characteristics
- 17.2 Market Structure and Concentration
- 17.3 Market Share and Competitive Positioning, 2025
- 17.4 Company-Wise Revenue and Product Benchmarking
- 17.5 Production and Service Capacity Benchmarking
- 17.6 Technology, Pricing and Differentiation
- 17.7 Regional Footprint and Distribution Strength
- 17.8 Mergers, Acquisitions and Strategic Alliances
- 17.9 New Entrants and Competitive Threats
- 17.10 Porter's Five Forces and Industry Attractiveness
- 17.11 Competitive Outlook, 2025-2035
Chapter 18 Company Profiles
- 18.1 Company Coverage and Selection Criteria
- 18.2 Precision Plating (Aust) Pty Ltd
- 18.2.1 Business Description
- 18.2.2 Company Ownership and Geographic Presence
- 18.2.3 Product and Service Portfolio
- 18.2.4 Manufacturing and Operating Footprint
- 18.2.5 Production Capacity and Expansion Plans
- 18.2.6 Financial Performance and Investment
- 18.2.7 Market Share and Competitive Position
- 18.2.8 Technology and Innovation Capabilities
- 18.2.9 Strategic Alliances or Partnerships
- 18.2.10 Recent Developments
- 18.2.11 Growth Strategy and Outlook
- 18.3 Electromold Australia
- 18.4 Australian Surface Technologies
- 18.5 Industrial & Decorative Plating Co Pty Ltd
- 18.6 S E C Plating Pty Ltd
- 18.7 Other Relevant Market Participants
Note: Every listed company is profiled on the structure shown under the first company. The company list is preliminary and may change based on research findings, market developments, data availability and client requirements.
Chapter 19 Disclaimer
- 19.1 Research and Forecast Disclaimer
- 19.2 Data Source and Estimation Limitations
Note: The depth of individual sections depends on data availability for this market. Volume, capacity, trade and other unit-based metrics are included where applicable.

