
Warehouse growth keeps hired lift fleets in steady demand
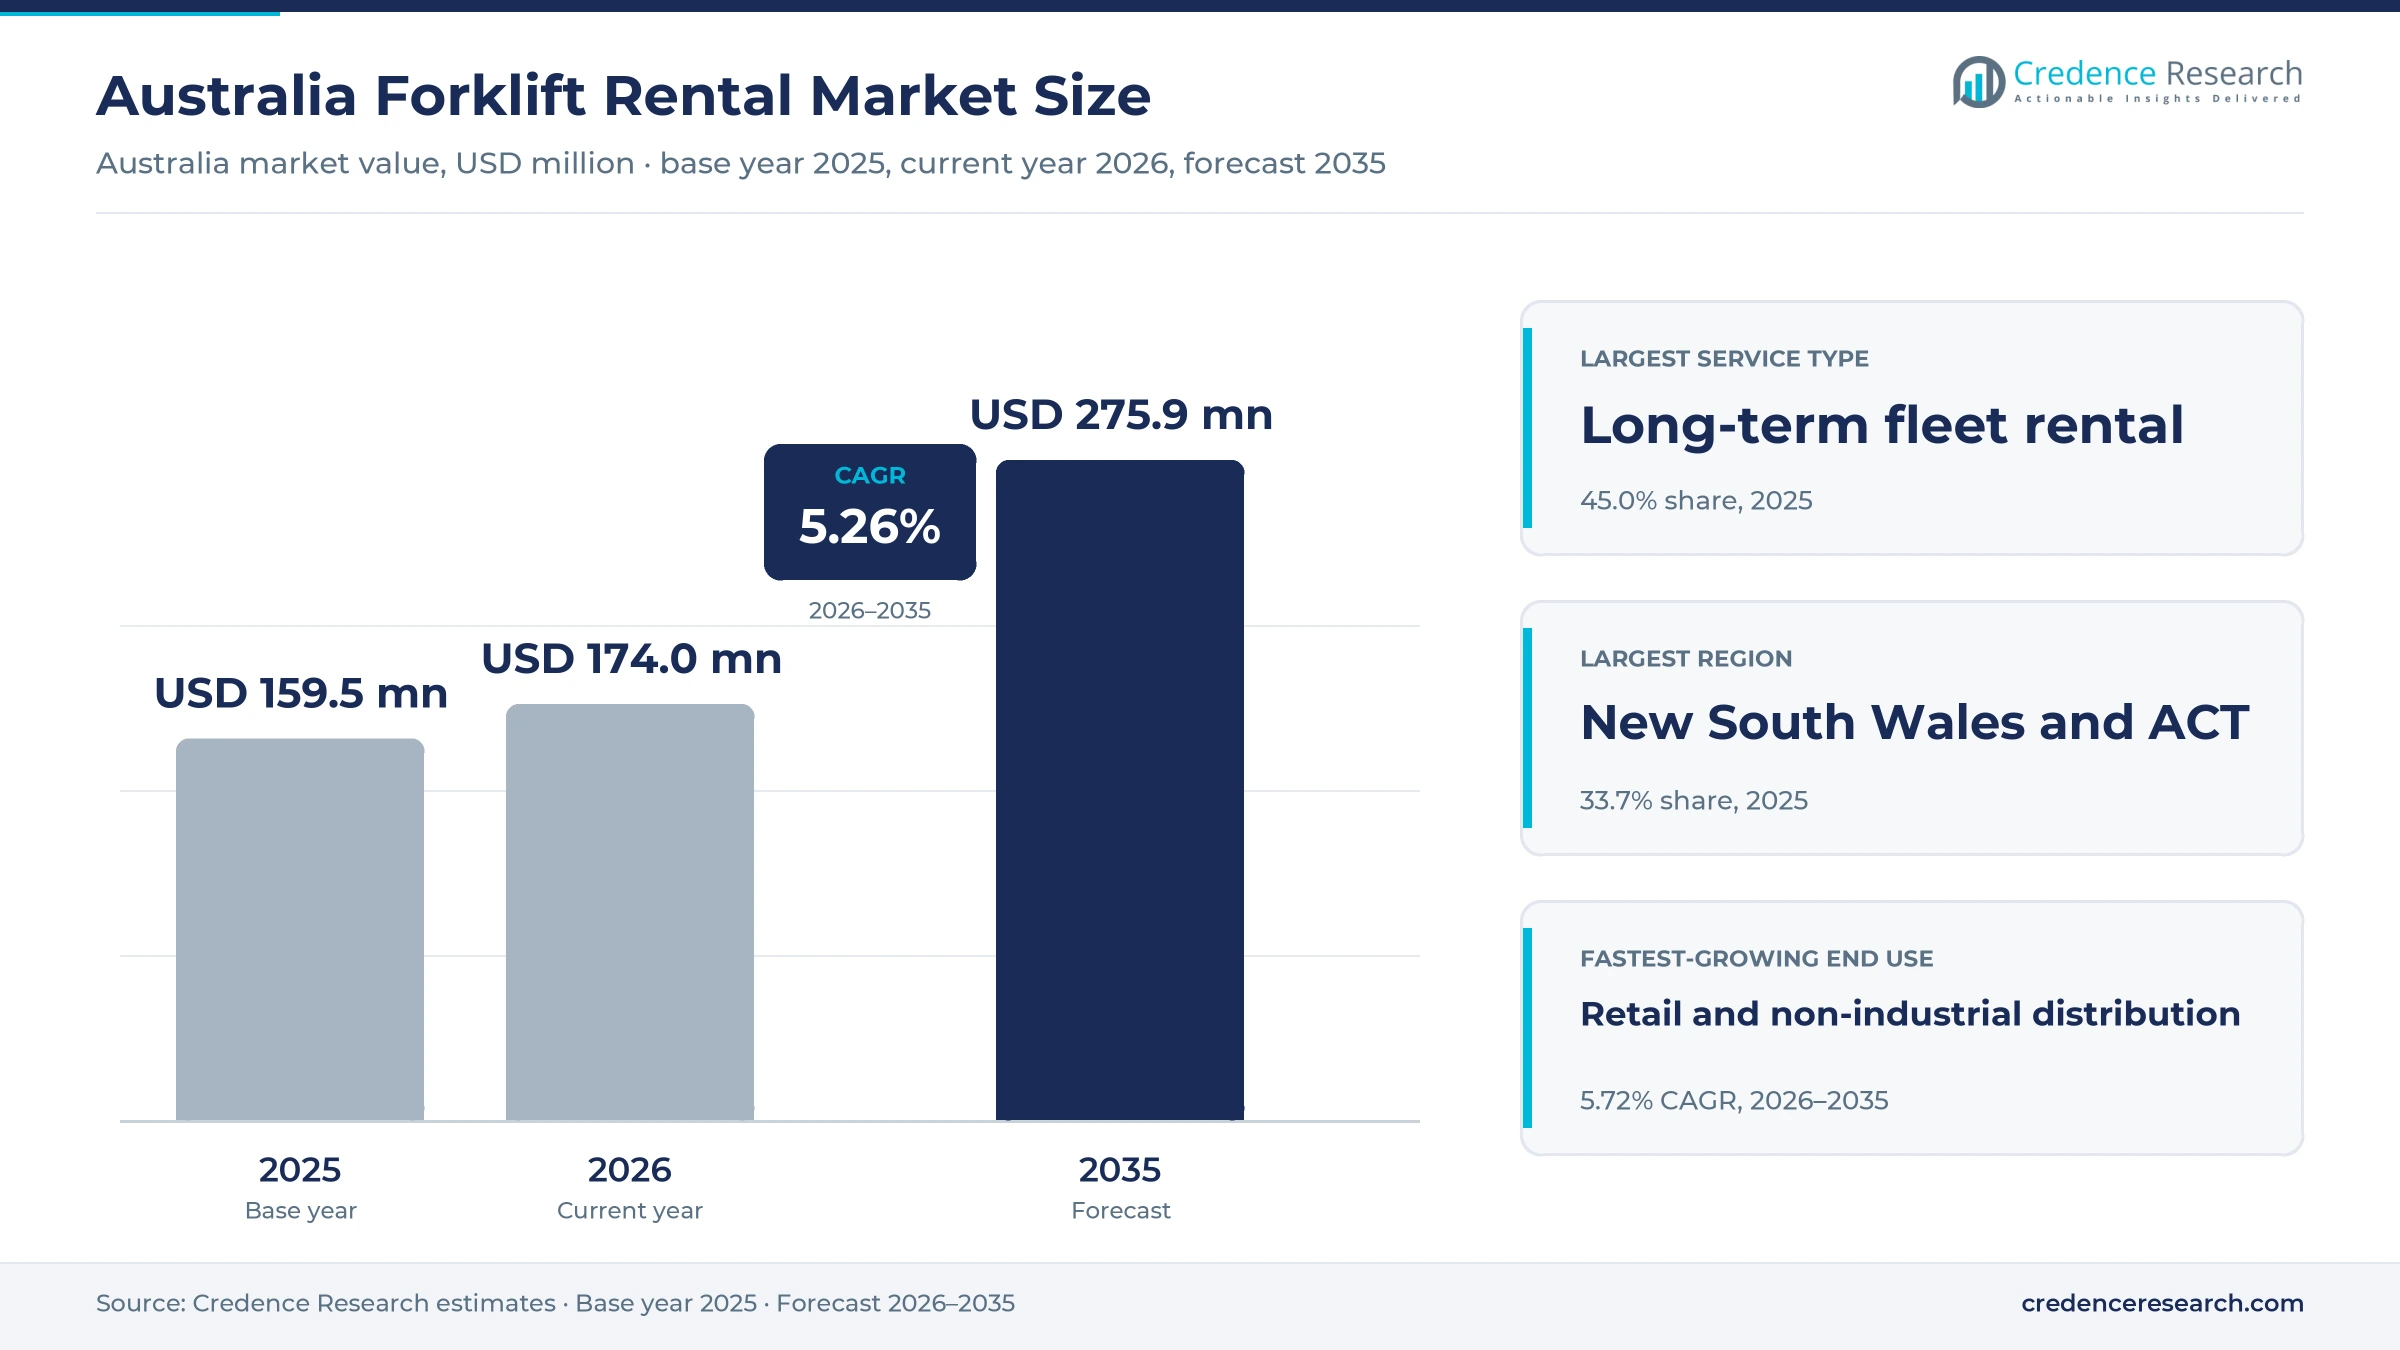
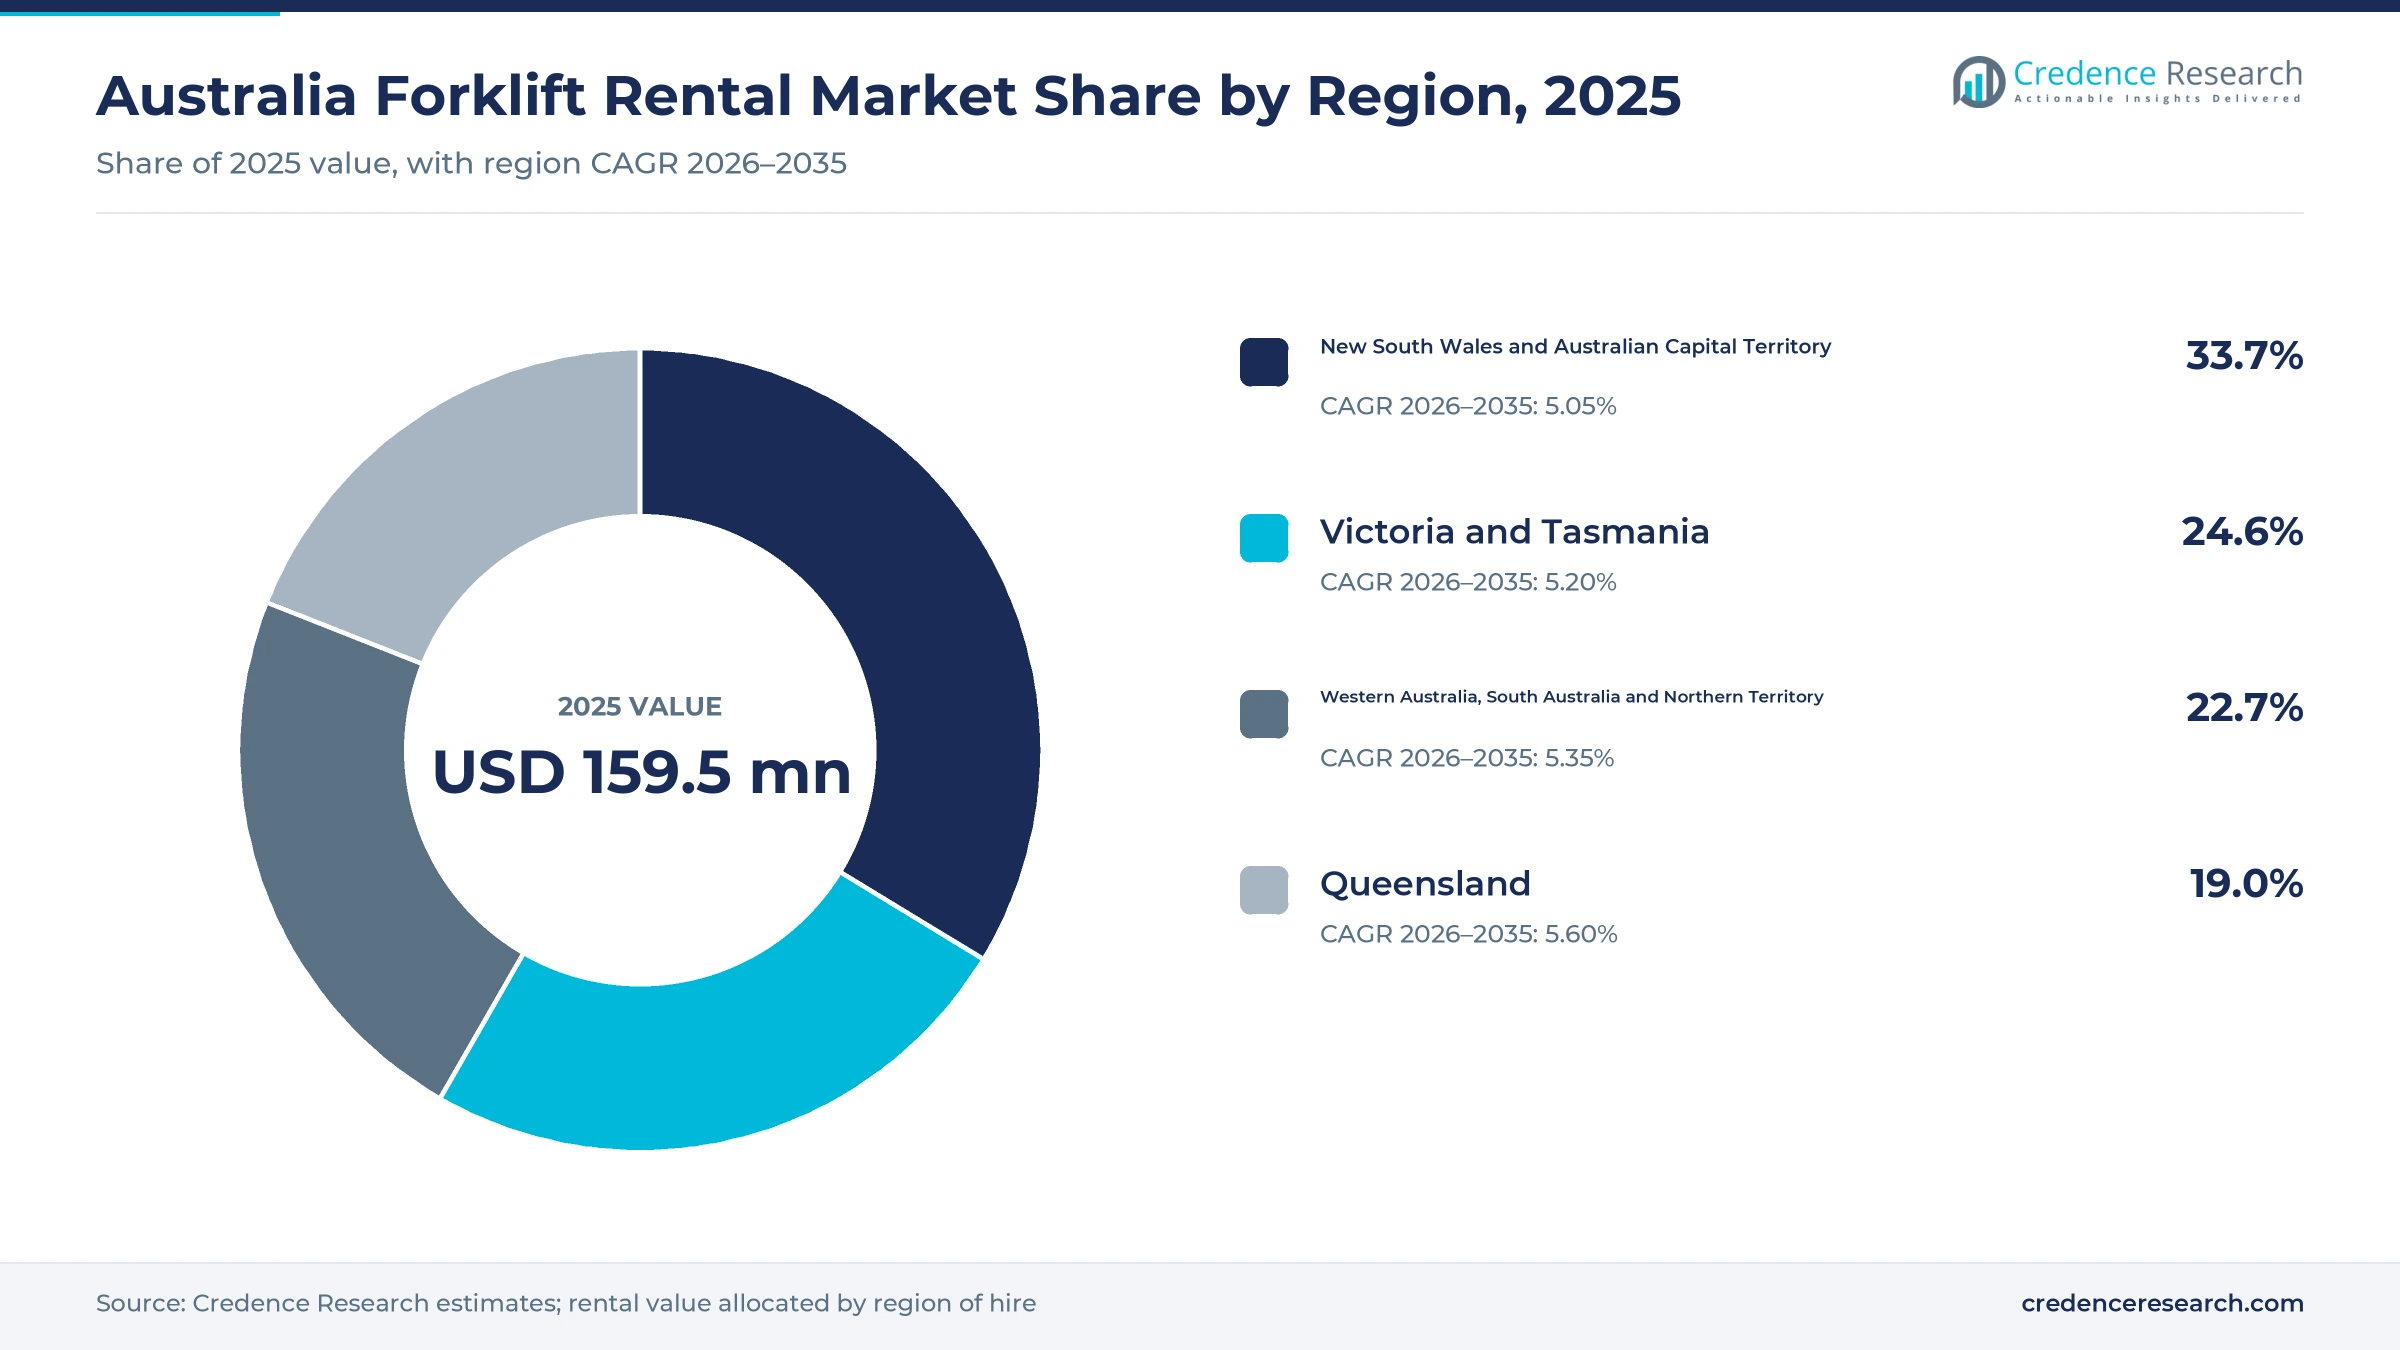
The Australia forklift rental market was valued at USD 159.5 million in 2025 and is projected to increase from USD 174.0 million in 2026 to USD 275.9 million by 2035, registering a CAGR of 5.26% during 2026–2035. Demand comes from logistics operators, manufacturers, retailers, distributors and construction contractors that hire counterbalance, reach and pallet-handling trucks instead of buying them outright. New South Wales and Australian Capital Territory held the largest regional share, 33.7% in 2025, because Sydney hosts the densest cluster of distribution centers and freight terminals. Queensland is the fastest-growing region at 5.60% a year, as population growth and new industrial estates lift handling needs. Supply is also changing, because original equipment makers and independent specialists are adding branches, acquiring regional dealers and offering terms from one day to five years. As a result, hirers can match fleet size to seasonal peaks, new sites and project schedules.
Which hire services and buyers does the estimate cover?
The estimate measures rental and lease payments for counterbalance trucks, reach trucks, order pickers, stackers and powered pallet movers hired in Australia. Values cover short-term hire, medium-term operating leases and long-term fleet rentals, including maintenance bundled into hire rates that businesses pay to rental providers.
The estimate excludes outright equipment sales, finance leases that transfer ownership, operator labor hire and stand-alone parts sales. The value chain runs from overseas truck makers through factory-owned branches, dealers, independent specialists and general hire networks to warehouses, factories, retailers and project sites across every state and territory.
Australia Forklift Rental Market Insights
- The Australia forklift rental market was valued at USD 159.5 million in 2025 and is projected to reach USD 275.9 million by 2035, registering a CAGR of 5.26% during 2026–2035.
- New South Wales and Australian Capital Territory held a 33.7% share of 2025 value, because Sydney hosts the largest cluster of distribution centers.
- Long-term fleet rental led with a 45.0% share of 2025 value, because large warehouse operators rent whole fleets with bundled servicing.
- Hangcha Equipment Rental Australia opened in Sydney on May 8, 2026, which added another factory-backed rental supplier to the market.
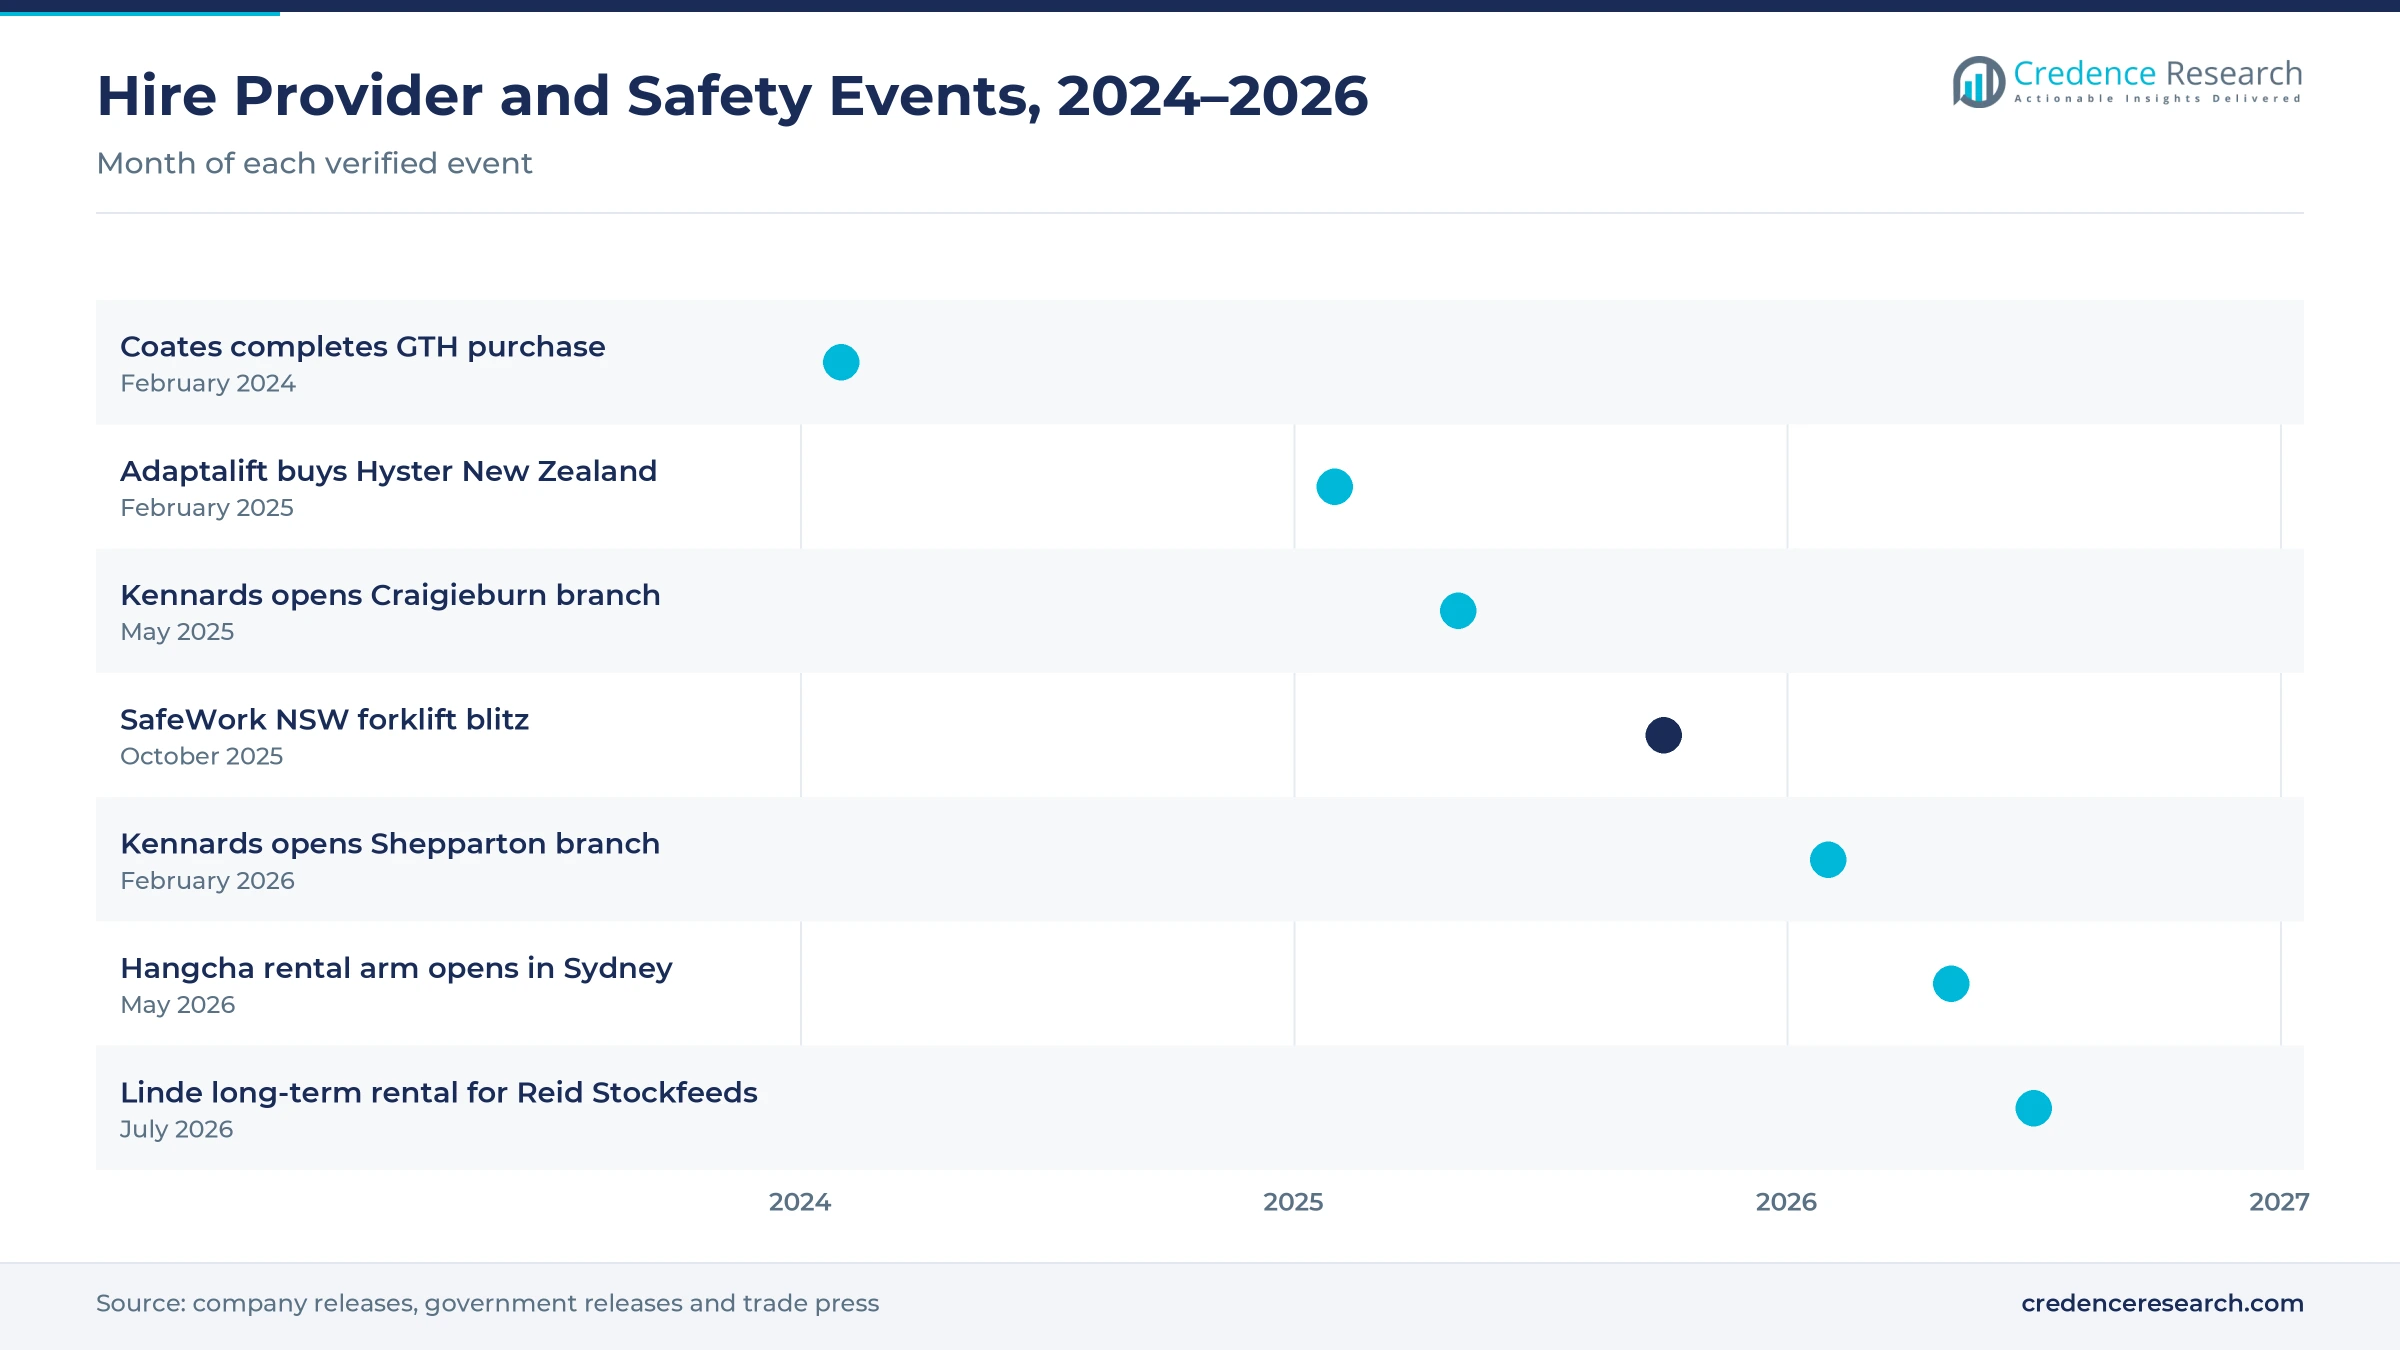
- Coates completed its purchase of GTH Equipment on Feb. 9, 2024, adding more than 650 machines, while Adaptalift bought Hyster New Zealand in February 2025.
Long-term fleets lead as retail distribution grows fastest
Why does long-term fleet rental lead service demand?
Based on service type, the market is categorized into short-term hire, medium-term operating lease and long-term fleet rental. Long-Term Fleet Rental led with a 45.0% share of 2025 value, because warehouse operators rent whole fleets with servicing for several years. Short-Term Hire grows fastest at 5.67% a year, as retailers and logistics firms add trucks for seasonal peaks and new sites.
How does logistics and warehousing dominate hire demand?
Based on end-use industry, the market is categorized into logistics and warehousing, manufacturing, retail and non-industrial distribution, and construction and resources. Logistics and Warehousing led with 42.0% of 2025 value, because distribution centers run large rented fleets. Retail and Non-Industrial Distribution grows fastest at 5.72% a year, as online orders lift picking and loading work.
Why do national multi-site accounts lead purchases?
Based on customer type, the market is categorized into national multi-site accounts, regional multi-site accounts and single-site business accounts. National Multi-Site Accounts led with 44.0% of 2025 value, because large retailers and logistics groups sign fleet contracts across many states. Regional Multi-Site Accounts grows fastest at 5.61% a year, as providers add branches in regional cities.
Why do OEM-owned rental operations lead supply?
Based on operating model, the market is categorized into OEM-owned rental operations, independent forklift specialists and diversified equipment hire operations. OEM-Owned Rental Operations led with 55.0% of 2025 value, because factory-owned networks hold the largest fleets and service teams. Diversified Equipment Hire Operations grows fastest at 5.70% a year, as general hire networks add handling equipment to project sites.
| Segment Group | Leading Sub-segment | Share, 2025 | Fastest-growing Sub-segment | CAGR, 2026–2035 |
|---|---|---|---|---|
| By Service Type | Long-Term Fleet Rental | 45.0% | Short-Term Hire | 5.67% |
| By End-Use Industry | Logistics and Warehousing | 42.0% | Retail and Non-Industrial Distribution | 5.72% |
| By Customer Type | National Multi-Site Accounts | 44.0% | Regional Multi-Site Accounts | 5.61% |
| By Operating Model | OEM-Owned Rental Operations | 55.0% | Diversified Equipment Hire Operations | 5.70% |
Request a Free Sample
Fill in your details and we'll send you a free sample report.
- Sample data tables & charts
- Research methodology
Warehouses, flexible access and projects lift hire demand
How does warehouse account formation sustain hire demand?
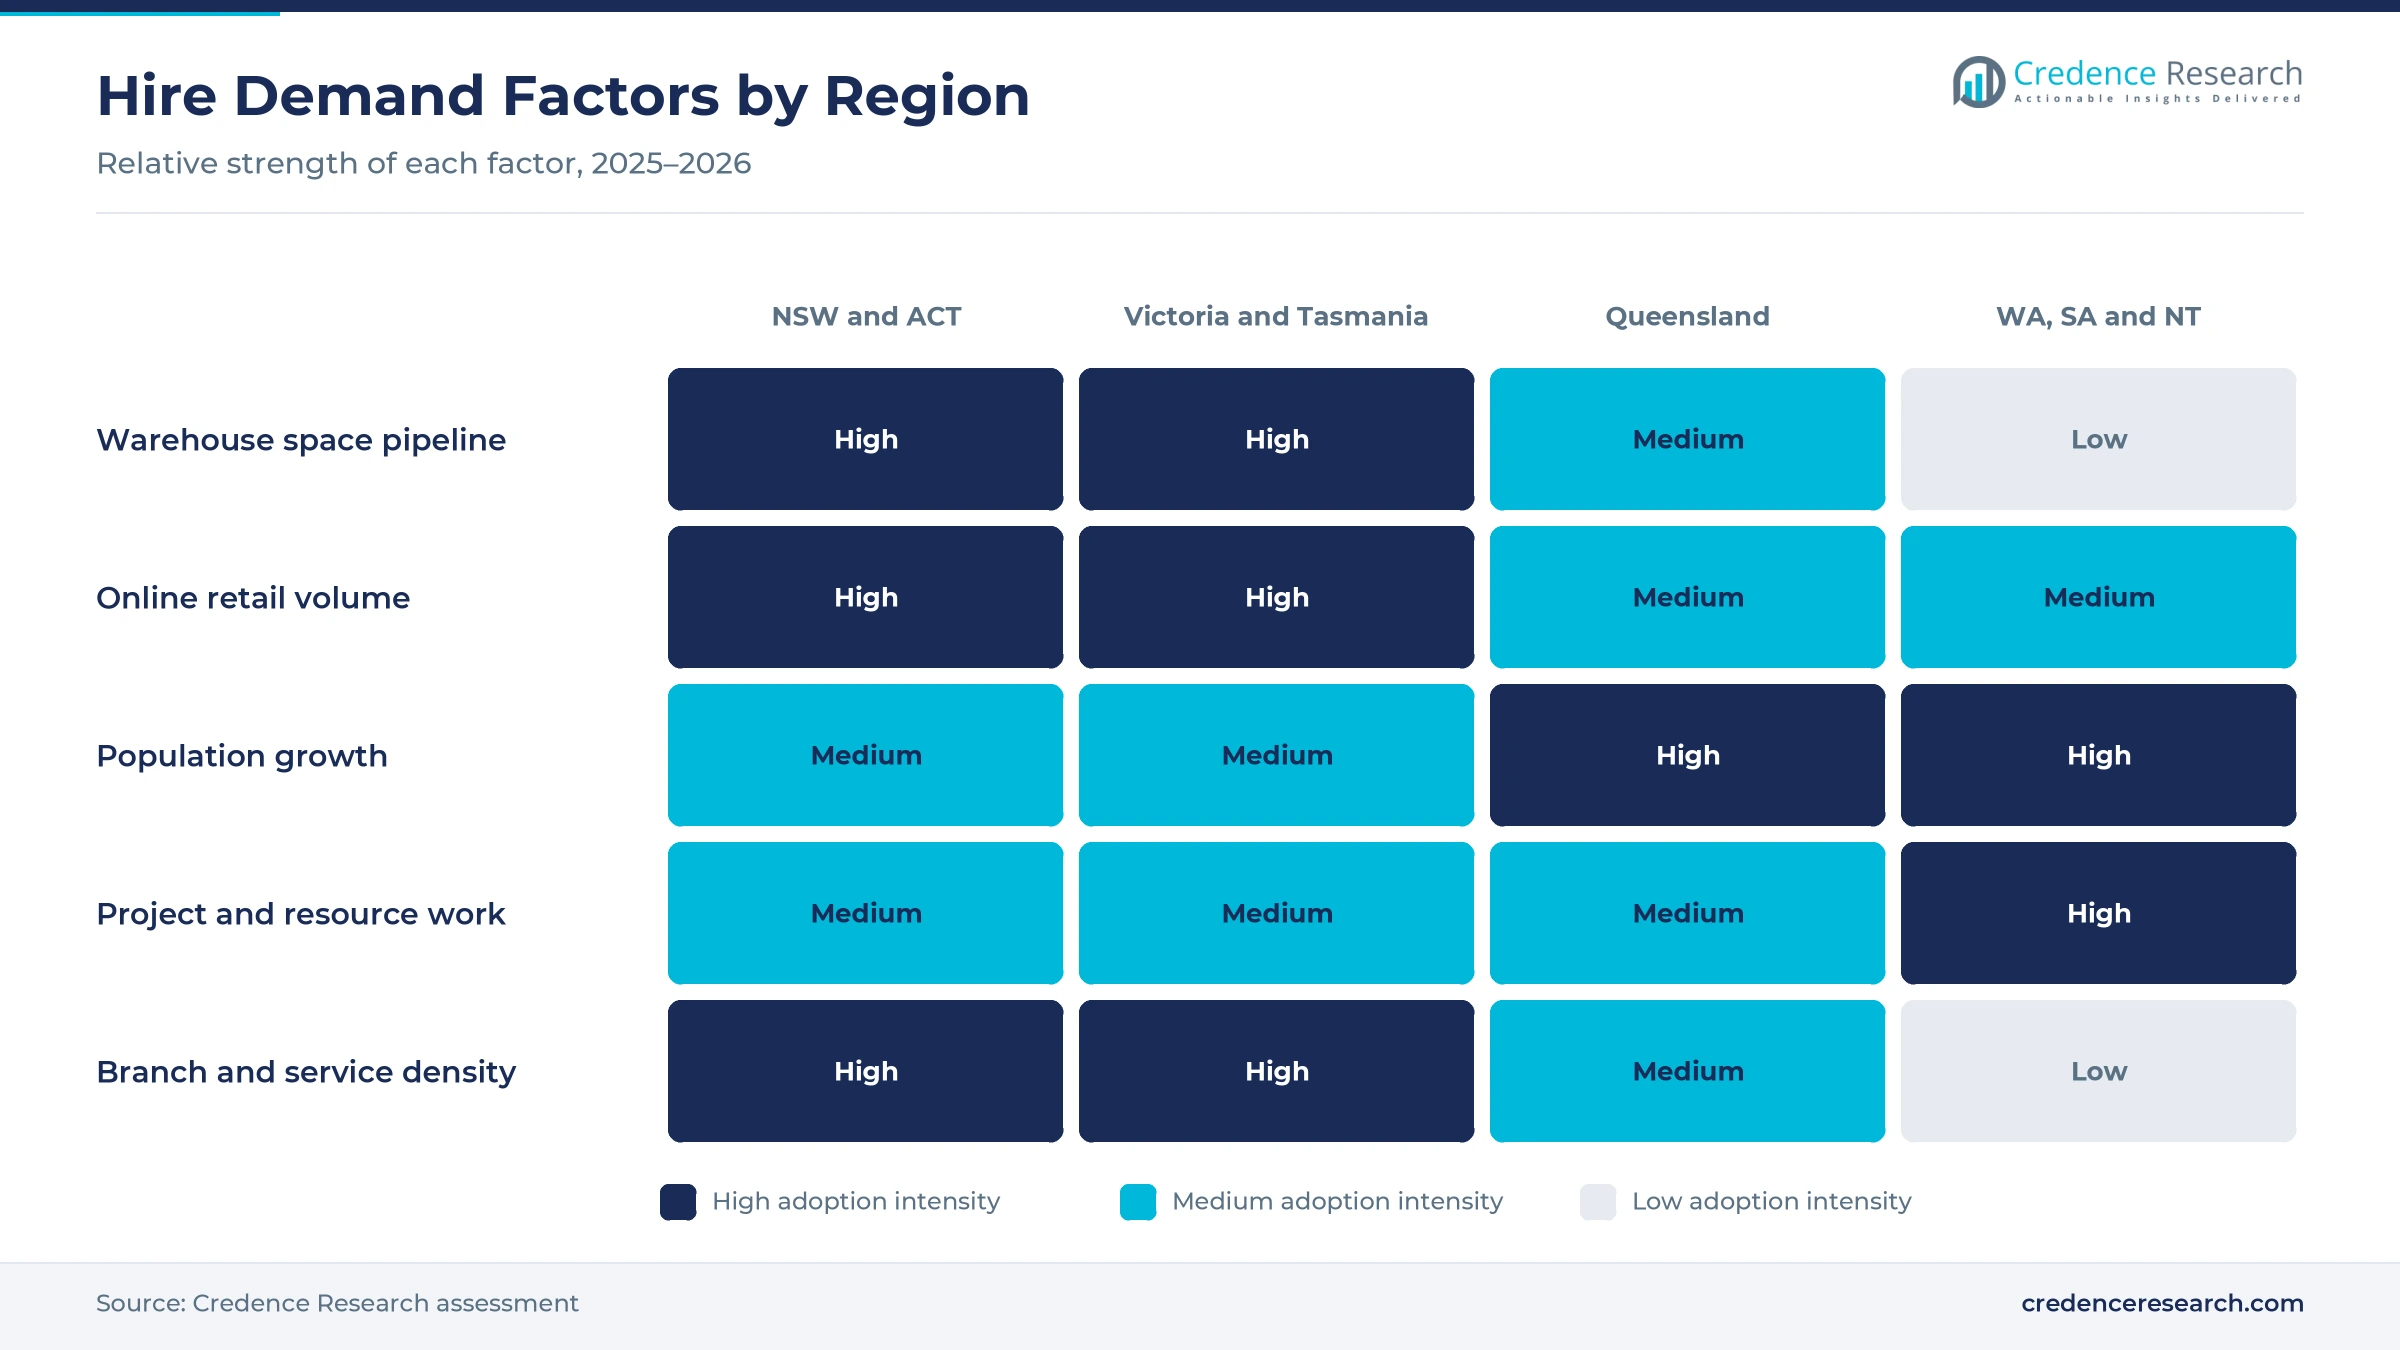
Warehouse account formation sustains hire demand, because every new distribution center needs a fleet of counterbalance, reach and pallet trucks from opening day. Industrial completions were forecast at 2.3 million square meters in 2025 after 2.6 million in 2024, according to the Property Council of Australia. Sydney alone was expected to complete about 887,000 square meters in 2025, which adds new sites for logistics tenants. Australian container ports also handled about 9.58 million TEU in 2024, according to World Bank data, which keeps unloading and storage work high. As a result, logistics and warehousing held 42.0% of 2025 value, as third-party warehousing and distribution operators sign multi-year fleet contracts.
Why does flexible equipment access favor hiring over buying?
Flexible equipment access favors hiring over buying, because businesses can scale fleets up or down without tying capital to trucks that sit idle after peaks. Toyota Material Handling Australia lists more than 35,000 trucks for hire nationwide, with short-term hire from one day and long-term rental up to five years, according to its hire and rental page. The company also says short-term units can reach most metropolitan sites within 24 hours. Fork Force Australia runs a hire fleet of about 4,000 units, with short-term terms under three months and long-term terms beyond that. In turn, short-term hire grows fastest at 5.67% a year, as retailers and freight firms add trucks for Christmas peaks and new contracts.
How does project-based materials handling add demand?
Project-based materials handling adds demand, because builders, miners and infrastructure contractors need lifting equipment only for the life of a job. Engineering construction work done was about A$37.2 billion in the June quarter of 2026, while work commenced rose 20.7% to about A$37.6 billion, according to the Australian Bureau of Statistics. Coates completed its purchase of Sydney telehandler provider GTH Equipment on Feb. 9, 2024, adding more than 650 machines to a network of about 150 branches. United Forklift and Access Solutions, based in Perth, had 455 employees and 11 locations in July 2024. As a result, diversified operators that offer general equipment hire grow fastest among operating models at 5.70% a year.
Why do safety duties push firms toward serviced fleets?
Safety duties push firms toward serviced fleets, because rented trucks come with scheduled maintenance, inspections and repairs handled by the provider. More than 600 forklift incidents were reported to SafeWork NSW since January 2024, and four of them were fatal, according to the New South Wales government. The same release said 70% of these incidents occurred in manufacturing, postal, transport and warehousing, and more than 250 inspectors began unannounced checks in October 2025. Toyota long-term agreements include scheduled servicing, preventive maintenance and fair wear and tear repairs. In turn, national multi-site accounts held 44.0% of 2025 value, as large employers prefer one provider that keeps trucks maintained across every site.
Consolidation and new OEM rental arms reshape supply
How is the shift toward acquisitions consolidating supply?
The shift toward acquisitions is consolidating supply, because larger providers buy regional dealers to gain customers, technicians and branch sites. Adaptalift Group, the largest privately owned truck company in Australia, agreed on Feb. 6, 2025, to buy Hyster New Zealand, with completion set for Feb. 28, 2025. Adaptalift has also acquired Forklogic, a sales, hire and service provider, to strengthen its presence in regional markets. Fork Force Australia combined Lencrow Material Handling and Hystandard into one business with a fleet of about 4,000 units. As a result, regional multi-site accounts grow fastest at 5.61% a year, as buyers in regional cities gain access to national fleets and service teams.
Why is the rise of factory-backed rental arms notable?
The rise of factory-backed rental arms is notable, because truck makers want direct customer relationships and steady service income across the life of each unit. Hangcha Equipment Rental Australia opened in Sydney on May 8, 2026, offering short-term and long-term rentals with more than 2,000 square meters of local warehousing. Its Melbourne entity, HC Forklift Australia, was set up in 2022. Toyota Material Handling Australia runs factory-owned branches in every state and territory, backed by more than 500 service staff and more than 300 mobile service vans. In turn, OEM-owned rental operations held 55.0% of 2025 value, as lift truck makers bundle supply, servicing and parts.
Is there room to grow in Queensland and the western states?
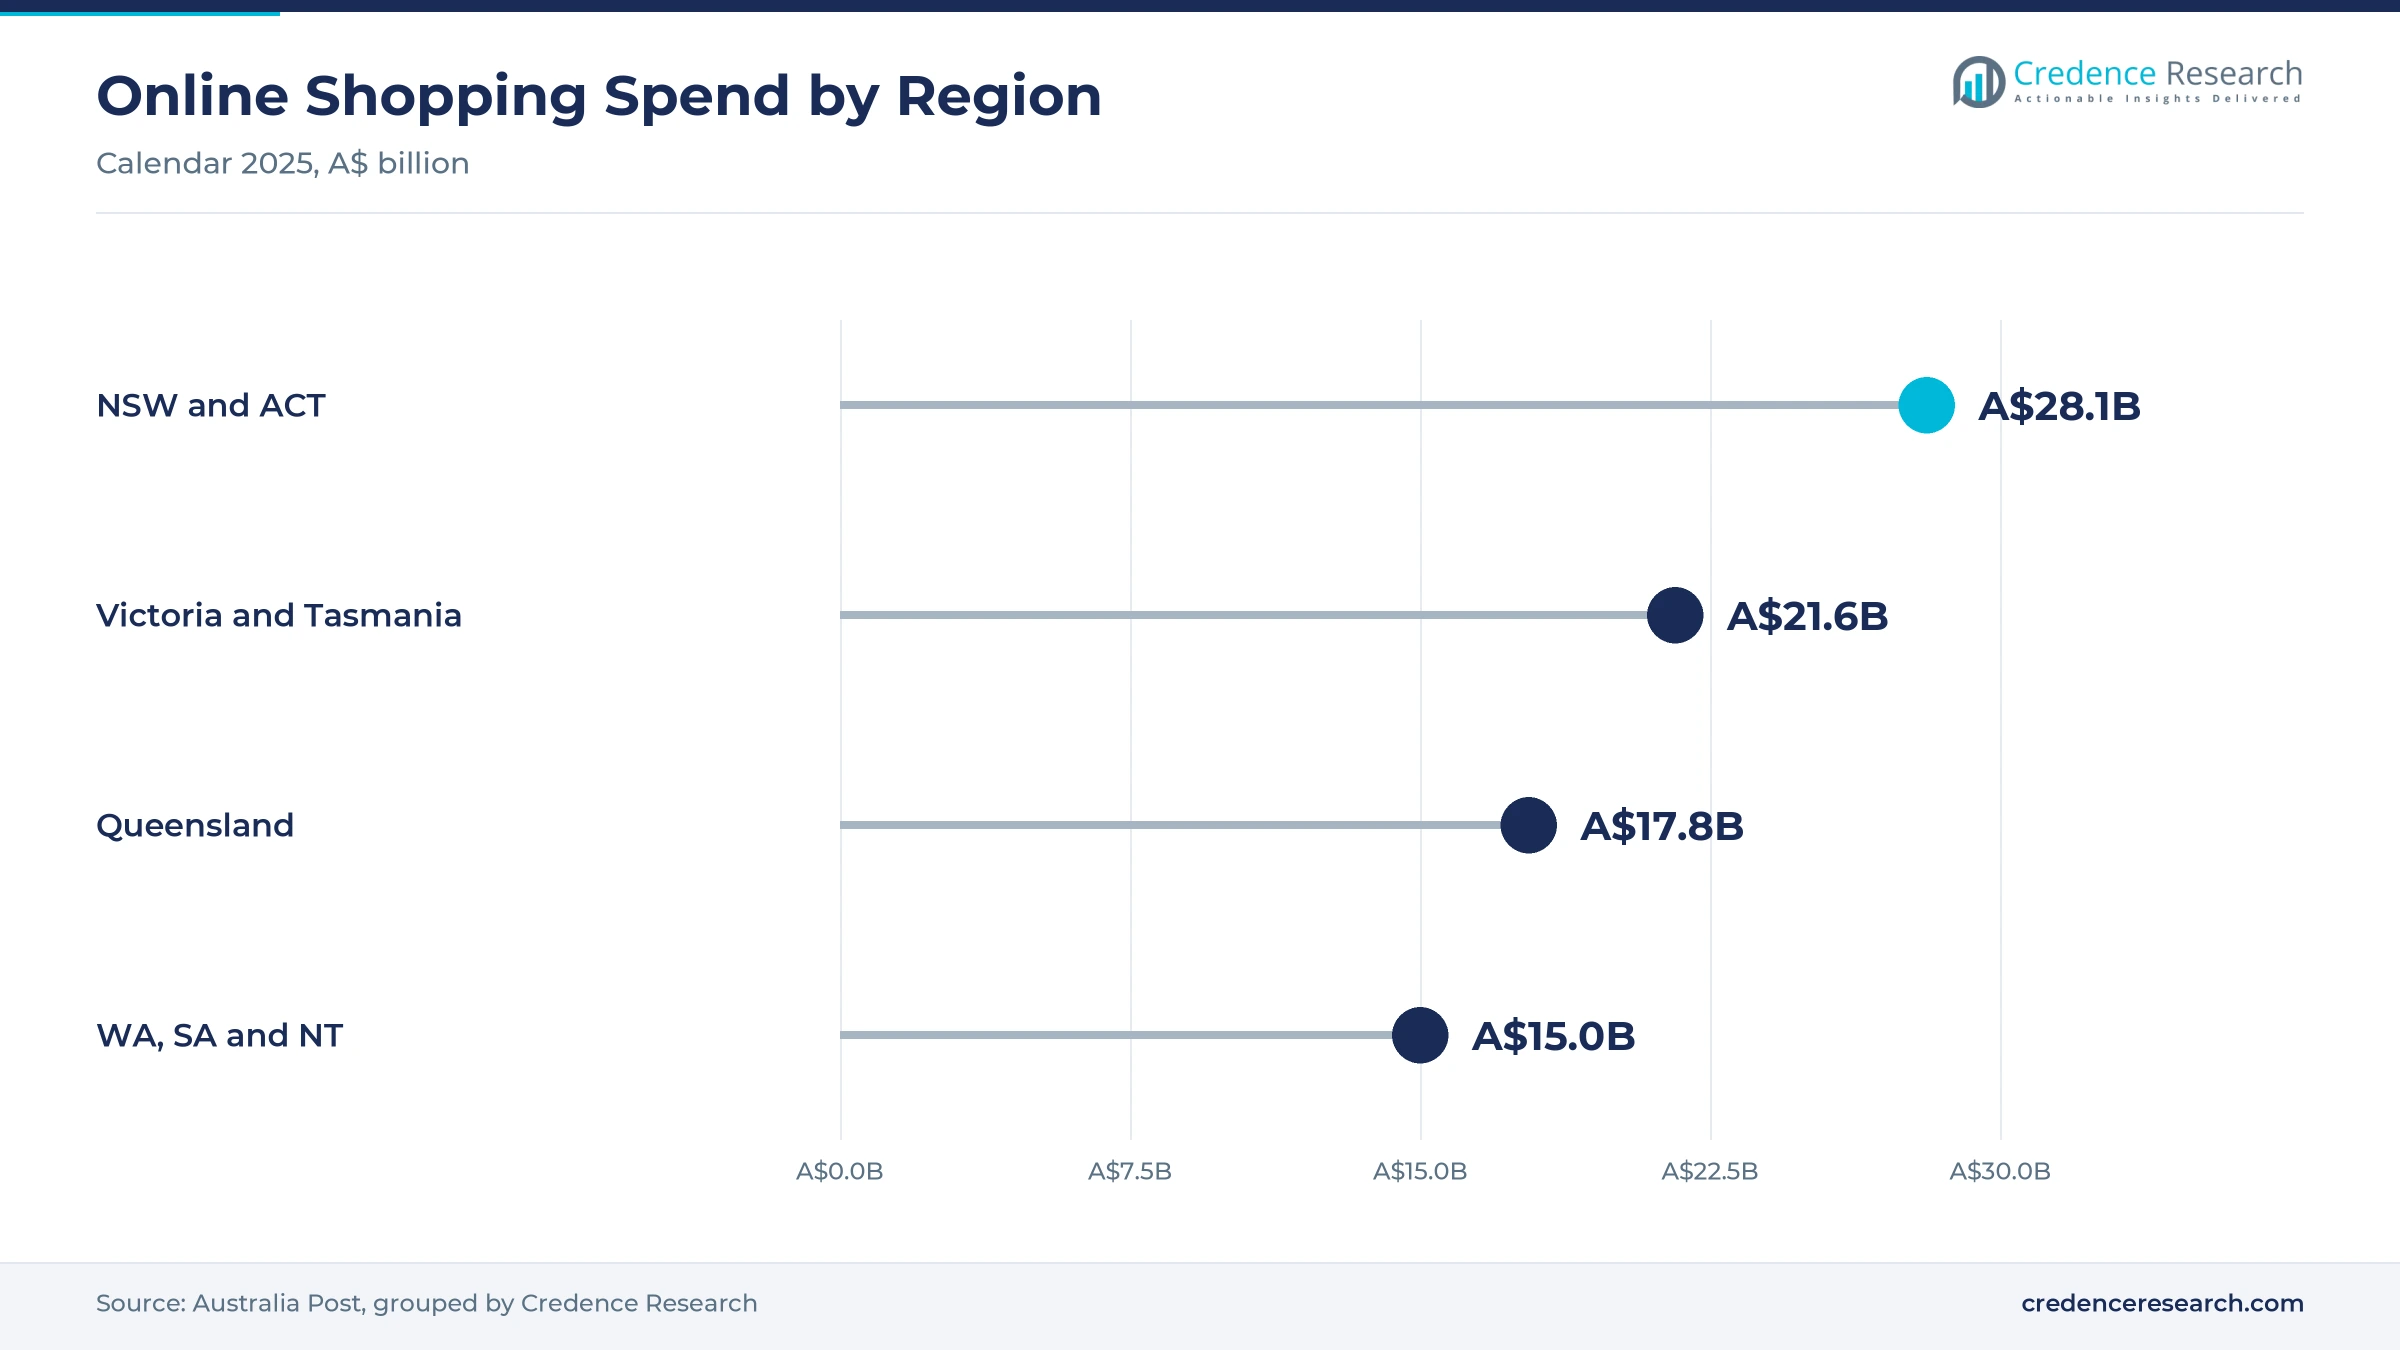
Queensland and the western states leave room to grow, because population gains and new industrial estates add distribution sites each year. Queensland added about 90,100 residents in the year to March 31, 2026, while Western Australia grew fastest of all states at 2.1%, according to the Australian Bureau of Statistics. Brisbane was expected to complete about 567,000 square meters of industrial space in 2025. Queensland shoppers also spent about A$17.8 billion online in 2025, according to Australia Post data, which lifts parcel and warehouse handling in the state. As a result, Queensland leads regional growth, as new estates in the south east sign fleet contracts for logistics tenants.
Can electric fleets and telematics open new hire value?
Electric fleets and telematics can open new hire value, because providers can bundle batteries, chargers and monitoring software into rental rates. Linde Material Handling reported in July 2026 that Reid Stockfeeds moved to a long-term rental of six trucks, including three electric units, across five sites. The same agreement uses FleetFOCUS for digital pre-start checks, impact monitoring and operator access controls. Adaptalift also sells and leases telemetry systems alongside its trucks, which lets hirers track use across each site. In turn, long-term fleet rental held 45.0% of 2025 value, as hirers adopt lithium-ion battery packs without carrying the upfront cost themselves.
Fleet costs, safety duties and utilization weigh on hirers
How do fleet replacement costs squeeze provider margins?
Fleet replacement costs squeeze provider margins, because most trucks are imported and priced in foreign currency. Smaller independent hirers feel this most, since they cannot spread purchase costs over very large fleets. As a result, some providers keep older units in service longer or raise hire rates. Providers respond with longer contracts, refurbishment programs and used truck sales. Stable exchange rates should ease pressure on fleet renewal over time.
Why do operator licensing and safety duties slow hiring?
Operator licensing and safety duties slow some hiring, because every operator needs a current high risk work licence before using a truck. Small businesses that lack licensed staff may delay short-term hires or choose manual handling instead. In turn, providers must check licences and site conditions before delivery. Many providers respond with operator training, safety audits and pedestrian warning lights. Wider operator training should support steady hire demand across the country.
How does low utilization weaken short-term hire returns?
Low utilization weakens short-term hire returns, because trucks return between peaks and sit idle in branch yards. Seasonal demand from retailers and harvest operators makes fleet planning harder for regional branches. As a result, providers carry higher holding costs per hire day. Providers respond with online booking, transfers between branches and flexible pricing. Better demand forecasting should lift utilization across the whole year.
Why does technician scarcity limit service reach?
Technician scarcity limits service reach, because rental contracts promise fast repairs and planned maintenance at customer sites. Regional and remote areas have fewer qualified technicians, which lengthens response times for breakdowns. In turn, customers may face downtime that erodes the value of hiring. Providers respond with mobile service vans, apprenticeship programs and remote diagnostics. A larger technician pool should improve uptime for hired fleets.
New South Wales and ACT lead while Queensland grows fastest
| Region | Value, 2025 (USD million) | Share, 2025 | CAGR, 2026–2035 |
|---|---|---|---|
| New South Wales and Australian Capital Territory | 53.8 | 33.7% | 5.05% |
| Victoria and Tasmania | 39.2 | 24.6% | 5.20% |
| Western Australia, South Australia and Northern Territory | 36.2 | 22.7% | 5.35% |
| Queensland | 30.3 | 19.0% | 5.60% |
Why do New South Wales and the ACT hold the largest share?
New South Wales and Australian Capital Territory held 33.7% of 2025 value and grow at 5.05% a year, because Sydney hosts the largest cluster of distribution centers and freight terminals. New South Wales had about 8.67 million residents at March 31, 2026, while the ACT had about 490,000. Shoppers in New South Wales also spent about A$26.4 billion online in 2025, the highest of any state. As a result, warehouses in western and southern Sydney run large rented fleets.
How do Victoria and Tasmania sustain hire demand?
Victoria and Tasmania held 24.6% of 2025 value and grow at 5.20% a year, because Melbourne is a major port, manufacturing and distribution hub. Victoria added about 109,500 residents in the year to March 2026, the largest increase of any state. Melbourne was expected to complete about 634,000 square meters of industrial space in 2025 after more than 1 million in 2024. In turn, new estates in the south east and west of Melbourne add fleet contracts for logistics tenants.
Why is Queensland the fastest-growing region?
Queensland held 19.0% of 2025 value and grows fastest at 5.60% a year, because population growth and new industrial estates add distribution sites in the south east. The state had about 5.74 million residents at March 31, 2026, after growing 1.6% over the year. Brisbane was expected to complete about 567,000 square meters of industrial space in 2025. As a result, providers such as Kennards Hire have opened new branches in the state, including Gympie in May 2026.
How do the western, southern and northern states add demand?
Western Australia, South Australia and Northern Territory held 22.7% of 2025 value and grow at 5.35% a year, because mining supply, ports and food processing need handling equipment. Western Australia recorded the fastest state population growth at 2.1% in the year to March 2026. United Forklift and Access Solutions is based in Perth and serves resource and construction clients, which ties hire demand to project activity across the region.
Acquisitions and new rental branches marked 2024 to 2026
| Development | Status and market relevance |
|---|---|
| In February 2024, Coates completed its purchase of Sydney telehandler hire provider GTH Equipment, adding more than 650 machines. | Expands diversified hire capacity in western Sydney |
| In February 2025, Adaptalift Group agreed to buy Hyster New Zealand, with completion set for the end of that month. | Strengthens the largest privately owned truck provider |
| In May 2025, Kennards Hire opened a branch at Craigieburn in Victoria, extending its network in northern Melbourne. | Adds general hire access near growing industrial estates |
| In October 2025, SafeWork NSW began a compliance blitz focused on forklift safety across New South Wales workplaces. | Raises attention to maintained fleets and licensed operators |
| In May 2026, Hangcha Equipment Rental Australia opened in Sydney, offering short-term and long-term rentals. | Adds another factory-backed rental supplier |
Electric drives and fleet telematics shape hired fleets
- Electric counterbalance trucks suit indoor warehouses and cold stores, which makes them the default choice for many distribution fleets.
- Engine-powered trucks running on LPG, petrol or diesel handle outdoor yards, gravel surfaces and heavy loads, which keeps them in demand on project sites.
- Lithium-ion batteries allow fast opportunity charging during breaks, which lets rented electric fleets run multiple shifts with fewer spare batteries.
- Fleet telematics record pre-start checks, impacts and operator access, which helps providers plan servicing and helps hirers meet safety duties through connected monitoring tools.
Need a Custom Version of This Report?
Tailor the scope, geography, or segments to your exact requirements.
- Custom geography or segment scope
- Direct access to our analyst team
Suppliers compete on fleet size, service reach and uptime
Competition centers on fleet size, branch reach, service response and the range of hire terms. Toyota Material Handling Australia lists more than 35,000 trucks for hire and runs factory-owned branches in every state and territory. Adaptalift Group is the largest privately owned provider and has been the sole Hyster-Yale dealer in Australia since 2009. Linde Material Handling offers long-term rentals with fleet monitoring, while Crown Equipment offers short-term and long-term rentals with maintenance included. Fork Force Australia runs a hire fleet of about 4,000 units after combining Lencrow Material Handling and Hystandard. Coates and Kennards Hire add handling equipment through broad general hire networks, and United Forklift and Access Solutions serves clients from 11 locations. Because national accounts sign multi-year fleet contracts, providers with large fleets and dense service teams hold an advantage in tenders.
Companies profiled and their roles in this market
| Company | Type | Role in the market |
|---|---|---|
| Toyota Material Handling Australia | OEM-owned rental operation | Lists more than 35,000 trucks for hire nationwide |
| Adaptalift Group | Independent specialist | Sole Hyster-Yale dealer in Australia since 2009 |
| Linde Material Handling Australia | OEM-owned rental operation | Offers long-term rentals with FleetFOCUS monitoring |
| Crown Equipment Australia | OEM-owned rental operation | Offers short-term and long-term rentals with maintenance |
| ForkForce Australia | Independent specialist | Runs about 4,000 hire units after absorbing Lencrow |
| Coates | Diversified equipment hire | Added more than 650 machines with GTH Equipment in 2024 |
| Kennards Hire | Diversified equipment hire | Opened new branches in Victoria and Queensland in 2025 and 2026 |
| United Forklift and Access Solutions | Independent specialist | Perth-based provider with 11 locations in 2024 |
Credence Research view on Australian lift truck hire
Credence Research's view is that Australian demand for hired lift trucks will grow steadily because new warehouses, online retail and project work keep fleets in use. Long-term fleet rental keeps the largest share, while short-term hire grows fastest as businesses manage seasonal peaks. Queensland should grow fastest among the regions through 2035 as its population and industrial estates expand. However, import costs, technician shortages and utilization swings will pressure margins. Providers with large fleets, dense service networks and bundled monitoring should gain share fastest.
Industry data and company releases anchor the hire model
The report uses 2025 as the base year on a calendar basis, and market values come from the Credence Research model. That model combines population statistics, construction activity data, World Bank port data, industrial property releases, online retail data, safety regulator releases and company releases. Segment splits and regional growth rates are Credence Research estimates, while regional shares follow the client-defined split. Sources used are official statistics, government releases, industry association releases, trade press and company releases, and no interviews or surveys were used.
Warehouse expansion carries hire demand through 2035
Hire spending is expected to reach USD 275.9 million by 2035, a 5.26% CAGR during 2026–2035, as warehouse growth, online retail and project work keep fleets busy. Growth should hold firm through 2030 as new industrial estates open around Sydney, Melbourne and Brisbane. After that, the pace of electric fleet adoption and automation will shape demand. Faster warehouse automation could reduce truck counts per site, while stronger project activity would favor short-term hire. Regional multi-site accounts are expected to gain share as providers extend branches beyond capital cities.
Frequently Asked Questions
How big is the Australia forklift rental market?
Which service type leads demand in Australia?
Which region leads the Australian market?
Why does logistics and warehousing lead end use?
How do safety rules affect hire demand?
Which operating model grows fastest?
Who are the leading providers in Australia?
What are the main challenges for providers?
Table of Content
Chapter 1 Market Segmentation
- 1.1 Segmentation Framework
- 1.1.1 Product and Service Classification
- 1.1.2 Application and End-Use Classification
- 1.1.3 Technology and Solution Classification
- 1.1.4 Customer and Distribution Channel Classification
- 1.1.5 Geographic Segmentation
- 1.1.6 Market Segment Definitions and Boundaries
- 1.2 By Service Type
- 1.2.1 Short-Term Hire
- 1.2.2 Medium-Term Operating Lease
- 1.2.3 Long-Term Fleet Rental
- 1.3 By End-Use Industry
- 1.3.1 Logistics and Warehousing
- 1.3.2 Manufacturing
- 1.3.3 Retail and Non-Industrial Distribution
- 1.3.4 Construction and Resources
- 1.4 By Customer Type
- 1.4.1 National Multi-Site Accounts
- 1.4.2 Regional Multi-Site Accounts
- 1.4.3 Single-Site Business Accounts
- 1.5 By Operating Model
- 1.5.1 OEM-Owned Rental Operations
- 1.5.2 Independent Forklift Specialists
- 1.5.3 Diversified Equipment Hire Operations
Chapter 2 Introduction
- 2.1 Report Objectives and Scope
- 2.2 Product Definition and Industry Terminology
- 2.3 Market Inclusions and Exclusions
- 2.4 Research Process
- 2.4.1 Primary Research and Expert Interviews
- 2.4.2 Secondary Research and Source Review
- 2.4.3 Top-Down and Bottom-Up Estimation
- 2.4.4 Data Triangulation and Verification
- 2.5 Market Size Measurement Basis
- 2.5.1 2025: USD 159.5 million → 2035: USD 275.9 million
- 2.6 Historical and Forecast Reference Periods
- 2.6.1 Historical Period: 2018-2025
- 2.6.2 Base Year: 2025
- 2.6.3 Forecast Period: 2025-2035
- 2.7 Research Assumptions and Limitations
Chapter 3 Executive Summary
- 3.1 Market Snapshot and Key Findings
- 3.2 Base-Year Market Size, 2025
- 3.3 Forecast Market Size, 2035
- 3.4 Revenue and Volume Growth Outlook
- 3.5 Key Demand and Supply Indicators
- 3.6 Leading Market Segments
- 3.7 Fastest-Growing Market Opportunities
- 3.8 Regional Performance Highlights
- 3.9 Technology and Industry Transformation
- 3.10 Competitive Landscape Summary
- 3.11 Analyst View and Strategic Implications
Chapter 4 Australia Forklift Rental Market Trends and Developments
- 4.1 Historical Industry Development, 2018-2025
- 4.2 Recent Market Trends and Developments
- 4.3 Demand and Customer Behavior Trends
- 4.4 Technology and Product Innovation
- 4.5 Artificial Intelligence, Automation and Digitalization
- 4.6 Local Manufacturing and Supply Chain Realignment
- 4.7 Industry Partnerships, Mergers and Acquisitions
- 4.8 Sustainability and Circular Economy Developments
- 4.9 Government and Private Sector Investment Trends
- 4.10 Emerging Business Models and Commercialization
- 4.11 Industry Developments and Announcements
Chapter 5 Australia Forklift Rental Market Production, Supply and Demand Analysis
- 5.1 Demand Trend and Consumption Analysis, 2018-2025
- 5.2 Demand Forecast, 2025-2035
- 5.3 Production and Output Trend, 2018-2025
- 5.4 Production and Output Forecast, 2025-2035
- 5.5 Installed Capacity and Capacity Utilization
- 5.6 Company-Wise Production Plants and Statistics
- 5.6.1 Installed Production Capacity
- 5.6.2 Actual Production
- 5.6.3 Planned Capacity and Expansion Targets
- 5.7 Supply Chain Structure and Procurement Trends
- 5.8 Supply-Demand Gap and Bottlenecks
- 5.9 Import Dependence and Sourcing Structure
- 5.10 Contract Manufacturing and Outsourcing
- 5.11 Regional Supply and Demand Concentration
Chapter 6 Australia Forklift Rental Market Pricing Analysis
- 6.1 Pricing Structure and Measurement
- 6.2 Historical Pricing Trends, 2018-2025
- 6.3 Pricing Outlook, 2025-2035
- 6.4 Average Selling Price and Unit Economics
- 6.5 Pricing by Product and Market Segment
- 6.6 Geographic Pricing Differences
- 6.7 Key Input, Energy, Labor and Logistics Costs
- 6.8 Contract Pricing and Purchasing Models
- 6.9 Pricing Sensitivity and Competitive Positioning
- 6.10 Price, Margin and Profitability Implications
Chapter 7 Australia Forklift Rental Market Dynamics
- 7.1 Market Growth Drivers
- 7.1.1 Demand-Side Drivers
- 7.1.2 Technology and Innovation Drivers
- 7.1.3 Infrastructure and Investment Drivers
- 7.1.4 Regulatory and Policy Drivers
- 7.2 Market Restraints
- 7.2.1 Cost and Affordability Constraints
- 7.2.2 Technology and Adoption Barriers
- 7.2.3 Supply Chain and Operational Constraints
- 7.3 Market Challenges
- 7.3.1 Competitive Pressure and Margin Erosion
- 7.3.2 Skills, Infrastructure and Implementation Gaps
- 7.4 Emerging Market Opportunities
- 7.5 Market Dynamics Impact and Time-Horizon Assessment
Chapter 8 Australia Forklift Rental Value Chain Analysis
- 8.1 Industry Value Chain Overview
- 8.2 Upstream Suppliers and Critical Inputs
- 8.3 Technology and Component Providers
- 8.4 Manufacturing or Service Delivery
- 8.5 Distribution, Channel Partners and Integrators
- 8.6 Downstream Applications and End Users
- 8.7 Value Addition and Profit Pools
- 8.8 Vertical Integration and Outsourcing
- 8.9 Supplier Concentration and Risk
- 8.10 Supply Chain Localization and Resilience
Chapter 9 Australia Forklift Rental Market Regulations and Policies
- 9.1 Relevant Laws, Standards and Compliance Frameworks
- 9.2 Product, Service, Safety and Quality Requirements
- 9.3 Government Policies, Incentives and Subsidies
- 9.4 Imports, Exports and Trade Barriers
- 9.5 Public Procurement and Local Content Requirements
- 9.6 Environmental and Sustainability Compliance
- 9.7 Upcoming Policy Changes and Market Implications
Chapter 10 Australia Forklift Rental Market Hotspots and Opportunities
- 10.1 Market Opportunity Mapping and Growth Hotspots
- 10.2 High-Growth Applications and Customer Groups
- 10.3 Underserved Markets and White-Space Opportunities
- 10.4 Emerging Technology and Product Opportunities
- 10.5 New Capacity and Investment Hotspots
- 10.6 Market Entry and Expansion Opportunities
- 10.7 Distribution and Partnership Opportunities
- 10.8 Near-Term and Long-Term Commercial Potential
- 10.9 Opportunity Attractiveness and Execution Risks
Chapter 11 Australia Forklift Rental Market Outlook, 2025-2035
- 11.1 Market Size and Analysis
- 11.1.1 Revenue (Market Measurement: 2025: USD 159.5 million → 2035: USD 275.9 million)
- 11.1.2 Market Volume and Quantity Sold
- 11.1.3 Historical Market Size, 2018-2025
- 11.1.4 Base-Year Market Size, 2025
- 11.2 Market Forecast, 2025-2035
- 11.2.1 Revenue Forecast to 2035
- 11.2.2 Volume Forecast to 2035
- 11.2.3 CAGR and Year-on-Year Growth
- 11.2.4 Incremental Revenue Opportunity
- 11.3 Forecast Assumptions and Scenario Analysis
- 11.3.1 Base-Case Forecast
- 11.3.2 Optimistic and Conservative Scenarios
- 11.3.3 Technology, Pricing and Policy Sensitivities
- 11.4 Market Attractiveness and Growth Outlook
Chapter 12 Australia Forklift Rental Market Segmentation and Outlook
- 12.1 Segmentation Summary and Market Shares, 2025
- 12.2 Largest and Fastest-Growing Segments
- 12.3 By Service Type - Market Size and Forecast, 2025-2035
- 12.3.1 Segment Definition and Scope
- 12.3.2 Historical Market Size, 2018-2025
- 12.3.3 Revenue Forecast, 2025-2035
- 12.3.4 Volume Forecast, 2025-2035
- 12.3.5 Base-Year Market Share, 2025
- 12.3.6 Segment CAGR and Growth Drivers
- 12.3.7 Subsegment Market Size and Forecast
- 12.3.7.1 Short-Term Hire
- 12.3.7.2 Medium-Term Operating Lease
- 12.3.7.3 Long-Term Fleet Rental
- 12.3.8 Subsegment Pricing and Adoption Trends
- 12.3.9 Leading Suppliers and Competition
- 12.3.10 Regional Demand and Opportunities
- 12.4 By End-Use Industry - Market Size and Forecast, 2025-2035
- 12.4.1 Segment Definition and Scope
- 12.4.2 Historical Market Size, 2018-2025
- 12.4.3 Revenue Forecast, 2025-2035
- 12.4.4 Volume Forecast, 2025-2035
- 12.4.5 Base-Year Market Share, 2025
- 12.4.6 Segment CAGR and Growth Drivers
- 12.4.7 Subsegment Market Size and Forecast
- 12.4.7.1 Logistics and Warehousing
- 12.4.7.2 Manufacturing
- 12.4.7.3 Retail and Non-Industrial Distribution
- 12.4.7.4 Construction and Resources
- 12.4.8 Subsegment Pricing and Adoption Trends
- 12.4.9 Leading Suppliers and Competition
- 12.4.10 Regional Demand and Opportunities
- 12.5 By Customer Type - Market Size and Forecast, 2025-2035
- 12.5.1 Segment Definition and Scope
- 12.5.2 Historical Market Size, 2018-2025
- 12.5.3 Revenue Forecast, 2025-2035
- 12.5.4 Volume Forecast, 2025-2035
- 12.5.5 Base-Year Market Share, 2025
- 12.5.6 Segment CAGR and Growth Drivers
- 12.5.7 Subsegment Market Size and Forecast
- 12.5.7.1 National Multi-Site Accounts
- 12.5.7.2 Regional Multi-Site Accounts
- 12.5.7.3 Single-Site Business Accounts
- 12.5.8 Subsegment Pricing and Adoption Trends
- 12.5.9 Leading Suppliers and Competition
- 12.5.10 Regional Demand and Opportunities
- 12.6 By Operating Model - Market Size and Forecast, 2025-2035
- 12.6.1 Segment Definition and Scope
- 12.6.2 Historical Market Size, 2018-2025
- 12.6.3 Revenue Forecast, 2025-2035
- 12.6.4 Volume Forecast, 2025-2035
- 12.6.5 Base-Year Market Share, 2025
- 12.6.6 Segment CAGR and Growth Drivers
- 12.6.7 Subsegment Market Size and Forecast
- 12.6.7.1 OEM-Owned Rental Operations
- 12.6.7.2 Independent Forklift Specialists
- 12.6.7.3 Diversified Equipment Hire Operations
- 12.6.8 Subsegment Pricing and Adoption Trends
- 12.6.9 Leading Suppliers and Competition
- 12.6.10 Regional Demand and Opportunities
- 12.7 Segment Growth Comparison
- 12.8 Segment Attractiveness and Priority Matrix
Chapter 13 Australia Forklift Rental End-Use and Application Market Outlook
- 13.1 End-Use Industry and Customer Demand Structure
- 13.2 Leading Applications and Customer Groups
- 13.3 End-Use Market Size, Share and Forecast
- 13.4 Major End-Use Industry Deep Dives
- 13.4.1 Customer Requirements and Use Cases
- 13.4.2 Demand and Replacement Cycles
- 13.4.3 Technical and Regulatory Considerations
- 13.4.4 Purchasing and Procurement Models
- 13.4.5 Leading Vendors and Distribution Channels
- 13.4.6 Forecast and Commercial Opportunities
- 13.5 Emerging Applications and Cross-Segment Demand
- 13.6 End-Use Industry Investment Priorities
Chapter 14 Australia Forklift Rental Geographic Market Outlook, 2025-2035
- 14.1 Domestic Market Distribution and Demand Clusters
- 14.2 State- or Province-Wise Market Size and Forecast, 2025-2035
- 14.3 City and Metropolitan Market Outlook
- 14.4 Industrial, Manufacturing and Commercial Clusters
- 14.5 Geographic Concentration of Key End Users
- 14.6 Local Pricing and Purchasing Differences
- 14.7 Domestic Production Facilities and Capacity Map
- 14.8 Local Infrastructure and Project Pipeline
- 14.9 State-Level Policy and Incentive Differences
- 14.10 Subnational Investment Hotspots and Opportunities
- 14.11 Distribution and Logistics Networks
- 14.12 Domestic Competitive Footprint
Chapter 15 Australia Forklift Rental Technology, Innovation and Sustainability Outlook
- 15.1 Technology Landscape and Maturity
- 15.2 Product, Process and Service Innovation
- 15.3 AI, Automation and Digital Tools in the Industry
- 15.4 Technology Adoption and Performance Benchmarking
- 15.5 Innovation Pipeline and R&D Investment
- 15.6 Patent and Intellectual Property Trends
- 15.7 Energy Efficiency and Resource Management
- 15.8 Sustainability, Recycling and Circularity
- 15.9 Technology Roadmap, 2025-2035
- 15.10 Risks of Obsolescence and Technology Substitution
Chapter 16 Australia Forklift Rental Market Key Strategic Imperatives
- 16.1 Growth and Market Entry Priorities
- 16.2 High-Return Products and Segments
- 16.3 Pricing, Profitability and Cost Optimization
- 16.4 Technology Investment and Product Differentiation
- 16.5 Supply Chain Localization and Resilience
- 16.6 Distribution and Customer Acquisition
- 16.7 Partnership, Acquisition and Capacity Strategy
- 16.8 Regional Expansion Priorities
- 16.9 Short-, Medium- and Long-Term Actions
Chapter 17 Competition Outlook
- 17.1 Industry Competition Characteristics
- 17.2 Market Structure and Concentration
- 17.3 Market Share and Competitive Positioning, 2025
- 17.4 Company-Wise Revenue and Product Benchmarking
- 17.5 Production and Service Capacity Benchmarking
- 17.6 Technology, Pricing and Differentiation
- 17.7 Regional Footprint and Distribution Strength
- 17.8 Mergers, Acquisitions and Strategic Alliances
- 17.9 New Entrants and Competitive Threats
- 17.10 Porter's Five Forces and Industry Attractiveness
- 17.11 Competitive Outlook, 2025-2035
Chapter 18 Company Profiles
- 18.1 Company Coverage and Selection Criteria
- 18.2 Toyota Material Handling Australia
- 18.2.1 Business Description
- 18.2.2 Company Ownership and Geographic Presence
- 18.2.3 Product and Service Portfolio
- 18.2.4 Manufacturing and Operating Footprint
- 18.2.5 Production Capacity and Expansion Plans
- 18.2.6 Financial Performance and Investment
- 18.2.7 Market Share and Competitive Position
- 18.2.8 Technology and Innovation Capabilities
- 18.2.9 Strategic Alliances or Partnerships
- 18.2.10 Recent Developments
- 18.2.11 Growth Strategy and Outlook
- 18.3 Linde Material Handling Australia
- 18.4 Adaptalift Group
- 18.5 Coates
- 18.6 United Forklift and Access Solutions
- 18.7 Kennards Hire
- 18.8 Crown Equipment Australia
- 18.9 NTP Forklifts Australia
- 18.10 Lencrow Forklifts
- 18.11 ForkForce Australia
- 18.12 Other Relevant Market Participants
Note: Every listed company is profiled on the structure shown under the first company. The company list is preliminary and may change based on research findings, market developments, data availability and client requirements.
Chapter 19 Disclaimer
- 19.1 Research and Forecast Disclaimer
- 19.2 Data Source and Estimation Limitations
Note: The depth of individual sections depends on data availability for this market. Volume, capacity, trade and other unit-based metrics are included where applicable.

