
Insulating and protective foams serve Australian builders
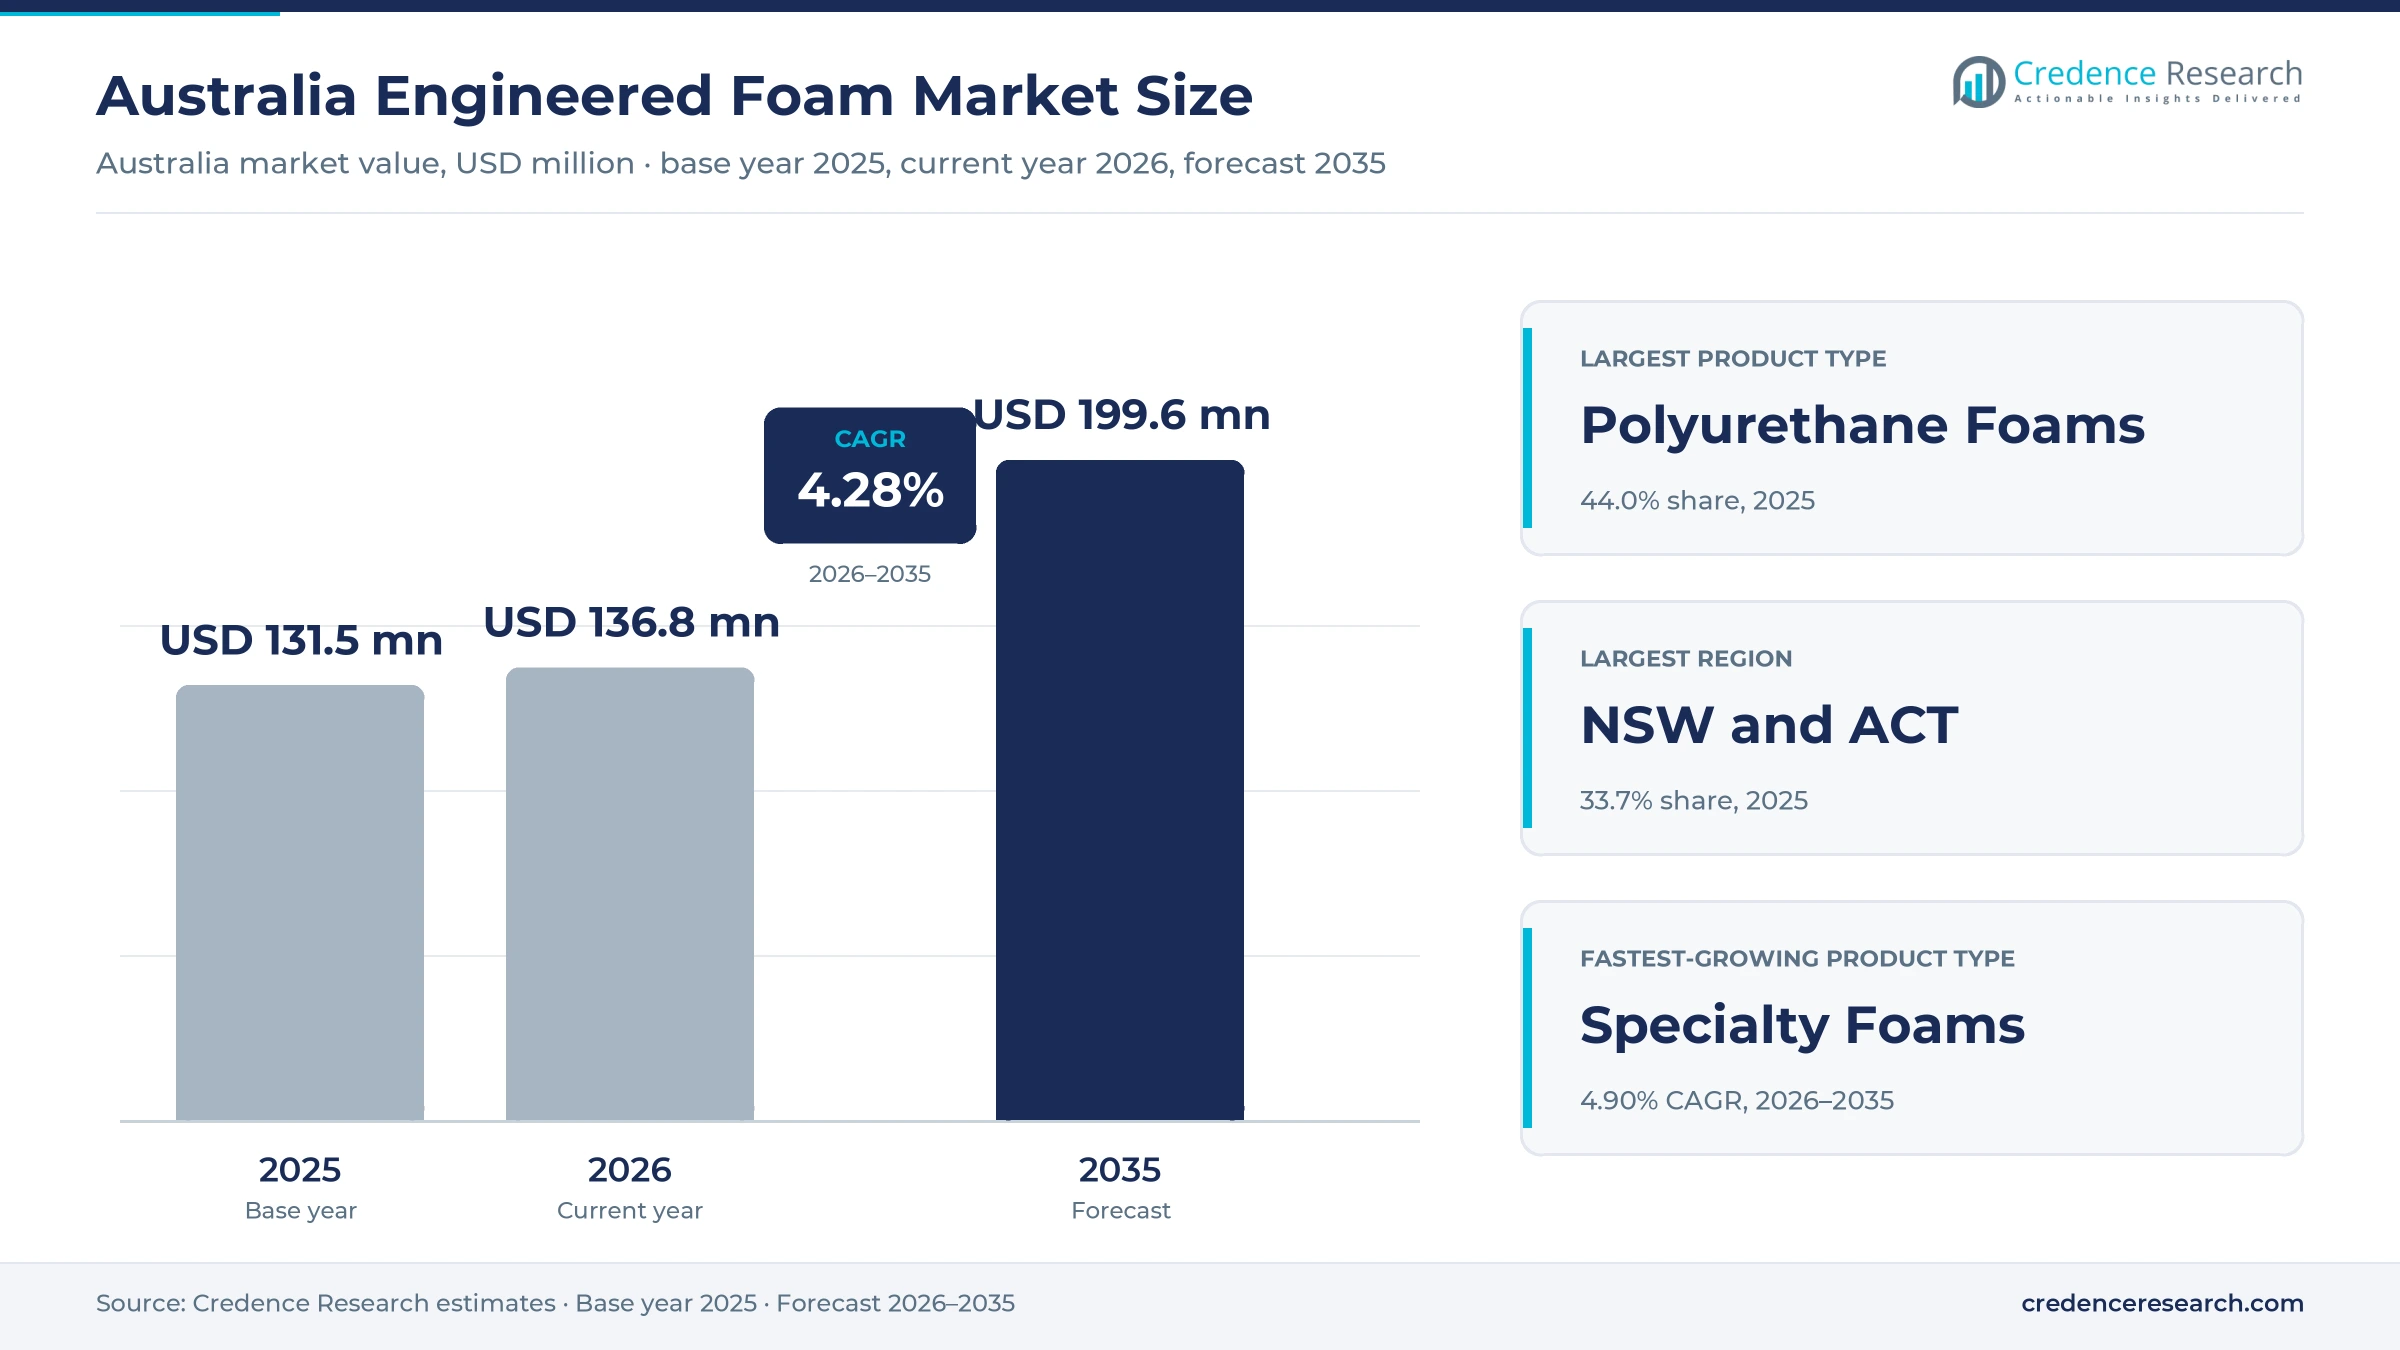
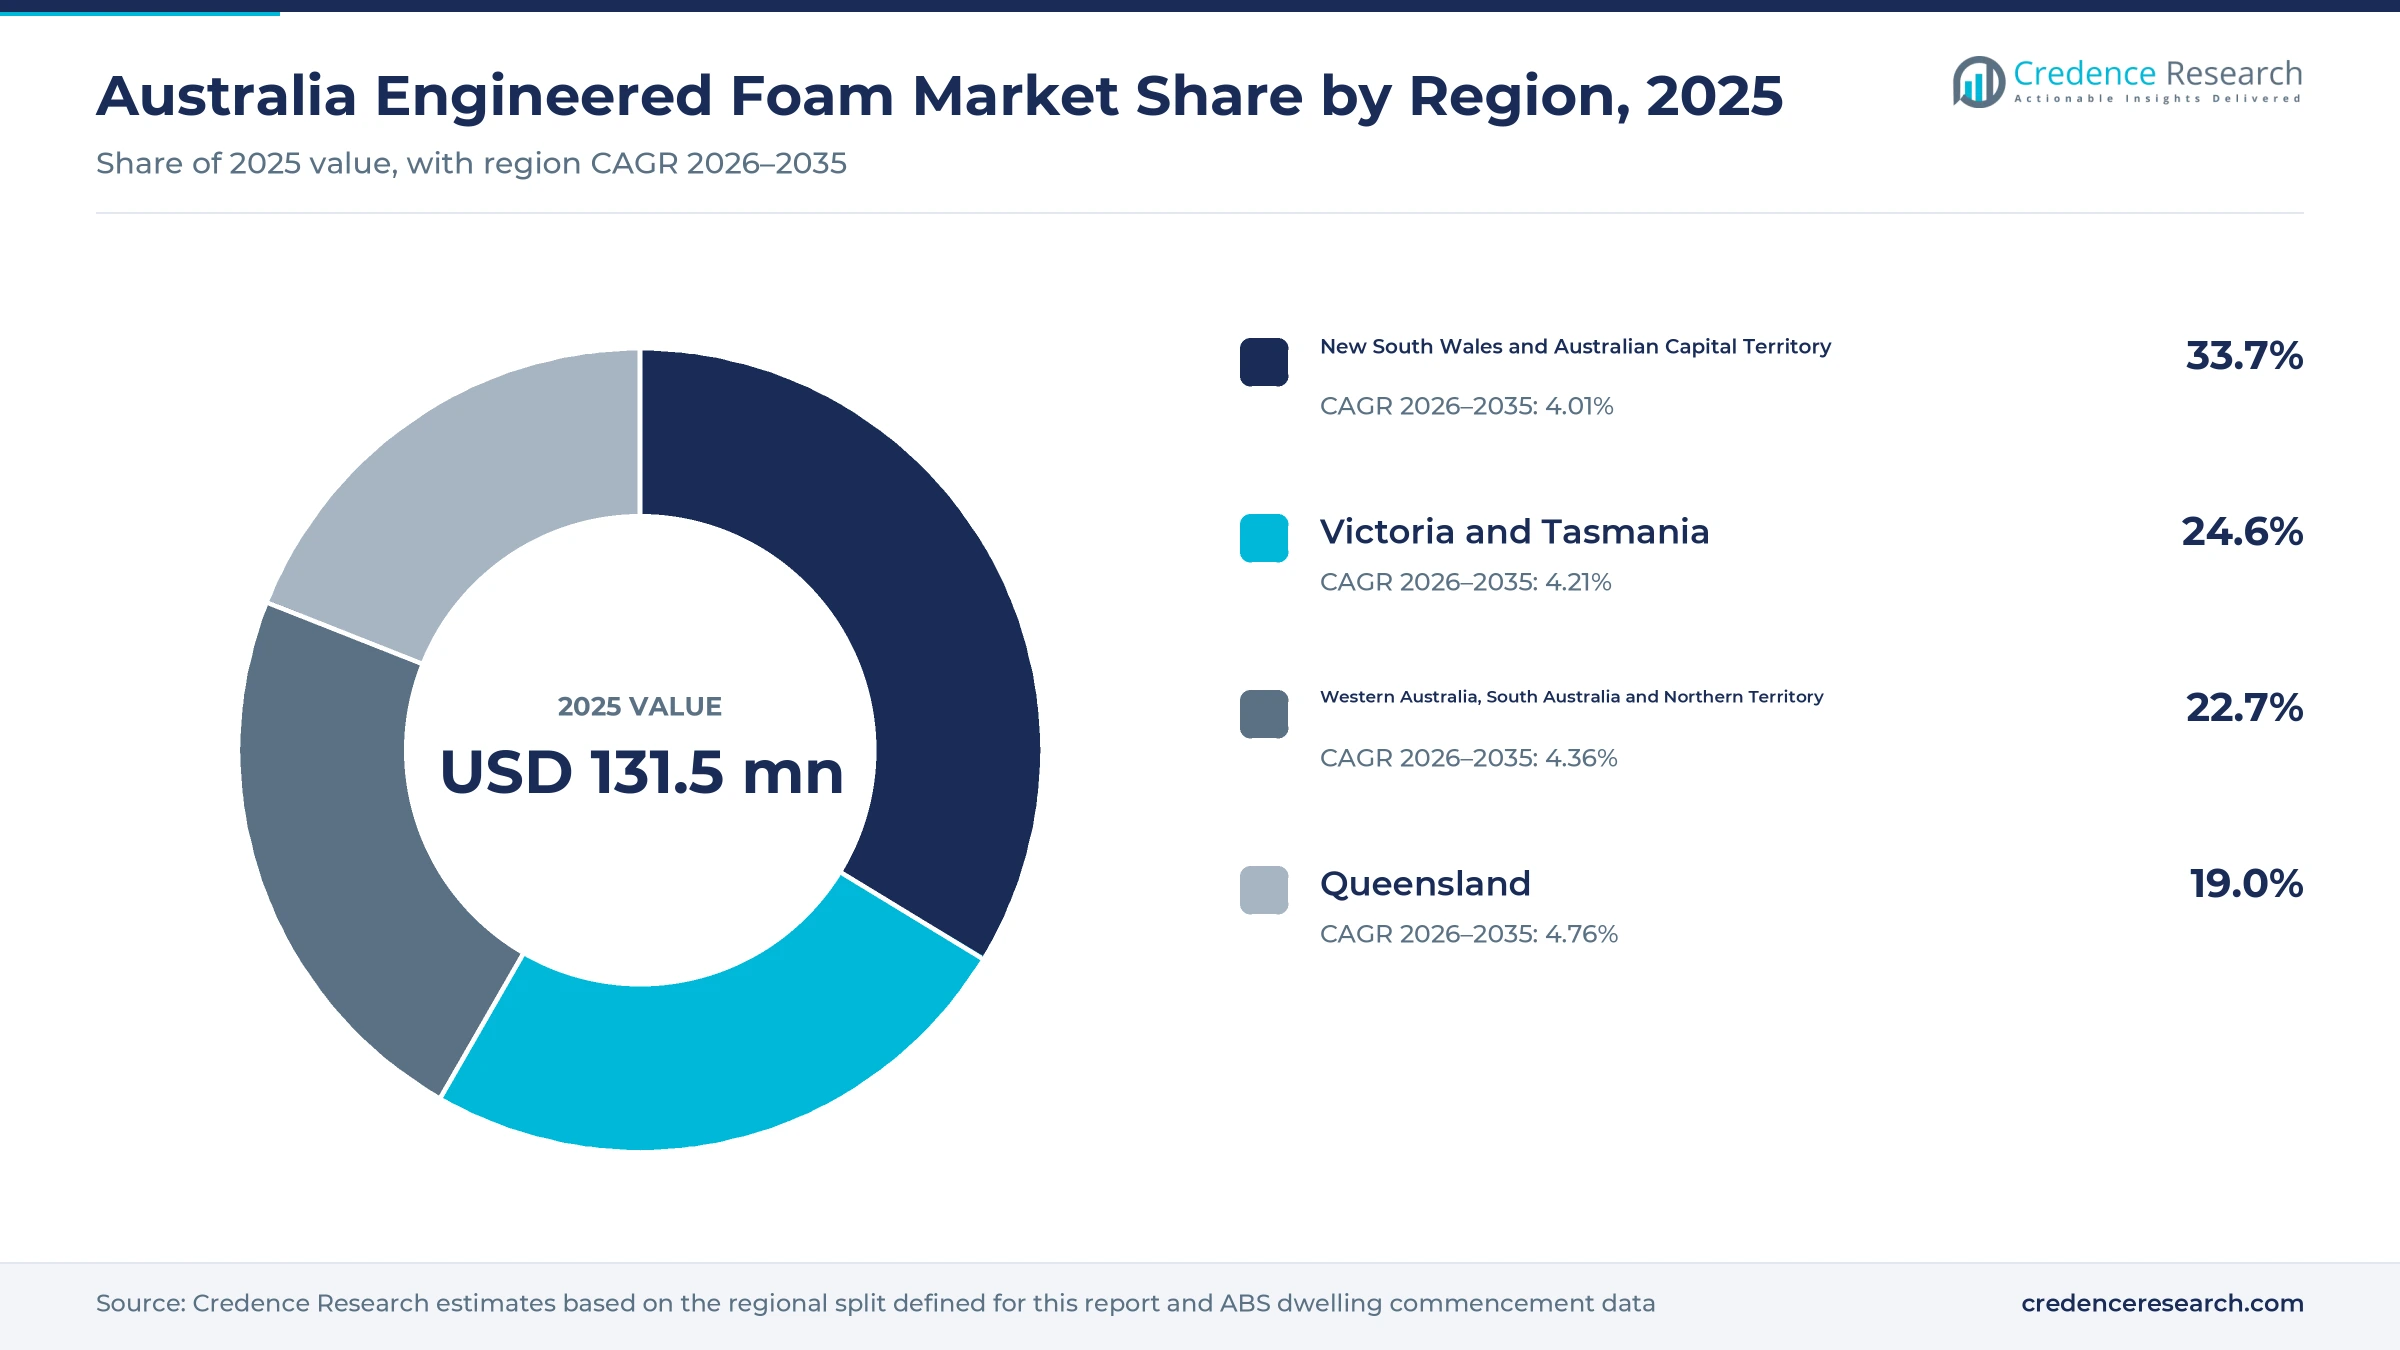
The Australia engineered foam market was valued at USD 131.5 million in 2025 and is projected to increase from USD 136.8 million in 2026 to USD 199.6 million by 2035, registering a CAGR of 4.28% during 2026–2035. Demand comes from builders that must meet 7-star home energy ratings, from food and appliance supply chains that ship goods in protective packaging, and from manufacturers of bedding, medical and transport products that buy cut and molded foam parts. New South Wales and the Australian Capital Territory held the largest regional share, 33.7% in 2025, because the zone hosts several of the main foam plants and a large building pipeline. Queensland is the fastest-growing region at 4.76% a year, as home building there rises quickly. In turn, a national housing target of 1.2 million homes and a planned phase-out of consumer polystyrene packaging are reshaping which foams buyers order.
Which foam products does the national estimate count?
Spending on engineered foam made or sold in Australia for technical uses forms the base of this estimate, including polyurethane, polystyrene, crosslinked polyolefin and specialty foams such as phenolic boards. It counts insulation boards and pipe lagging, protective packaging, acoustic pads, buoyancy blocks and cut or molded parts sold to manufacturers, converters and project contractors.
The estimate excludes finished mattresses and sofas sold at retail, foam tape and adhesives, and loose foam chemicals sold before foaming. The value chain runs from imported resins and blowing agents to local foam makers, then through converters and technical distributors to builders, packers and manufacturers, who buy under supply contracts, through distributors or against project specifications.
Australia Engineered Foam Market Insights
- The Australia engineered foam market was valued at USD 131.5 million in 2025 and is projected to reach USD 199.6 million by 2035, registering a CAGR of 4.28% during 2026–2035.
- New South Wales and the Australian Capital Territory held a 33.7% share of 2025 value, because the zone hosts major polyurethane, polystyrene and polyolefin foam plants.
- Polyurethane foams led product types with a 44.0% share of 2025 value, because flexible and rigid grades serve bedding, medical, transport and insulation buyers.
- Building ministers agreed on Oct. 22, 2025, to keep the 7-star residential energy standard and add condensation mitigation to NCC 2025, which supports insulation foam demand.
- Specialty foams grow fastest among product types at 4.90% a year during 2026–2035, as phenolic and other high-performance boards win commercial building specifications.
Polyurethane leads while polyolefin and specialty grow
Why do polyurethane foams hold the largest share?
Based on product type, the market is categorized into Polyurethane Foams, Polystyrene Foams, Polyolefin Foams and Specialty Foams. Polyurethane Foams led with a 44.0% share of 2025 value, because flexible and rigid grades serve bedding, medical, transport and insulation buyers. Specialty Foams grow fastest at 4.90% a year, as thin phenolic boards suit commercial walls and roofs where space is tight.
Which industries buy the most technical foam?
Based on end-use industry, the market is categorized into Construction, Packaging and Cold Chain, Mobility and Defence, and Healthcare and Technical Manufacturing. Construction led with a 42.0% share of 2025 value, because residential and commercial building work uses insulation boards, pipe lagging and sealing parts. Construction also grows fastest at 4.55% a year, as stricter energy rules raise insulation per home.
Why does thermal insulation lead foam applications?
Based on application, the market is categorized into Thermal Insulation, Protective Cushioning, Acoustic and Vibration Control, and Buoyancy and Functional Support. Thermal Insulation led with a 43.0% share of 2025 value, because energy codes set minimum thermal performance for new homes and offices. Thermal Insulation also grows fastest at 4.60% a year, while acoustic insulation gains ground in apartments and plant rooms.
How do buyers source engineered foam?
Based on sales channel, the market is categorized into Direct Contract Supply, Technical Distribution and Project Specification Supply. Direct Contract Supply led with a 46.0% share of 2025 value, because manufacturers of bedding, medical and transport products buy foam under long supply agreements. Project Specification Supply grows fastest at 4.73% a year, as architects and engineers name declared products in building documents.
| Segment Group | Leading Sub-segment | Share, 2025 | Fastest-growing Sub-segment | CAGR, 2026–2035 |
|---|---|---|---|---|
| By Product Type | Polyurethane Foams | 44.0% | Specialty Foams | 4.90% |
| By End-Use Industry | Construction | 42.0% | Construction | 4.55% |
| By Application | Thermal Insulation | 43.0% | Thermal Insulation | 4.60% |
| By Sales Channel | Direct Contract Supply | 46.0% | Project Specification Supply | 4.73% |
Request a Free Sample
Fill in your details and we'll send you a free sample report.
- Sample data tables & charts
- Research methodology
Energy rules, housing targets and specs lift demand
How do building envelope rules raise foam content?
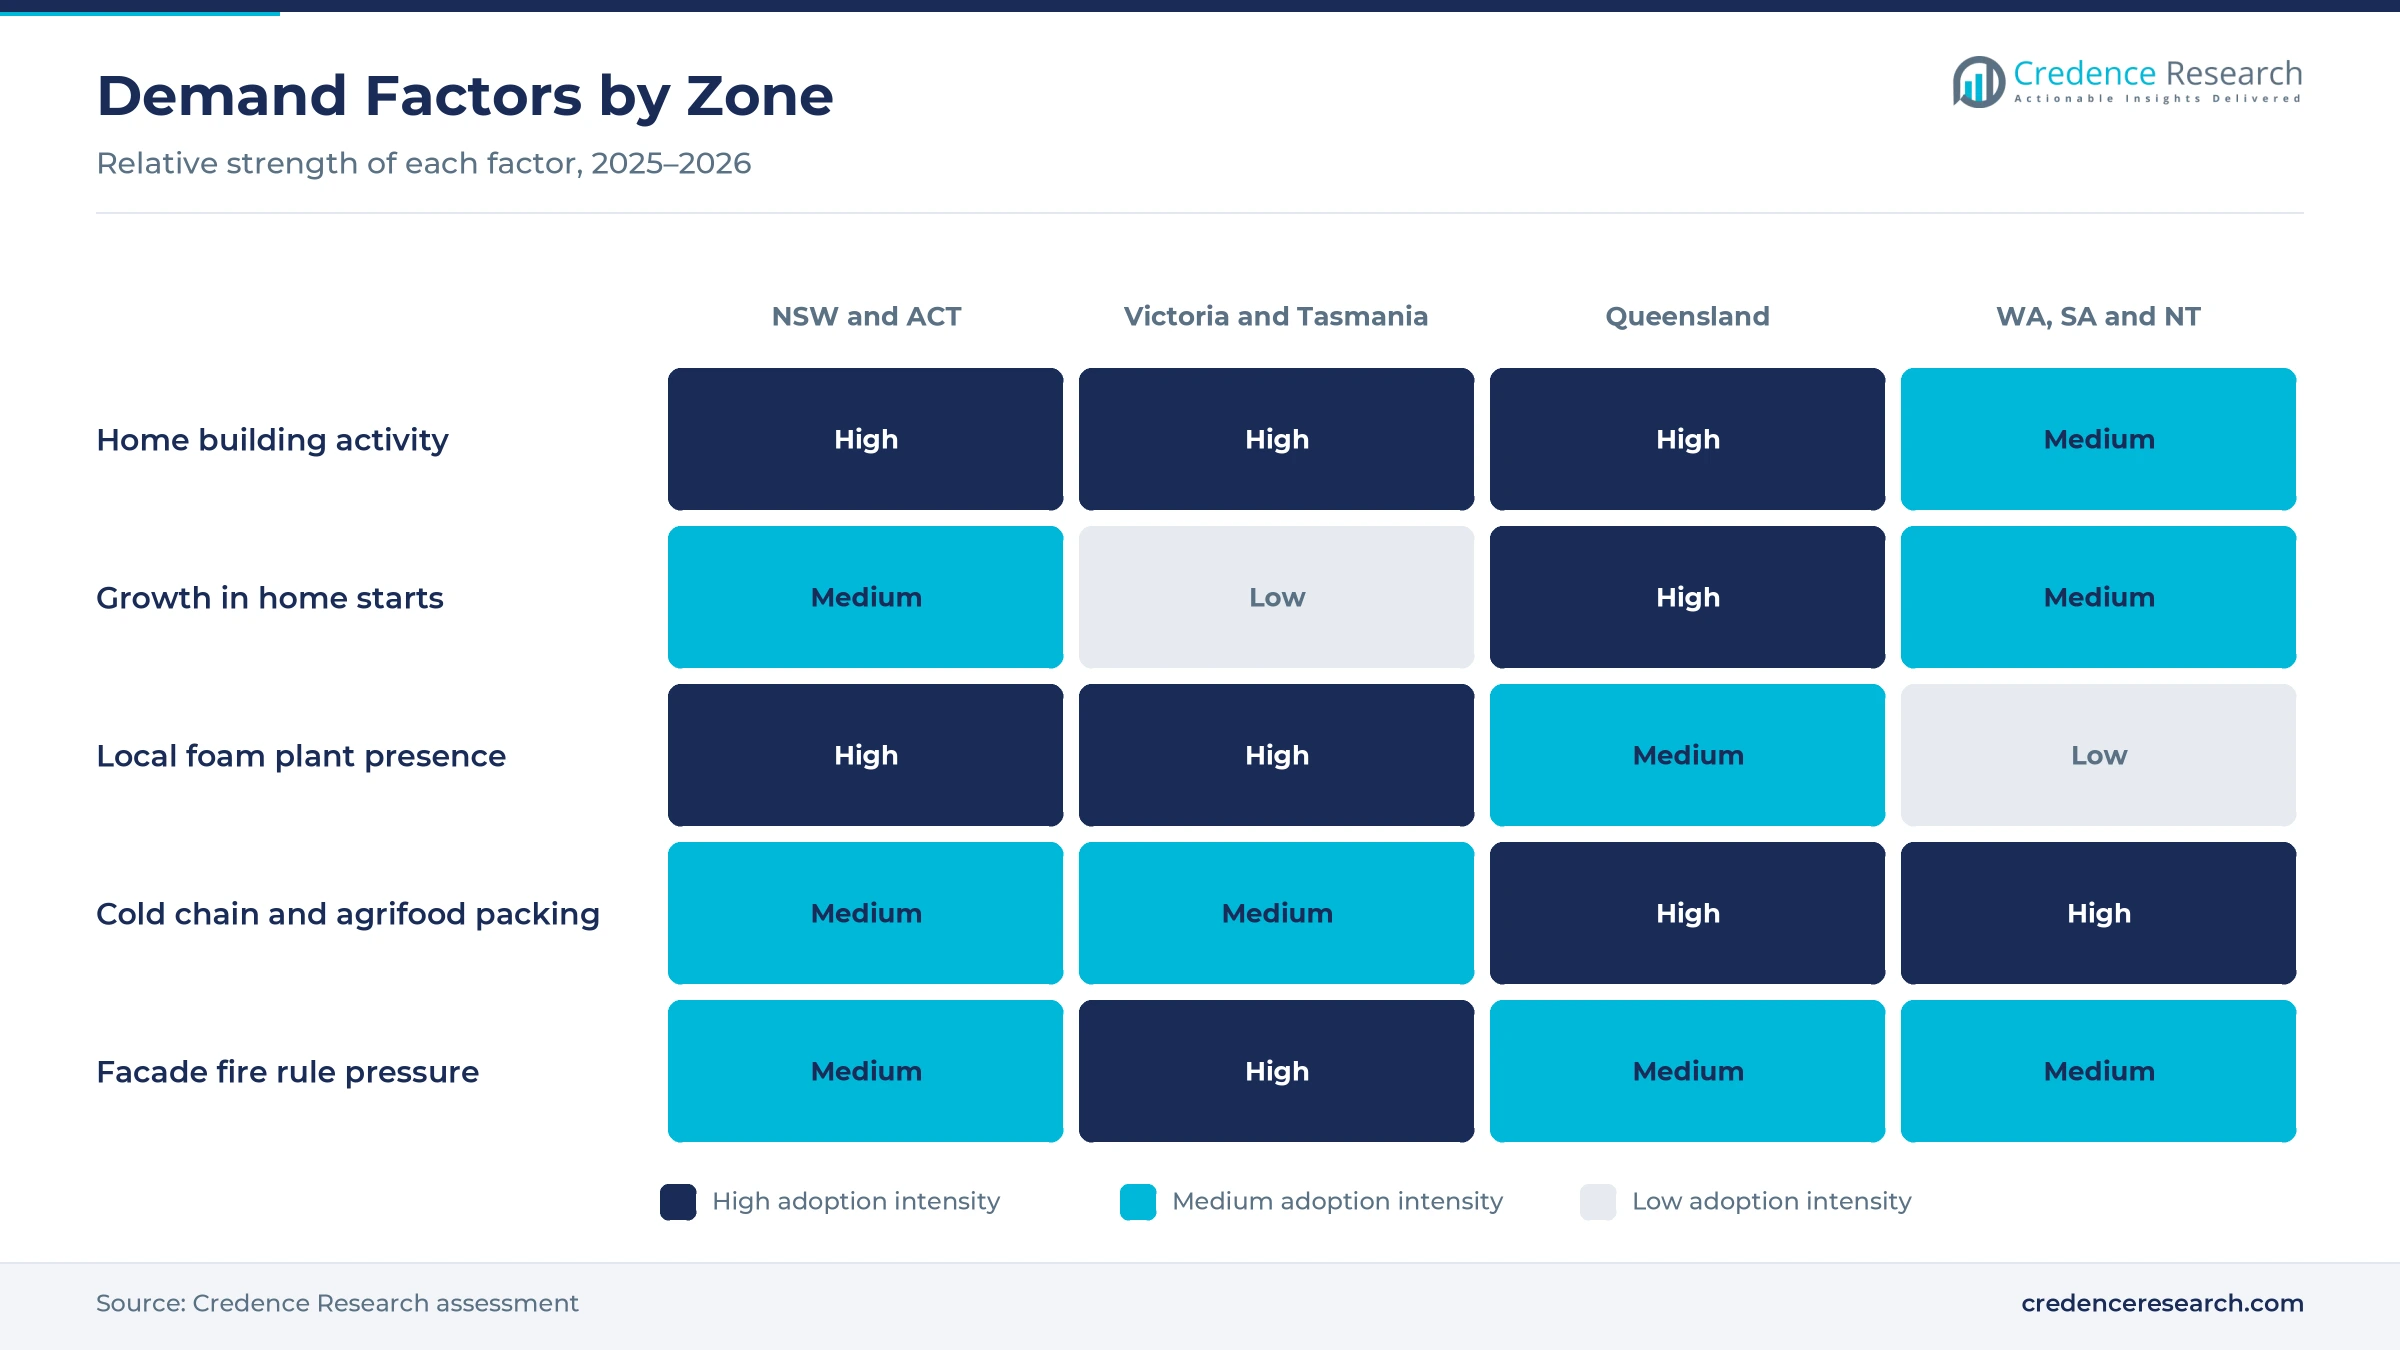
Stricter thermal rules for new homes raise the amount of insulation that builders place in walls, floors and roofs, which lifts demand for foam boards and lagging. The Nationwide House Energy Rating Scheme reported that NCC 2022 took effect on May 1, 2023, with its new energy requirements optional until Oct. 1, 2023. Victoria, Queensland, the ACT and New South Wales, through an enhanced BASIX, were expected to introduce the 7-star minimum and the Whole of Home energy budget from Oct. 1, 2023. Building ministers then reached agreement in October 2025 to keep these residential standards and to add condensation mitigation in NCC 2025. As a result, Thermal Insulation held 43.0% of 2025 value.
Why do housing targets lift construction demand?
A national push to build more homes raises the number of slabs, walls and roofs that need insulation, sealing and acoustic foam. The National Housing Accord sets a target of 1.2 million well-located homes over five years from July 1, 2024, backed by A$3.5 billion in payments to states and local governments. The Commonwealth also offers a A$3 billion New Home Bonus for jurisdictions that exceed their share of the target. The Australian Bureau of Statistics reported 52,201 dwelling commencements in the June quarter of 2026, up 14.4% on a year earlier. In turn, Construction accounted for 42.0% of 2025 value in this report's segment split.
How do qualified technical components favor local makers?
Specifiers increasingly ask for foam products with declared performance and environmental data, which favors makers that can document each grade. Kingspan Insulation registered an Environmental Product Declaration on March 23, 2023, for its Kooltherm K10 and K17 boards, which it describes as locally made rigid phenolic insulation. Sekisui Foam Australia registered declarations for its Thermobreak LS tube and sheet on May 8, 2026, covering crosslinked polyolefin insulation for ducts and pipework. Joyce Foam Products holds Good Environmental Choice Australia certification for a large part of its range, which spans more than 70 grades. As a result, Project Specification Supply grows fastest among channels at 4.73% a year.
Why do agrifood and cold chain flows support packaging foam?
Large food and farm export volumes keep demand steady for insulated boxes and protective inserts that move chilled goods between farms, packers and ports. ABARES forecast in March 2026 a record A$101.4 billion gross value of agricultural production for 2025–26, with farm exports rising 6% to A$80.5 billion. The federal government's polystyrene phase-out excludes business-to-business packaging such as fresh produce boxes, as well as specialist medical packaging for organs and pharmaceuticals. In turn, insulated packaging for refrigerated transport fleets remains a core outlet, which supports Thermal Insulation as the fastest-growing application at 4.60% a year.
Lower-impact chemistry and declared data gain ground
Why are lower-emission foaming processes on the rise?
Foam makers are shifting to processes that cut chemical emissions and blowing agent use, which buyers now check during supplier approval. Dunlop Foams, a member of The Comfort Group, says it was first in the industry to use CFC-free processes and has developed a carbon dioxide manufacturing process. Joyce Foam Products reports that its Variable Pressure Foam Technology has largely removed hazardous air emissions and volatile organic compounds. Australia also introduced a phase-down of hydrofluorocarbon imports in January 2018, with quotas falling to 15% of the baseline by Jan. 1, 2036, according to the federal government. As a result, Polyurethane Foams keep their 44.0% share of 2025 value while makers adapt their chemistry.
How is declared product data changing specifications?
Declared environmental data is becoming a standard part of insulation tenders, which changes how architects compare foam boards. The Kooltherm declaration remains valid until March 23, 2028, and Kingspan lists it as aligned with NABERS Embodied Carbon, Green Star and Infrastructure Sustainability ratings. Sekisui Foam Australia's Thermobreak LS declarations are valid until May 7, 2031, which gives specifiers a stable reference for duct and pipe insulation. Foamex Group is an active member of Expanded Polystyrene Australia and the Green Building Council of Australia, according to its ICN Gateway listing. In turn, Specialty Foams grow fastest among product types at 4.90% a year.
Can polystyrene recovery open new supply options?
Recovery schemes for polystyrene offer an opening for makers that can take back material and supply recycled content to building and packaging buyers. The Australian Packaging Covenant Organisation and the Coalition for Sustainable Solutions announced a partnership in October 2025 to phase out problematic consumer polystyrene formats. The covenant organization has more than 2,400 members, and the partners aim to build recovery and recycling pathways for electronics packaging. Officeworks removed polystyrene from its own-brand furniture packaging, avoiding about 800,000 pieces a year, according to the federal agriculture department. As a result, polystyrene makers can redirect capacity toward building uses that the phase-out exempts.
Is population growth an opening for insulation suppliers?
Steady population growth creates an opening for insulation suppliers, because each new household adds walls, roofs and service runs that need foam products. Australia's population grew 1.5% in 2025 after 2.0% in 2024, according to the World Bank, which keeps household formation steady. Queensland dwelling commencements rose about 26% over the four quarters to June 2026, compared with the prior four quarters, based on Australian Bureau of Statistics data. Building ministers also kept commercial energy reforms, including mandatory on-site solar, in NCC 2025. In turn, Queensland is set to grow faster than any other zone through 2035.
Fire rules, packaging phase-outs and HFC limits weigh
How do cladding fire rules limit polystyrene use?
Fire rules on external walls restrict some foam uses on larger buildings. Victoria introduced a ban on expanded polystyrene in external insulation and finish wall systems on Type A and Type B buildings from Feb. 1, 2021, according to the Building and Plumbing Commission. As a result, polystyrene makers lose a facade outlet on apartments and offices. Insulated sandwich panels and polystyrene concrete were not prohibited, so suppliers shift effort to those products.
Why does the packaging phase-out reduce some volumes?
The national plan to phase out consumer polystyrene packaging reduces volumes of loose fill and molded inserts for appliances and electronics. The federal government set reviews for these formats in July 2022 and for food containers in December 2022. In turn, retailers have moved to cardboard and molded pulp alternatives for many goods. Foam makers respond by focusing on exempt business-to-business, medical and building uses, where insulation value matters more.
How do blowing agent limits raise production costs?
Limits on hydrofluorocarbon imports raise costs for foam makers that still depend on these blowing agents. The federal government cut import quotas each year from Jan. 1, 2018, with a floor of 15% of the baseline in 2036. As a result, rigid foam producers must qualify new blowing agents and adjust equipment. Firms that have already moved to carbon dioxide or hydrocarbon systems face less cost pressure than those that have not.
Why does uneven housing delivery weigh on demand?
Housing starts still run below the pace needed for the national target, which caps near-term insulation demand. A target of 1.2 million homes over five years implies about 60,000 homes a quarter, which is still above the latest quarterly commencement count. Tasmania also paused its adoption of NCC 2025, according to the October 2025 building ministers' communique. In turn, foam suppliers must manage volume swings across states.
NSW and the ACT lead as Queensland grows fastest
| Region | Value, 2025 (USD million) | Share, 2025 | CAGR, 2026–2035 |
|---|---|---|---|
| New South Wales and Australian Capital Territory | 44.3 | 33.7% | 4.01% |
| Victoria and Tasmania | 32.3 | 24.6% | 4.21% |
| Western Australia, South Australia and Northern Territory | 29.9 | 22.7% | 4.36% |
| Queensland | 25.0 | 19.0% | 4.76% |
Why do NSW and the ACT lead foam demand?
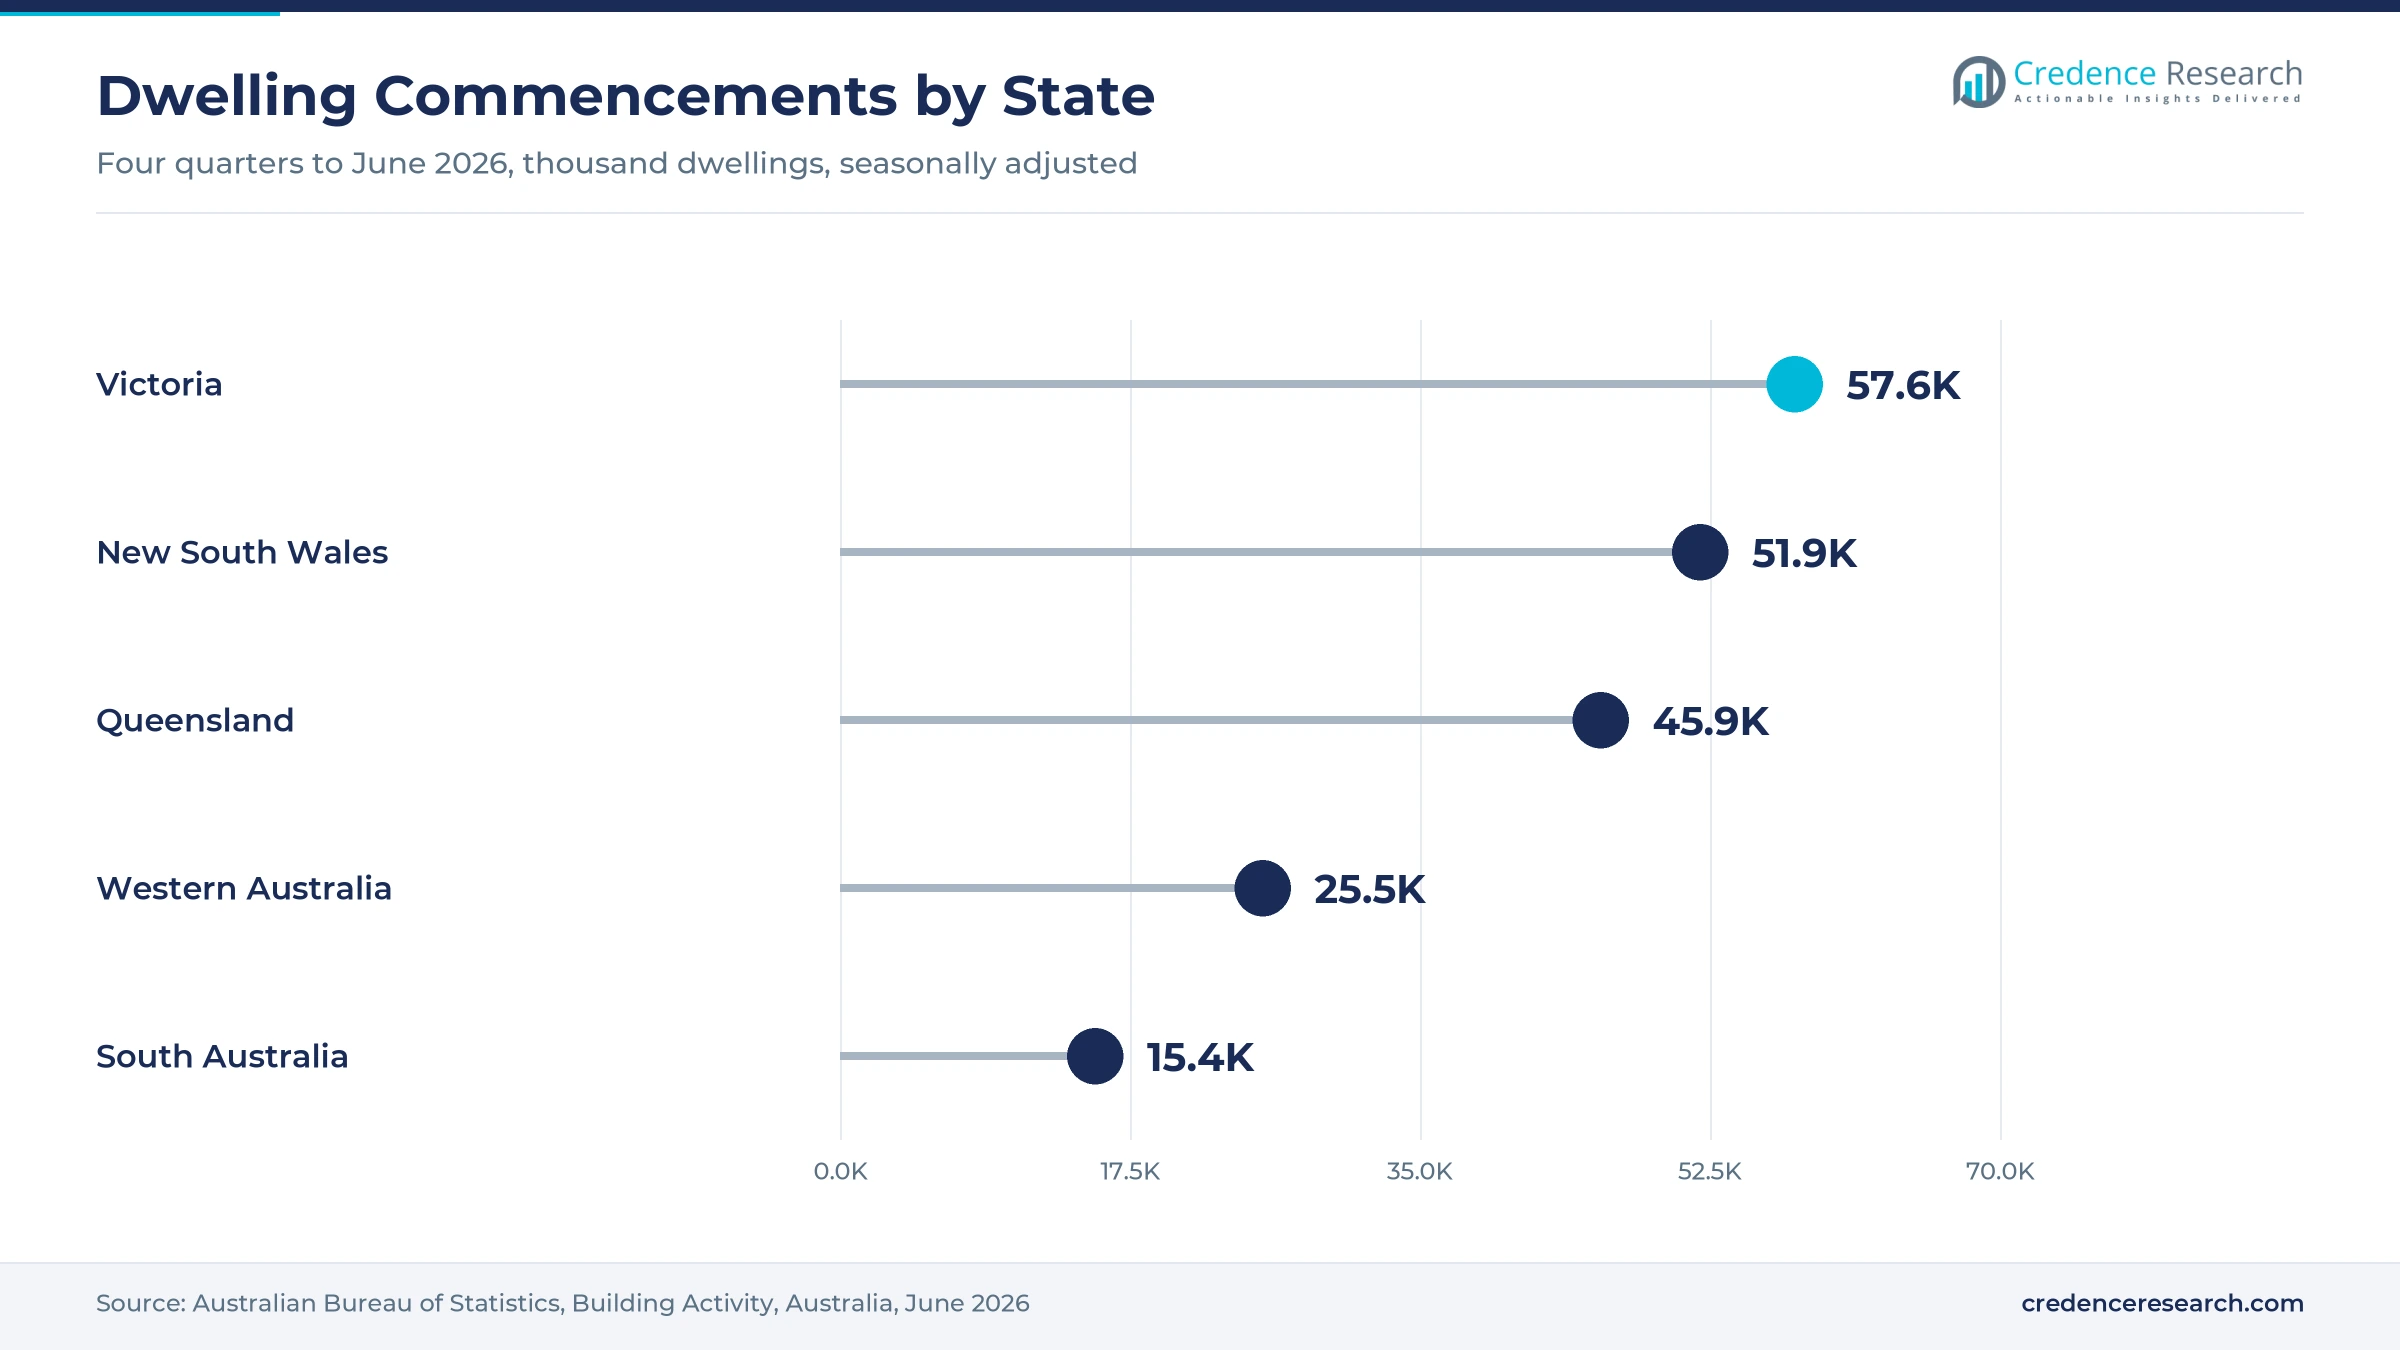
New South Wales and the Australian Capital Territory held 33.7% of 2025 value and grow at 4.01% a year. Joyce Foam Products is based in Moorebank, Sekisui Foam Australia makes crosslinked polyolefin foam at Taren Point, and Foamex Group runs a Milperra site. New South Wales started about 51,900 dwellings over the four quarters to June 2026, based on Australian Bureau of Statistics data, which keeps insulation demand high.
How does Victoria anchor polystyrene and housing demand?
Victoria and Tasmania held a 24.6% share of 2025 value and grow at 4.21% a year, as Victoria leads the country in home starts. Victoria started about 57,600 dwellings over the four quarters to June 2026, based on Australian Bureau of Statistics data. Foamex Group, which has supplied polystyrene since 1982, is headquartered at Bayswater North. However, the state ban on polystyrene in rendered facade systems limits one building outlet.
Why does Queensland grow fastest to 2035?
Queensland held a 19.0% share of 2025 value and grows fastest at 4.76% a year. The state started about 45,900 dwellings over the four quarters to June 2026, roughly 26% more than in the prior four quarters, based on Australian Bureau of Statistics data. Queensland was also among the jurisdictions expected to apply the 7-star minimum from Oct. 1, 2023. As a result, Credence Research expects insulation and sealing foam demand to rise faster than in other zones.
How do the western and southern states add demand?
Western Australia, South Australia and the Northern Territory held a 22.7% share of 2025 value and grow at 4.36% a year. Western Australia started about 25,500 dwellings and South Australia about 15,400 over the four quarters to June 2026, based on Australian Bureau of Statistics data. Foamex Group also lists a South Australian branch, while resources and cold chain work add demand for insulated and protective foam.
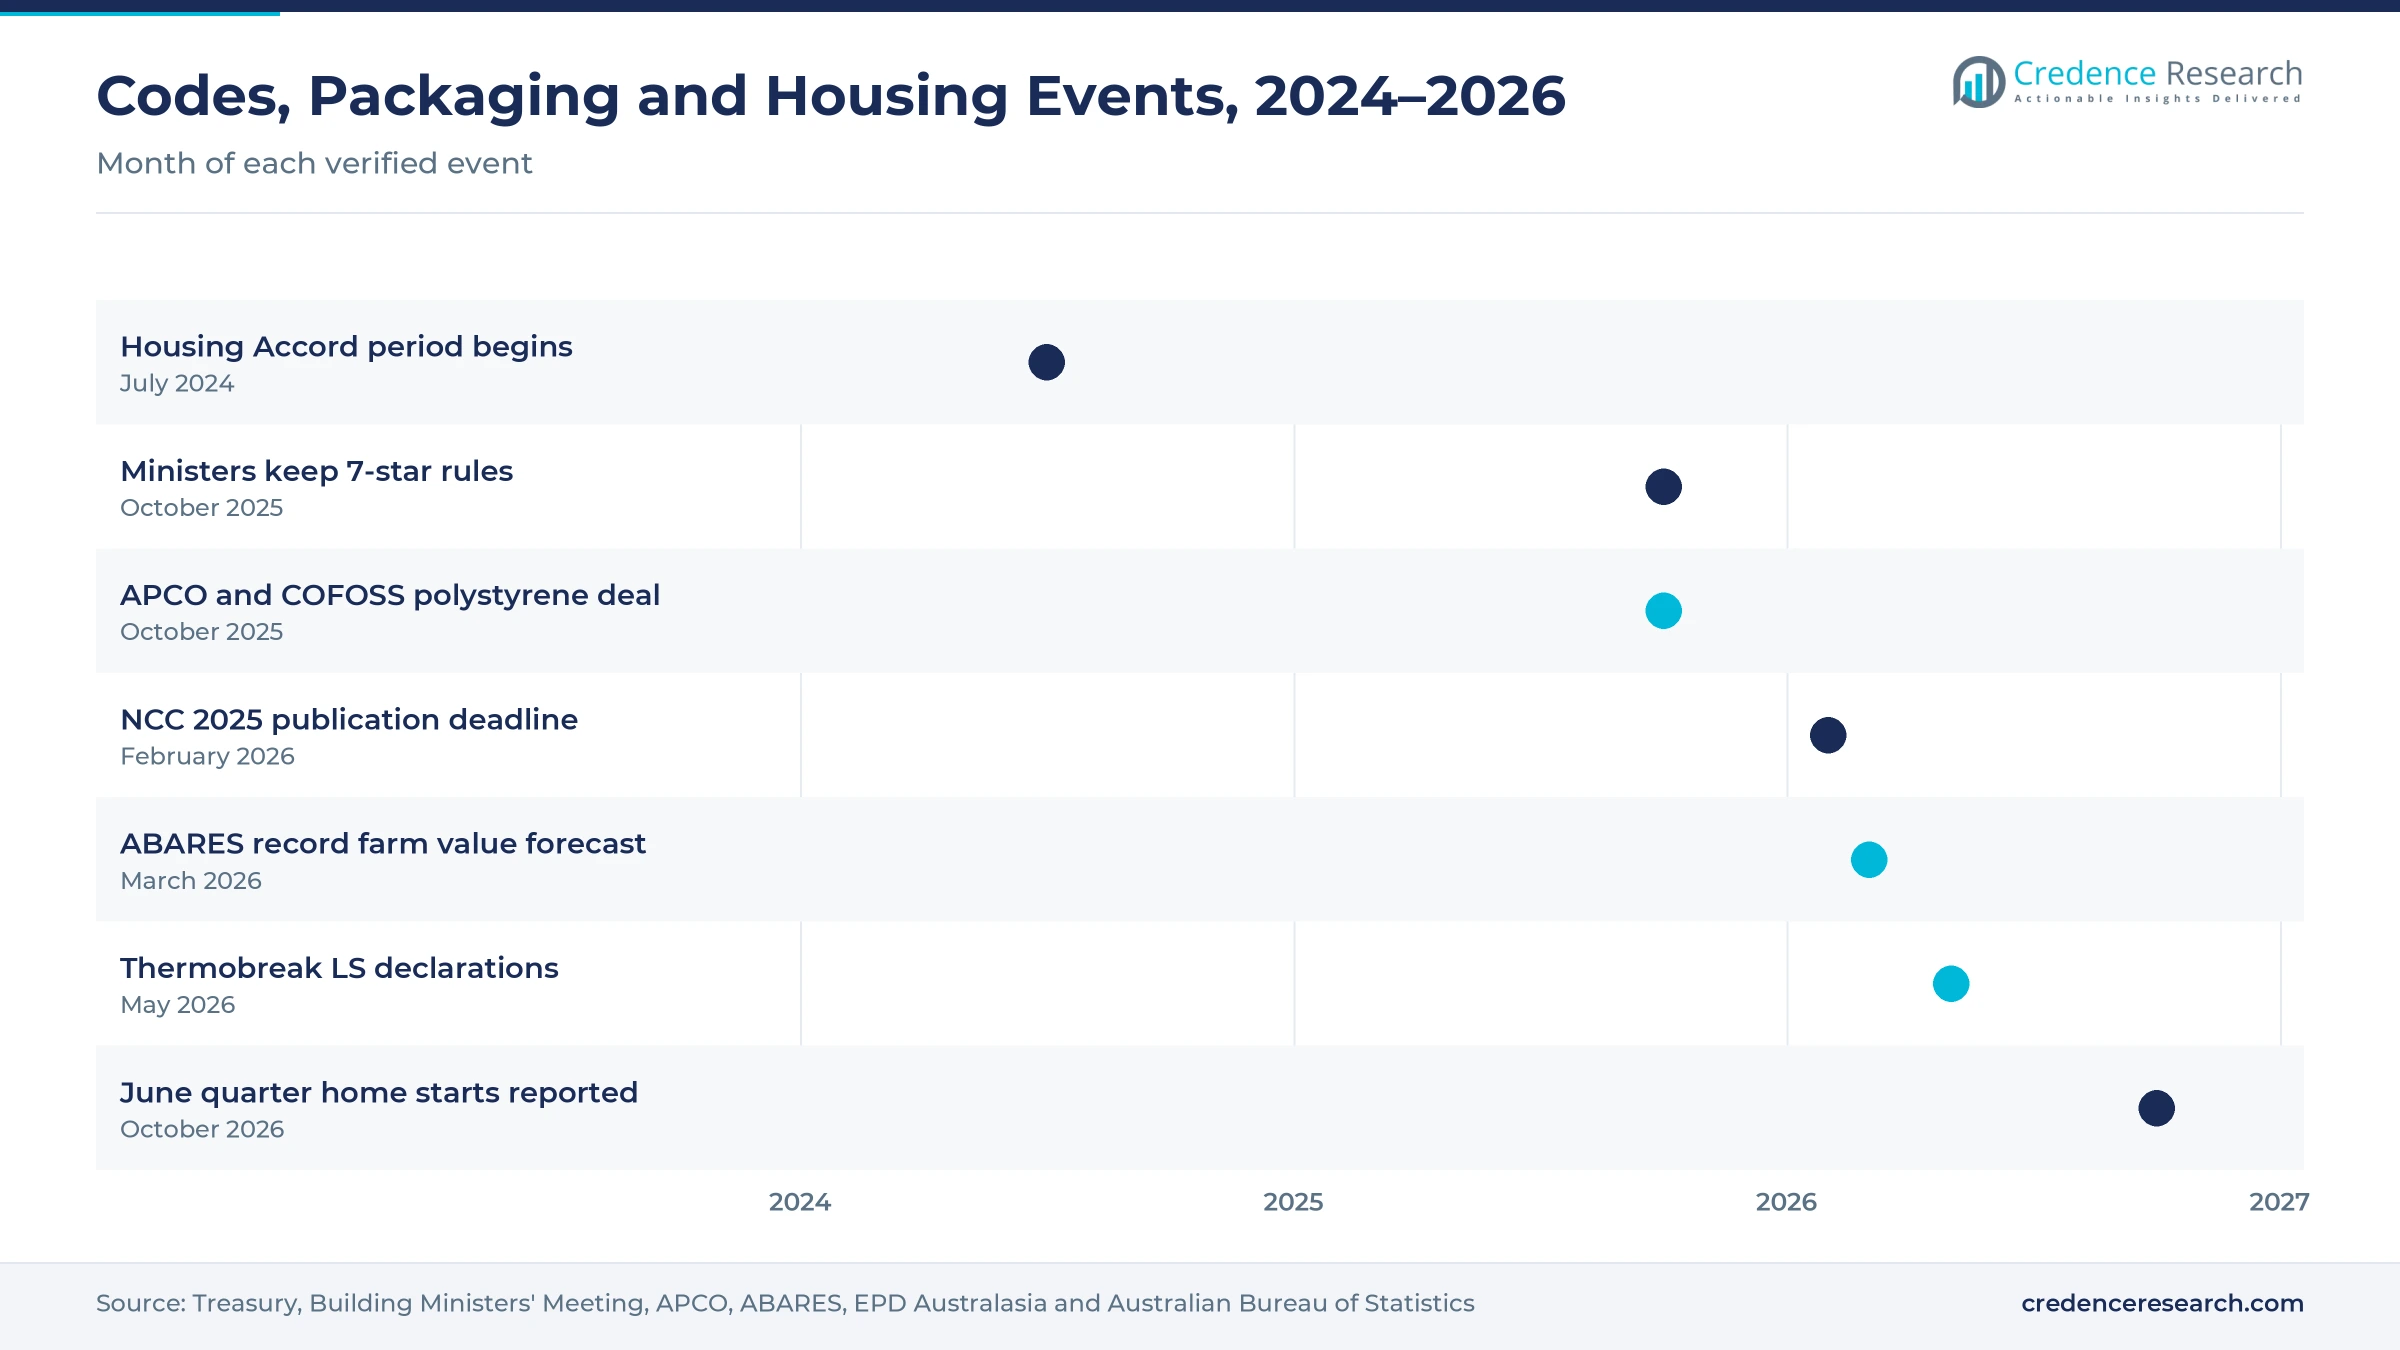
Codes, packaging deals and product data, 2024–2026
| Development | Status and market relevance |
|---|---|
| In July 2024, the National Housing Accord target period began, aiming for 1.2 million well-located homes over five years with A$3.5 billion in Commonwealth payments. | Sets the building pipeline that drives insulation and sealing foam demand |
| In October 2025, building ministers agreed to keep the 7-star residential energy standard and add condensation mitigation to NCC 2025. | Keeps thermal performance rules stable for insulation buyers |
| In October 2025, the Australian Packaging Covenant Organisation and the Coalition for Sustainable Solutions partnered to phase out problematic consumer polystyrene packaging. | Pushes appliance packaging away from polystyrene and toward recovery |
| In May 2026, Sekisui Foam Australia registered Environmental Product Declarations for Thermobreak LS tube and sheet insulation, valid until May 2031. | Gives specifiers declared data for crosslinked polyolefin insulation |
| In October 2026, the Australian Bureau of Statistics reported 52,201 dwelling commencements for the June quarter, up 14.4% on a year earlier. | Confirms a recovery in home building that lifts foam demand |
Reactive, extruded and bead foams shape choice
- Reactive foaming mixes polyols and isocyanates to form flexible or rigid polyurethane, and Joyce Foam Products uses Variable Pressure Foam Technology to control emissions.
- Physical extrusion pushes molten polymer through a die with a blowing agent, producing extruded polystyrene boards such as Foamex Group Styroboard.
- Bead expansion steams pre-expanded polystyrene beads into blocks and molded shapes, which are then cut into sheets, boxes and underfloor panels.
- Crosslinked polyolefin lamination bonds closed-cell polyolefin foam to reinforced aluminum foil, as in Sekisui Foam Australia Thermobreak duct and pipe insulation.
Need a Custom Version of This Report?
Tailor the scope, geography, or segments to your exact requirements.
- Custom geography or segment scope
- Direct access to our analyst team
Local converters compete on grade range and data
Competition in Australian engineered foam is led by local makers with national plants, while converters and distributors shape which grades reach smaller buyers. Joyce Foam Products, founded in 1886, has made flexible polyurethane foam since 1953 and supplies bedding, furniture, medical and industrial users. Dunlop Foams, part of The Comfort Group, has made polyurethane and other foams in Australia for more than 70 years. Foamex Group makes expanded and extruded polystyrene with more than 250 staff across five states. Kingspan Insulation Australia offers locally made Kooltherm phenolic boards, and Sekisui Foam Australia supplies crosslinked polyolefin insulation. Rivals compete on grade range, declared environmental data, cutting and molding services and delivery times.
Which foam makers compete for Australian buyers?
| Company | Type | Role in the market |
|---|---|---|
| Joyce Foam Products | Local manufacturer | Flexible polyurethane foam in more than 70 grades from its Moorebank base |
| Dunlop Foams | Local manufacturer | Polyurethane foam for bedding, healthcare, transport and packaging, part of The Comfort Group |
| Foamex Group | Local manufacturer | Expanded and extruded polystyrene sheets, blocks, cladding and insulation |
| Kingspan Insulation Australia | Subsidiary manufacturer | Locally made Kooltherm rigid phenolic insulation boards |
| Sekisui Foam Australia | Subsidiary manufacturer | Thermobreak crosslinked polyolefin insulation made at Taren Point |
Credence Research view on technical foam demand
Credence Research's view is that Australian demand for engineered foam will grow steadily, because stable 7-star energy rules, a national housing target and wider use of declared product data all favor technical insulation. Polyurethane remains the largest product pool, while specialty and polyolefin foams add the fastest growth in commercial buildings and services. Packaging volumes face pressure from the consumer polystyrene phase-out, although exempt cold chain and medical uses hold up. Makers that document performance and lower-emission chemistry should win more specifications.
How the national technical foam estimate was built
The report uses 2025 as the base year on a calendar basis, and market values come from the Credence Research model. That model combines dwelling commencement data, building code settings, packaging policy, supplier product ranges and company disclosures. Segment splits and zone growth rates are Credence Research estimates, while zone shares follow the regional split defined for this report. Sources used are government agencies, official statistics, international agency data, certification bodies and company publications, and no interviews or surveys were used.
Insulation and specialty grades carry growth to 2035
Value across Australian engineered foam is expected to reach USD 199.6 million by 2035, a 4.28% CAGR during 2026–2035, as housing delivery, energy rules and technical specifications lift insulation demand. Growth should be strongest in Queensland, where home starts are rising fastest. Specialty and polyolefin foams will take a larger share of commercial building and services work, while polystyrene shifts from consumer packaging to exempt building and cold chain uses. Suppliers that pair declared data with cutting and molding services should gain the most.
Frequently Asked Questions
How big is the Australia engineered foam market?
Which product type leads technical foam spending?
Which region leads technical foam spending in Australia?
How do energy rules affect foam demand?
Which application uses the most engineered foam?
How does the polystyrene packaging phase-out affect suppliers?
Which companies supply engineered foam in Australia?
What are the main challenges for foam suppliers?
Table of Content
Chapter 1 Market Segmentation
- 1.1 Segmentation Framework
- 1.1.1 Product and Service Classification
- 1.1.2 Application and End-Use Classification
- 1.1.3 Technology and Solution Classification
- 1.1.4 Customer and Distribution Channel Classification
- 1.1.5 Geographic Segmentation
- 1.1.6 Market Segment Definitions and Boundaries
- 1.2 By Product Type
- 1.2.1 Polyurethane Foams
- 1.2.2 Polystyrene Foams
- 1.2.3 Polyolefin Foams
- 1.2.4 Specialty Foams
- 1.3 By End-Use Industry
- 1.3.1 Construction
- 1.3.2 Packaging and Cold Chain
- 1.3.3 Mobility and Defence
- 1.3.4 Healthcare and Technical Manufacturing
- 1.4 By Application
- 1.4.1 Thermal Insulation
- 1.4.2 Protective Cushioning
- 1.4.3 Acoustic and Vibration Control
- 1.4.4 Buoyancy and Functional Support
- 1.5 By Sales Channel
- 1.5.1 Direct Contract Supply
- 1.5.2 Technical Distribution
- 1.5.3 Project Specification Supply
Chapter 2 Introduction
- 2.1 Report Objectives and Scope
- 2.2 Product Definition and Industry Terminology
- 2.3 Market Inclusions and Exclusions
- 2.4 Research Process
- 2.4.1 Primary Research and Expert Interviews
- 2.4.2 Secondary Research and Source Review
- 2.4.3 Top-Down and Bottom-Up Estimation
- 2.4.4 Data Triangulation and Verification
- 2.5 Market Size Measurement Basis
- 2.5.1 2025: USD 131.5 million → 2035: USD 199.6 million
- 2.6 Historical and Forecast Reference Periods
- 2.6.1 Historical Period: 2018-2025
- 2.6.2 Base Year: 2025
- 2.6.3 Forecast Period: 2025-2035
- 2.7 Research Assumptions and Limitations
Chapter 3 Executive Summary
- 3.1 Market Snapshot and Key Findings
- 3.2 Base-Year Market Size, 2025
- 3.3 Forecast Market Size, 2035
- 3.4 Revenue and Volume Growth Outlook
- 3.5 Key Demand and Supply Indicators
- 3.6 Leading Market Segments
- 3.7 Fastest-Growing Market Opportunities
- 3.8 Regional Performance Highlights
- 3.9 Technology and Industry Transformation
- 3.10 Competitive Landscape Summary
- 3.11 Analyst View and Strategic Implications
Chapter 4 Australia Engineered Foam Market Trends and Developments
- 4.1 Historical Industry Development, 2018-2025
- 4.2 Recent Market Trends and Developments
- 4.3 Demand and Customer Behavior Trends
- 4.4 Technology and Product Innovation
- 4.5 Artificial Intelligence, Automation and Digitalization
- 4.6 Local Manufacturing and Supply Chain Realignment
- 4.7 Industry Partnerships, Mergers and Acquisitions
- 4.8 Sustainability and Circular Economy Developments
- 4.9 Government and Private Sector Investment Trends
- 4.10 Emerging Business Models and Commercialization
- 4.11 Industry Developments and Announcements
Chapter 5 Australia Engineered Foam Market Production, Supply and Demand Analysis
- 5.1 Demand Trend and Consumption Analysis, 2018-2025
- 5.2 Demand Forecast, 2025-2035
- 5.3 Production and Output Trend, 2018-2025
- 5.4 Production and Output Forecast, 2025-2035
- 5.5 Installed Capacity and Capacity Utilization
- 5.6 Company-Wise Production Plants and Statistics
- 5.6.1 Installed Production Capacity
- 5.6.2 Actual Production
- 5.6.3 Planned Capacity and Expansion Targets
- 5.7 Supply Chain Structure and Procurement Trends
- 5.8 Supply-Demand Gap and Bottlenecks
- 5.9 Import Dependence and Sourcing Structure
- 5.10 Contract Manufacturing and Outsourcing
- 5.11 Regional Supply and Demand Concentration
Chapter 6 Australia Engineered Foam Market Pricing Analysis
- 6.1 Pricing Structure and Measurement
- 6.2 Historical Pricing Trends, 2018-2025
- 6.3 Pricing Outlook, 2025-2035
- 6.4 Average Selling Price and Unit Economics
- 6.5 Pricing by Product and Market Segment
- 6.6 Geographic Pricing Differences
- 6.7 Key Input, Energy, Labor and Logistics Costs
- 6.8 Contract Pricing and Purchasing Models
- 6.9 Pricing Sensitivity and Competitive Positioning
- 6.10 Price, Margin and Profitability Implications
Chapter 7 Australia Engineered Foam Market Dynamics
- 7.1 Market Growth Drivers
- 7.1.1 Demand-Side Drivers
- 7.1.2 Technology and Innovation Drivers
- 7.1.3 Infrastructure and Investment Drivers
- 7.1.4 Regulatory and Policy Drivers
- 7.2 Market Restraints
- 7.2.1 Cost and Affordability Constraints
- 7.2.2 Technology and Adoption Barriers
- 7.2.3 Supply Chain and Operational Constraints
- 7.3 Market Challenges
- 7.3.1 Competitive Pressure and Margin Erosion
- 7.3.2 Skills, Infrastructure and Implementation Gaps
- 7.4 Emerging Market Opportunities
- 7.5 Market Dynamics Impact and Time-Horizon Assessment
Chapter 8 Australia Engineered Foam Value Chain Analysis
- 8.1 Industry Value Chain Overview
- 8.2 Upstream Suppliers and Critical Inputs
- 8.3 Technology and Component Providers
- 8.4 Manufacturing or Service Delivery
- 8.5 Distribution, Channel Partners and Integrators
- 8.6 Downstream Applications and End Users
- 8.7 Value Addition and Profit Pools
- 8.8 Vertical Integration and Outsourcing
- 8.9 Supplier Concentration and Risk
- 8.10 Supply Chain Localization and Resilience
Chapter 9 Australia Engineered Foam Market Regulations and Policies
- 9.1 Relevant Laws, Standards and Compliance Frameworks
- 9.2 Product, Service, Safety and Quality Requirements
- 9.3 Government Policies, Incentives and Subsidies
- 9.4 Imports, Exports and Trade Barriers
- 9.5 Public Procurement and Local Content Requirements
- 9.6 Environmental and Sustainability Compliance
- 9.7 Upcoming Policy Changes and Market Implications
Chapter 10 Australia Engineered Foam Market Hotspots and Opportunities
- 10.1 Market Opportunity Mapping and Growth Hotspots
- 10.2 High-Growth Applications and Customer Groups
- 10.3 Underserved Markets and White-Space Opportunities
- 10.4 Emerging Technology and Product Opportunities
- 10.5 New Capacity and Investment Hotspots
- 10.6 Market Entry and Expansion Opportunities
- 10.7 Distribution and Partnership Opportunities
- 10.8 Near-Term and Long-Term Commercial Potential
- 10.9 Opportunity Attractiveness and Execution Risks
Chapter 11 Australia Engineered Foam Market Outlook, 2025-2035
- 11.1 Market Size and Analysis
- 11.1.1 Revenue (Market Measurement: 2025: USD 131.5 million → 2035: USD 199.6 million)
- 11.1.2 Market Volume and Quantity Sold
- 11.1.3 Historical Market Size, 2018-2025
- 11.1.4 Base-Year Market Size, 2025
- 11.2 Market Forecast, 2025-2035
- 11.2.1 Revenue Forecast to 2035
- 11.2.2 Volume Forecast to 2035
- 11.2.3 CAGR and Year-on-Year Growth
- 11.2.4 Incremental Revenue Opportunity
- 11.3 Forecast Assumptions and Scenario Analysis
- 11.3.1 Base-Case Forecast
- 11.3.2 Optimistic and Conservative Scenarios
- 11.3.3 Technology, Pricing and Policy Sensitivities
- 11.4 Market Attractiveness and Growth Outlook
Chapter 12 Australia Engineered Foam Market Segmentation and Outlook
- 12.1 Segmentation Summary and Market Shares, 2025
- 12.2 Largest and Fastest-Growing Segments
- 12.3 By Product Type - Market Size and Forecast, 2025-2035
- 12.3.1 Segment Definition and Scope
- 12.3.2 Historical Market Size, 2018-2025
- 12.3.3 Revenue Forecast, 2025-2035
- 12.3.4 Volume Forecast, 2025-2035
- 12.3.5 Base-Year Market Share, 2025
- 12.3.6 Segment CAGR and Growth Drivers
- 12.3.7 Subsegment Market Size and Forecast
- 12.3.7.1 Polyurethane Foams
- 12.3.7.2 Polystyrene Foams
- 12.3.7.3 Polyolefin Foams
- 12.3.7.4 Specialty Foams
- 12.3.8 Subsegment Pricing and Adoption Trends
- 12.3.9 Leading Suppliers and Competition
- 12.3.10 Regional Demand and Opportunities
- 12.4 By End-Use Industry - Market Size and Forecast, 2025-2035
- 12.4.1 Segment Definition and Scope
- 12.4.2 Historical Market Size, 2018-2025
- 12.4.3 Revenue Forecast, 2025-2035
- 12.4.4 Volume Forecast, 2025-2035
- 12.4.5 Base-Year Market Share, 2025
- 12.4.6 Segment CAGR and Growth Drivers
- 12.4.7 Subsegment Market Size and Forecast
- 12.4.7.1 Construction
- 12.4.7.2 Packaging and Cold Chain
- 12.4.7.3 Mobility and Defence
- 12.4.7.4 Healthcare and Technical Manufacturing
- 12.4.8 Subsegment Pricing and Adoption Trends
- 12.4.9 Leading Suppliers and Competition
- 12.4.10 Regional Demand and Opportunities
- 12.5 By Application - Market Size and Forecast, 2025-2035
- 12.5.1 Segment Definition and Scope
- 12.5.2 Historical Market Size, 2018-2025
- 12.5.3 Revenue Forecast, 2025-2035
- 12.5.4 Volume Forecast, 2025-2035
- 12.5.5 Base-Year Market Share, 2025
- 12.5.6 Segment CAGR and Growth Drivers
- 12.5.7 Subsegment Market Size and Forecast
- 12.5.7.1 Thermal Insulation
- 12.5.7.2 Protective Cushioning
- 12.5.7.3 Acoustic and Vibration Control
- 12.5.7.4 Buoyancy and Functional Support
- 12.5.8 Subsegment Pricing and Adoption Trends
- 12.5.9 Leading Suppliers and Competition
- 12.5.10 Regional Demand and Opportunities
- 12.6 By Sales Channel - Market Size and Forecast, 2025-2035
- 12.6.1 Segment Definition and Scope
- 12.6.2 Historical Market Size, 2018-2025
- 12.6.3 Revenue Forecast, 2025-2035
- 12.6.4 Volume Forecast, 2025-2035
- 12.6.5 Base-Year Market Share, 2025
- 12.6.6 Segment CAGR and Growth Drivers
- 12.6.7 Subsegment Market Size and Forecast
- 12.6.7.1 Direct Contract Supply
- 12.6.7.2 Technical Distribution
- 12.6.7.3 Project Specification Supply
- 12.6.8 Subsegment Pricing and Adoption Trends
- 12.6.9 Leading Suppliers and Competition
- 12.6.10 Regional Demand and Opportunities
- 12.7 Segment Growth Comparison
- 12.8 Segment Attractiveness and Priority Matrix
Chapter 13 Australia Engineered Foam End-Use and Application Market Outlook
- 13.1 End-Use Industry and Customer Demand Structure
- 13.2 Leading Applications and Customer Groups
- 13.3 End-Use Market Size, Share and Forecast
- 13.4 Major End-Use Industry Deep Dives
- 13.4.1 Customer Requirements and Use Cases
- 13.4.2 Demand and Replacement Cycles
- 13.4.3 Technical and Regulatory Considerations
- 13.4.4 Purchasing and Procurement Models
- 13.4.5 Leading Vendors and Distribution Channels
- 13.4.6 Forecast and Commercial Opportunities
- 13.5 Emerging Applications and Cross-Segment Demand
- 13.6 End-Use Industry Investment Priorities
Chapter 14 Australia Engineered Foam Geographic Market Outlook, 2025-2035
- 14.1 Domestic Market Distribution and Demand Clusters
- 14.2 State- or Province-Wise Market Size and Forecast, 2025-2035
- 14.3 City and Metropolitan Market Outlook
- 14.4 Industrial, Manufacturing and Commercial Clusters
- 14.5 Geographic Concentration of Key End Users
- 14.6 Local Pricing and Purchasing Differences
- 14.7 Domestic Production Facilities and Capacity Map
- 14.8 Local Infrastructure and Project Pipeline
- 14.9 State-Level Policy and Incentive Differences
- 14.10 Subnational Investment Hotspots and Opportunities
- 14.11 Distribution and Logistics Networks
- 14.12 Domestic Competitive Footprint
Chapter 15 Australia Engineered Foam Technology, Innovation and Sustainability Outlook
- 15.1 Technology Landscape and Maturity
- 15.2 Product, Process and Service Innovation
- 15.3 AI, Automation and Digital Tools in the Industry
- 15.4 Technology Adoption and Performance Benchmarking
- 15.5 Innovation Pipeline and R&D Investment
- 15.6 Patent and Intellectual Property Trends
- 15.7 Energy Efficiency and Resource Management
- 15.8 Sustainability, Recycling and Circularity
- 15.9 Technology Roadmap, 2025-2035
- 15.10 Risks of Obsolescence and Technology Substitution
Chapter 16 Australia Engineered Foam Market Key Strategic Imperatives
- 16.1 Growth and Market Entry Priorities
- 16.2 High-Return Products and Segments
- 16.3 Pricing, Profitability and Cost Optimization
- 16.4 Technology Investment and Product Differentiation
- 16.5 Supply Chain Localization and Resilience
- 16.6 Distribution and Customer Acquisition
- 16.7 Partnership, Acquisition and Capacity Strategy
- 16.8 Regional Expansion Priorities
- 16.9 Short-, Medium- and Long-Term Actions
Chapter 17 Competition Outlook
- 17.1 Industry Competition Characteristics
- 17.2 Market Structure and Concentration
- 17.3 Market Share and Competitive Positioning, 2025
- 17.4 Company-Wise Revenue and Product Benchmarking
- 17.5 Production and Service Capacity Benchmarking
- 17.6 Technology, Pricing and Differentiation
- 17.7 Regional Footprint and Distribution Strength
- 17.8 Mergers, Acquisitions and Strategic Alliances
- 17.9 New Entrants and Competitive Threats
- 17.10 Porter's Five Forces and Industry Attractiveness
- 17.11 Competitive Outlook, 2025-2035
Chapter 18 Company Profiles
- 18.1 Company Coverage and Selection Criteria
- 18.2 Joyce Foam Products
- 18.2.1 Business Description
- 18.2.2 Company Ownership and Geographic Presence
- 18.2.3 Product and Service Portfolio
- 18.2.4 Manufacturing and Operating Footprint
- 18.2.5 Production Capacity and Expansion Plans
- 18.2.6 Financial Performance and Investment
- 18.2.7 Market Share and Competitive Position
- 18.2.8 Technology and Innovation Capabilities
- 18.2.9 Strategic Alliances or Partnerships
- 18.2.10 Recent Developments
- 18.2.11 Growth Strategy and Outlook
- 18.3 Dunlop Foams
- 18.4 Foamex Group
- 18.5 Kingspan Insulation Australia
- 18.6 Sekisui Foam Australia
- 18.7 Other Relevant Market Participants
Note: Every listed company is profiled on the structure shown under the first company. The company list is preliminary and may change based on research findings, market developments, data availability and client requirements.
Chapter 19 Disclaimer
- 19.1 Research and Forecast Disclaimer
- 19.2 Data Source and Estimation Limitations
Note: The depth of individual sections depends on data availability for this market. Volume, capacity, trade and other unit-based metrics are included where applicable.

