
Rust-free reinforcement and composites widen basalt demand
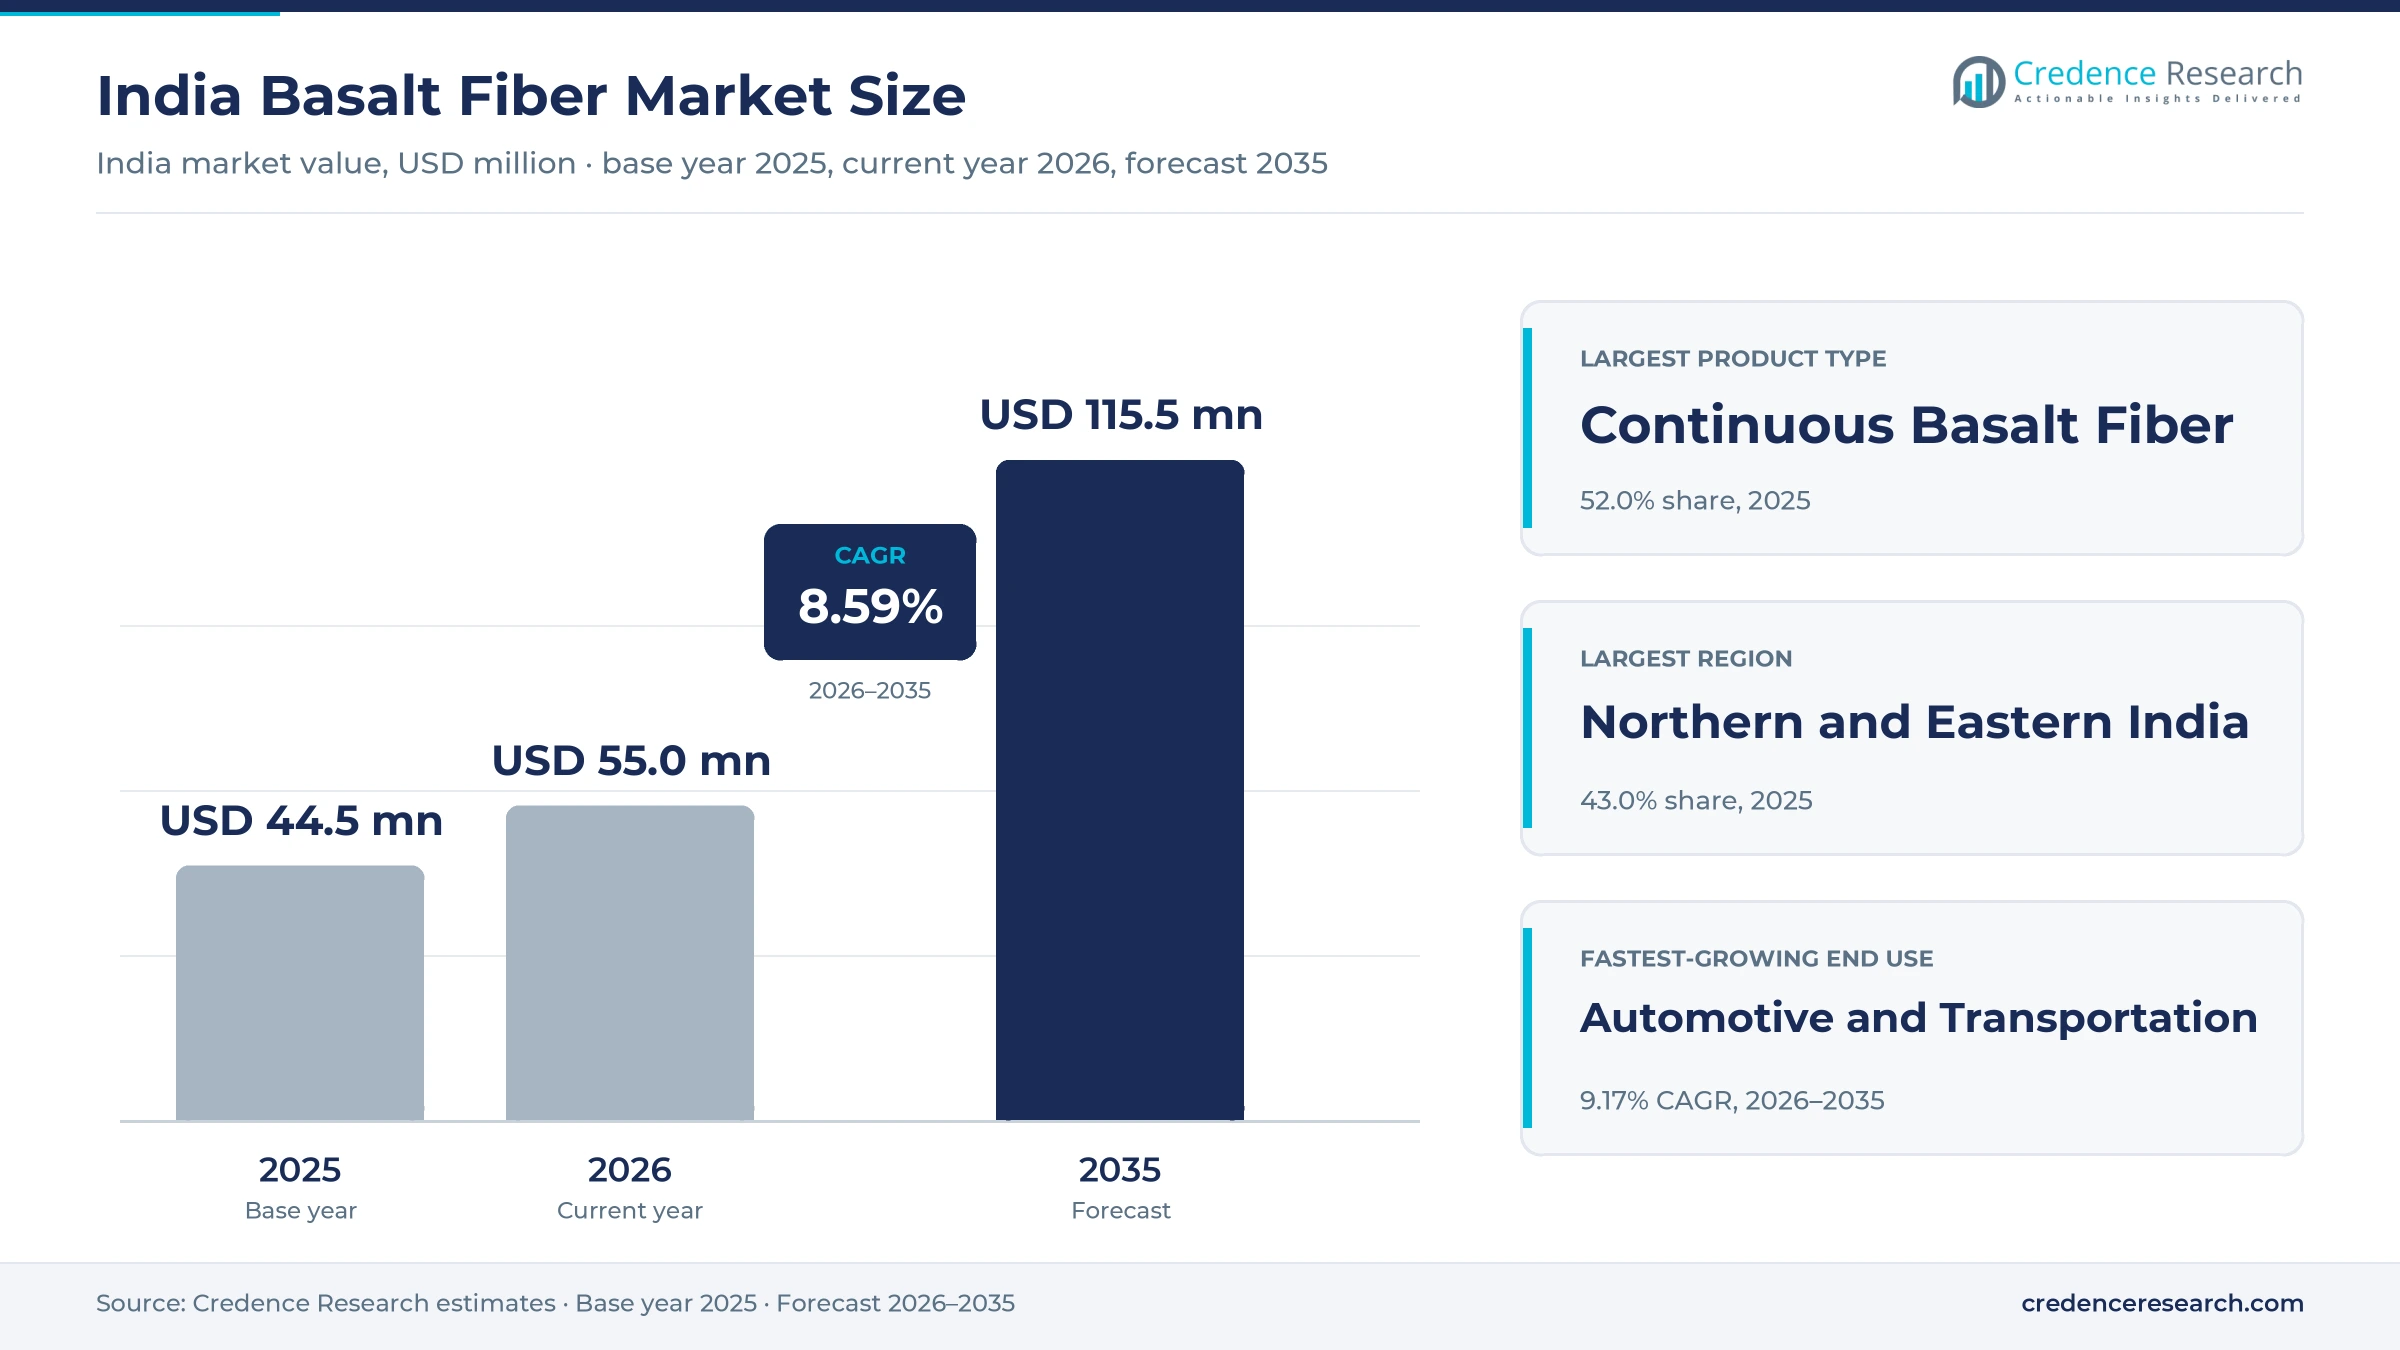
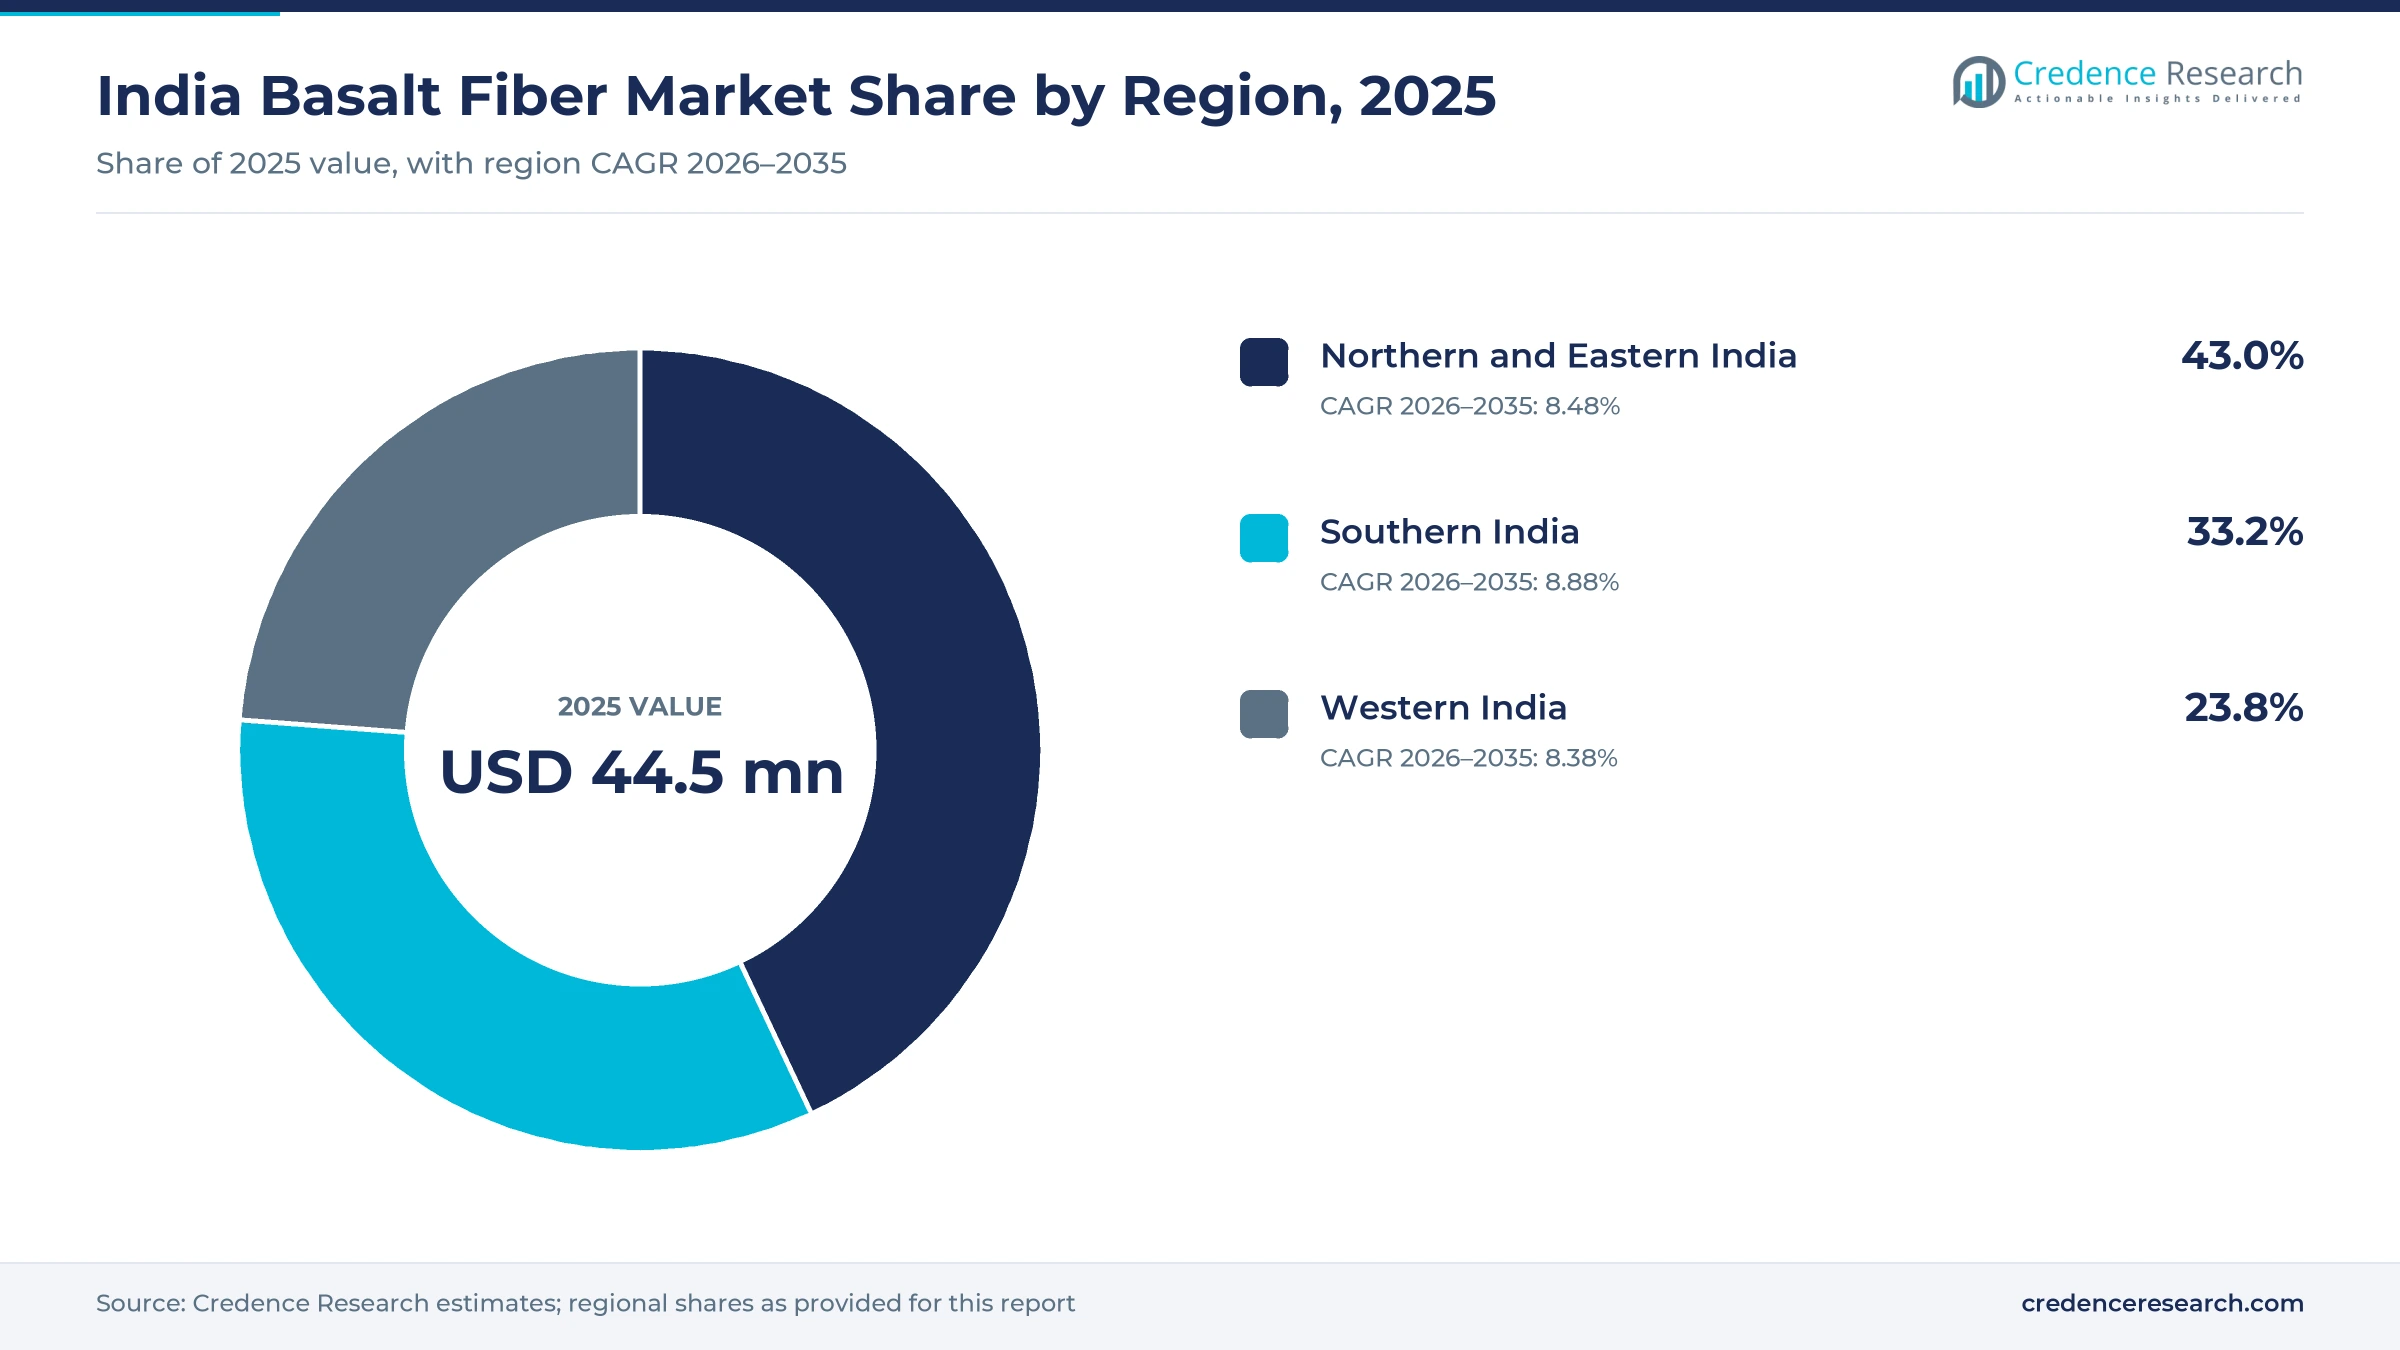
The India basalt fiber market was valued at USD 44.5 million in 2025 and is projected to increase from USD 55.0 million in 2026 to USD 115.5 million by 2035, registering a CAGR of 8.59% during 2026–2035. Demand comes from bridge, highway and coastal projects that need reinforcement that does not rust, from vehicle makers that want lighter heat-resistant parts, and from wind and industrial composite molders. Northern and Eastern India held the largest regional share, 43.0% in 2025, because large highway, metro and power programs run across the northern plains and eastern states. Southern India grows fastest at 8.88% a year, as Tamil Nadu and Karnataka add wind capacity and vehicle component output. The Bureau of Indian Standards has also issued test methods for polymer reinforcing bars, which gives public engineers a common basis to approve basalt bars in concrete.
Which basalt products and buyers does this estimate count?
The estimate measures the sales value of basalt fiber products bought in India, including continuous basalt fiber, chopped basalt fiber and basalt staple fiber sold as roving, yarn, fabrics, tapes, mesh and reinforcement. It counts material bought by composite processors, construction material producers and vehicle suppliers through direct sales, distributors and project tenders. Values are stated in USD million at current prices, converted from Indian rupees at average annual exchange rates.
The estimate excludes crushed basalt aggregate, stone wool insulation and finished parts where basalt is only one input among many. The value chain runs from basalt rock melting and fiber drawing, mostly outside India, through importers, converters and bar makers to contractors, precast plants, composite molders and vehicle suppliers.
India Basalt Fiber Market Insights
- The India basalt fiber market was valued at USD 44.5 million in 2025 and is projected to reach USD 115.5 million by 2035, registering a CAGR of 8.59% during 2026–2035.
- Northern and Eastern India held 43.0% of 2025 value, because large highway, metro and power programs run across those states.
- Continuous basalt fiber led with 52.0% of 2025 value, since rovings feed reinforcing bars, fabrics and pultruded profiles.
- India set capital expenditure at Rs 11.21 lakh crore for 2025-26 in the budget of Feb. 1, 2025, which supports long-life infrastructure materials.
- Automotive and transportation grows fastest by end use at 9.17% a year, during 2026–2035, as electric vehicle makers look for light heat-resistant parts.
Continuous rovings and concrete reinforcement lead sales
Why do continuous rovings lead product sales?
Based on product type, the market is categorized into continuous basalt fiber, chopped basalt fiber and basalt staple fiber. Continuous Basalt Fiber led with 52.0% of 2025 value, because long rovings feed reinforcing bars, woven fabrics, tapes and pultruded profiles. Continuous Basalt Fiber also grows fastest at 8.86% a year, as bar makers and composite molders expand capacity for infrastructure and vehicle parts.
Why does construction remain the largest end use?
Based on end-use industry, the market is categorized into construction and infrastructure, automotive and transportation, and energy and industrial. Construction and Infrastructure led with 58.0% of 2025 value, because bridges, drains, sea walls and floors need reinforcement that does not rust. Automotive and Transportation grows fastest at 9.17% a year, as vehicle makers test basalt parts for heat shields and battery enclosures.
Why does concrete reinforcement take the largest share?
Based on application, the market is categorized into concrete reinforcement, composite manufacturing and thermal and fire protection. Concrete Reinforcement led with 48.0% of 2025 value, because bars, mesh and chopped strands go straight into slabs, pavements and precast units. Composite Manufacturing grows fastest at 8.95% a year, as molders use basalt rovings and fabrics in pipes, tanks, panels and blade parts.
Why do direct enterprise sales move the most material?
Based on sales channel, the market is categorized into direct enterprise sales, specialty material distributors and tender and EPC procurement. Direct Enterprise Sales led with 41.0% of 2025 value, because large precast and composite plants buy rovings directly from producers and importers. Tender and EPC Procurement grows fastest at 9.28% a year, as public contractors write basalt bars into project specifications.
| Segment Group | Leading Sub-segment | Share, 2025 | Fastest-growing Sub-segment | CAGR, 2026–2035 |
|---|---|---|---|---|
| By Product Type | Continuous Basalt Fiber | 52.0% | Continuous Basalt Fiber | 8.86% |
| By End-Use Industry | Construction and Infrastructure | 58.0% | Automotive and Transportation | 9.17% |
| By Application | Concrete Reinforcement | 48.0% | Composite Manufacturing | 8.95% |
| By Sales Channel | Direct Enterprise Sales | 41.0% | Tender and EPC Procurement | 9.28% |
Request a Free Sample
Fill in your details and we'll send you a free sample report.
- Sample data tables & charts
- Research methodology
Infrastructure, vehicles and wind power lift demand
How do corrosion and durability needs lift infrastructure demand?
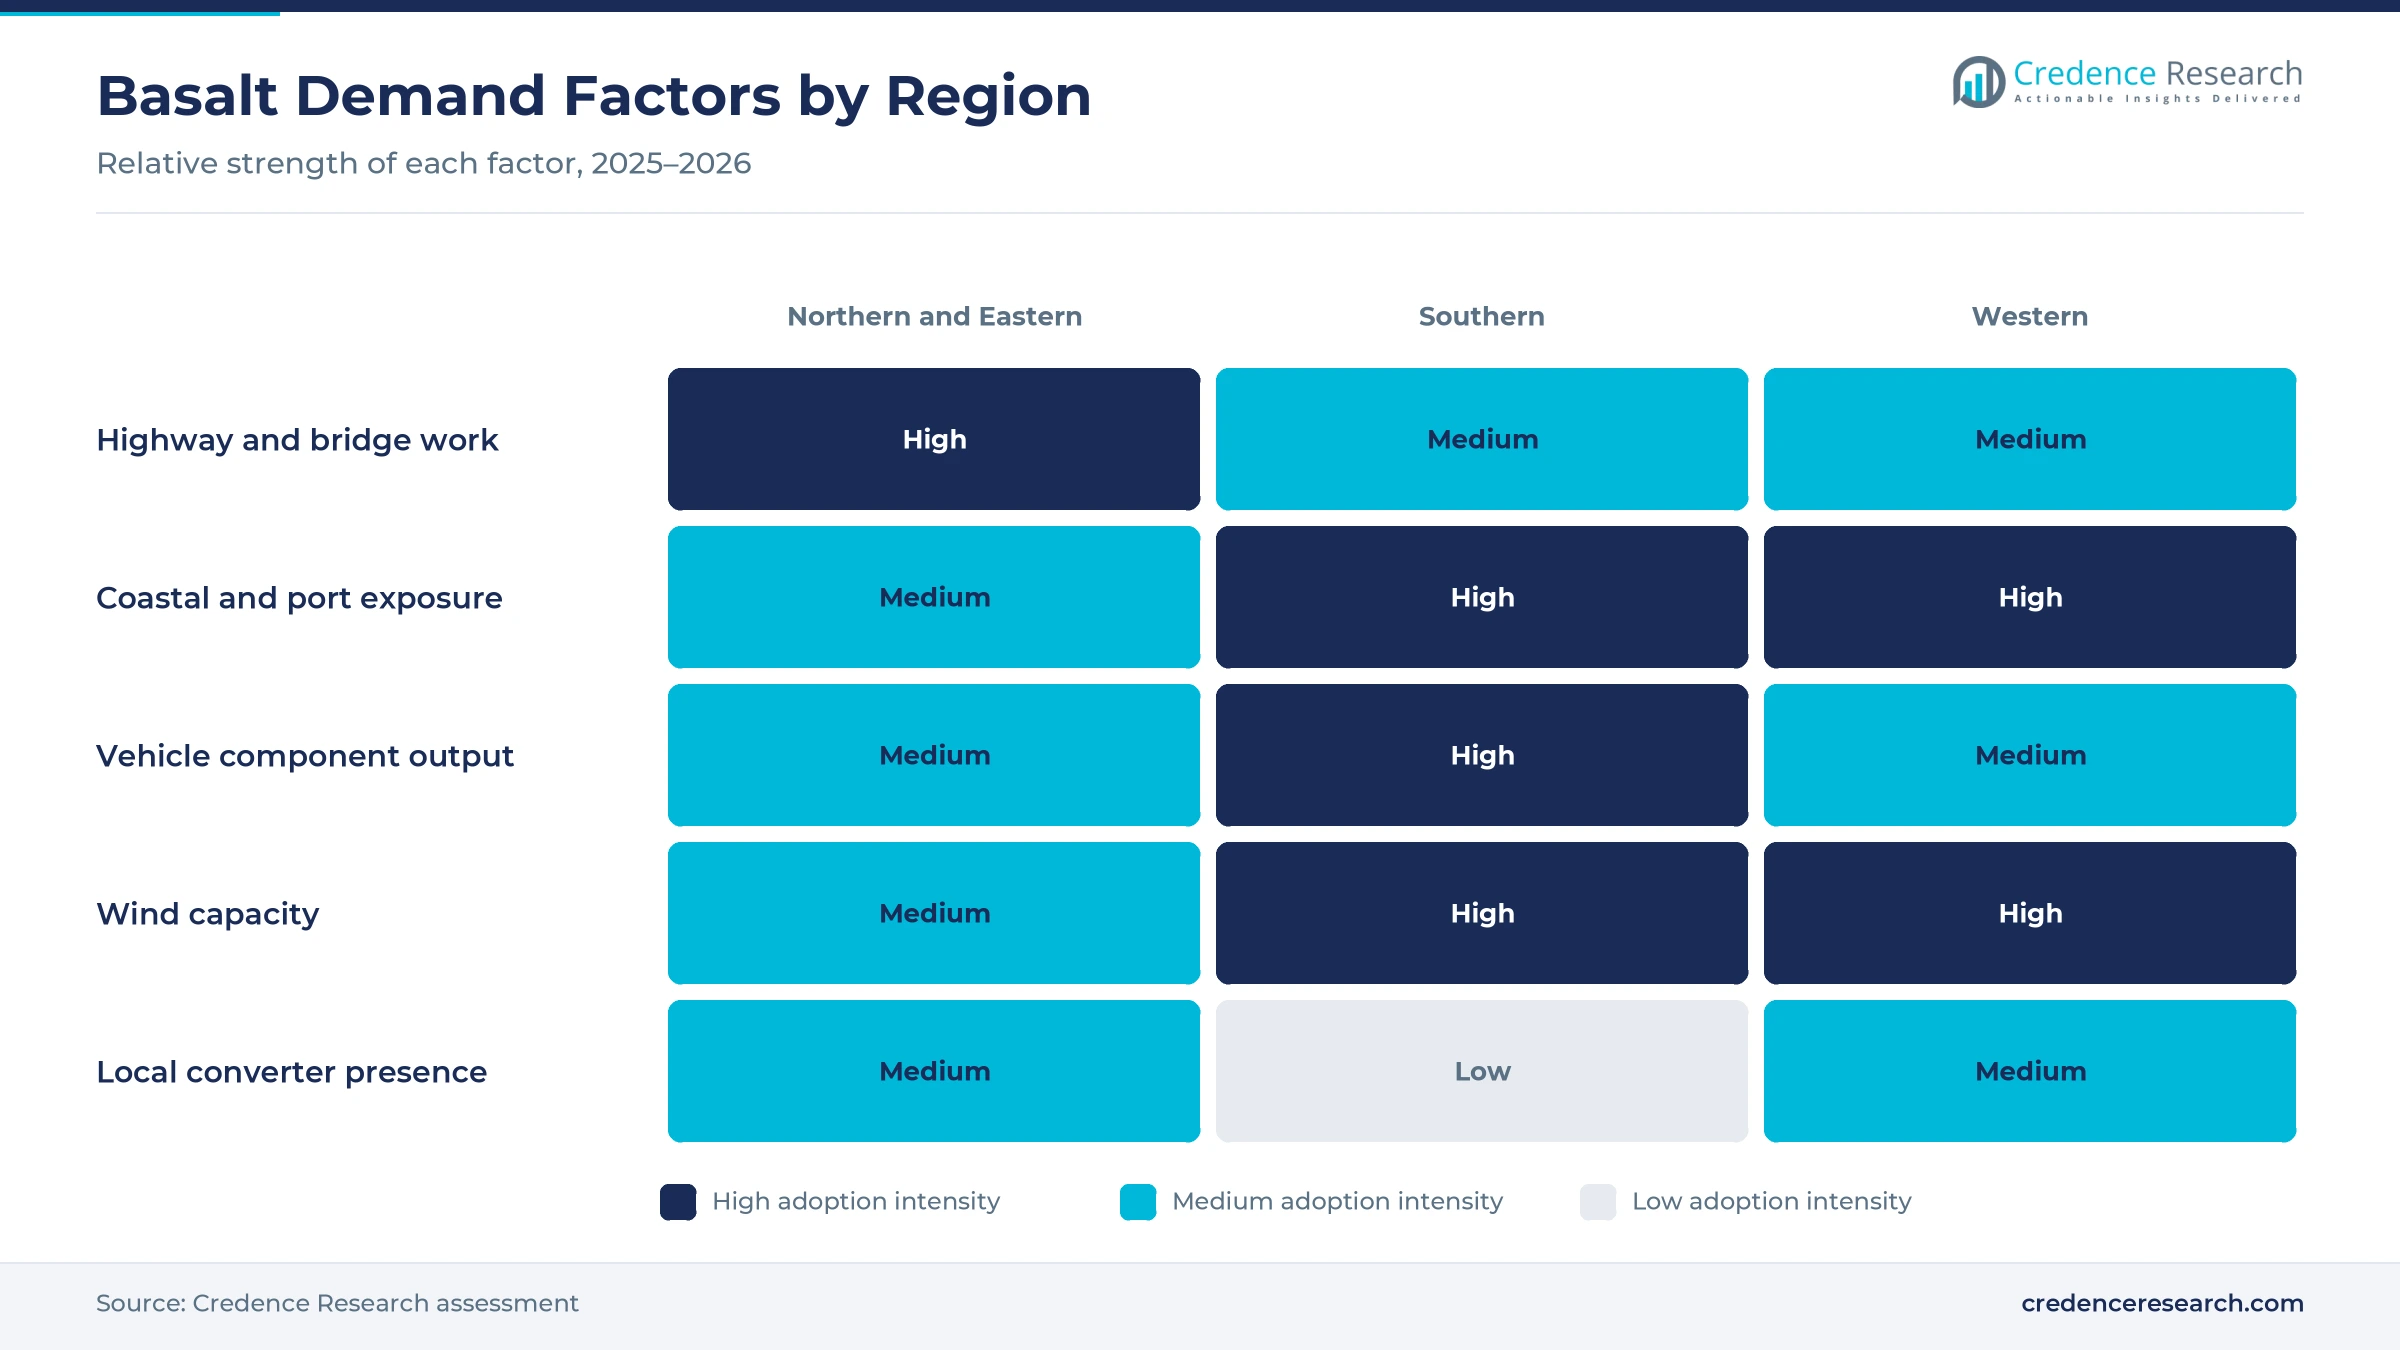
Infrastructure durability needs lift demand, because basalt bars and chopped strands do not rust in wet, salty or chemical-laden concrete. The finance minister announced capital expenditure of Rs 11.21 lakh crore for 2025-26 in the Union Budget of Feb. 1, 2025, according to The Tribune. NHAI announced in April 2025 that it built more than 5,600 km of national highways in 2024-25, beating its 5,150 km target, with capital spending above Rs 2.5 lakh crore. The Shipping Ministry also announced a revised national coastline of 11,098.81 km in May 2025, which widens the zone where sea air corrodes steel. As a result, construction and infrastructure led with 58.0% of 2025 value, as engineers specify composite rebar for bridge decks, sea walls and drains.
Why do vehicle lightweighting and heat resistance matter?
Automotive lightweighting supports demand, because basalt composites cut part weight and resist heat near engines, exhausts and battery packs. Passenger vehicle sales reached a record 4.3 million units in 2024-25, and exports rose 14.6% to 0.77 million units, according to SIAM data. The country also registered 2.55 million electric vehicles in 2025-26, up 25% from a year earlier, for an 8.3% share of all registrations, according to EV Infrastructure News. Battery enclosures, heat shields and underbody panels in these vehicles need materials that stay stable under heat and vibration. Consequently, automotive and transportation grows fastest by end use at 9.17% a year, as tier suppliers test basalt fabrics alongside carbon composites.
How does wind and industrial composite growth widen demand?
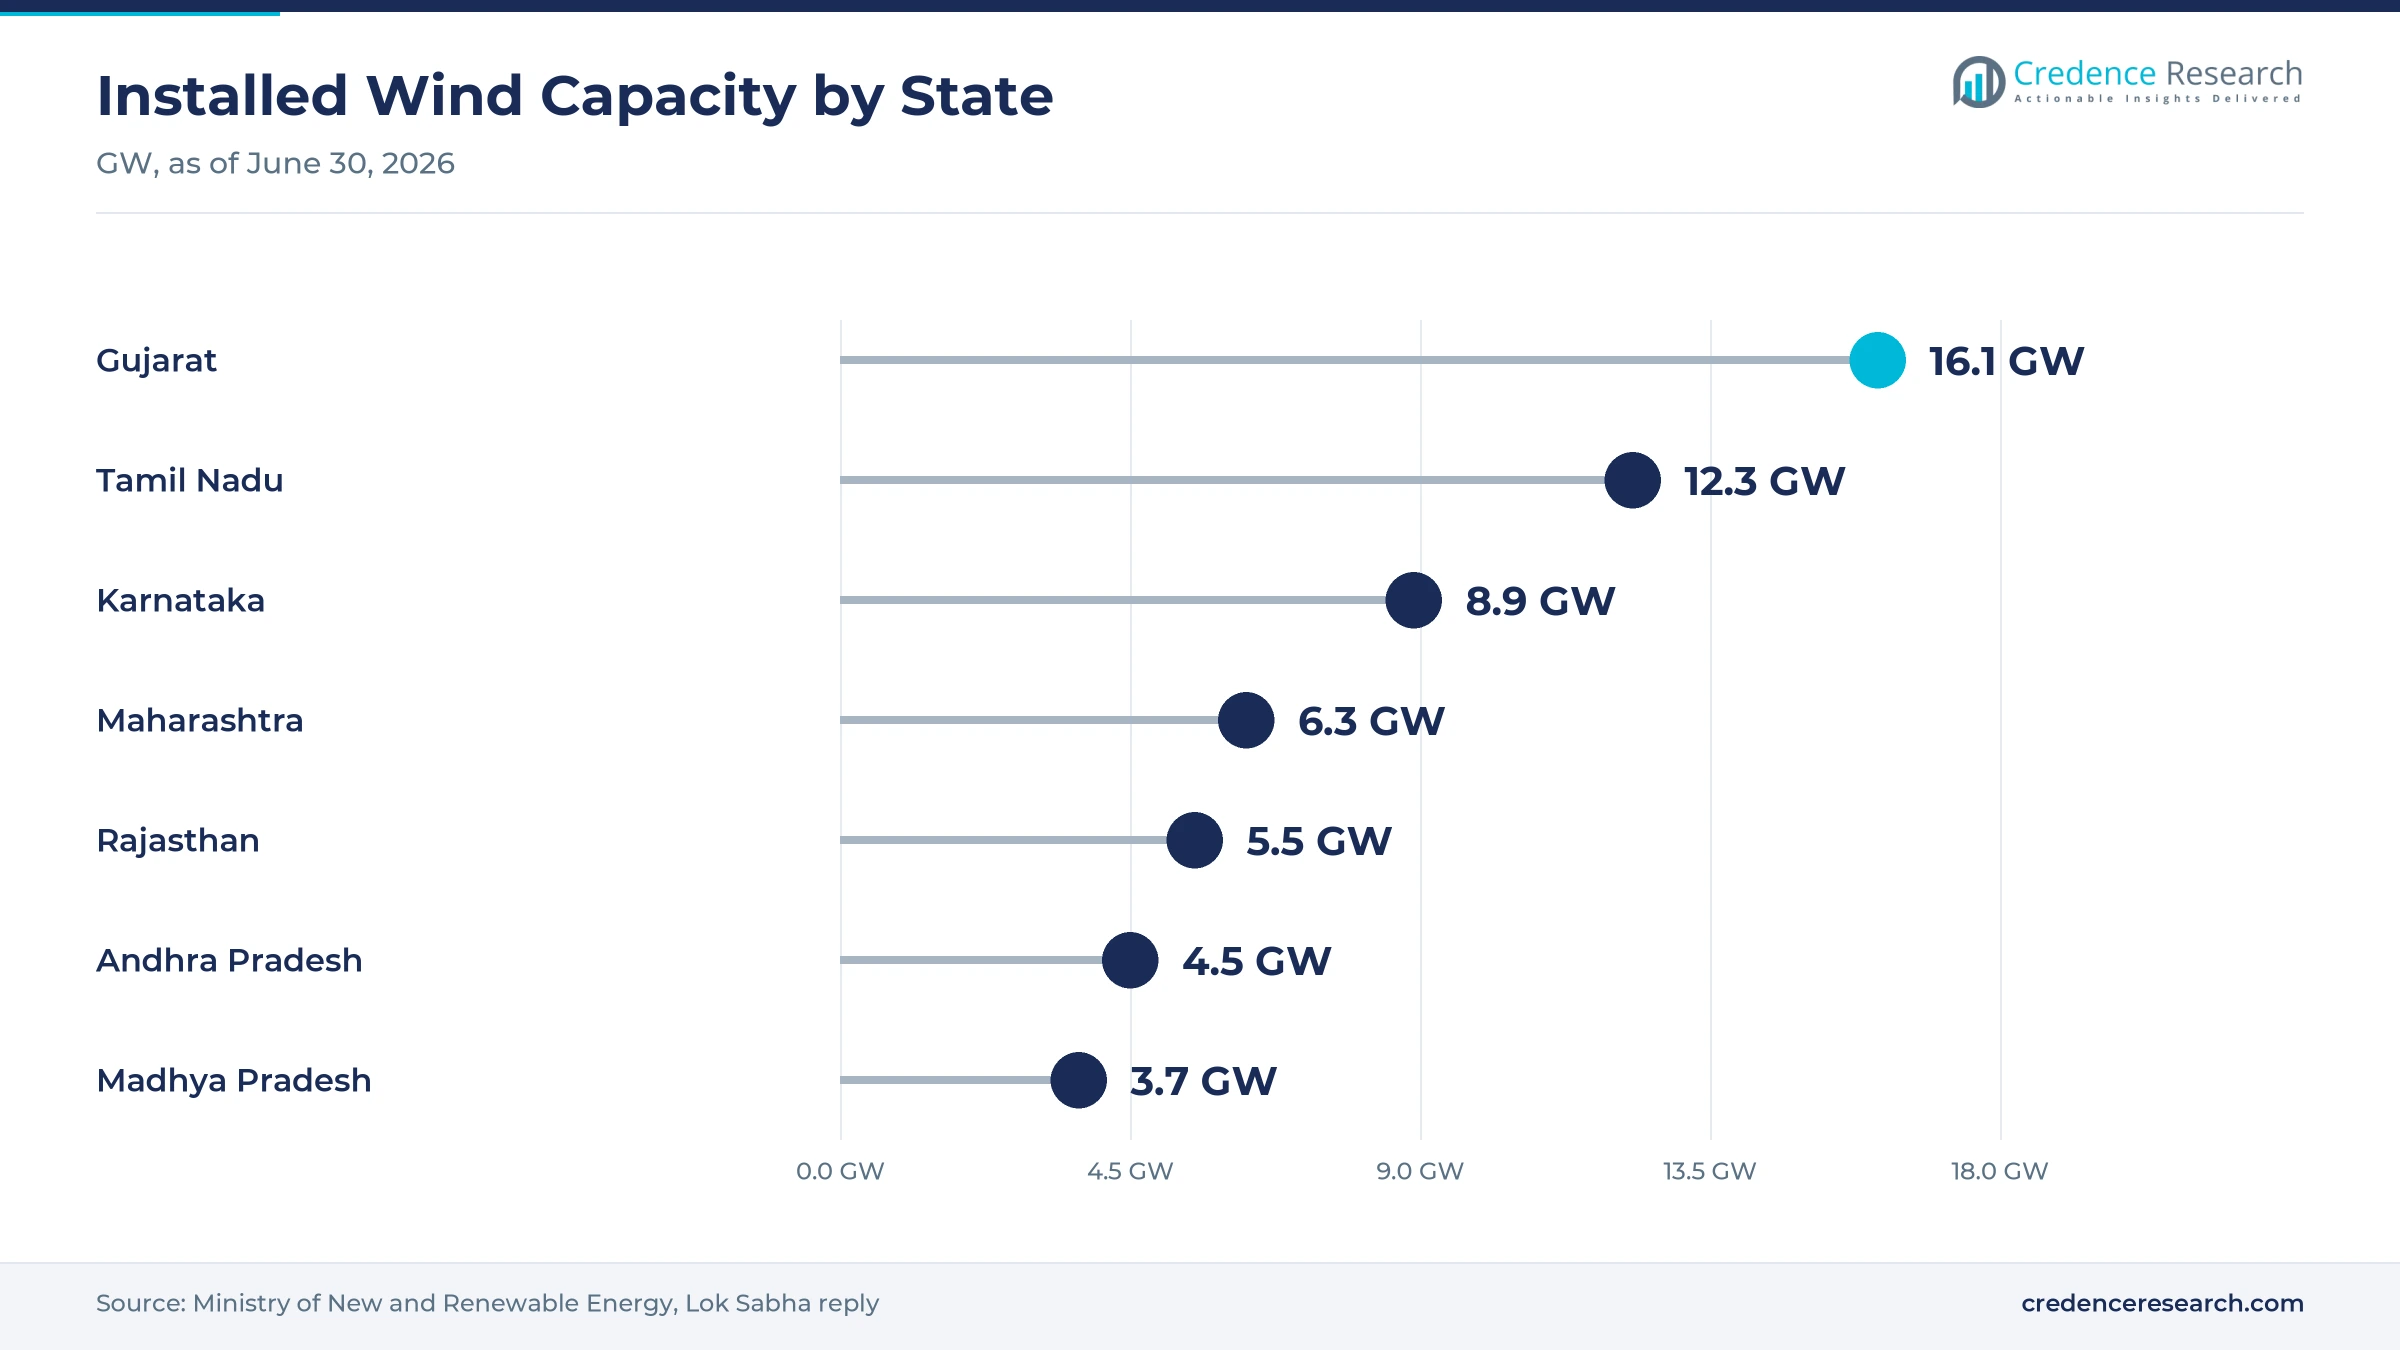
Wind and industrial composite work widens the buyer base, because blade, nacelle and tank makers need durable fabrics and rovings. Installed wind capacity reached 57,443 MW on June 30, 2026, after a record 6,057 MW was added in 2025-26, according to Indian Masterminds citing ministry data. Gujarat led with 16,086 MW, followed by Tamil Nadu with 12,273 MW and Karnataka with 8,896 MW. Wind generation also rose to a record 106.7 billion units in 2025-26, which keeps turbine makers and service firms busy. In turn, composite manufacturing grows fastest by application at 8.95% a year, as molders trial basalt rovings in rotor blades, pipes and industrial tanks.
Why do testing standards and investment support adoption?
Clearer testing standards and strong investment support adoption, because public engineers need agreed methods before they approve new reinforcement. The Bureau of Indian Standards introduced in 2023 IS 18255:2023, which sets test methods for fiber-reinforced polymer bars used as straight reinforcement in concrete. Gross capital formation reached 34.6% of GDP in 2025, up from 28.9% in 2020, according to World Bank data. Jogani Reinforcement's basalt fiber also won a Product of the Year award at World of Concrete India on Oct. 17, 2024, in Mumbai. As a result, tender and EPC procurement grows fastest by sales channel at 9.28% a year, as contractors write basalt products into project specifications.
Chopped strands, local converters and coastal work gain
How is the shift to chopped strands in special concrete playing out?
Concrete producers are shifting toward chopped basalt strands for crack control in high-grade and ultra-high-performance concrete. Jogani Reinforcement promoted its basalt fiber for UHPC, industrial flooring and industrial reinforcement when it won the award at World of Concrete India 2024. That show ran from Oct. 16 to 18, 2024, at the Bombay Exhibition Centre and featured more than 200 exhibitors. Concrete reinforcement already leads applications with 48.0% of 2025 value, because chopped strands mix easily into slabs and floors. Ready-mix plants also dose strands together with construction chemicals such as superplasticizers. Therefore, chopped products gain trial orders from precast yards and flooring contractors.
Why are local converters and distributors rising?
Local converters and distributors are rising, because many Indian buyers want small lots, quick delivery and technical help close to their plants. Funique Composites, incorporated in New Delhi in July 2022, sells glass and basalt fiber products alongside carbon fabrics, aramid fabrics and vacuum bagging consumables. Jogani Reinforcement, which cites more than 20 years of experience and several patents, sells basalt fiber next to steel and brass-coated micro fibers. World of Concrete India 2024 drew more than 200 exhibitors in Mumbai, which shows how many suppliers now court contractors. Direct enterprise sales still lead with 41.0% of 2025 value, because large plants buy rovings straight from producers. In turn, specialty distributors gain ground with small molders and flooring contractors.
Can thermal and fire protection open new demand?
Thermal and fire protection offers a clear opening, because basalt fabrics tolerate high heat and do not burn, which suits battery shields, exhaust wraps and fire blankets. The country registered 30.84 million vehicles in 2025-26, and electric models made up 8.3% of that total, which raises demand for battery heat barriers. Passenger vehicle exports also grew to 0.77 million units in 2024-25, and export models must meet strict fire and heat rules abroad. Basalt fabrics compete here with fire-resistant fabrics made from glass, aramid and silica. As a result, suppliers that pass vehicle and building fire tests can win long supply contracts with vehicle and insulation makers.
Will coastal and marine works open a larger opening?
Coastal and marine works offer a second opening, because sea water and salty air shorten the life of steel bars in jetties, sea walls and port pavements. The official coastline length was revised to 11,098.81 km in May 2025, up from 7,561.60 km under the older method of measurement. Highway capital spending above Rs 2.5 lakh crore in 2024-25 also includes coastal roads and bridges in several states. Southern India grows fastest of the three zones, because Tamil Nadu, Karnataka and Andhra Pradesh combine long coasts with active ports and power projects. Therefore, basalt bars that cut repair costs over a 50-year design life can win more coastal tenders.
Price, imports and design codes slow wider adoption
How does a higher price than glass slow adoption?
A higher price than glass fiber slows adoption, because many buyers compare basalt only on cost per kilogram. Contractors working on tight tenders often choose glass fiber or steel unless the specification asks for basalt. As a result, basalt wins mainly where corrosion, heat or chemical exposure justifies the extra cost. Life-cycle cost studies and pilot projects that show lower repair spending help suppliers close this gap with public owners and private developers.
Why does import dependence raise supply risk?
Import dependence raises supply risk, because most continuous basalt fiber sold in India is melted and drawn abroad. Freight delays, currency swings and duty changes can therefore raise landed costs for converters and bar makers. Small buyers that order in low volumes feel these changes first. In turn, local stock held by distributors and long-term supply contracts with producers help reduce delivery gaps and keep project schedules on track for contractors.
How do limited design codes hold back structural use?
Limited design codes hold back structural use, because test methods alone do not tell engineers how to size basalt bars in beams, slabs and decks. Many public agencies therefore approve basalt only for non-structural or trial works. Consequently, demand from large public projects grows more slowly than the technical case suggests. National design guidance and more field trials on highways and coastal works would speed approvals and give contractors the confidence to bid with basalt.
Will uneven quality weaken buyer confidence?
Uneven quality weakens buyer confidence across the market, because fiber diameter, sizing and tensile strength vary between producers and batches. Buyers without testing labs may find that some lots perform below their datasheets. Therefore, some contractors return to steel or glass after one poor experience. Third-party testing, batch certificates and supplier audits help build trust across the supply chain and support repeat orders from large buyers.
Northern and Eastern India leads, the south grows fastest
| Region | Value, 2025 (USD million) | Share, 2025 | CAGR, 2026–2035 |
|---|---|---|---|
| Northern and Eastern India | 19.1 | 43.0% | 8.48% |
| Southern India | 14.8 | 33.2% | 8.88% |
| Western India | 10.6 | 23.8% | 8.38% |
How do northern and eastern projects keep this zone ahead?
Northern and Eastern India is the largest region, with 43.0% of 2025 basalt demand. The region grows at 8.48% a year, because large highway, metro, power and housing programs run across the northern plains and eastern states. Rajasthan had 5,516 MW of installed wind capacity and Madhya Pradesh had 3,686 MW on June 30, 2026. Funique Composites supplies basalt and glass products from New Delhi to molders in the capital region. As a result, the zone leads in both concrete reinforcement and composite use.
Why is Southern India the fastest-growing region?
Southern India held 33.2% of 2025 basalt demand and grows fastest at 8.88% a year. Tamil Nadu had 12,273 MW of installed wind capacity, Karnataka had 8,896 MW and Andhra Pradesh had 4,461 MW on June 30, 2026. Long coasts, active ports and vehicle component plants in these states also create demand for rust-free bars and heat resistant fabrics. Therefore, the south adds composite and coastal demand faster than the other two zones.
How do western industrial states add demand?
Western India held 23.8% of 2025 basalt demand and grows at 8.38% a year. Gujarat led all states with 16,086 MW of installed wind capacity on June 30, 2026, and Maharashtra had 6,318 MW. Jogani Reinforcement introduced its basalt fiber to contractors at World of Concrete India 2024 in Mumbai, where it won a Product of the Year award. In turn, the region adds demand from precast yards, ports and composite molders around Mumbai, Pune and Ahmedabad.
Testing rules, budgets and awards shape the market
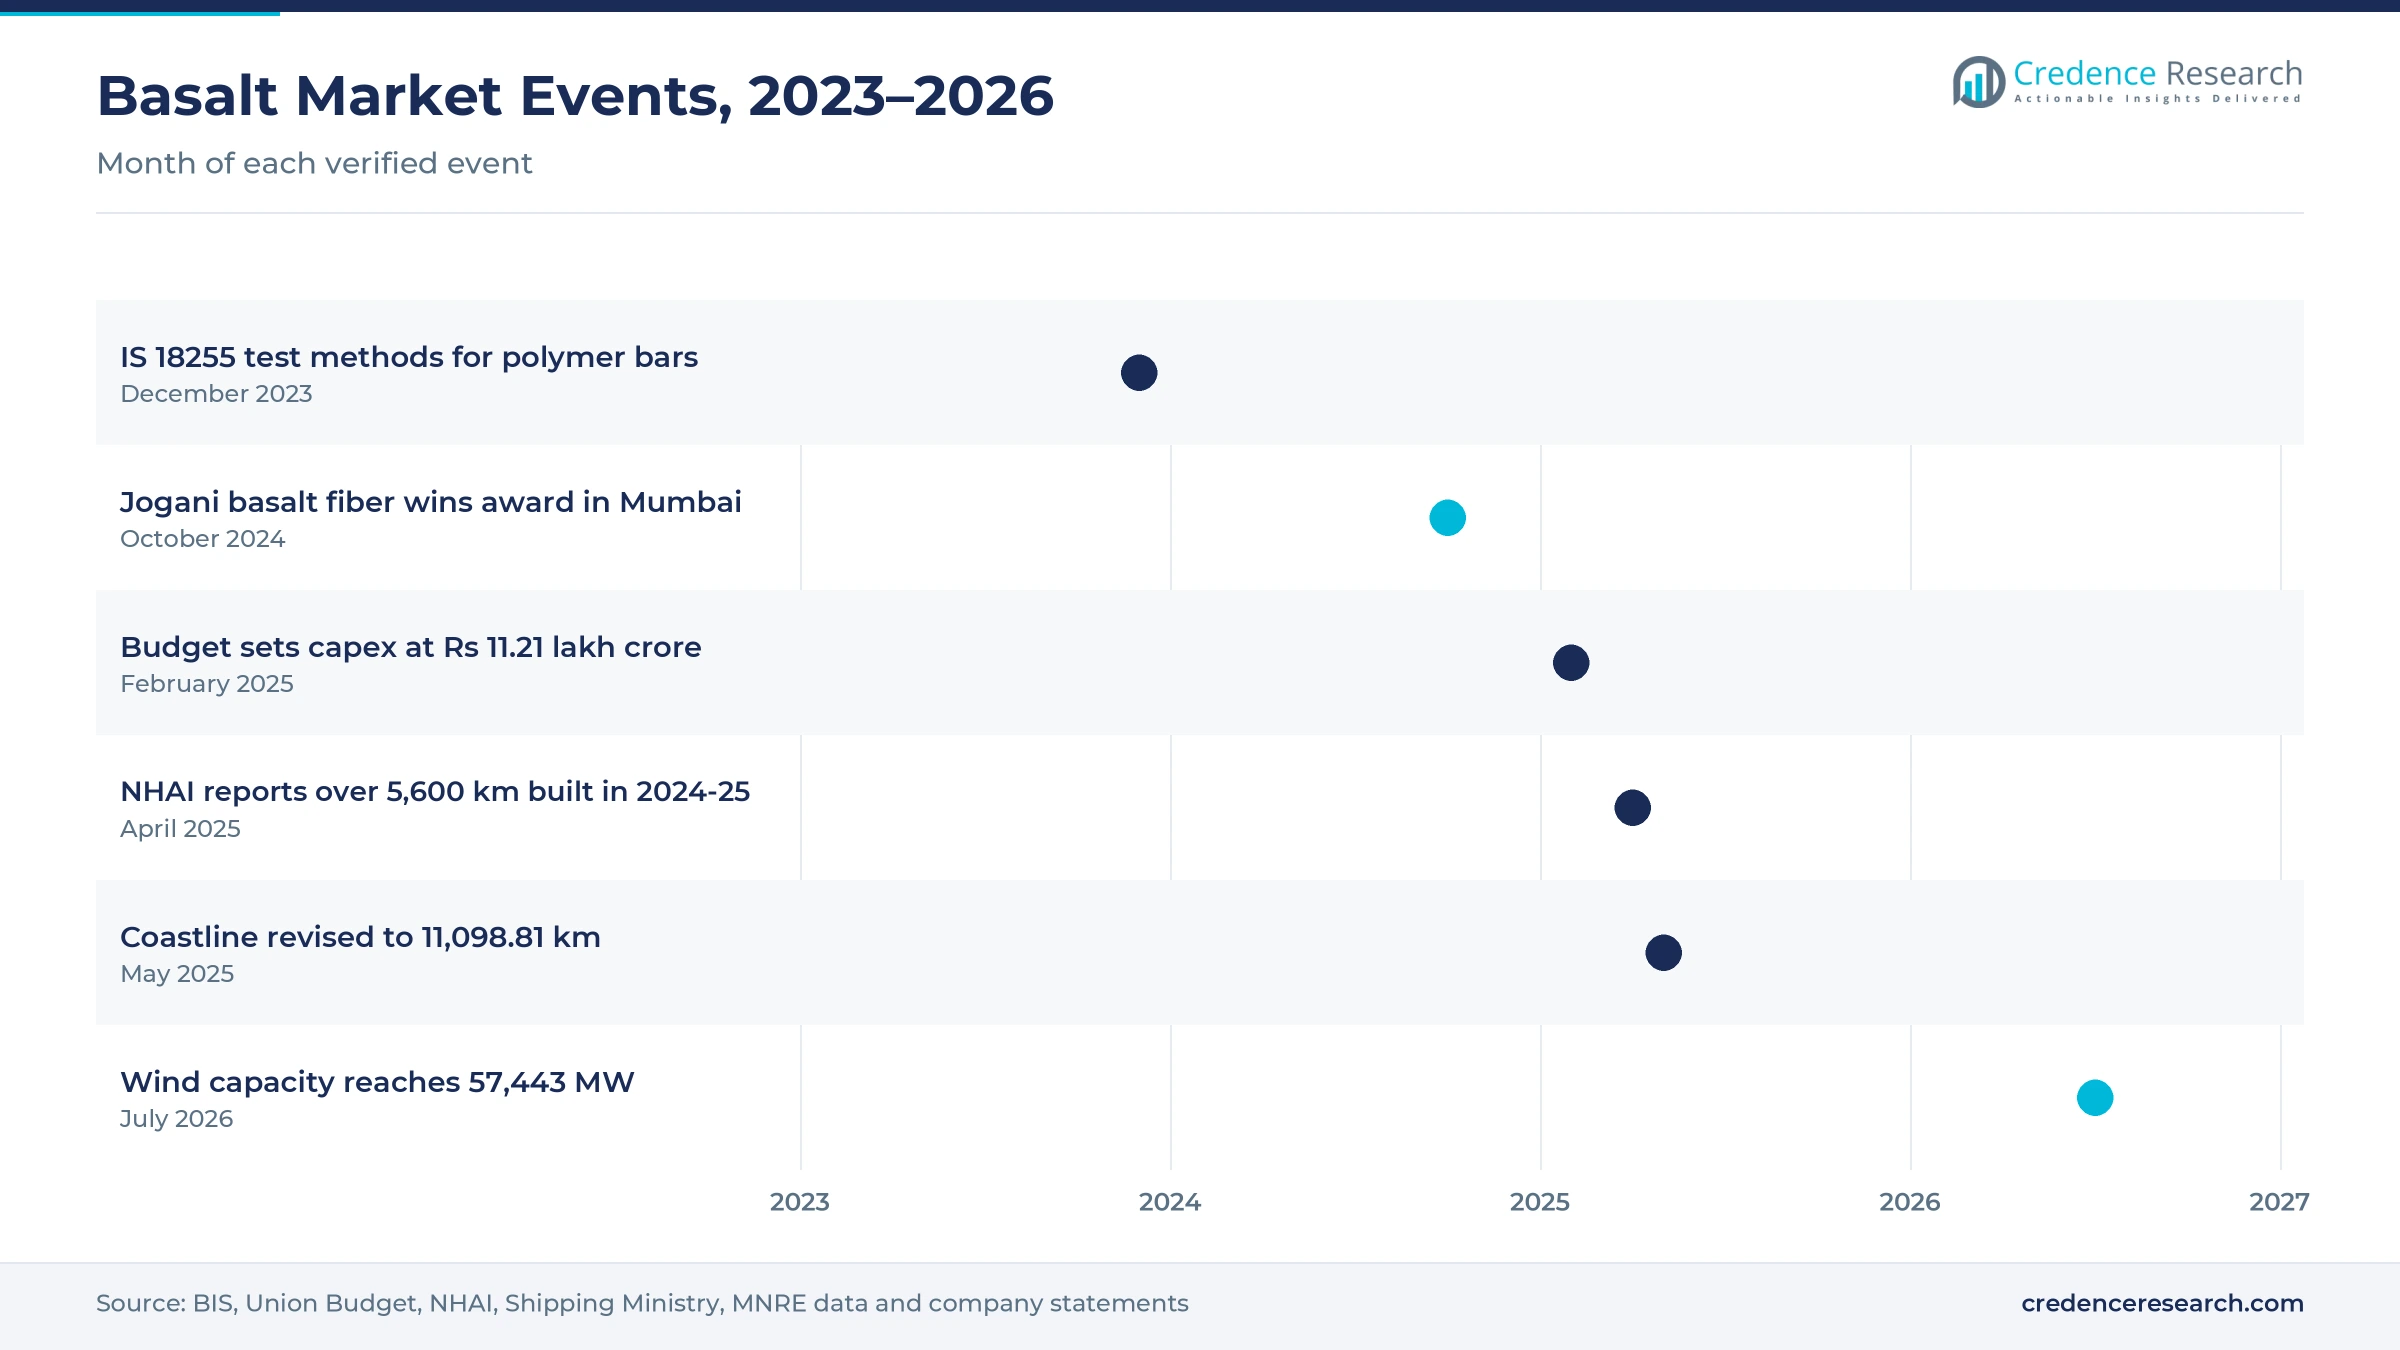
| Development | Status and market relevance |
|---|---|
| In December 2023, the Bureau of Indian Standards published IS 18255:2023 for testing fiber-reinforced polymer bars. | Gives engineers common test methods for basalt and other polymer bars |
| In October 2024, Jogani Reinforcement won a Product of the Year award at World of Concrete India in Mumbai. | Award covered its basalt fiber and brass-coated micro steel fibers |
| In February 2025, the Union Budget set capital expenditure at Rs 11.21 lakh crore for 2025-26. | Supports highways, bridges and other long-life infrastructure |
| In April 2025, NHAI reported more than 5,600 km of national highways built in 2024-25. | Beat the 5,150 km target with spending above Rs 2.5 lakh crore |
| In July 2026, ministry data showed installed wind capacity of 57,443 MW at the end of June. | A record 6,057 MW was added in 2025-26 |
Melt quality, sizing and pultrusion improve products
- Better melt control gives more even fiber diameter and strength, which helps converters meet datasheet values batch after batch.
- Improved sizing chemistry helps basalt rovings bond with epoxy, vinyl ester and polyester resins, which raises the strength of bars and laminates.
- Pultrusion of reinforcing bars turns continuous rovings into ribbed or sand-coated bars that site crews can cut and tie like steel.
- Standard test methods such as IS 18255:2023 let public engineers compare bars from different suppliers on the same basis.
Need a Custom Version of This Report?
Tailor the scope, geography, or segments to your exact requirements.
- Custom geography or segment scope
- Direct access to our analyst team
Global producers and Indian converters compete on supply
Competition mixes large basalt producers abroad with Indian converters and distributors that sell to local buyers. Jogani Reinforcement sells basalt fiber alongside steel and brass-coated micro fibers for concrete, and its basalt fiber won a Product of the Year award at World of Concrete India in October 2024. Funique Composites, based in New Delhi since 2022, sells glass and basalt fiber products with carbon and aramid materials for composite molders. International producers such as Zhejiang GBF, Kamenny Vek, Technobasalt-Invest, Basaltex, Mafic, Isomatex, Sudaglass and Shanxi Basalt Fiber Technology are listed for this market, although their direct presence in India could not be confirmed. Companies compete on price per kilogram, consistent quality, sizing for local resins, delivery times and technical support for contractors and molders.
Companies profiled and their roles in this market
| Company | Type | Role in the market |
|---|---|---|
| JOGANI Reinforcement | Domestic company (Mumbai) | Basalt fiber and micro steel fibers for UHPC, flooring and industrial concrete |
| Funique Composites Pvt. Ltd. | Domestic company (New Delhi) | Glass and basalt fiber products with carbon and aramid materials |
Credence Research view on basalt reinforcement demand
Credence Research's view is that the India basalt fiber market will grow steadily from a small base, as public infrastructure, electric vehicles and wind power all need materials that resist rust and heat. IS 18255:2023 gives engineers a common way to test bars, although national design guidance is still needed for wide structural use. Local converters and distributors are making basalt easier to buy in small lots. However, a higher price than glass fiber and reliance on imported fiber will keep adoption focused on projects where durability clearly pays back.
How the basalt material spending estimate was built
The report uses 2025 as the base year, with values in USD million at current prices. Market values come from the Credence Research model, which combines infrastructure spending, vehicle output, wind capacity additions, composite use and average material prices. Regional shares are those set for this report, and segment splits by product type, end use, application and sales channel are Credence Research estimates. Sources used are government budget and ministry data, Indian standards, World Bank data, industry association data, company statements and news reports, and no interviews or surveys were used.
Durable infrastructure and composites set the path to 2035
The market is expected to reach USD 115.5 million by 2035, an 8.59% CAGR during 2026–2035, as infrastructure owners, vehicle makers and composite molders adopt basalt products. Growth should be strongest in Southern India and in vehicle and composite uses, while Northern and Eastern India keeps the largest share. National design guidance and local stock would support wider use in public works. In contrast, sharp price gaps with glass fiber or supply delays from abroad would slow adoption and hurt smaller converters.
Frequently Asked Questions
How big is the India basalt fiber market?
Which region leads basalt demand in India?
Which region grows fastest?
Which product type holds the largest share?
Which end use grows fastest?
Is there an Indian standard for testing polymer reinforcing bars?
Who are the main basalt suppliers in India?
What are the main risks to growth?
Table of Content
Chapter 1 Market Segmentation
- 1.1 Segmentation Framework
- 1.1.1 Product and Service Classification
- 1.1.2 Application and End-Use Classification
- 1.1.3 Technology and Solution Classification
- 1.1.4 Customer and Distribution Channel Classification
- 1.1.5 Geographic Segmentation
- 1.1.6 Market Segment Definitions and Boundaries
- 1.2 By Product Type
- 1.2.1 Continuous Basalt Fiber
- 1.2.2 Chopped Basalt Fiber
- 1.2.3 Basalt Staple Fiber
- 1.3 By End-Use Industry
- 1.3.1 Construction and Infrastructure
- 1.3.2 Automotive and Transportation
- 1.3.3 Energy and Industrial
- 1.4 By Application
- 1.4.1 Concrete Reinforcement
- 1.4.2 Composite Manufacturing
- 1.4.3 Thermal and Fire Protection
- 1.5 By Sales Channel
- 1.5.1 Direct Enterprise Sales
- 1.5.2 Specialty Material Distributors
- 1.5.3 Tender and EPC Procurement
Chapter 2 Introduction
- 2.1 Report Objectives and Scope
- 2.2 Product Definition and Industry Terminology
- 2.3 Market Inclusions and Exclusions
- 2.4 Research Process
- 2.4.1 Primary Research and Expert Interviews
- 2.4.2 Secondary Research and Source Review
- 2.4.3 Top-Down and Bottom-Up Estimation
- 2.4.4 Data Triangulation and Verification
- 2.5 Market Size Measurement Basis
- 2.5.1 2025: USD 44.5 million → 2035: USD 115.5 million
- 2.6 Historical and Forecast Reference Periods
- 2.6.1 Historical Period: 2018-2025
- 2.6.2 Base Year: 2025
- 2.6.3 Forecast Period: 2025-2035
- 2.7 Research Assumptions and Limitations
Chapter 3 Executive Summary
- 3.1 Market Snapshot and Key Findings
- 3.2 Base-Year Market Size, 2025
- 3.3 Forecast Market Size, 2035
- 3.4 Revenue and Volume Growth Outlook
- 3.5 Key Demand and Supply Indicators
- 3.6 Leading Market Segments
- 3.7 Fastest-Growing Market Opportunities
- 3.8 Regional Performance Highlights
- 3.9 Technology and Industry Transformation
- 3.10 Competitive Landscape Summary
- 3.11 Analyst View and Strategic Implications
Chapter 4 India Basalt Fiber Market Trends and Developments
- 4.1 Historical Industry Development, 2018-2025
- 4.2 Recent Market Trends and Developments
- 4.3 Demand and Customer Behavior Trends
- 4.4 Technology and Product Innovation
- 4.5 Artificial Intelligence, Automation and Digitalization
- 4.6 Local Manufacturing and Supply Chain Realignment
- 4.7 Industry Partnerships, Mergers and Acquisitions
- 4.8 Sustainability and Circular Economy Developments
- 4.9 Government and Private Sector Investment Trends
- 4.10 Emerging Business Models and Commercialization
- 4.11 Industry Developments and Announcements
Chapter 5 India Basalt Fiber Market Production, Supply and Demand Analysis
- 5.1 Demand Trend and Consumption Analysis, 2018-2025
- 5.2 Demand Forecast, 2025-2035
- 5.3 Production and Output Trend, 2018-2025
- 5.4 Production and Output Forecast, 2025-2035
- 5.5 Installed Capacity and Capacity Utilization
- 5.6 Company-Wise Production Plants and Statistics
- 5.6.1 Installed Production Capacity
- 5.6.2 Actual Production
- 5.6.3 Planned Capacity and Expansion Targets
- 5.7 Supply Chain Structure and Procurement Trends
- 5.8 Supply-Demand Gap and Bottlenecks
- 5.9 Import Dependence and Sourcing Structure
- 5.10 Contract Manufacturing and Outsourcing
- 5.11 Regional Supply and Demand Concentration
Chapter 6 India Basalt Fiber Market Pricing Analysis
- 6.1 Pricing Structure and Measurement
- 6.2 Historical Pricing Trends, 2018-2025
- 6.3 Pricing Outlook, 2025-2035
- 6.4 Average Selling Price and Unit Economics
- 6.5 Pricing by Product and Market Segment
- 6.6 Geographic Pricing Differences
- 6.7 Key Input, Energy, Labor and Logistics Costs
- 6.8 Contract Pricing and Purchasing Models
- 6.9 Pricing Sensitivity and Competitive Positioning
- 6.10 Price, Margin and Profitability Implications
Chapter 7 India Basalt Fiber Market Dynamics
- 7.1 Market Growth Drivers
- 7.1.1 Demand-Side Drivers
- 7.1.2 Technology and Innovation Drivers
- 7.1.3 Infrastructure and Investment Drivers
- 7.1.4 Regulatory and Policy Drivers
- 7.2 Market Restraints
- 7.2.1 Cost and Affordability Constraints
- 7.2.2 Technology and Adoption Barriers
- 7.2.3 Supply Chain and Operational Constraints
- 7.3 Market Challenges
- 7.3.1 Competitive Pressure and Margin Erosion
- 7.3.2 Skills, Infrastructure and Implementation Gaps
- 7.4 Emerging Market Opportunities
- 7.5 Market Dynamics Impact and Time-Horizon Assessment
Chapter 8 India Basalt Fiber Value Chain Analysis
- 8.1 Industry Value Chain Overview
- 8.2 Upstream Suppliers and Critical Inputs
- 8.3 Technology and Component Providers
- 8.4 Manufacturing or Service Delivery
- 8.5 Distribution, Channel Partners and Integrators
- 8.6 Downstream Applications and End Users
- 8.7 Value Addition and Profit Pools
- 8.8 Vertical Integration and Outsourcing
- 8.9 Supplier Concentration and Risk
- 8.10 Supply Chain Localization and Resilience
Chapter 9 India Basalt Fiber Market Regulations and Policies
- 9.1 Relevant Laws, Standards and Compliance Frameworks
- 9.2 Product, Service, Safety and Quality Requirements
- 9.3 Government Policies, Incentives and Subsidies
- 9.4 Imports, Exports and Trade Barriers
- 9.5 Public Procurement and Local Content Requirements
- 9.6 Environmental and Sustainability Compliance
- 9.7 Upcoming Policy Changes and Market Implications
Chapter 10 India Basalt Fiber Market Hotspots and Opportunities
- 10.1 Market Opportunity Mapping and Growth Hotspots
- 10.2 High-Growth Applications and Customer Groups
- 10.3 Underserved Markets and White-Space Opportunities
- 10.4 Emerging Technology and Product Opportunities
- 10.5 New Capacity and Investment Hotspots
- 10.6 Market Entry and Expansion Opportunities
- 10.7 Distribution and Partnership Opportunities
- 10.8 Near-Term and Long-Term Commercial Potential
- 10.9 Opportunity Attractiveness and Execution Risks
Chapter 11 India Basalt Fiber Market Outlook, 2025-2035
- 11.1 Market Size and Analysis
- 11.1.1 Revenue (Market Measurement: 2025: USD 44.5 million → 2035: USD 115.5 million)
- 11.1.2 Market Volume and Quantity Sold
- 11.1.3 Historical Market Size, 2018-2025
- 11.1.4 Base-Year Market Size, 2025
- 11.2 Market Forecast, 2025-2035
- 11.2.1 Revenue Forecast to 2035
- 11.2.2 Volume Forecast to 2035
- 11.2.3 CAGR and Year-on-Year Growth
- 11.2.4 Incremental Revenue Opportunity
- 11.3 Forecast Assumptions and Scenario Analysis
- 11.3.1 Base-Case Forecast
- 11.3.2 Optimistic and Conservative Scenarios
- 11.3.3 Technology, Pricing and Policy Sensitivities
- 11.4 Market Attractiveness and Growth Outlook
Chapter 12 India Basalt Fiber Market Segmentation and Outlook
- 12.1 Segmentation Summary and Market Shares, 2025
- 12.2 Largest and Fastest-Growing Segments
- 12.3 By Product Type - Market Size and Forecast, 2025-2035
- 12.3.1 Segment Definition and Scope
- 12.3.2 Historical Market Size, 2018-2025
- 12.3.3 Revenue Forecast, 2025-2035
- 12.3.4 Volume Forecast, 2025-2035
- 12.3.5 Base-Year Market Share, 2025
- 12.3.6 Segment CAGR and Growth Drivers
- 12.3.7 Subsegment Market Size and Forecast
- 12.3.7.1 Continuous Basalt Fiber
- 12.3.7.2 Chopped Basalt Fiber
- 12.3.7.3 Basalt Staple Fiber
- 12.3.8 Subsegment Pricing and Adoption Trends
- 12.3.9 Leading Suppliers and Competition
- 12.3.10 Regional Demand and Opportunities
- 12.4 By End-Use Industry - Market Size and Forecast, 2025-2035
- 12.4.1 Segment Definition and Scope
- 12.4.2 Historical Market Size, 2018-2025
- 12.4.3 Revenue Forecast, 2025-2035
- 12.4.4 Volume Forecast, 2025-2035
- 12.4.5 Base-Year Market Share, 2025
- 12.4.6 Segment CAGR and Growth Drivers
- 12.4.7 Subsegment Market Size and Forecast
- 12.4.7.1 Construction and Infrastructure
- 12.4.7.2 Automotive and Transportation
- 12.4.7.3 Energy and Industrial
- 12.4.8 Subsegment Pricing and Adoption Trends
- 12.4.9 Leading Suppliers and Competition
- 12.4.10 Regional Demand and Opportunities
- 12.5 By Application - Market Size and Forecast, 2025-2035
- 12.5.1 Segment Definition and Scope
- 12.5.2 Historical Market Size, 2018-2025
- 12.5.3 Revenue Forecast, 2025-2035
- 12.5.4 Volume Forecast, 2025-2035
- 12.5.5 Base-Year Market Share, 2025
- 12.5.6 Segment CAGR and Growth Drivers
- 12.5.7 Subsegment Market Size and Forecast
- 12.5.7.1 Concrete Reinforcement
- 12.5.7.2 Composite Manufacturing
- 12.5.7.3 Thermal and Fire Protection
- 12.5.8 Subsegment Pricing and Adoption Trends
- 12.5.9 Leading Suppliers and Competition
- 12.5.10 Regional Demand and Opportunities
- 12.6 By Sales Channel - Market Size and Forecast, 2025-2035
- 12.6.1 Segment Definition and Scope
- 12.6.2 Historical Market Size, 2018-2025
- 12.6.3 Revenue Forecast, 2025-2035
- 12.6.4 Volume Forecast, 2025-2035
- 12.6.5 Base-Year Market Share, 2025
- 12.6.6 Segment CAGR and Growth Drivers
- 12.6.7 Subsegment Market Size and Forecast
- 12.6.7.1 Direct Enterprise Sales
- 12.6.7.2 Specialty Material Distributors
- 12.6.7.3 Tender and EPC Procurement
- 12.6.8 Subsegment Pricing and Adoption Trends
- 12.6.9 Leading Suppliers and Competition
- 12.6.10 Regional Demand and Opportunities
- 12.7 Segment Growth Comparison
- 12.8 Segment Attractiveness and Priority Matrix
Chapter 13 India Basalt Fiber End-Use and Application Market Outlook
- 13.1 End-Use Industry and Customer Demand Structure
- 13.2 Leading Applications and Customer Groups
- 13.3 End-Use Market Size, Share and Forecast
- 13.4 Major End-Use Industry Deep Dives
- 13.4.1 Customer Requirements and Use Cases
- 13.4.2 Demand and Replacement Cycles
- 13.4.3 Technical and Regulatory Considerations
- 13.4.4 Purchasing and Procurement Models
- 13.4.5 Leading Vendors and Distribution Channels
- 13.4.6 Forecast and Commercial Opportunities
- 13.5 Emerging Applications and Cross-Segment Demand
- 13.6 End-Use Industry Investment Priorities
Chapter 14 India Basalt Fiber Geographic Market Outlook, 2025-2035
- 14.1 Domestic Market Distribution and Demand Clusters
- 14.2 State- or Province-Wise Market Size and Forecast, 2025-2035
- 14.3 City and Metropolitan Market Outlook
- 14.4 Industrial, Manufacturing and Commercial Clusters
- 14.5 Geographic Concentration of Key End Users
- 14.6 Local Pricing and Purchasing Differences
- 14.7 Domestic Production Facilities and Capacity Map
- 14.8 Local Infrastructure and Project Pipeline
- 14.9 State-Level Policy and Incentive Differences
- 14.10 Subnational Investment Hotspots and Opportunities
- 14.11 Distribution and Logistics Networks
- 14.12 Domestic Competitive Footprint
Chapter 15 India Basalt Fiber Technology, Innovation and Sustainability Outlook
- 15.1 Technology Landscape and Maturity
- 15.2 Product, Process and Service Innovation
- 15.3 AI, Automation and Digital Tools in the Industry
- 15.4 Technology Adoption and Performance Benchmarking
- 15.5 Innovation Pipeline and R&D Investment
- 15.6 Patent and Intellectual Property Trends
- 15.7 Energy Efficiency and Resource Management
- 15.8 Sustainability, Recycling and Circularity
- 15.9 Technology Roadmap, 2025-2035
- 15.10 Risks of Obsolescence and Technology Substitution
Chapter 16 India Basalt Fiber Market Key Strategic Imperatives
- 16.1 Growth and Market Entry Priorities
- 16.2 High-Return Products and Segments
- 16.3 Pricing, Profitability and Cost Optimization
- 16.4 Technology Investment and Product Differentiation
- 16.5 Supply Chain Localization and Resilience
- 16.6 Distribution and Customer Acquisition
- 16.7 Partnership, Acquisition and Capacity Strategy
- 16.8 Regional Expansion Priorities
- 16.9 Short-, Medium- and Long-Term Actions
Chapter 17 Competition Outlook
- 17.1 Industry Competition Characteristics
- 17.2 Market Structure and Concentration
- 17.3 Market Share and Competitive Positioning, 2025
- 17.4 Company-Wise Revenue and Product Benchmarking
- 17.5 Production and Service Capacity Benchmarking
- 17.6 Technology, Pricing and Differentiation
- 17.7 Regional Footprint and Distribution Strength
- 17.8 Mergers, Acquisitions and Strategic Alliances
- 17.9 New Entrants and Competitive Threats
- 17.10 Porter's Five Forces and Industry Attractiveness
- 17.11 Competitive Outlook, 2025-2035
Chapter 18 Company Profiles
- 18.1 Company Coverage and Selection Criteria
- 18.2 Zhejiang GBF Basalt Fiber Co., Ltd.
- 18.2.1 Business Description
- 18.2.2 Company Ownership and Geographic Presence
- 18.2.3 Product and Service Portfolio
- 18.2.4 Manufacturing and Operating Footprint
- 18.2.5 Production Capacity and Expansion Plans
- 18.2.6 Financial Performance and Investment
- 18.2.7 Market Share and Competitive Position
- 18.2.8 Technology and Innovation Capabilities
- 18.2.9 Strategic Alliances or Partnerships
- 18.2.10 Recent Developments
- 18.2.11 Growth Strategy and Outlook
- 18.3 Kamenny Vek
- 18.4 Technobasalt-Invest LLC
- 18.5 Basaltex NV
- 18.6 Mafic USA LLC
- 18.7 Isomatex SA
- 18.8 Sudaglass Fiber Technology
- 18.9 Shanxi Basalt Fiber Technology Co., Ltd.
- 18.10 JOGANI Reinforcement
- 18.11 Funique Composites Pvt. Ltd.
- 18.12 Other Relevant Market Participants
Note: Every listed company is profiled on the structure shown under the first company. The company list is preliminary and may change based on research findings, market developments, data availability and client requirements.
Chapter 19 Disclaimer
- 19.1 Research and Forecast Disclaimer
- 19.2 Data Source and Estimation Limitations
Note: The depth of individual sections depends on data availability for this market. Volume, capacity, trade and other unit-based metrics are included where applicable.

