
Defense aircraft, frigates and safer facades lift core use
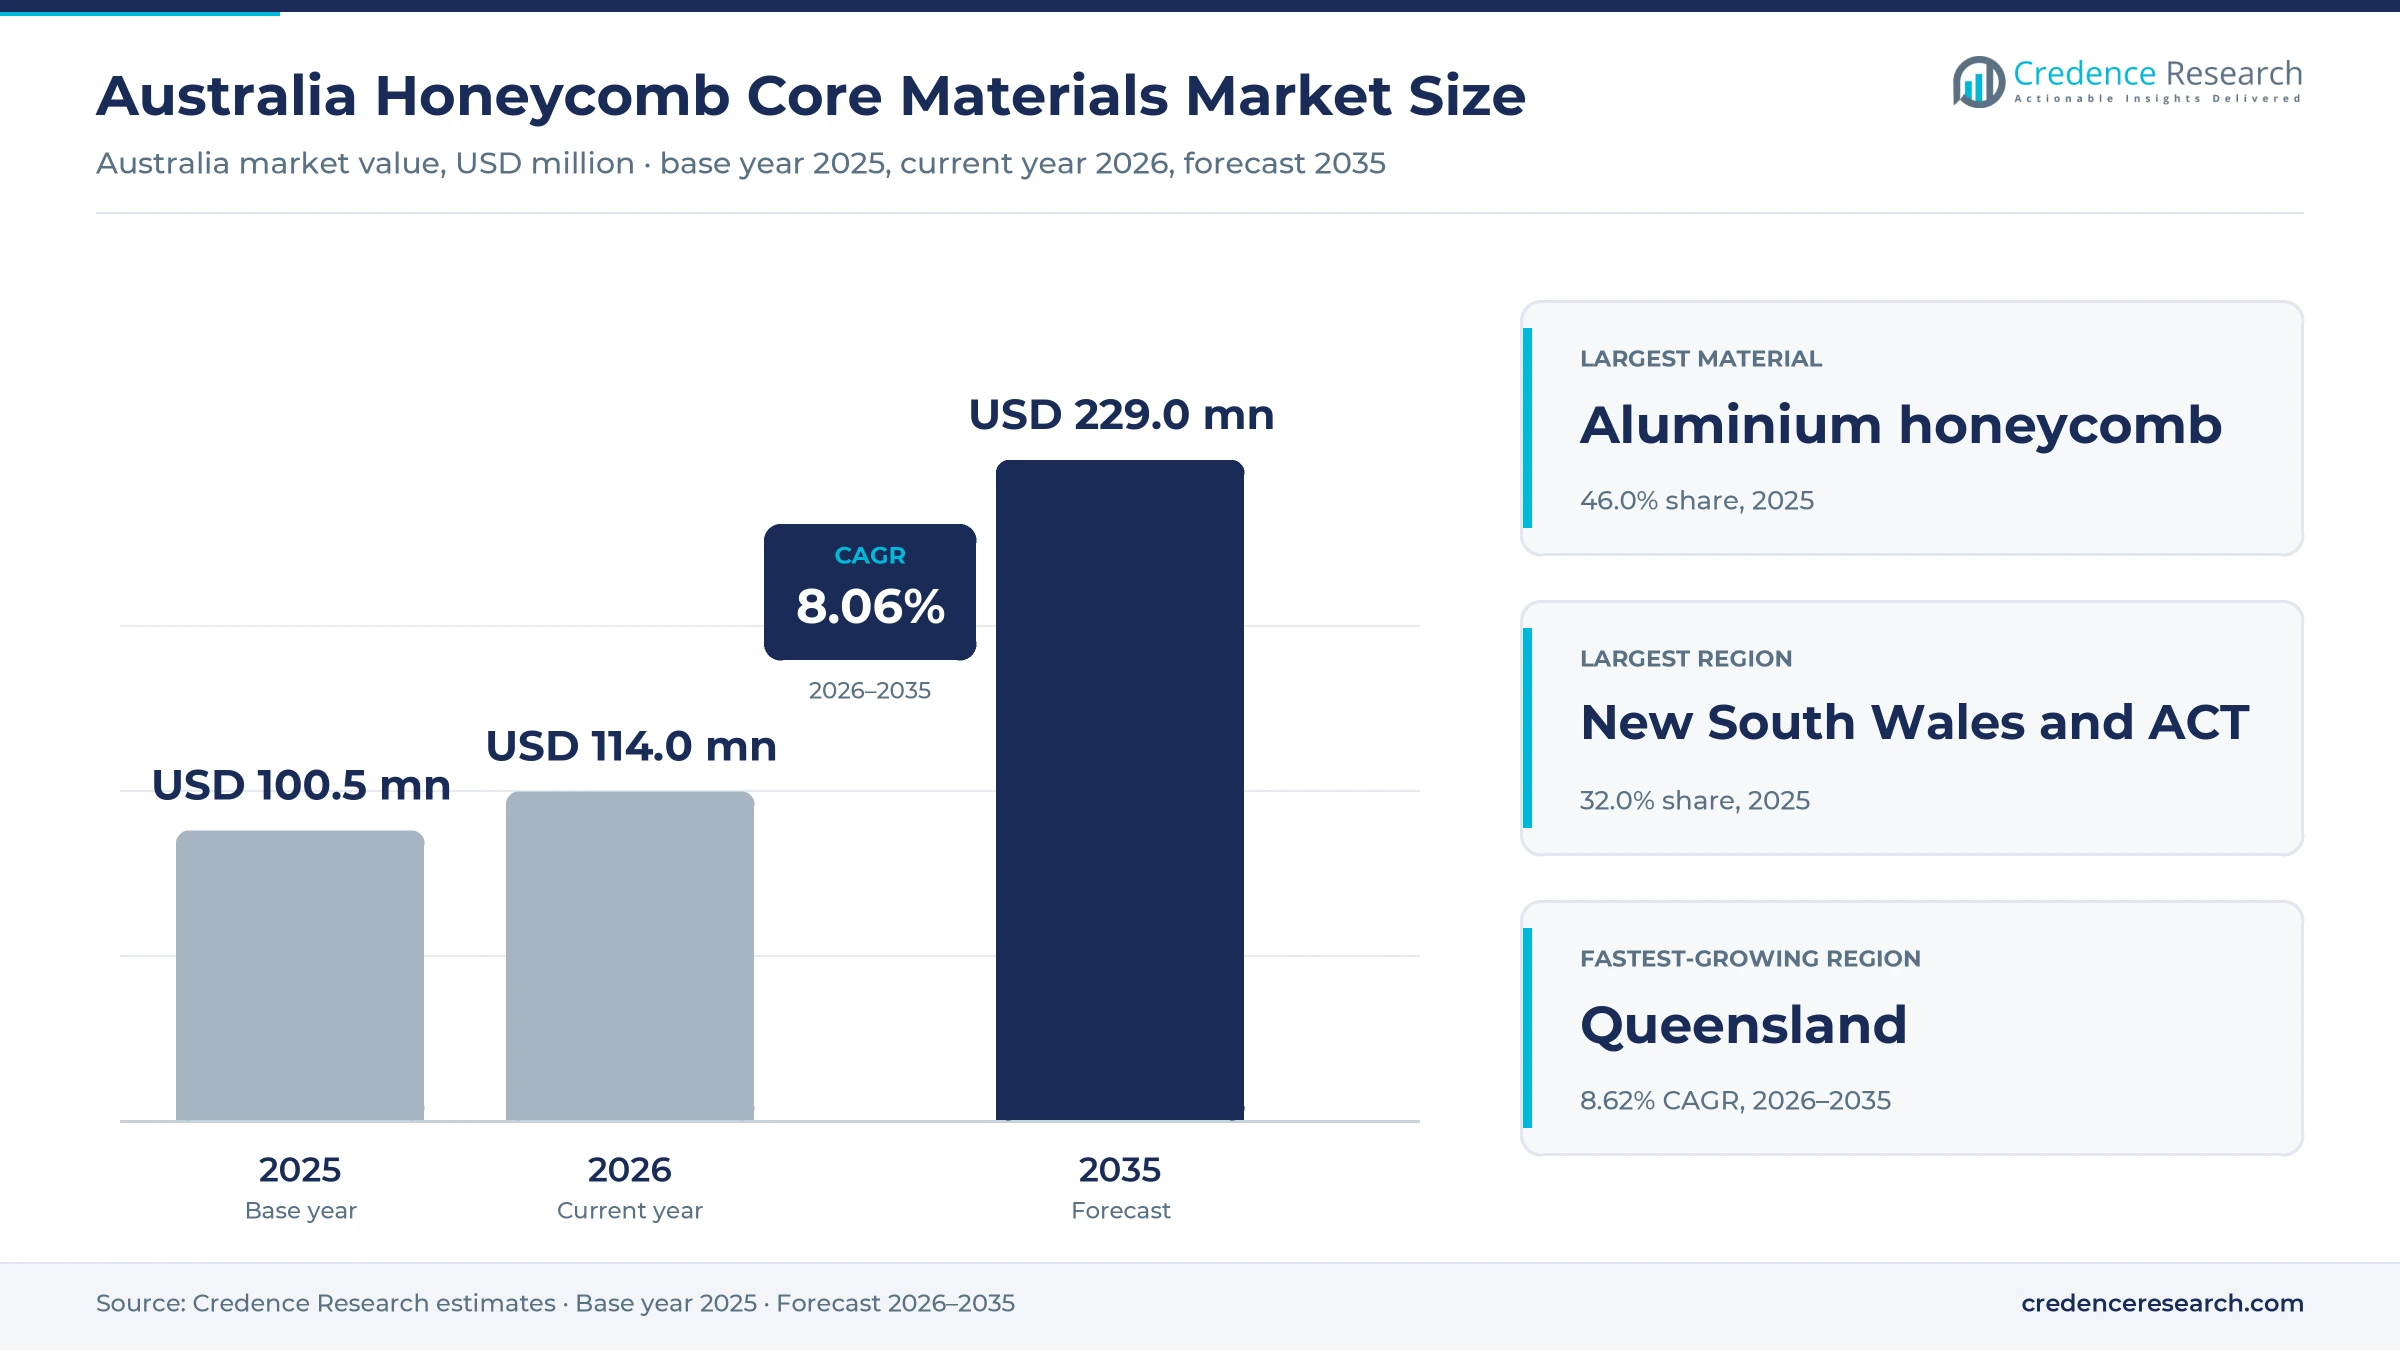
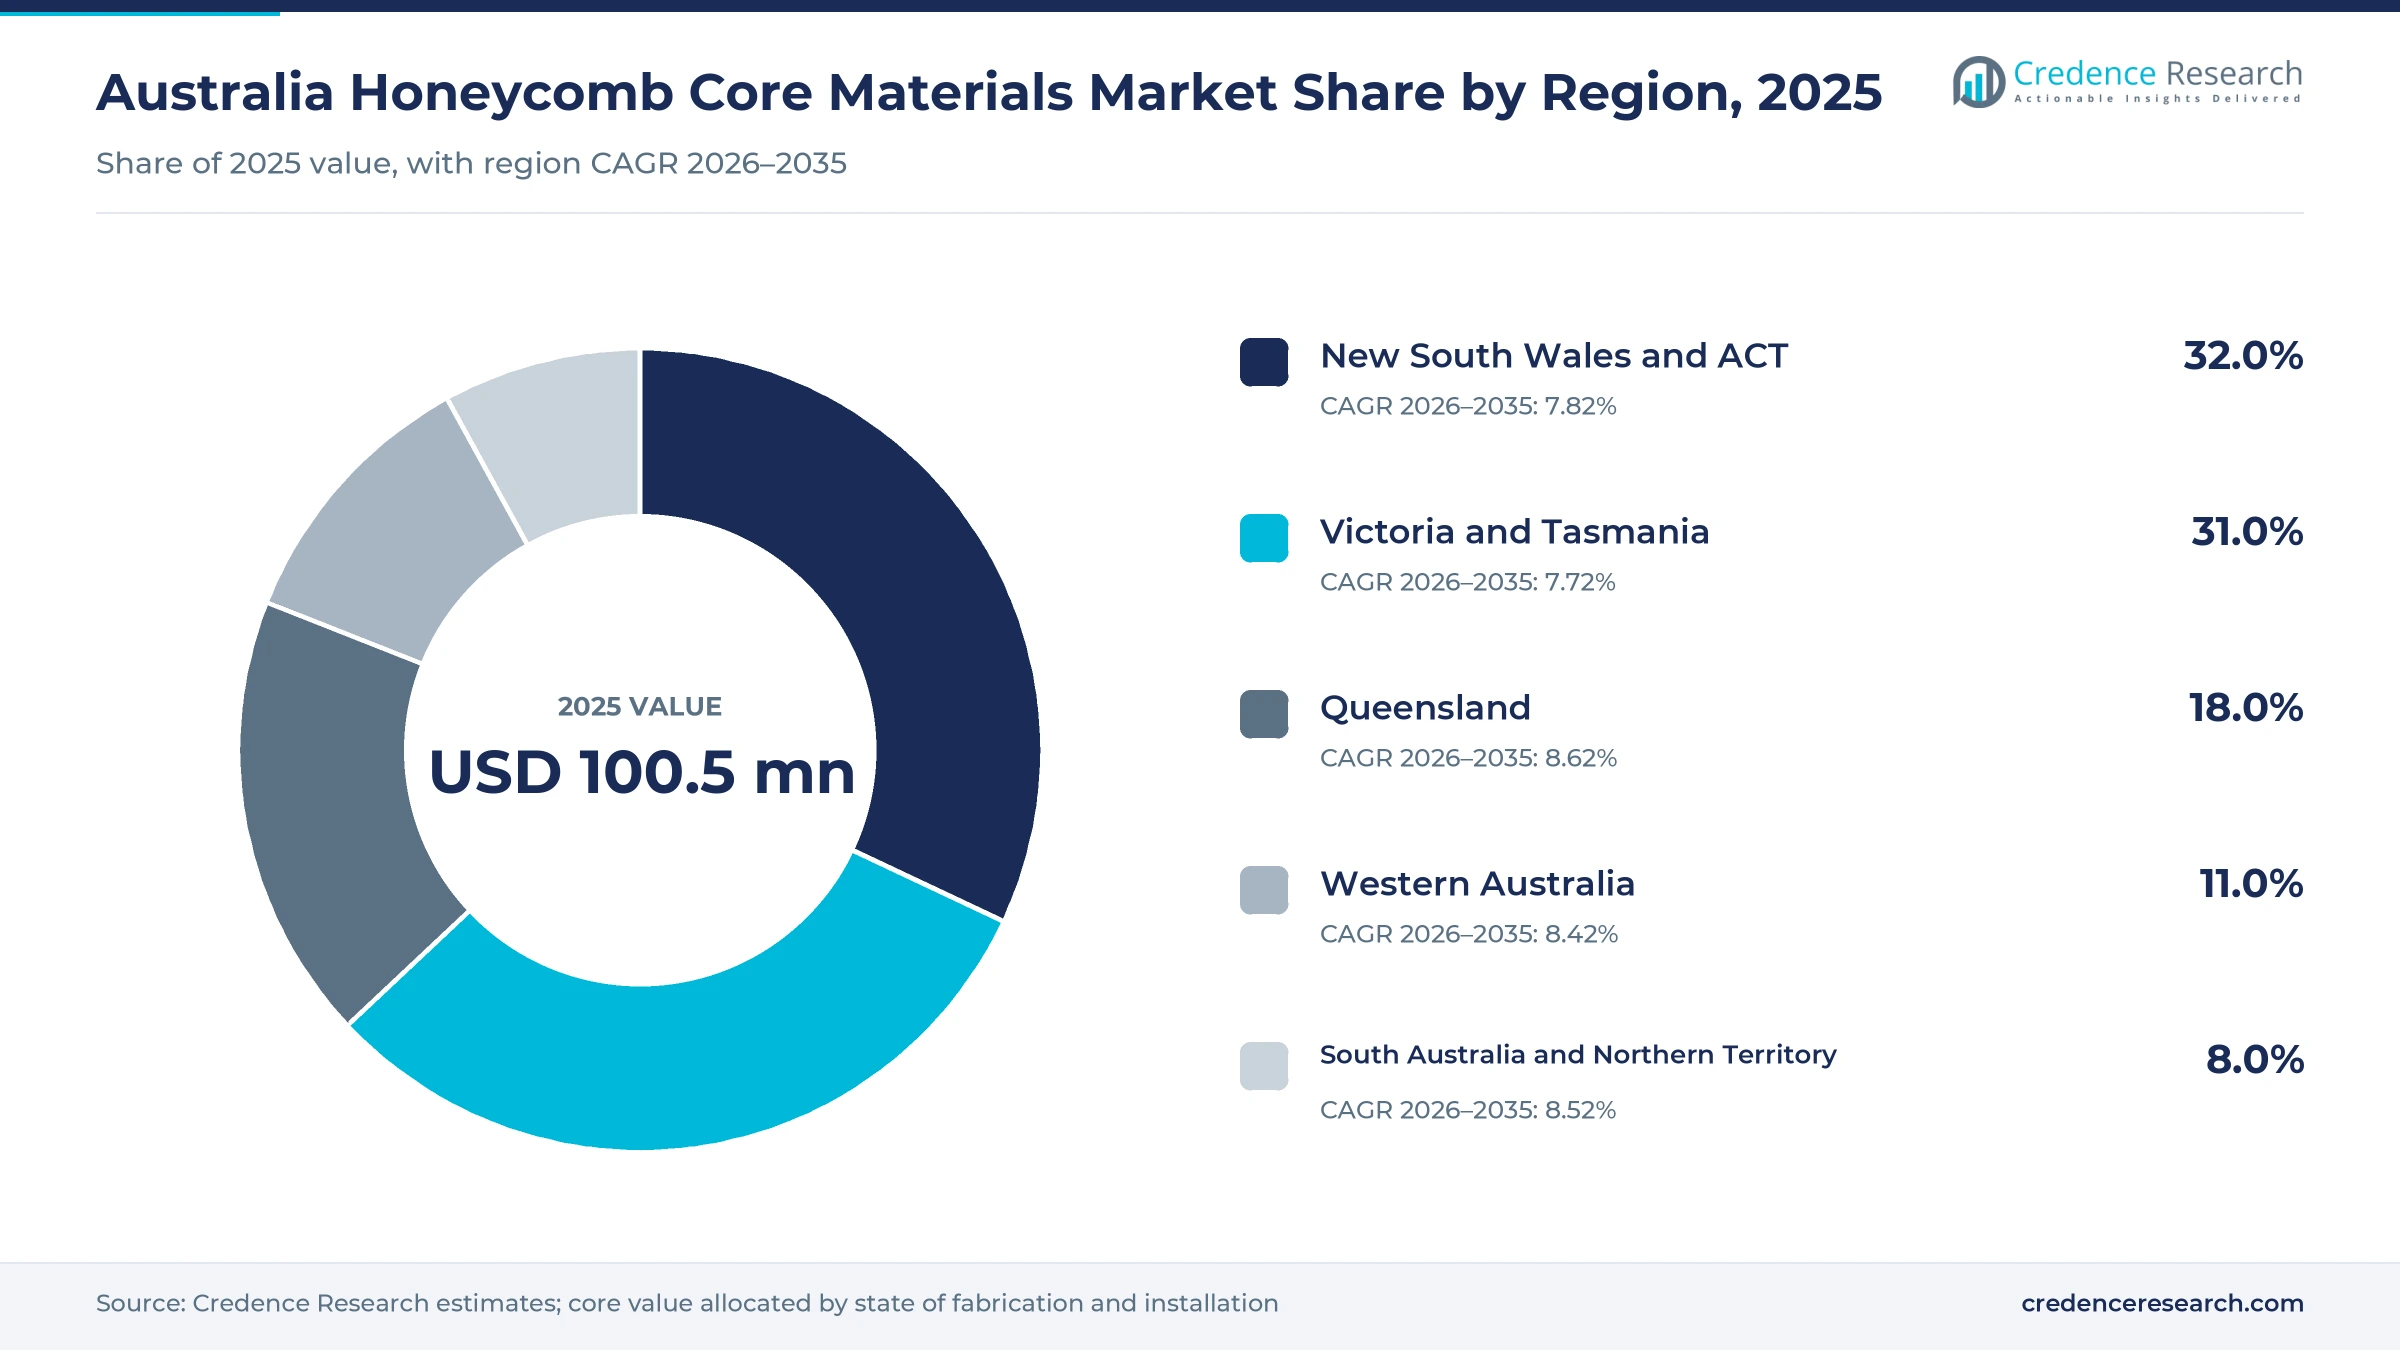
The Australia honeycomb core materials market was valued at USD 100.5 million in 2025 and is projected to increase from USD 114.0 million in 2026 to USD 228.9 million by 2035, registering a CAGR of 8.06% during 2026–2035. Demand comes from aerostructure makers, defense programs, facade fabricators, boat and ferry builders, and rail and industrial equipment makers that need stiff, light panels. New South Wales and ACT held the largest regional share, 32.0% in 2025, because Sydney hosts aerostructure plants, major building projects and most specialist distributors. Queensland is the fastest-growing region at 8.62% a year, as Ghost Bat production at Toowoomba and a new train factory at Torbanlea ramp up. Building rules are also shifting demand, because Victoria has banned aluminum composite panels with less than 93% inert mineral filler in their cores for external cladding on most multi-story buildings.
What counts as honeycomb core spending in Australia?
The estimate measures the value of aluminum, aramid, thermoplastic and specialty honeycomb sold in Australia as bare core, finished sandwich panels and engineered core kits. Values are stated at the prices that aerospace makers, defense suppliers, facade fabricators, boat builders and transport equipment makers pay for these products.
The estimate excludes foam and balsa cores, solid aluminum composite panels and the labor to install finished panels on site. The value chain runs from imported core producers through specialist distributors and panel laminators to aircraft, ship, train and building projects.
Australia Honeycomb Core Materials Market Insights
- The Australia honeycomb core materials market was valued at USD 100.5 million in 2025 and is projected to reach USD 228.9 million by 2035, registering a CAGR of 8.06% during 2026–2035.
- New South Wales and ACT held a 32.0% share of 2025 value, because Sydney hosts aerostructure plants, distributors and large building projects.
- Aluminium honeycomb led with a 46.0% share of 2025 value, because facade, marine and rail panels mostly use aluminum cells.
- The Department of Defence committed about $1.4 billion in December 2025 to bring six Block 2 Ghost Bat aircraft into service, with 70% of spending in Australia.
- More than 1,600 Victorian buildings, about 83,000 homes, have undergone cladding rectification, which keeps demand for non-combustible facade panels steady.
Aluminum core leads as engineered kits grow fastest
Why does aluminium honeycomb lead material value?
Based on material type, the market is categorized into aluminium honeycomb, aramid honeycomb, thermoplastic honeycomb and specialty honeycomb. Aluminium Honeycomb led with a 46.0% share of 2025 value, because facade panels, ferry fit-outs and rail floors rely on aluminum cells. Thermoplastic Honeycomb grows fastest at 8.79% a year, as transport and industrial users seek low-cost, moisture-resistant cores.
How does aerospace and defence dominate end use?
Based on end-use industry, the market is categorized into aerospace and defence, construction and architecture, marine and ground transportation and industrial equipment. Aerospace and Defence led with 40.0% of 2025 value, because flight-qualified panels for airliners, fighters and uncrewed aircraft carry high prices. Aerospace and Defence also grows fastest at 8.44% a year, as uncrewed aircraft and naval programs expand across Queensland, Western Australia and South Australia.
Why does structural load management hold most of the value?
Based on application, the market is categorized into structural load management, interior and acoustic systems, and envelope and protective systems. Structural Load Management led with 50.0% of 2025 value, because flaps, decks and floors carry bending loads at low weight. Interior and Acoustic Systems grow fastest at 8.46% a year, as new trains and ships need light wall, ceiling and floor panels.
How do sandwich panels and core kits split product value?
Based on product form, the market is categorized into bare core, sandwich panels and engineered core kits. Sandwich Panels led with 47.0% of 2025 value, because most facade and transport buyers want finished panels ready to fix. Engineered Core Kits grow fastest at 9.05% a year, as builders order cut, shaped and numbered cores that cut waste and labor.
| Segment Group | Leading Sub-segment | Share, 2025 | Fastest-growing Sub-segment | CAGR, 2026–2035 |
|---|---|---|---|---|
| By Material Type | Aluminium Honeycomb | 46.0% | Thermoplastic Honeycomb | 8.79% |
| By End-Use Industry | Aerospace and Defence | 40.0% | Aerospace and Defence | 8.44% |
| By Application | Structural Load Management | 50.0% | Interior and Acoustic Systems | 8.46% |
| By Product Form | Sandwich Panels | 47.0% | Engineered Core Kits | 9.05% |
Request a Free Sample
Fill in your details and we'll send you a free sample report.
- Sample data tables & charts
- Research methodology
Qualified defense work and facade rules widen core demand
How do qualified aerospace and defence programs lift demand?
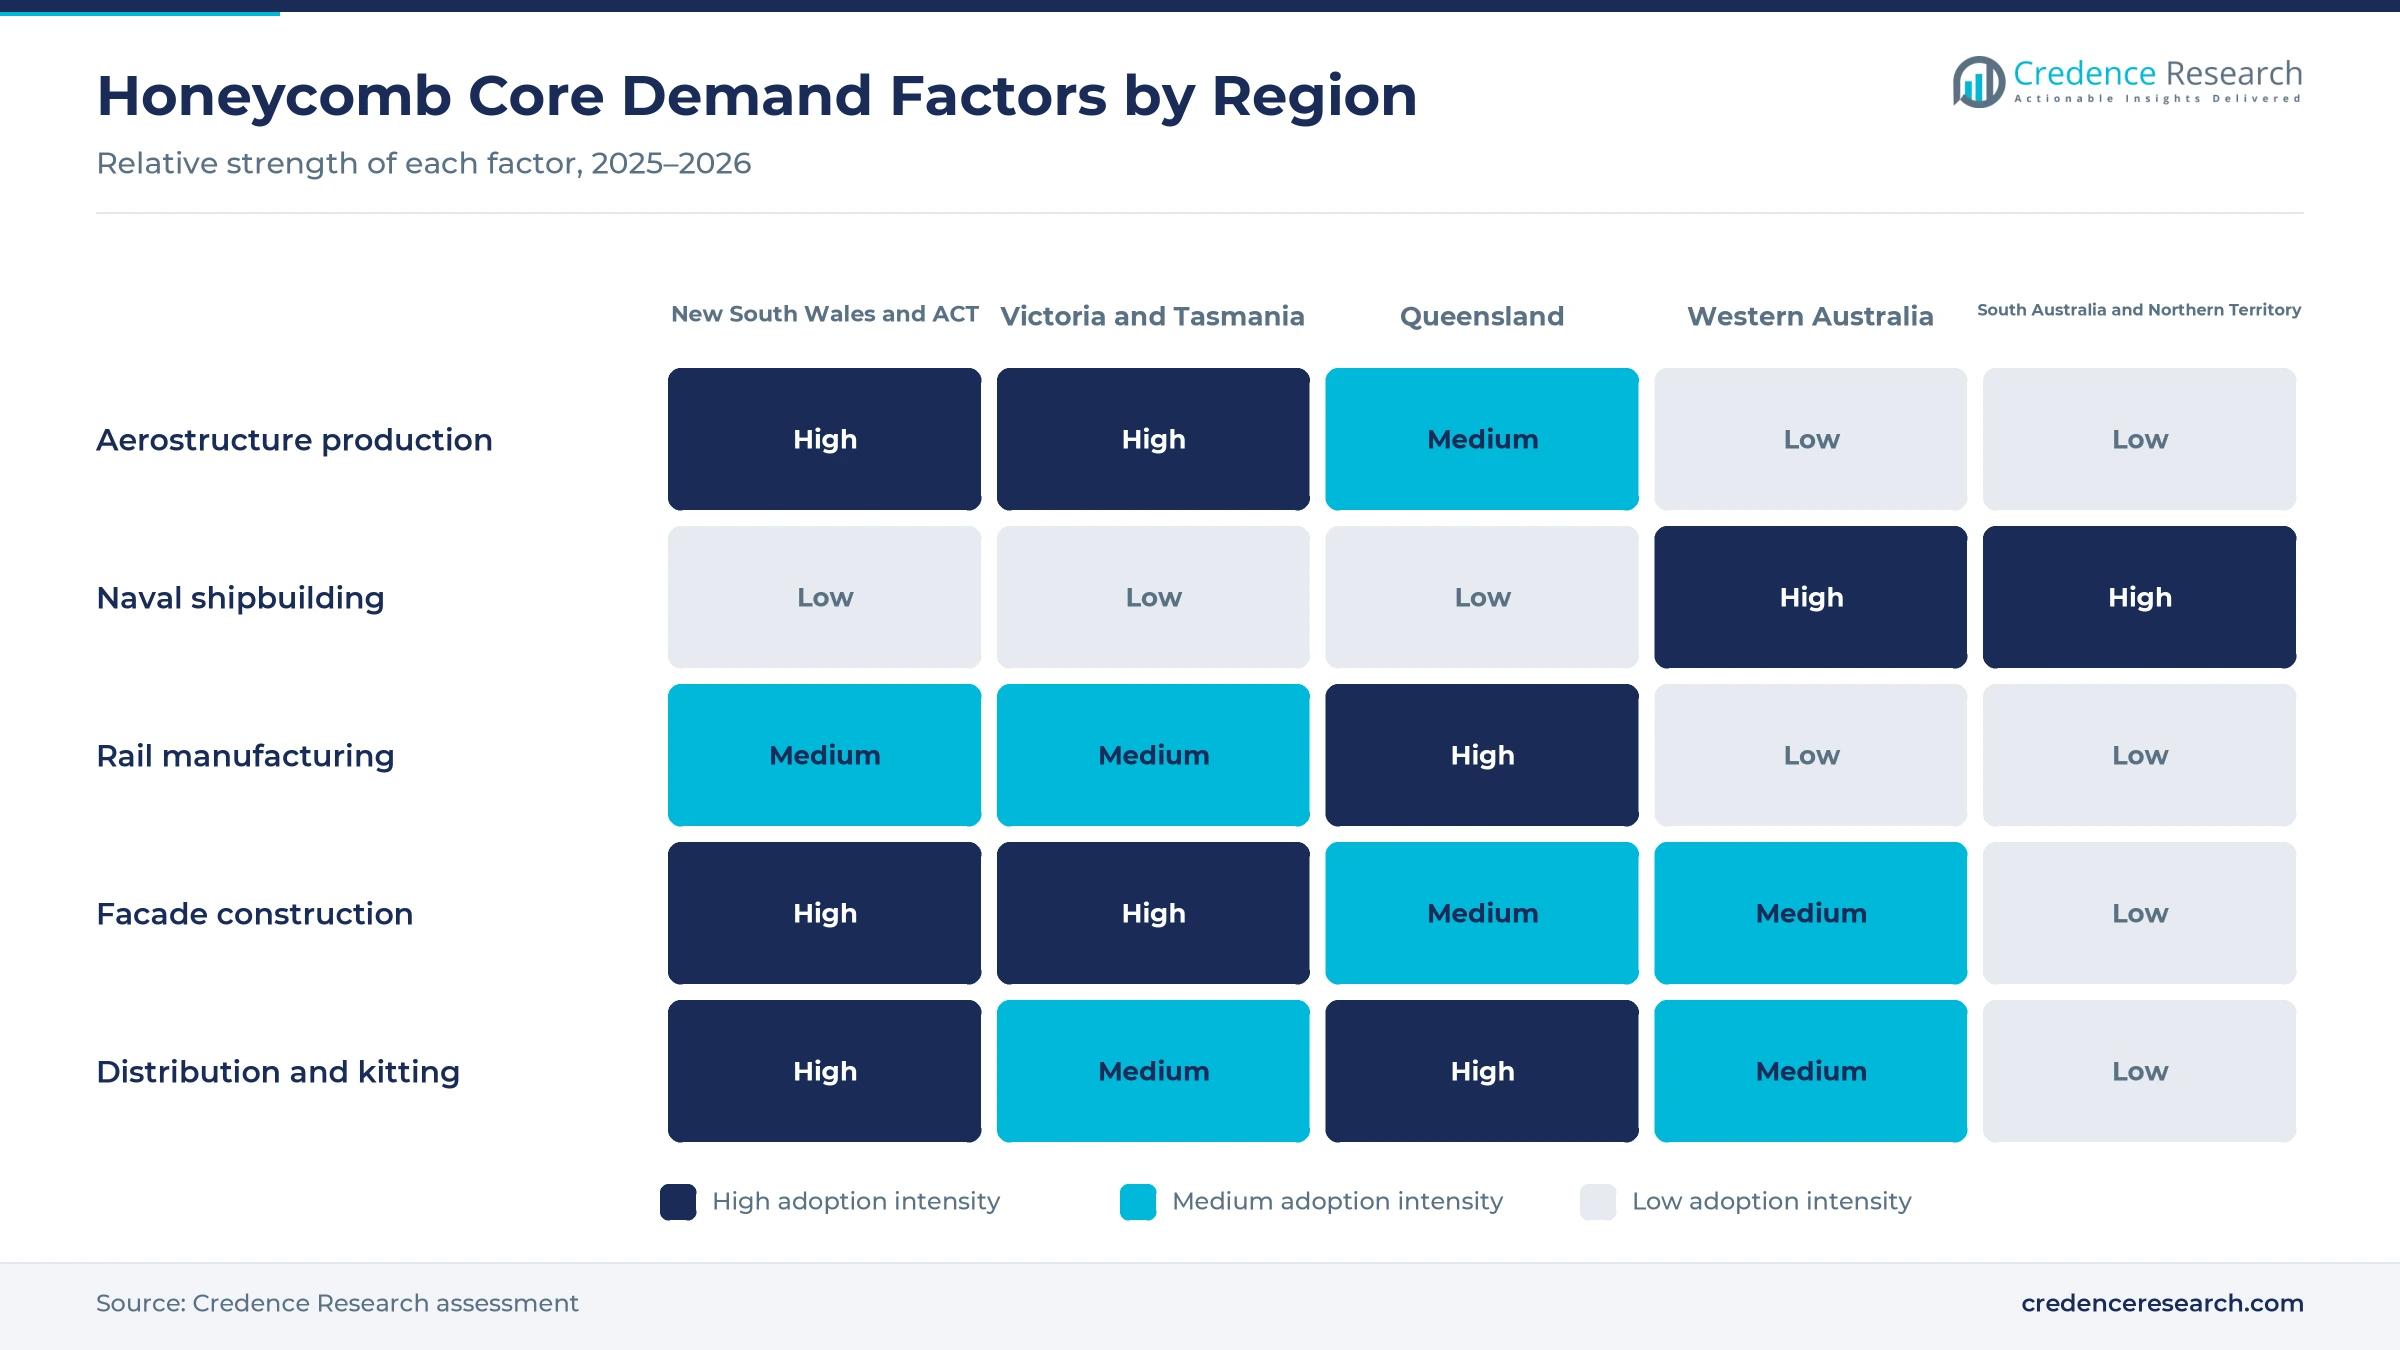
Qualified aerospace and defence programs lift demand, because flight and naval parts must use approved core grades and steady suppliers. The Department of Defence announced about $1.4 billion in December 2025 to move the Ghost Bat into service, with six Block 2 aircraft and 70% of spending going to Australian industry, according to the Defence Minister. More than 200 Australian suppliers and over 440 skilled jobs support the program. The 2024 Integrated Investment Program also set $330 billion for defense capability over the decade to 2033-34, as announced on April 17, 2024. As a result, aerospace and defence held 40.0% of 2025 value and grows fastest among end uses at 8.44% a year, alongside demand for aerospace composites.
Why does specification-led architectural adoption matter?
Specification-led architectural adoption matters, because fire rules now steer facade designers toward non-combustible light panels. Victoria has prohibited aluminum composite panels with cores of less than 93% inert mineral filler on Type A and Type B buildings since Feb. 1, 2021, according to the Building and Plumbing Commission. New South Wales has banned panels with more than 30% polyethylene cores on many multi-story buildings since Aug. 15, 2018. Alucobond Architectural also offers ALUCORE, an aluminum honeycomb core panel for high wind loads. In turn, construction and architecture held a large share of value, as specifiers replace aluminum composite panels with safer designs.
How does marine and transport lightweighting widen demand?
Marine and transport lightweighting widens demand, because lighter decks, floors and walls cut fuel use and raise payload. Australia selected Mitsubishi Heavy Industries in August 2025 to supply 11 general purpose frigates, with eight to be built in Western Australia and first deliveries due in 2029. Downer began manufacturing 65 six-car trains at Torbanlea in July 2026 in a building of over 22,000 square meters, according to Downer. BAE Systems Maritime Australia also laid the keel of the first of six Hunter class frigates at Osborne in August 2026. As a result, interior and acoustic systems grow fastest among applications at 8.46% a year, as builders fit light panels.
Why does local aerostructure production keep core orders steady?
Local aerostructure production keeps core orders steady, because long-running airliner programs need the same parts each month. Boeing Aerostructures Australia employs about 1,100 people at Fishermans Bend and makes 787 flaps, ailerons and flaperons, plus 737 rudders and winglets, according to Boeing Australia. The site has invested $70 million in upgrades to support higher 787 production over the next decade, and it cures parts in ovens rather than autoclaves. Quickstep also signed a six-year agreement with Northrop Grumman in 2022 for F-35 center fuselage parts made at Bankstown. In turn, structural load management held 50.0% of 2025 value, as flight parts carry bending loads at low weight.
Uncrewed aircraft and local rail builds reshape demand
How is the rise of uncrewed aircraft changing core demand?
The rise of uncrewed aircraft is changing core demand, because these airframes use composite skins and light cores built in large batches. Boeing and Wagner Corporation broke ground on a 9,000 square meter Ghost Bat factory at Wellcamp, Toowoomba, on March 26, 2024. The site will include carbon fiber composite manufacturing and become Boeing's first final assembly plant outside North America. The plant should employ about 100 people once complete, and six Block 2 aircraft are now funded. As a result, aerospace and defence remains the leading end use, while demand for military drones adds new core buyers in Queensland and other states with defense suppliers.
Why is the shift toward engineered core kits notable?
The shift toward engineered core kits is notable, because builders want cores cut, shaped and numbered before they reach the mold. ATL Composites has supplied advanced composite materials in Australia for more than four decades, including lightweight cores for marine, transport and industrial users. DIAB Australia, based in Sydney since 1984, partnered with ATL to offer core kitting, engineering and five-axis machining for infusion and prepreg work. Victoria has also required mineral-filled facade cores since Feb. 1, 2021, which pushes fabricators toward pre-cut, tested panel kits. Boat builders that use marine composites want ready kits that cut waste. As a result, engineered core kits grow fastest among product forms at 9.05% a year.
Can local train and ferry builds open larger panel orders?
Local train and ferry builds can open larger panel orders, because each carriage and vessel needs many floor, wall and ceiling panels. Downer started production in July 2026 at Torbanlea, where carriages move across eight dedicated manufacturing stations for the 65 new trains. The Mogami program, announced in August 2025, will build eight frigates in Western Australia after the first three hulls are built in Japan. The Hunter class program adds six frigates at Osborne, with construction from June 2024 and commissioning planned for the early 2030s. As a result, ground transportation and industrial equipment buyers gain importance, while demand for sandwich panels broadens beyond buildings.
Is there room to grow through domestic manufacturing policy?
Domestic manufacturing policy leaves room to grow, because local content rules push more panel work onshore. Manufacturing made up about 5.3% of Australian GDP in 2025, down from 5.4% in 2024, according to World Bank data, which shows how small the base remains. The Ghost Bat program directs 70% of spending to Australian industry, and the Hunter frigates use Australian-made steel. Victoria has also rectified more than 1,600 buildings, about 83,000 homes, under its cladding program. In turn, local laminators that can meet defense and fire standards can win work that once went offshore, especially in facade and naval interior packages.
Import reliance, qualification and fire rules slow uptake
How does import reliance raise costs and lead times?
Import reliance raises costs and lead times, because most aluminum and aramid honeycomb used in Australia is made overseas and shipped long distances. Panel makers must hold extra stock to cover shipping delays and currency swings. As a result, small fabricators face higher working capital needs than overseas rivals with nearby core plants. Distributors respond with local stock, cutting services and longer supply agreements with core producers in Europe, North America and Asia.
Why do qualification rules slow new suppliers?
Qualification rules slow new suppliers, because aerospace and naval parts need approved materials, tested processes and traceable records for every batch. A new core grade can take years to qualify on an aircraft or ship program. In turn, local firms find it hard to enter programs that are already in production with set supply chains. Suppliers respond by joining prime contractor programs early and by sharing test data with customers.
How do fire rules limit some core choices?
Fire rules limit some core choices, because combustible cores and adhesives can fail facade tests on taller buildings. Victoria and New South Wales restrict high-risk panels on many multi-story buildings, and existing buildings have faced costly rectification. As a result, some polymer cores lose access to large facade projects across the eastern states. Makers respond with aluminum cores, mineral-filled skins and tested systems that meet national standards.
Why does a small local fabrication base cap growth?
A small local fabrication base caps growth, because few Australian firms laminate large honeycomb panels at scale or hold aerospace approvals. Projects that need many panels quickly may import finished assemblies instead of local cores. In turn, local core demand can lag the growth of the projects themselves. Fabricators respond by adding presses, automation and partnerships with defense and rail primes that offer long contracts.
New South Wales leads while Queensland grows fastest
| Region | Value, 2025 (USD million) | Share, 2025 | CAGR, 2026–2035 |
|---|---|---|---|
| New South Wales and ACT | 32.2 | 32.0% | 7.82% |
| Victoria and Tasmania | 31.2 | 31.0% | 7.72% |
| Queensland | 18.1 | 18.0% | 8.62% |
| Western Australia | 11.1 | 11.0% | 8.42% |
| South Australia and Northern Territory | 8.0 | 8.0% | 8.52% |
Why do New South Wales and the ACT hold the largest share?
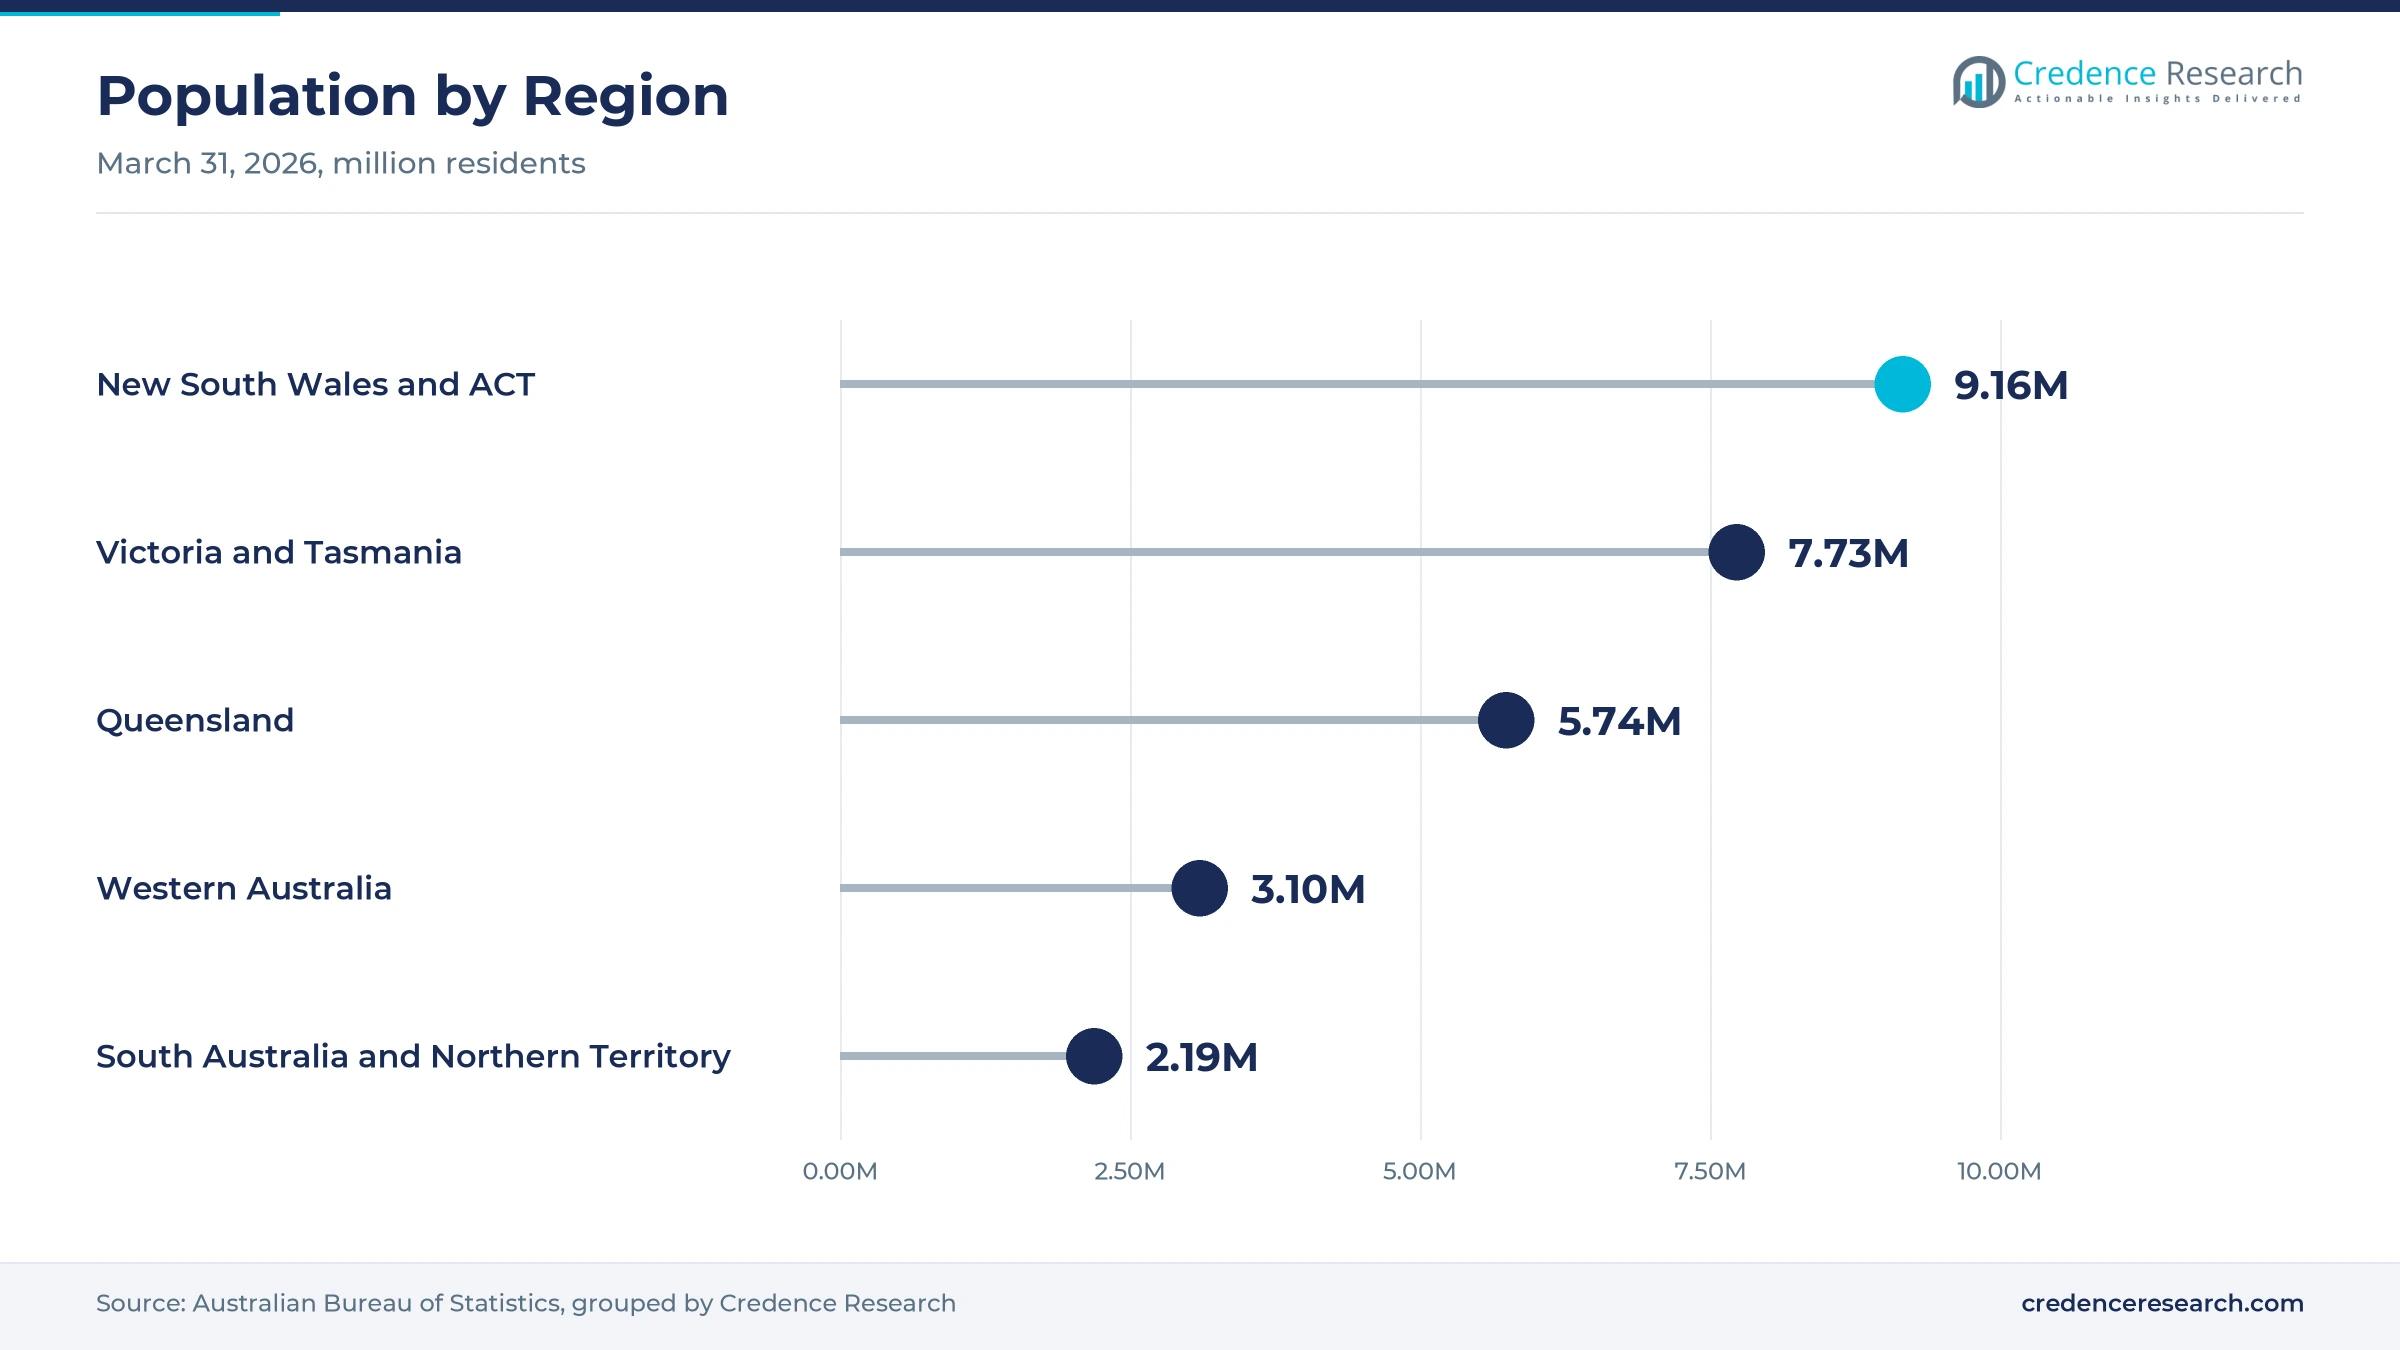
New South Wales and ACT held 32.0% of 2025 value and grow at 7.82% a year, because Sydney hosts Quickstep's Bankstown aerostructure plant, DIAB Australia and many large building projects. The state had about 8.67 million residents at March 31, 2026, while the ACT added about 490,000 more. New South Wales has also banned panels with more than 30% polyethylene cores on many taller buildings since Aug. 15, 2018. As a result, aerospace, facade and distribution spending all have a base in the zone.
How does Victoria and Tasmania build on Fishermans Bend?
Victoria and Tasmania held 31.0% of 2025 value and grow at 7.72% a year, because Boeing Aerostructures Australia makes 787, 737 and 777 flight controls at Fishermans Bend with about 1,100 staff. Victoria also requires mineral-filled cores in external cladding on most taller buildings. The state had about 7.15 million residents at March 31, 2026, and Alucobond Architectural runs its head office at Derrimut. In turn, aerospace and facade demand both support the zone, while cladding rectification is now mostly complete.
How do Toowoomba and Torbanlea lift Queensland?
Queensland held 18.0% of 2025 value and grows fastest at 8.62% a year, because the Ghost Bat factory at Toowoomba and the train factory at Torbanlea both add new composite and panel work. The state had about 5.74 million residents at March 31, 2026, with growth of 1.6% over the year. The Torbanlea building covers more than 22,000 square meters, and the Ghost Bat site covers 9,000 square meters. As a result, defense and rail buyers lift demand from a smaller base.
How does Western Australia gain from naval shipbuilding?
Western Australia held 11.0% of 2025 value and grows at 8.42% a year, because eight Mogami-based frigates are to be built in the state. The state also grew its population by 2.1% in the year to March 2026, the fastest rate in the country. In turn, marine interiors and decks add demand for light cores.
Why does South Australia and the Northern Territory track the Hunter program?
South Australia and Northern Territory held 8.0% of 2025 value and grow at 8.52% a year, because six Hunter class frigates are being built at Osborne. Construction began in June 2024, and the keel of the lead ship was laid in August 2026. As a result, naval interior and equipment panels support steady demand.
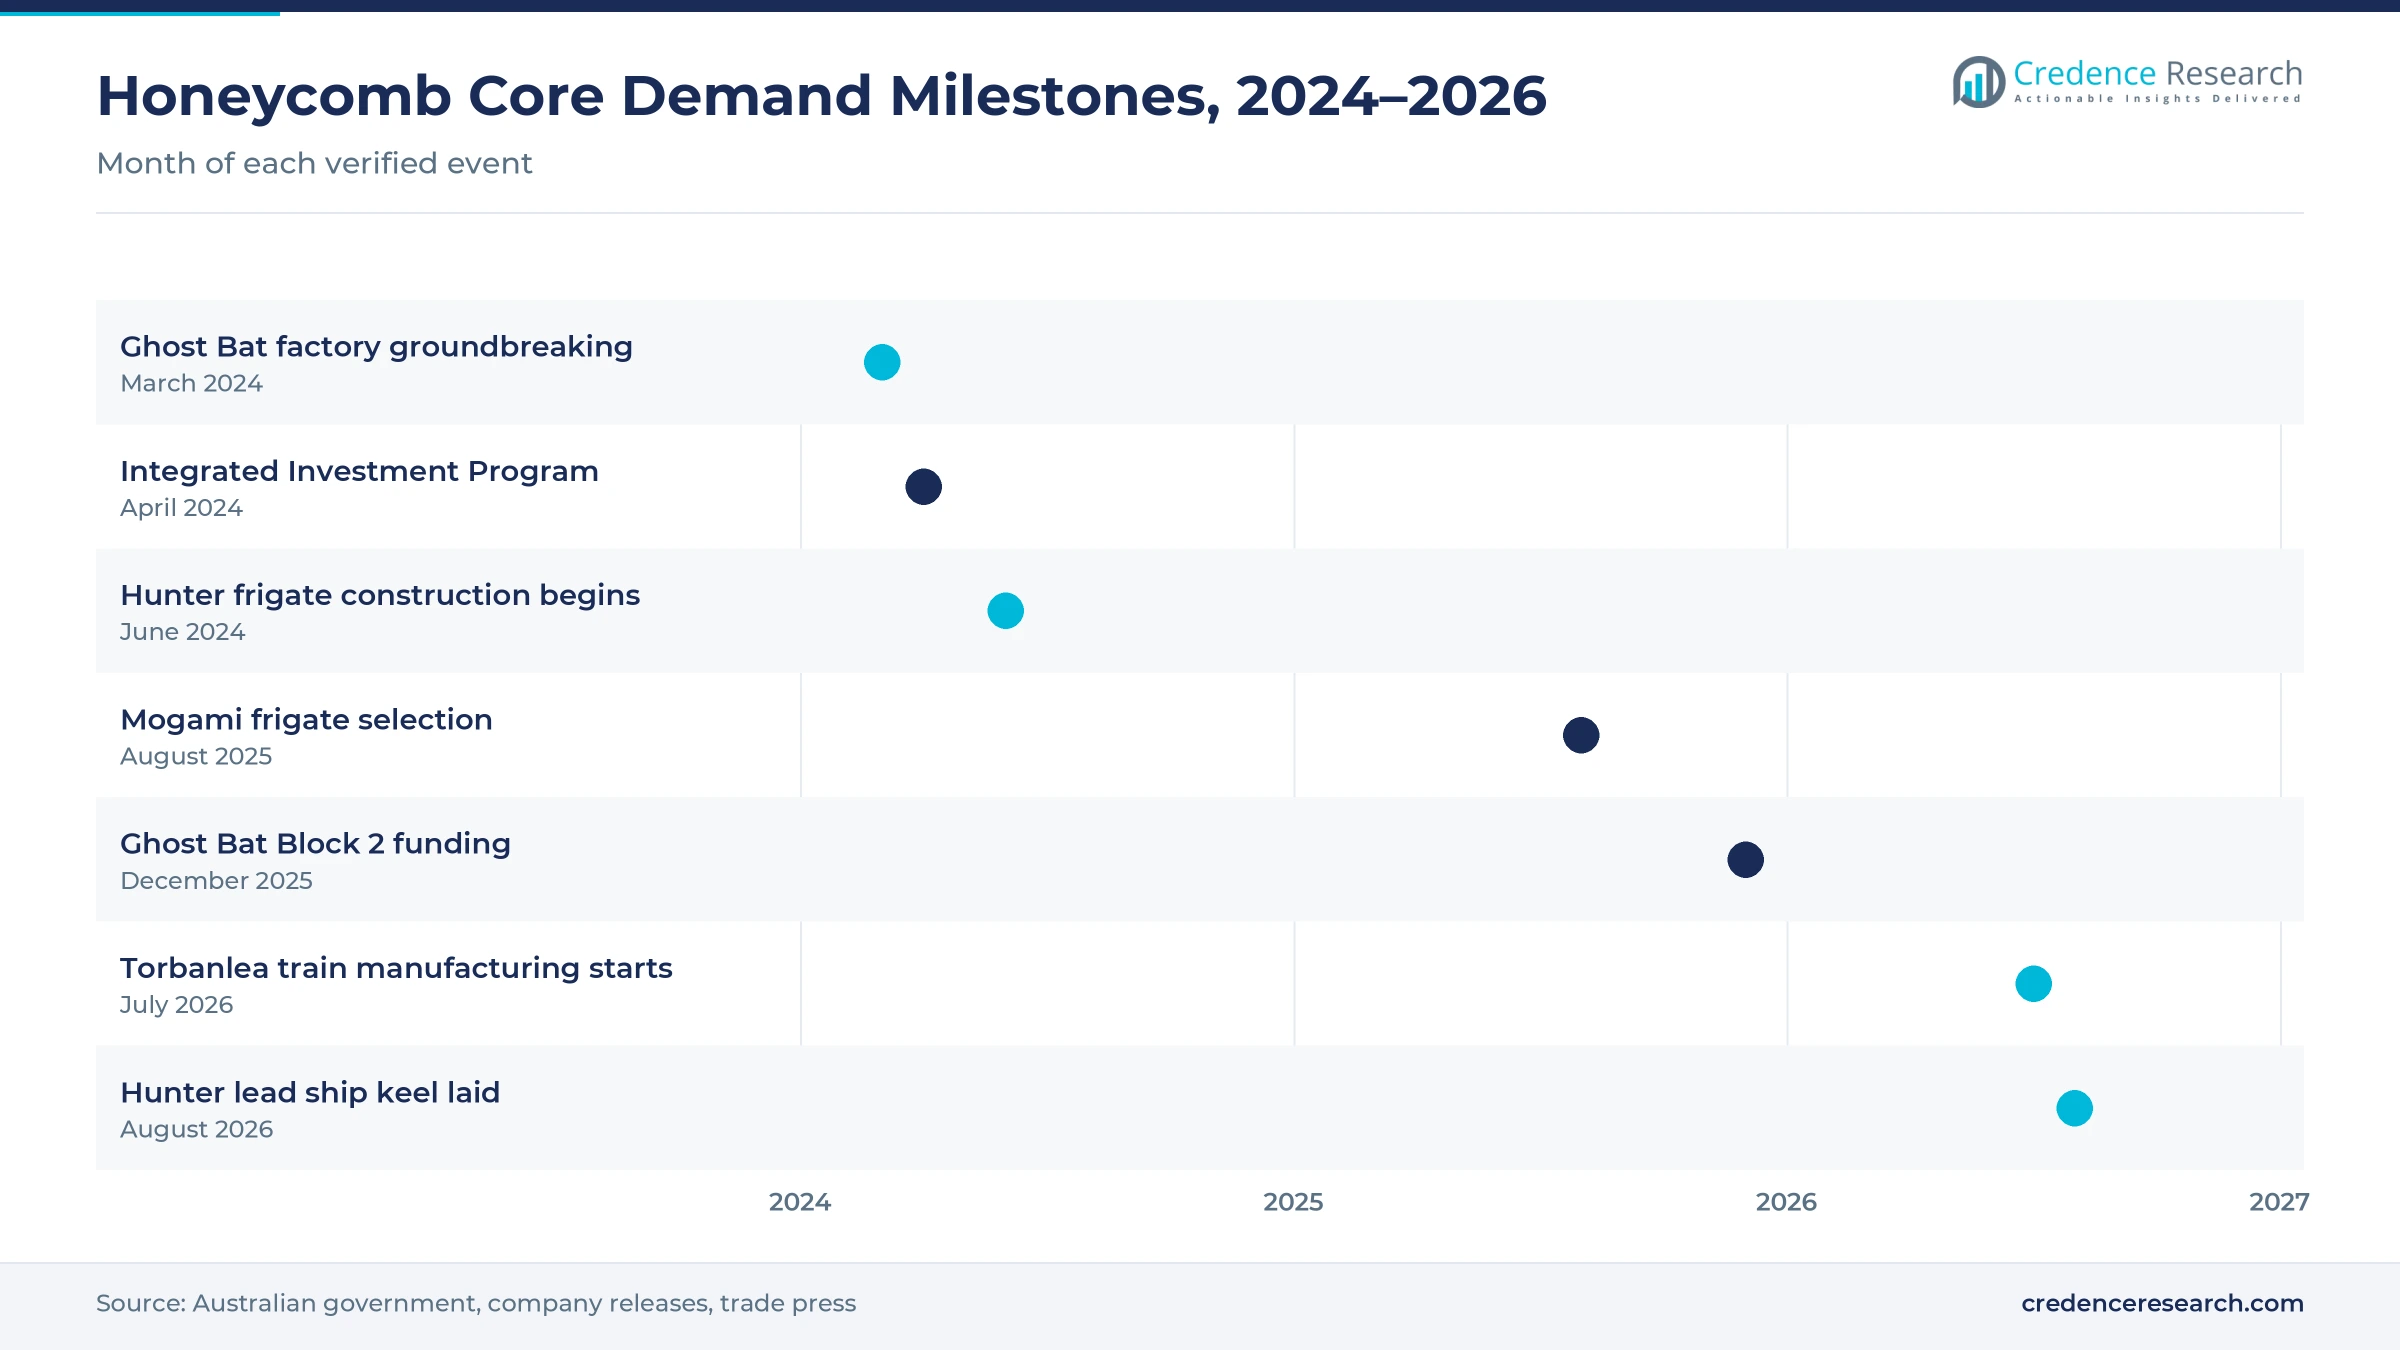
Ghost Bat, Mogami and train builds marked 2024 to 2026
| Development | Status and market relevance |
|---|---|
| In March 2024, Boeing and Wagner Corporation broke ground on a 9,000 square meter Ghost Bat factory at Toowoomba. | Adds carbon fiber composite and final assembly work in Queensland |
| In August 2025, Australia selected Mitsubishi Heavy Industries to supply 11 general purpose frigates. | Eight hulls are planned for construction in Western Australia |
| In December 2025, the Department of Defence committed about $1.4 billion for six Block 2 Ghost Bat aircraft. | Directs 70% of program spending to Australian industry |
| In July 2026, Downer began manufacturing 65 six-car trains at its Torbanlea facility. | Opens a large local market for floor, wall and ceiling panels |
| In August 2026, BAE Systems Maritime Australia laid the keel of the first Hunter class frigate at Osborne. | Moves the six-ship program into major assembly |
Aluminum, aramid and thermoplastic cells set the mix
- Aluminum honeycomb gives high stiffness and fire resistance at low weight, which suits facades, ferry decks and rail floors.
- Aramid honeycomb resists fatigue and corrosion with low density, which suits flight controls, fairings and aircraft interiors.
- Thermoplastic honeycomb offers low cost and moisture resistance, which suits truck bodies, boats and industrial panels.
- Out-of-autoclave bonding cures composite skins in an oven rather than an autoclave, which lowers energy and equipment needs.
Need a Custom Version of This Report?
Tailor the scope, geography, or segments to your exact requirements.
- Custom geography or segment scope
- Direct access to our analyst team
Panel makers and composite distributors shape supply
Competition centers on qualified materials, local stock, kitting services and fire-tested panel systems. Corex Honeycomb, a U.K.-based maker of aluminum honeycomb for rail, marine and architectural uses, is among the named core suppliers, although its Australian sales channels were not confirmed for this report. Alucobond Architectural sells the ALUCORE aluminum honeycomb panel for high wind loads from offices in several states. ATL Composites and DIAB Australia supply cores, kitting and engineering to boat builders and other fabricators. Boeing Aerostructures Australia and Quickstep Holdings buy composite materials for flight parts, while Boeing Defence Australia leads the Ghost Bat program. Because aluminium honeycomb holds the largest share of 2025 value, suppliers with local stock, cutting services and fire-tested systems hold the strongest position. Defense and rail programs also reward suppliers that can document every batch.
Companies profiled and their roles in this market
| Company | Type | Role in the market |
|---|---|---|
| Alucobond Architectural | Panel supplier | Sells the ALUCORE aluminum honeycomb core panel in Australia |
| ATL Composites | Specialist distributor | Supplies lightweight cores and resins to marine and transport users |
| DIAB Australia | Core supplier | Offers core kitting and engineering with ATL Composites |
| Boeing Aerostructures Australia | Aerostructure maker | Makes 787, 737 and 777 flight controls at Fishermans Bend |
| Quickstep Holdings | Aerostructure maker | Makes F-35 center fuselage parts at Bankstown |
| Boeing Defence Australia | Defense prime | Builds the Ghost Bat with over 200 Australian suppliers |
Defense programs anchor core demand through 2035
Credence Research's view is that Australian honeycomb core spending will grow steadily because defense aircraft, frigates and trains all need stiff, light panels. Aluminium honeycomb keeps the largest share, while thermoplastic cores and engineered kits grow faster from small bases. Queensland should grow fastest among regions through 2035 as Ghost Bat and train factories ramp up. However, import reliance and long qualification will slow new local suppliers. Distributors and laminators with defense approvals should gain the most share.
Defense, regulator and company data anchor the model
The report uses 2025 as the base year on a calendar basis, and market values come from the Credence Research model. That model combines defense program funding, aerostructure and shipbuilding site data, rail factory data, building regulations, population data and World Bank manufacturing data. Segment splits, regional shares and regional growth rates are Credence Research estimates, because the client row named only Eastern Australia. Sources used are government and regulator releases, company releases, trade press and international agency data, and no interviews or surveys were used.
Uncrewed aircraft and naval builds carry growth to 2035
Spending on honeycomb cores and panels is expected to reach USD 228.9 million by 2035, an 8.06% CAGR during 2026–2035, as defense and transport programs move into full production. Growth should build through 2029 as Ghost Bat output rises and the first Mogami frigates arrive. After that, Hunter frigates and new trains should keep panel demand firm. Stronger local content rules would shift value toward domestic laminators, while weaker programs would keep more value in imported finished panels.
Frequently Asked Questions
How big is the Australia honeycomb core materials market?
Which honeycomb material leads in Australia?
Which region leads the Australian market?
How do defense programs affect honeycomb core demand?
How do cladding rules affect facade panel choices?
Which end use grows fastest?
Who are the leading companies in Australia?
What are the main challenges for the market?
Table of Content
Chapter 1 Market Segmentation
- 1.1 Segmentation Framework
- 1.1.1 Product and Service Classification
- 1.1.2 Application and End-Use Classification
- 1.1.3 Technology and Solution Classification
- 1.1.4 Customer and Distribution Channel Classification
- 1.1.5 Geographic Segmentation
- 1.1.6 Market Segment Definitions and Boundaries
- 1.2 By Material Type
- 1.2.1 Aluminium Honeycomb
- 1.2.2 Aramid Honeycomb
- 1.2.3 Thermoplastic Honeycomb
- 1.2.4 Specialty Honeycomb
- 1.3 By End-Use Industry
- 1.3.1 Aerospace and Defence
- 1.3.2 Construction and Architecture
- 1.3.3 Marine
- 1.3.4 Ground Transportation and Industrial Equipment
- 1.4 By Application
- 1.4.1 Structural Load Management
- 1.4.2 Interior and Acoustic Systems
- 1.4.3 Envelope and Protective Systems
- 1.5 By Product Form
- 1.5.1 Bare Core
- 1.5.2 Sandwich Panels
- 1.5.3 Engineered Core Kits
Chapter 2 Introduction
- 2.1 Report Objectives and Scope
- 2.2 Product Definition and Industry Terminology
- 2.3 Market Inclusions and Exclusions
- 2.4 Research Process
- 2.4.1 Primary Research and Expert Interviews
- 2.4.2 Secondary Research and Source Review
- 2.4.3 Top-Down and Bottom-Up Estimation
- 2.4.4 Data Triangulation and Verification
- 2.5 Market Size Measurement Basis
- 2.5.1 2025: USD 100.5 million → 2035: USD 228.9 million
- 2.6 Historical and Forecast Reference Periods
- 2.6.1 Historical Period: 2018-2025
- 2.6.2 Base Year: 2025
- 2.6.3 Forecast Period: 2025-2035
- 2.7 Research Assumptions and Limitations
Chapter 3 Executive Summary
- 3.1 Market Snapshot and Key Findings
- 3.2 Base-Year Market Size, 2025
- 3.3 Forecast Market Size, 2035
- 3.4 Revenue and Volume Growth Outlook
- 3.5 Key Demand and Supply Indicators
- 3.6 Leading Market Segments
- 3.7 Fastest-Growing Market Opportunities
- 3.8 Regional Performance Highlights
- 3.9 Technology and Industry Transformation
- 3.10 Competitive Landscape Summary
- 3.11 Analyst View and Strategic Implications
Chapter 4 Australia Honeycomb Core Materials Market Trends and Developments
- 4.1 Historical Industry Development, 2018-2025
- 4.2 Recent Market Trends and Developments
- 4.3 Demand and Customer Behavior Trends
- 4.4 Technology and Product Innovation
- 4.5 Artificial Intelligence, Automation and Digitalization
- 4.6 Local Manufacturing and Supply Chain Realignment
- 4.7 Industry Partnerships, Mergers and Acquisitions
- 4.8 Sustainability and Circular Economy Developments
- 4.9 Government and Private Sector Investment Trends
- 4.10 Emerging Business Models and Commercialization
- 4.11 Industry Developments and Announcements
Chapter 5 Australia Honeycomb Core Materials Market Production, Supply and Demand Analysis
- 5.1 Demand Trend and Consumption Analysis, 2018-2025
- 5.2 Demand Forecast, 2025-2035
- 5.3 Production and Output Trend, 2018-2025
- 5.4 Production and Output Forecast, 2025-2035
- 5.5 Installed Capacity and Capacity Utilization
- 5.6 Company-Wise Production Plants and Statistics
- 5.6.1 Installed Production Capacity
- 5.6.2 Actual Production
- 5.6.3 Planned Capacity and Expansion Targets
- 5.7 Supply Chain Structure and Procurement Trends
- 5.8 Supply-Demand Gap and Bottlenecks
- 5.9 Import Dependence and Sourcing Structure
- 5.10 Contract Manufacturing and Outsourcing
- 5.11 Regional Supply and Demand Concentration
Chapter 6 Australia Honeycomb Core Materials Market Pricing Analysis
- 6.1 Pricing Structure and Measurement
- 6.2 Historical Pricing Trends, 2018-2025
- 6.3 Pricing Outlook, 2025-2035
- 6.4 Average Selling Price and Unit Economics
- 6.5 Pricing by Product and Market Segment
- 6.6 Geographic Pricing Differences
- 6.7 Key Input, Energy, Labor and Logistics Costs
- 6.8 Contract Pricing and Purchasing Models
- 6.9 Pricing Sensitivity and Competitive Positioning
- 6.10 Price, Margin and Profitability Implications
Chapter 7 Australia Honeycomb Core Materials Market Dynamics
- 7.1 Market Growth Drivers
- 7.1.1 Demand-Side Drivers
- 7.1.2 Technology and Innovation Drivers
- 7.1.3 Infrastructure and Investment Drivers
- 7.1.4 Regulatory and Policy Drivers
- 7.2 Market Restraints
- 7.2.1 Cost and Affordability Constraints
- 7.2.2 Technology and Adoption Barriers
- 7.2.3 Supply Chain and Operational Constraints
- 7.3 Market Challenges
- 7.3.1 Competitive Pressure and Margin Erosion
- 7.3.2 Skills, Infrastructure and Implementation Gaps
- 7.4 Emerging Market Opportunities
- 7.5 Market Dynamics Impact and Time-Horizon Assessment
Chapter 8 Australia Honeycomb Core Materials Value Chain Analysis
- 8.1 Industry Value Chain Overview
- 8.2 Upstream Suppliers and Critical Inputs
- 8.3 Technology and Component Providers
- 8.4 Manufacturing or Service Delivery
- 8.5 Distribution, Channel Partners and Integrators
- 8.6 Downstream Applications and End Users
- 8.7 Value Addition and Profit Pools
- 8.8 Vertical Integration and Outsourcing
- 8.9 Supplier Concentration and Risk
- 8.10 Supply Chain Localization and Resilience
Chapter 9 Australia Honeycomb Core Materials Market Regulations and Policies
- 9.1 Relevant Laws, Standards and Compliance Frameworks
- 9.2 Product, Service, Safety and Quality Requirements
- 9.3 Government Policies, Incentives and Subsidies
- 9.4 Imports, Exports and Trade Barriers
- 9.5 Public Procurement and Local Content Requirements
- 9.6 Environmental and Sustainability Compliance
- 9.7 Upcoming Policy Changes and Market Implications
Chapter 10 Australia Honeycomb Core Materials Market Hotspots and Opportunities
- 10.1 Market Opportunity Mapping and Growth Hotspots
- 10.2 High-Growth Applications and Customer Groups
- 10.3 Underserved Markets and White-Space Opportunities
- 10.4 Emerging Technology and Product Opportunities
- 10.5 New Capacity and Investment Hotspots
- 10.6 Market Entry and Expansion Opportunities
- 10.7 Distribution and Partnership Opportunities
- 10.8 Near-Term and Long-Term Commercial Potential
- 10.9 Opportunity Attractiveness and Execution Risks
Chapter 11 Australia Honeycomb Core Materials Market Outlook, 2025-2035
- 11.1 Market Size and Analysis
- 11.1.1 Revenue (Market Measurement: 2025: USD 100.5 million → 2035: USD 228.9 million)
- 11.1.2 Market Volume and Quantity Sold
- 11.1.3 Historical Market Size, 2018-2025
- 11.1.4 Base-Year Market Size, 2025
- 11.2 Market Forecast, 2025-2035
- 11.2.1 Revenue Forecast to 2035
- 11.2.2 Volume Forecast to 2035
- 11.2.3 CAGR and Year-on-Year Growth
- 11.2.4 Incremental Revenue Opportunity
- 11.3 Forecast Assumptions and Scenario Analysis
- 11.3.1 Base-Case Forecast
- 11.3.2 Optimistic and Conservative Scenarios
- 11.3.3 Technology, Pricing and Policy Sensitivities
- 11.4 Market Attractiveness and Growth Outlook
Chapter 12 Australia Honeycomb Core Materials Market Segmentation and Outlook
- 12.1 Segmentation Summary and Market Shares, 2025
- 12.2 Largest and Fastest-Growing Segments
- 12.3 By Material Type - Market Size and Forecast, 2025-2035
- 12.3.1 Segment Definition and Scope
- 12.3.2 Historical Market Size, 2018-2025
- 12.3.3 Revenue Forecast, 2025-2035
- 12.3.4 Volume Forecast, 2025-2035
- 12.3.5 Base-Year Market Share, 2025
- 12.3.6 Segment CAGR and Growth Drivers
- 12.3.7 Subsegment Market Size and Forecast
- 12.3.7.1 Aluminium Honeycomb
- 12.3.7.2 Aramid Honeycomb
- 12.3.7.3 Thermoplastic Honeycomb
- 12.3.7.4 Specialty Honeycomb
- 12.3.8 Subsegment Pricing and Adoption Trends
- 12.3.9 Leading Suppliers and Competition
- 12.3.10 Regional Demand and Opportunities
- 12.4 By End-Use Industry - Market Size and Forecast, 2025-2035
- 12.4.1 Segment Definition and Scope
- 12.4.2 Historical Market Size, 2018-2025
- 12.4.3 Revenue Forecast, 2025-2035
- 12.4.4 Volume Forecast, 2025-2035
- 12.4.5 Base-Year Market Share, 2025
- 12.4.6 Segment CAGR and Growth Drivers
- 12.4.7 Subsegment Market Size and Forecast
- 12.4.7.1 Aerospace and Defence
- 12.4.7.2 Construction and Architecture
- 12.4.7.3 Marine
- 12.4.7.4 Ground Transportation and Industrial Equipment
- 12.4.8 Subsegment Pricing and Adoption Trends
- 12.4.9 Leading Suppliers and Competition
- 12.4.10 Regional Demand and Opportunities
- 12.5 By Application - Market Size and Forecast, 2025-2035
- 12.5.1 Segment Definition and Scope
- 12.5.2 Historical Market Size, 2018-2025
- 12.5.3 Revenue Forecast, 2025-2035
- 12.5.4 Volume Forecast, 2025-2035
- 12.5.5 Base-Year Market Share, 2025
- 12.5.6 Segment CAGR and Growth Drivers
- 12.5.7 Subsegment Market Size and Forecast
- 12.5.7.1 Structural Load Management
- 12.5.7.2 Interior and Acoustic Systems
- 12.5.7.3 Envelope and Protective Systems
- 12.5.8 Subsegment Pricing and Adoption Trends
- 12.5.9 Leading Suppliers and Competition
- 12.5.10 Regional Demand and Opportunities
- 12.6 By Product Form - Market Size and Forecast, 2025-2035
- 12.6.1 Segment Definition and Scope
- 12.6.2 Historical Market Size, 2018-2025
- 12.6.3 Revenue Forecast, 2025-2035
- 12.6.4 Volume Forecast, 2025-2035
- 12.6.5 Base-Year Market Share, 2025
- 12.6.6 Segment CAGR and Growth Drivers
- 12.6.7 Subsegment Market Size and Forecast
- 12.6.7.1 Bare Core
- 12.6.7.2 Sandwich Panels
- 12.6.7.3 Engineered Core Kits
- 12.6.8 Subsegment Pricing and Adoption Trends
- 12.6.9 Leading Suppliers and Competition
- 12.6.10 Regional Demand and Opportunities
- 12.7 Segment Growth Comparison
- 12.8 Segment Attractiveness and Priority Matrix
Chapter 13 Australia Honeycomb Core Materials End-Use and Application Market Outlook
- 13.1 End-Use Industry and Customer Demand Structure
- 13.2 Leading Applications and Customer Groups
- 13.3 End-Use Market Size, Share and Forecast
- 13.4 Major End-Use Industry Deep Dives
- 13.4.1 Customer Requirements and Use Cases
- 13.4.2 Demand and Replacement Cycles
- 13.4.3 Technical and Regulatory Considerations
- 13.4.4 Purchasing and Procurement Models
- 13.4.5 Leading Vendors and Distribution Channels
- 13.4.6 Forecast and Commercial Opportunities
- 13.5 Emerging Applications and Cross-Segment Demand
- 13.6 End-Use Industry Investment Priorities
Chapter 14 Australia Honeycomb Core Materials Geographic Market Outlook, 2025-2035
- 14.1 Domestic Market Distribution and Demand Clusters
- 14.2 State- or Province-Wise Market Size and Forecast, 2025-2035
- 14.3 City and Metropolitan Market Outlook
- 14.4 Industrial, Manufacturing and Commercial Clusters
- 14.5 Geographic Concentration of Key End Users
- 14.6 Local Pricing and Purchasing Differences
- 14.7 Domestic Production Facilities and Capacity Map
- 14.8 Local Infrastructure and Project Pipeline
- 14.9 State-Level Policy and Incentive Differences
- 14.10 Subnational Investment Hotspots and Opportunities
- 14.11 Distribution and Logistics Networks
- 14.12 Domestic Competitive Footprint
Chapter 15 Australia Honeycomb Core Materials Technology, Innovation and Sustainability Outlook
- 15.1 Technology Landscape and Maturity
- 15.2 Product, Process and Service Innovation
- 15.3 AI, Automation and Digital Tools in the Industry
- 15.4 Technology Adoption and Performance Benchmarking
- 15.5 Innovation Pipeline and R&D Investment
- 15.6 Patent and Intellectual Property Trends
- 15.7 Energy Efficiency and Resource Management
- 15.8 Sustainability, Recycling and Circularity
- 15.9 Technology Roadmap, 2025-2035
- 15.10 Risks of Obsolescence and Technology Substitution
Chapter 16 Australia Honeycomb Core Materials Market Key Strategic Imperatives
- 16.1 Growth and Market Entry Priorities
- 16.2 High-Return Products and Segments
- 16.3 Pricing, Profitability and Cost Optimization
- 16.4 Technology Investment and Product Differentiation
- 16.5 Supply Chain Localization and Resilience
- 16.6 Distribution and Customer Acquisition
- 16.7 Partnership, Acquisition and Capacity Strategy
- 16.8 Regional Expansion Priorities
- 16.9 Short-, Medium- and Long-Term Actions
Chapter 17 Competition Outlook
- 17.1 Industry Competition Characteristics
- 17.2 Market Structure and Concentration
- 17.3 Market Share and Competitive Positioning, 2025
- 17.4 Company-Wise Revenue and Product Benchmarking
- 17.5 Production and Service Capacity Benchmarking
- 17.6 Technology, Pricing and Differentiation
- 17.7 Regional Footprint and Distribution Strength
- 17.8 Mergers, Acquisitions and Strategic Alliances
- 17.9 New Entrants and Competitive Threats
- 17.10 Porter's Five Forces and Industry Attractiveness
- 17.11 Competitive Outlook, 2025-2035
Chapter 18 Company Profiles
- 18.1 Company Coverage and Selection Criteria
- 18.2 Corex Honeycomb
- 18.2.1 Business Description
- 18.2.2 Company Ownership and Geographic Presence
- 18.2.3 Product and Service Portfolio
- 18.2.4 Manufacturing and Operating Footprint
- 18.2.5 Production Capacity and Expansion Plans
- 18.2.6 Financial Performance and Investment
- 18.2.7 Market Share and Competitive Position
- 18.2.8 Technology and Innovation Capabilities
- 18.2.9 Strategic Alliances or Partnerships
- 18.2.10 Recent Developments
- 18.2.11 Growth Strategy and Outlook
- 18.3 Alucobond Architectural
- 18.4 ATL Composites
- 18.5 DIAB Australia
- 18.6 Quickstep Holdings
- 18.7 Boeing Aerostructures Australia
- 18.8 Boeing Defence Australia
- 18.9 Other Relevant Market Participants
Note: Every listed company is profiled on the structure shown under the first company. The company list is preliminary and may change based on research findings, market developments, data availability and client requirements.
Chapter 19 Disclaimer
- 19.1 Research and Forecast Disclaimer
- 19.2 Data Source and Estimation Limitations
Note: The depth of individual sections depends on data availability for this market. Volume, capacity, trade and other unit-based metrics are included where applicable.

