
Concrete Admixtures Market: USD 21.35 billion in 2025, as Low-Clinker Cement Raises the Chemistry Bill
The global concrete admixtures market was worth USD 21.35 billion in 2025, and we forecast it to reach USD 35.87 billion by 2035, a CAGR of 5.33% over 2025–2035. For 2026, the current year, we put the market at USD 22.35 billion, with Indian and Gulf demand outpacing a still-shrinking Chinese housing sector.
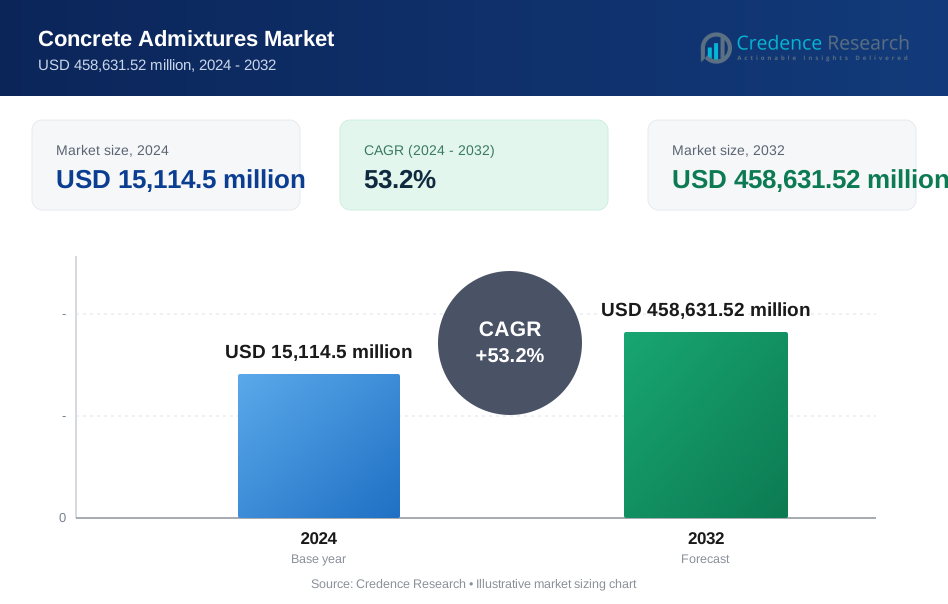
All figures here are our own estimates. We sized the market from cement consumption by region and the admixture spend each tonne of cement carries, then checked the result against what the leading suppliers disclose. Older figures on this page, which implied growth above 50% a year, did not survive that test and have been withdrawn.
Our central view is simple. Admixtures are a mature product line attached to a slow-growing material, yet they grow roughly twice as fast as cement itself. The reason is intensity: every switch to blended cement, every higher-strength mix and every pump-placed pour needs more chemistry per cubic metre. That gap between flat concrete volumes and rising dosage is the story of the next ten years.
Which chemicals sit inside our admixture boundary?
We count chemical products added to hydraulic-cement concrete, shotcrete and grout at the batching plant or on site, in the categories defined by ASTM C494 and the European EN 934 series. We group them by type and by end use. We include:
- Water reducers and superplasticizers: lignosulfonate, naphthalene, melamine and polycarboxylate ether (PCE) dispersants, a 58.0% share in 2025.
- Set-control admixtures: accelerators (10.0%) and retarders (8.0%), including shotcrete accelerators.
- Air-entraining and integral waterproofing admixtures, plus viscosity modifiers, shrinkage reducers, corrosion inhibitors and other specialty products grouped as others.
We leave out three things:
- Cement grinding aids and clinker additives used inside the cement plant.
- Mineral admixtures such as fly ash, slag and silica fume, which we treat as cementitious materials rather than chemistry.
- Surface-applied membranes, coatings, sealers and repair mortars, which sit in our wider construction chemicals coverage.
Why is the market much smaller than the old forecast?
Because admixtures cost a few percent of a concrete mix, not a large slice of it. The old page implied a 53% annual growth rate, which no mature construction input can sustain. Cement output barely moved in 2025: the US Geological Survey estimates world production slightly lower than in 2024, with China still producing well over 40% of the world total. A chemistry bill attached to that volume grows with dosage and mix design, at mid-single digits.

Report Attributes
| Attribute | Details |
|---|---|
| Market size (2025) | USD 21.35 billion |
| Market size (2026) | USD 22.35 billion |
| Market size (2035) | USD 35.87 billion |
| CAGR (2025–2035) | 5.33% |
| Base year | 2025 |
| Forecast period | 2026–2035 |
| Largest type | Water Reducers & Superplasticizers (58.0%) |
| Fastest-growing type | Waterproofing Admixtures (6.20% CAGR) |
| Largest region | Asia Pacific (47.8%) |
| Fastest-growing region | Middle East & Africa (6.71% CAGR) |
| Segments covered | Type, Application, Region |
How did we size the market?
Two separate lenses fed the estimate, and we settled between them:
- Cement demand. We allocated national cement output and consumption to five regions, then applied an admixture spend per tonne of cement that reflects ready-mix penetration, PCE use and local prices in each region.
- Supplier revenue. We estimated admixture sales for Sika, Saint-Gobain's construction chemicals unit, Master Builders Solutions, Mapei, RPM's Euclid Chemical and the largest Chinese PCE producers, then grossed them up by their combined share.
The full report sets out the cement base, dosage assumptions and supplier estimates behind each segment, region and year.
Concrete Admixtures Market Insights
- The concrete admixtures market was worth USD 21.35 billion in 2025 and we forecast USD 35.87 billion by 2035, a 5.33% CAGR.
- We estimate the market at USD 22.35 billion in 2026, the current year, as Europe and India offset weak Chinese housing.
- Water reducers and superplasticizers hold a 58.0% share; waterproofing admixtures grow fastest at 6.20% a year.
- Asia Pacific is the largest region with a 47.8% share; Middle East & Africa grows fastest at 6.71% a year.
- Infrastructure is the largest application at 38.5% of 2025 value and grows at 6.01% a year.
- Consolidation reshaped supply: Sika closed MBCC in 2023 and Saint-Gobain completed Fosroc in February 2025.
Superplasticizers Lead, Waterproofing Grows Fastest: Admixture Types and End Uses
Water reducers and superplasticizers are the largest type, with a 58.0% share of 2025 value. Waterproofing admixtures are the fastest-growing type at 6.20% a year through 2035.
| Type | Share 2025 | CAGR 2025–2035 |
|---|---|---|
| Water Reducers & Superplasticizers | 58.0% | 5.50% |
| Accelerators | 10.0% | 5.30% |
| Waterproofing Admixtures | 9.0% | 6.20% |
| Others | 9.0% | 5.00% |
| Retarders | 8.0% | 4.40% |
| Air-Entraining Admixtures | 6.0% | 3.90% |
Water reducers and superplasticizers
Water reducers and superplasticizers hold a 58.0% share and grow at 5.50% a year. They cover ASTM Types A, F and G, and nearly every ready-mix load contains one. PCE now leads in value.
Accelerators
Set-accelerating products hold a 10.0% share and grow at 5.30% a year. Cold-weather concreting, precast cycle times and alkali-free shotcrete accelerators for tunnels drive demand.
Waterproofing admixtures
Waterproofing admixtures hold a 9.0% share and grow at 6.20% a year, the fastest of all types, as builders replace external membranes with integral protection in below-grade structures.
Retarders
Set-retarding products hold an 8.0% share and grow at 4.40% a year. Hot-climate pours in the Gulf, India and Southeast Asia, and long haul times for ready-mix, keep them in steady use.
Air-entraining admixtures
Air-entraining admixtures hold a 6.0% share and grow at 3.90% a year, the slowest type. Demand is concentrated where freeze-thaw cycles and de-icing salts attack pavements and bridge decks, chiefly North America and northern Europe.
Others
Other admixtures, including viscosity modifiers, shrinkage reducers and corrosion inhibitors, hold a 9.0% share and grow at 5.00% a year.

By application, infrastructure leads with a 38.5% share and is also the fastest-growing at 6.01% a year. Residential follows at 34.0% and commercial at 27.5%.
| Application | Share 2025 | CAGR 2025–2035 |
|---|---|---|
| Infrastructure | 38.5% | 6.01% |
| Residential | 34.0% | 4.69% |
| Commercial | 27.5% | 5.10% |
Infrastructure
Civil and transport works hold a 38.5% share. Roads, bridges, tunnels, rail, ports, dams and water networks use the highest dosages and the most specialised products per cubic metre.
Residential
Housing holds a 34.0% share and grows at 4.69% a year, the slowest application, held back by the slump in Chinese apartment construction.
Commercial
Non-residential buildings hold a 27.5% share and grow at 5.10% a year. Offices, warehouses, data centres and industrial plants favour high-strength, fast-cycling mixes.

Request a Free Sample
Fill in your details and we'll send you a free sample report.
- Sample data tables & charts
- Research methodology
Why Each Cubic Metre of Concrete Carries More Chemistry
How does low-clinker cement raise admixture demand?
Cement makers are cutting clinker to lower carbon, and that shifts work onto admixtures. Blended cements set more slowly, gain early strength later and respond differently to water. Producers use accelerators, tailored superplasticizers and set-control blends to keep pour schedules and finish quality unchanged. In the United States, blended cement made up 63% of cement shipments in the first nine months of 2025, and about 95% of that was portland-limestone cement, according to the USGS.
In our model this substitution effect explains close to half of the 5.33% market CAGR. Every percentage point of clinker taken out of a mix tends to add dosage, and the dosage is increasingly polycarboxylate-based, which carries a higher value per tonne than older lignosulfonate or naphthalene chemistry. Our green cement work tracks the binder side of the same shift.
Why does ready-mix growth matter?
Ready-mix plants dose admixtures in almost every load; site-mixed concrete often uses none. As India, Southeast Asia, Africa and the Gulf move from site mixing to central batching, admixture use per tonne of cement climbs sharply even before mix design changes. That is why Asia Pacific grows at 5.59% a year despite falling Chinese volumes, and why Middle East & Africa is the fastest-growing region at 6.71%. Our ready-mix concrete report follows the plant build-out.
What does infrastructure spending add?
Bridges, tunnels, metros, ports and dams specify high-performance concrete with low water-cement ratios, long workability windows and durability targets of 100 years or more. Those mixes depend on high-range water reducers, retarders, shotcrete accelerators and corrosion inhibitors. Infrastructure holds a 38.5% share of 2025 value and grows at 6.01% a year, the fastest of the three applications, as transport and water programmes in India, the Gulf, the United States and Europe run through the decade.
Do standards and product rules help?
They do, by rewarding tested, documented products. ASTM C494/C494M-24 sets out eight admixture types, from Type A water-reducing to Type S specific-performance products, and US specifiers write to it. In Europe, the new Construction Products Regulation (EU) 2024/3110 entered into force on 7 January 2025 and its main provisions apply from 8 January 2026, according to the European Commission. Manufacturers will have to declare life-cycle environmental data as harmonised standards move to the new regime. Large suppliers with testing labs and EPD programmes are best placed to absorb that work.
How much does labour scarcity matter?
More than it used to. Self-compacting and pumpable mixes cut vibration, finishing and crew time, and they rely on superplasticizers and viscosity modifiers. Where skilled finishers are scarce, contractors pay for chemistry instead of labour.
PCE Chemistry, Local Plants and Carbon Accounting Reshape the Admixture Business
Trend 1: Is PCE replacing older dispersants everywhere?
Largely, yes. Polycarboxylate ether superplasticizers deliver higher water reduction at lower dosage and can be tuned molecule by molecule for slump retention or early strength. Chinese producers made PCE a commodity at home, while Western suppliers sell formulated PCE blends matched to local cements. Water reducers and superplasticizers hold a 58.0% share and grow at 5.50% a year.
Trend 2: Are suppliers building plants close to customers?
They are, because admixtures are mostly water and freight is costly. In its first-half 2026 results, Sika reported new admixture plants in Florida, in Ham, Belgium, in Bangladesh and in Tanzania. Master Builders Solutions lifted its plant count from 35 to 43 under Cinven ownership, according to Cinven in February 2026. In our view, local blending capacity is now the main way suppliers win share in growth markets.
Trend 3: Is carbon accounting entering admixture selection?
Yes. Ready-mix producers now publish environmental product declarations for their mixes, and admixtures that let them cut cement content per cubic metre lower the declared footprint. Suppliers increasingly sell admixtures as a carbon-reduction tool, bundled with mix-design support, rather than as a per-litre commodity.
Trend 4: Will digital dosing change how admixtures are sold?
Slowly. Batching plants and truck-mounted systems that measure slump in transit and dose admixture on the way to site move part of the chemistry decision from the plant lab to software. Suppliers that own the sensors and dosing logic gain stickier contracts with large ready-mix fleets.
Trend 5: Is integral waterproofing gaining on membranes?
In basements, tanks and tunnels it is. Crystalline and hydrophobic admixtures make the concrete itself the barrier, cutting a separate membrane trade. Waterproofing admixtures hold a 9.0% share and are the fastest-growing type at 6.20% a year; our sibling waterproofing admixtures report covers that niche in depth.
Challenges for Admixture Suppliers: Chinese Housing, Raw Material Swings and Flat Cement
Challenge 1: How deep is the Chinese downturn?
Deep. Sika reported that the Chinese residential market fell 45% between 2023 and 2025, and Chinese construction was the main drag on its 2025 sales. China still consumes the largest volume of admixtures in the world, so a weak property sector holds back the global average. We keep China's growth well below the Asia Pacific figure of 5.59% for the region as a whole.
Challenge 2: Are cement volumes still flat?
Broadly. US cement shipments fell 2.1% in the first nine months of 2025, and world output edged down, according to the USGS. Sika put the decline in its relevant construction market at about 2.5% in 2025. Admixture growth therefore depends on dosage and mix upgrades rather than on more concrete.
Challenge 3: How exposed are margins to raw materials?
Very. PCE is built from ethylene-oxide-based monomers and acrylic acid, so petrochemical price swings pass through quickly. Large suppliers reprice within months; regional blenders often cannot, which pushes them toward sale or partnership.
Challenge 4: Is compatibility a hidden cost?
Each new blended cement, calcined clay or recycled aggregate behaves differently with a given superplasticizer. Suppliers need labs near customers to retune formulations, which raises the cost of serving small markets.
Where the Next Admixture Revenue Comes From
Can calcined clay and slag cements become the next big outlet?
Yes. Limestone calcined clay and high-slag cements need tailored water reducers and accelerators to match ordinary portland cement performance. Every cement plant that switches opens a reformulation project for an admixture supplier.
Is India the largest growth opportunity?
In our view it is. India is the second-largest cement producer, ready-mix penetration is still low and infrastructure budgets remain large. Sika reported that Asia Pacific outside China grew 7.7% organically in the first half of 2026, led by India and Southeast Asia.
Do specialist set-control products have room to grow?
Accelerators hold a 10.0% share and grow at 5.30% a year, helped by tunnelling shotcrete and precast cycle times. Our concrete accelerators and retarders report breaks out that demand.
Asia's Volume, Western Dosage and Gulf Megaprojects
Admixture value follows cement volume in Asia and dosage intensity in the West. Middle East & Africa is the fastest-growing region at 6.71% a year.
| Region | Share 2025 | CAGR 2025–2035 |
|---|---|---|
| Asia Pacific | 47.8% | 5.59% |
| Europe | 19.5% | 4.07% |
| North America | 12.8% | 4.67% |
| Middle East & Africa | 12.4% | 6.71% |
| Latin America | 7.5% | 5.39% |
Asia Pacific
Asia Pacific holds a 47.8% share of 2025 value and grows at 5.59% a year. China is the largest single market by volume but sells PCE at low prices; India, Indonesia, Vietnam and the Philippines add growth as ready-mix spreads.
Europe
Admixture demand in Europe holds a 19.5% share and grows at 4.07% a year, the slowest region. High dosage per cubic metre and the push to low-clinker cement offset flat volumes, and the 2024 CPR adds environmental disclosure duties.
North America
North America holds a 12.8% share and grows at 4.67% a year. Ready-mix dominates, portland-limestone cement is now standard, and highway and water programmes support infrastructure demand.
Middle East & Africa
Middle East & Africa holds a 12.4% share and grows at 6.71% a year, the fastest of all regions. Gulf megaprojects need retarders and high-range water reducers for hot-weather pours, and East African plants such as Sika's Tanzania site bring local supply.
Latin America
Latin America holds a 7.5% share and grows at 5.39% a year. Brazil and Mexico lead, with bagged cement and site mixing still common, which leaves room for higher admixture use.

Plant Openings, Acquisitions and New Product Rules, 2023–2026
| Date | Development | Why it matters |
|---|---|---|
| July 2026 | Sika reported new concrete admixture plants in Florida, Ham (Belgium), Bangladesh and Tanzania in its July 2026 half-year results. | Local blending capacity in both mature and growth markets. |
| July 2026 | Sika raised its 2026 local-currency sales growth outlook to 3% to 6% in July 2026, citing 7.7% organic growth in Asia Pacific outside China. | Signals recovery outside Chinese housing. |
| February 2026 | Cinven reported in February 2026 that Master Builders Solutions had grown from 35 to 43 plants with bolt-ons in Italy, Spain and the Dominican Republic. | The third Western supplier is scaling under private equity. |
| February 2026 | Sika reported in February 2026 that the Chinese residential market fell 45% between 2023 and 2025. | Explains weak volumes in the largest admixture market. |
| January 2026 | The main provisions of the EU Construction Products Regulation (EU) 2024/3110 began to apply on 8 January 2026. | Brings life-cycle environmental declarations to construction products. |
| 2025 | Sika acquired Gulf Additive Factory in Qatar during 2025, a maker of concrete admixtures, mortars and waterproofing. | Adds local supply for Gulf infrastructure. |
| February 2025 | Saint-Gobain completed its acquisition of Fosroc in February 2025. | Strengthens the second global leader in India and the Middle East. |
| January 2025 | Regulation (EU) 2024/3110, the new Construction Products Regulation, entered into force on 7 January 2025. | Starts the move from CPR-2011 harmonised standards. |
| 2024 | ASTM issued C494/C494M-24 in 2024, covering admixture Types A to G and Type S. | Keeps the US specification current for new chemistries. |
| May 2023 | Sika closed its MBCC Group acquisition in May 2023 and sold MBCC admixture assets in Europe, North America, Australia and New Zealand to Cinven. | Created today's top-three supplier structure. |
Need a Custom Version of This Report?
Tailor the scope, geography, or segments to your exact requirements.
- Custom geography or segment scope
- Direct access to our analyst team
Two Global Leaders, a Private-Equity Challenger and a Long Regional Tail
Admixture supply consolidated sharply between 2021 and 2025. Two groups now lead worldwide, a carve-out owned by private equity sits third in the West, and hundreds of regional formulators, many of them Chinese PCE makers, make up the rest.
Who leads?
- Sika is, in our view, the largest admixture supplier since it closed its purchase of MBCC Group in May 2023. Concrete is one of its main target markets, and it keeps adding local plants and bolt-on deals such as Gulf Additive Factory in Qatar in 2025.
- Saint-Gobain built its construction chemicals unit through CHRYSO, GCP Applied Technologies and, in February 2025, Fosroc, whose admixtures are strong in India and the Middle East. The combined unit operates in 76 countries.
- Master Builders Solutions holds the MBCC admixture businesses that Sika had to sell in the UK, the US, Canada, Europe, Australia and New Zealand. Cinven acquired them in 2023 and has added bolt-ons in Italy, Spain and the Dominican Republic.
Who else competes?
Mapei, the Italian family-owned group, sells admixtures alongside its mortars and adhesives across Europe and beyond. RPM International competes through Euclid Chemical in the Americas. In China, Jiangsu Sobute New Materials and dozens of PCE makers compete on price, while Pidilite and the Fosroc business serve India.
How concentrated is the market?
In our view the five largest suppliers hold roughly two-fifths of global value, and well over half outside China. Leaders win on technical service: mix-design labs, field engineers and the ability to retune products for each new cement. Regional players win on price and delivery radius.
What will drive further consolidation?
Environmental declarations under the EU CPR, petrochemical price swings and the cost of serving low-clinker cements all favour scale. We expect more bolt-on deals by Sika, Saint-Gobain and Master Builders Solutions in India, Southeast Asia, Africa and Latin America, where local formulators hold strong positions with ready-mix customers.
Frequently Asked Questions
How big is the concrete admixtures market?
What does the concrete admixtures market include?
Which admixture type is largest?
Which region leads the concrete admixtures market?
Why do admixtures grow faster than cement?
Who are the leading concrete admixture companies?
What holds back the concrete admixtures market?
How was the concrete admixtures market sized?
Table of Content
Chapter 1 Market Segmentation
- 1.1 Segmentation Framework
- 1.1.1 Product and Service Classification
- 1.1.2 Application and End-Use Classification
- 1.1.3 Technology and Solution Classification
- 1.1.4 Customer and Distribution Channel Classification
- 1.1.5 Geographic Segmentation
- 1.1.6 Market Segment Definitions and Boundaries
- 1.2 By Type
- 1.2.1 Water Reducers & Superplasticizers
- 1.2.2 Retarders
- 1.2.3 Accelerators
- 1.2.4 Air-Entraining Admixtures
- 1.2.5 Waterproofing Admixtures
- 1.2.6 Others
- 1.3 By Application
- 1.3.1 Residential
- 1.3.2 Commercial
- 1.3.3 Infrastructure
Chapter 2 Introduction
- 2.1 Report Objectives and Scope
- 2.2 Product Definition and Industry Terminology
- 2.3 Market Inclusions and Exclusions
- 2.4 Research Process
- 2.4.1 Primary Research and Expert Interviews
- 2.4.2 Secondary Research and Source Review
- 2.4.3 Top-Down and Bottom-Up Estimation
- 2.4.4 Data Triangulation and Verification
- 2.5 Market Size Measurement Basis
- 2.5.1 2025: USD 21.35 billion → 2035: USD 35.87 billion
- 2.6 Historical and Forecast Reference Periods
- 2.6.1 Historical Period: 2018-2025
- 2.6.2 Base Year: 2025
- 2.6.3 Forecast Period: 2025-2035
- 2.7 Research Assumptions and Limitations
Chapter 3 Executive Summary
- 3.1 Market Snapshot and Key Findings
- 3.2 Base-Year Market Size, 2025
- 3.3 Forecast Market Size, 2035
- 3.4 Revenue and Volume Growth Outlook
- 3.5 Key Demand and Supply Indicators
- 3.6 Leading Market Segments
- 3.7 Fastest-Growing Market Opportunities
- 3.8 Regional Performance Highlights
- 3.9 Technology and Industry Transformation
- 3.10 Competitive Landscape Summary
- 3.11 Analyst View and Strategic Implications
Chapter 4 Global Concrete Admixtures Market Trends and Developments
- 4.1 Historical Industry Development, 2018-2025
- 4.2 Recent Market Trends and Developments
- 4.3 Demand and Customer Behavior Trends
- 4.4 Technology and Product Innovation
- 4.5 Artificial Intelligence, Automation and Digitalization
- 4.6 Local Manufacturing and Supply Chain Realignment
- 4.7 Industry Partnerships, Mergers and Acquisitions
- 4.8 Sustainability and Circular Economy Developments
- 4.9 Government and Private Sector Investment Trends
- 4.10 Emerging Business Models and Commercialization
- 4.11 Industry Developments and Announcements
Chapter 5 Global Concrete Admixtures Market Production, Supply and Demand Analysis
- 5.1 Demand Trend and Consumption Analysis, 2018-2025
- 5.2 Demand Forecast, 2025-2035
- 5.3 Production and Output Trend, 2018-2025
- 5.4 Production and Output Forecast, 2025-2035
- 5.5 Installed Capacity and Capacity Utilization
- 5.6 Company-Wise Production Plants and Statistics
- 5.6.1 Installed Production Capacity
- 5.6.2 Actual Production
- 5.6.3 Planned Capacity and Expansion Targets
- 5.7 Supply Chain Structure and Procurement Trends
- 5.8 Supply-Demand Gap and Bottlenecks
- 5.9 Import Dependence and Sourcing Structure
- 5.10 Contract Manufacturing and Outsourcing
- 5.11 Regional Supply and Demand Concentration
Chapter 6 Global Concrete Admixtures Market Pricing Analysis
- 6.1 Pricing Structure and Measurement
- 6.2 Historical Pricing Trends, 2018-2025
- 6.3 Pricing Outlook, 2025-2035
- 6.4 Average Selling Price and Unit Economics
- 6.5 Pricing by Product and Market Segment
- 6.6 Geographic Pricing Differences
- 6.7 Key Input, Energy, Labor and Logistics Costs
- 6.8 Contract Pricing and Purchasing Models
- 6.9 Pricing Sensitivity and Competitive Positioning
- 6.10 Price, Margin and Profitability Implications
Chapter 7 Global Concrete Admixtures Market Dynamics
- 7.1 Market Growth Drivers
- 7.1.1 Demand-Side Drivers
- 7.1.2 Technology and Innovation Drivers
- 7.1.3 Infrastructure and Investment Drivers
- 7.1.4 Regulatory and Policy Drivers
- 7.2 Market Restraints
- 7.2.1 Cost and Affordability Constraints
- 7.2.2 Technology and Adoption Barriers
- 7.2.3 Supply Chain and Operational Constraints
- 7.3 Market Challenges
- 7.3.1 Competitive Pressure and Margin Erosion
- 7.3.2 Skills, Infrastructure and Implementation Gaps
- 7.4 Emerging Market Opportunities
- 7.5 Market Dynamics Impact and Time-Horizon Assessment
Chapter 8 Global Concrete Admixtures Value Chain Analysis
- 8.1 Industry Value Chain Overview
- 8.2 Upstream Suppliers and Critical Inputs
- 8.3 Technology and Component Providers
- 8.4 Manufacturing or Service Delivery
- 8.5 Distribution, Channel Partners and Integrators
- 8.6 Downstream Applications and End Users
- 8.7 Value Addition and Profit Pools
- 8.8 Vertical Integration and Outsourcing
- 8.9 Supplier Concentration and Risk
- 8.10 Supply Chain Localization and Resilience
Chapter 9 Global Concrete Admixtures Market Regulations and Policies
- 9.1 Relevant Laws, Standards and Compliance Frameworks
- 9.2 Product, Service, Safety and Quality Requirements
- 9.3 Government Policies, Incentives and Subsidies
- 9.4 Imports, Exports and Trade Barriers
- 9.5 Public Procurement and Local Content Requirements
- 9.6 Environmental and Sustainability Compliance
- 9.7 Upcoming Policy Changes and Market Implications
Chapter 10 Global Concrete Admixtures Market Hotspots and Opportunities
- 10.1 Market Opportunity Mapping and Growth Hotspots
- 10.2 High-Growth Applications and Customer Groups
- 10.3 Underserved Markets and White-Space Opportunities
- 10.4 Emerging Technology and Product Opportunities
- 10.5 New Capacity and Investment Hotspots
- 10.6 Market Entry and Expansion Opportunities
- 10.7 Distribution and Partnership Opportunities
- 10.8 Near-Term and Long-Term Commercial Potential
- 10.9 Opportunity Attractiveness and Execution Risks
Chapter 11 Global Concrete Admixtures Market Outlook, 2025-2035
- 11.1 Market Size and Analysis
- 11.1.1 Revenue (Market Measurement: 2025: USD 21.35 billion → 2035: USD 35.87 billion)
- 11.1.2 Market Volume and Quantity Sold
- 11.1.3 Historical Market Size, 2018-2025
- 11.1.4 Base-Year Market Size, 2025
- 11.2 Market Forecast, 2025-2035
- 11.2.1 Revenue Forecast to 2035
- 11.2.2 Volume Forecast to 2035
- 11.2.3 CAGR and Year-on-Year Growth
- 11.2.4 Incremental Revenue Opportunity
- 11.3 Forecast Assumptions and Scenario Analysis
- 11.3.1 Base-Case Forecast
- 11.3.2 Optimistic and Conservative Scenarios
- 11.3.3 Technology, Pricing and Policy Sensitivities
- 11.4 Market Attractiveness and Growth Outlook
Chapter 12 Global Concrete Admixtures Market Segmentation and Outlook
- 12.1 Segmentation Summary and Market Shares, 2025
- 12.2 Largest and Fastest-Growing Segments
- 12.3 By Type - Market Size and Forecast, 2025-2035
- 12.3.1 Segment Definition and Scope
- 12.3.2 Historical Market Size, 2018-2025
- 12.3.3 Revenue Forecast, 2025-2035
- 12.3.4 Volume Forecast, 2025-2035
- 12.3.5 Base-Year Market Share, 2025
- 12.3.6 Segment CAGR and Growth Drivers
- 12.3.7 Subsegment Market Size and Forecast
- 12.3.7.1 Water Reducers & Superplasticizers
- 12.3.7.2 Retarders
- 12.3.7.3 Accelerators
- 12.3.7.4 Air-Entraining Admixtures
- 12.3.7.5 Waterproofing Admixtures
- 12.3.7.6 Others
- 12.3.8 Subsegment Pricing and Adoption Trends
- 12.3.9 Leading Suppliers and Competition
- 12.3.10 Regional Demand and Opportunities
- 12.4 By Application - Market Size and Forecast, 2025-2035
- 12.4.1 Segment Definition and Scope
- 12.4.2 Historical Market Size, 2018-2025
- 12.4.3 Revenue Forecast, 2025-2035
- 12.4.4 Volume Forecast, 2025-2035
- 12.4.5 Base-Year Market Share, 2025
- 12.4.6 Segment CAGR and Growth Drivers
- 12.4.7 Subsegment Market Size and Forecast
- 12.4.7.1 Residential
- 12.4.7.2 Commercial
- 12.4.7.3 Infrastructure
- 12.4.8 Subsegment Pricing and Adoption Trends
- 12.4.9 Leading Suppliers and Competition
- 12.4.10 Regional Demand and Opportunities
- 12.5 Segment Growth Comparison
- 12.6 Segment Attractiveness and Priority Matrix
Chapter 13 Global Concrete Admixtures End-Use and Application Market Outlook
- 13.1 End-Use Industry and Customer Demand Structure
- 13.2 Leading Applications and Customer Groups
- 13.3 End-Use Market Size, Share and Forecast
- 13.4 Major End-Use Industry Deep Dives
- 13.4.1 Customer Requirements and Use Cases
- 13.4.2 Demand and Replacement Cycles
- 13.4.3 Technical and Regulatory Considerations
- 13.4.4 Purchasing and Procurement Models
- 13.4.5 Leading Vendors and Distribution Channels
- 13.4.6 Forecast and Commercial Opportunities
- 13.5 Emerging Applications and Cross-Segment Demand
- 13.6 End-Use Industry Investment Priorities
Chapter 14 Global Concrete Admixtures Geographic Market Outlook, 2025-2035
- 14.1 Regional Market Size and Share, 2025
- 14.2 Regional Market Forecast, 2025-2035
- 14.3 Regional Pricing, Production and Demand Differences
- 14.4 North America
- 14.4.1 United States
- 14.4.2 Canada
- 14.4.3 Mexico
- 14.5 Europe
- 14.5.1 Germany
- 14.5.2 France
- 14.5.3 Italy
- 14.5.4 United Kingdom
- 14.5.5 Spain
- 14.5.6 Poland
- 14.5.7 Russia
- 14.5.8 Netherlands
- 14.5.9 Belgium
- 14.5.10 Sweden
- 14.5.11 Denmark
- 14.5.12 Norway
- 14.5.13 Rest of Europe
- 14.6 Asia Pacific
- 14.6.1 China
- 14.6.2 India
- 14.6.3 Japan
- 14.6.4 South Korea
- 14.6.5 Thailand
- 14.6.6 Indonesia
- 14.6.7 Vietnam
- 14.6.8 Malaysia
- 14.6.9 Australia
- 14.6.10 Rest of Asia Pacific
- 14.7 Latin America
- 14.7.1 Brazil
- 14.7.2 Argentina
- 14.7.3 Colombia
- 14.7.4 Chile
- 14.7.5 Rest of Latin America
- 14.8 Middle East
- 14.8.1 Saudi Arabia
- 14.8.2 United Arab Emirates
- 14.8.3 Turkey
- 14.8.4 Israel
- 14.8.5 Iran
- 14.8.6 Rest of the Middle East
- 14.9 Africa
- 14.9.1 South Africa
- 14.9.2 Egypt
- 14.9.3 Nigeria
- 14.9.4 Morocco
- 14.9.5 Rest of Africa
- 14.10 Regional Investment, Policy and Supply Chain Differences
- 14.11 Regional Competitive Landscape
- 14.12 Geographic Growth Hotspots
Chapter 15 Global Concrete Admixtures Technology, Innovation and Sustainability Outlook
- 15.1 Technology Landscape and Maturity
- 15.2 Product, Process and Service Innovation
- 15.3 AI, Automation and Digital Tools in the Industry
- 15.4 Technology Adoption and Performance Benchmarking
- 15.5 Innovation Pipeline and R&D Investment
- 15.6 Patent and Intellectual Property Trends
- 15.7 Energy Efficiency and Resource Management
- 15.8 Sustainability, Recycling and Circularity
- 15.9 Technology Roadmap, 2025-2035
- 15.10 Risks of Obsolescence and Technology Substitution
Chapter 16 Global Concrete Admixtures Market Key Strategic Imperatives
- 16.1 Growth and Market Entry Priorities
- 16.2 High-Return Products and Segments
- 16.3 Pricing, Profitability and Cost Optimization
- 16.4 Technology Investment and Product Differentiation
- 16.5 Supply Chain Localization and Resilience
- 16.6 Distribution and Customer Acquisition
- 16.7 Partnership, Acquisition and Capacity Strategy
- 16.8 Regional Expansion Priorities
- 16.9 Short-, Medium- and Long-Term Actions
Chapter 17 Competition Outlook
- 17.1 Industry Competition Characteristics
- 17.2 Market Structure and Concentration
- 17.3 Market Share and Competitive Positioning, 2025
- 17.4 Company-Wise Revenue and Product Benchmarking
- 17.5 Production and Service Capacity Benchmarking
- 17.6 Technology, Pricing and Differentiation
- 17.7 Regional Footprint and Distribution Strength
- 17.8 Mergers, Acquisitions and Strategic Alliances
- 17.9 New Entrants and Competitive Threats
- 17.10 Porter's Five Forces and Industry Attractiveness
- 17.11 Competitive Outlook, 2025-2035
Chapter 18 Company Profiles
- 18.1 Company Coverage and Selection Criteria
- 18.2 Sika
- 18.2.1 Business Description
- 18.2.2 Company Ownership and Geographic Presence
- 18.2.3 Product and Service Portfolio
- 18.2.4 Manufacturing and Operating Footprint
- 18.2.5 Production Capacity and Expansion Plans
- 18.2.6 Financial Performance and Investment
- 18.2.7 Market Share and Competitive Position
- 18.2.8 Technology and Innovation Capabilities
- 18.2.9 Strategic Alliances or Partnerships
- 18.2.10 Recent Developments
- 18.2.11 Growth Strategy and Outlook
- 18.3 Saint-Gobain
- 18.4 Master Builders Solutions
- 18.5 Mapei
- 18.6 RPM International
- 18.7 Euclid Chemical
- 18.8 Fosroc
- 18.9 CHRYSO
- 18.10 GCP Applied Technologies
- 18.11 Pidilite
- 18.12 Jiangsu Sobute New Materials
- 18.13 Other Relevant Market Participants
Note: Every listed company is profiled on the structure shown under the first company. The company list is preliminary and may change based on research findings, market developments, data availability and client requirements.
Chapter 19 Disclaimer
- 19.1 Research and Forecast Disclaimer
- 19.2 Data Source and Estimation Limitations
Note: The depth of individual sections depends on data availability for this market. Volume, capacity, trade and other unit-based metrics are included where applicable.

