
Defense, mining and medical work lift polymer demand
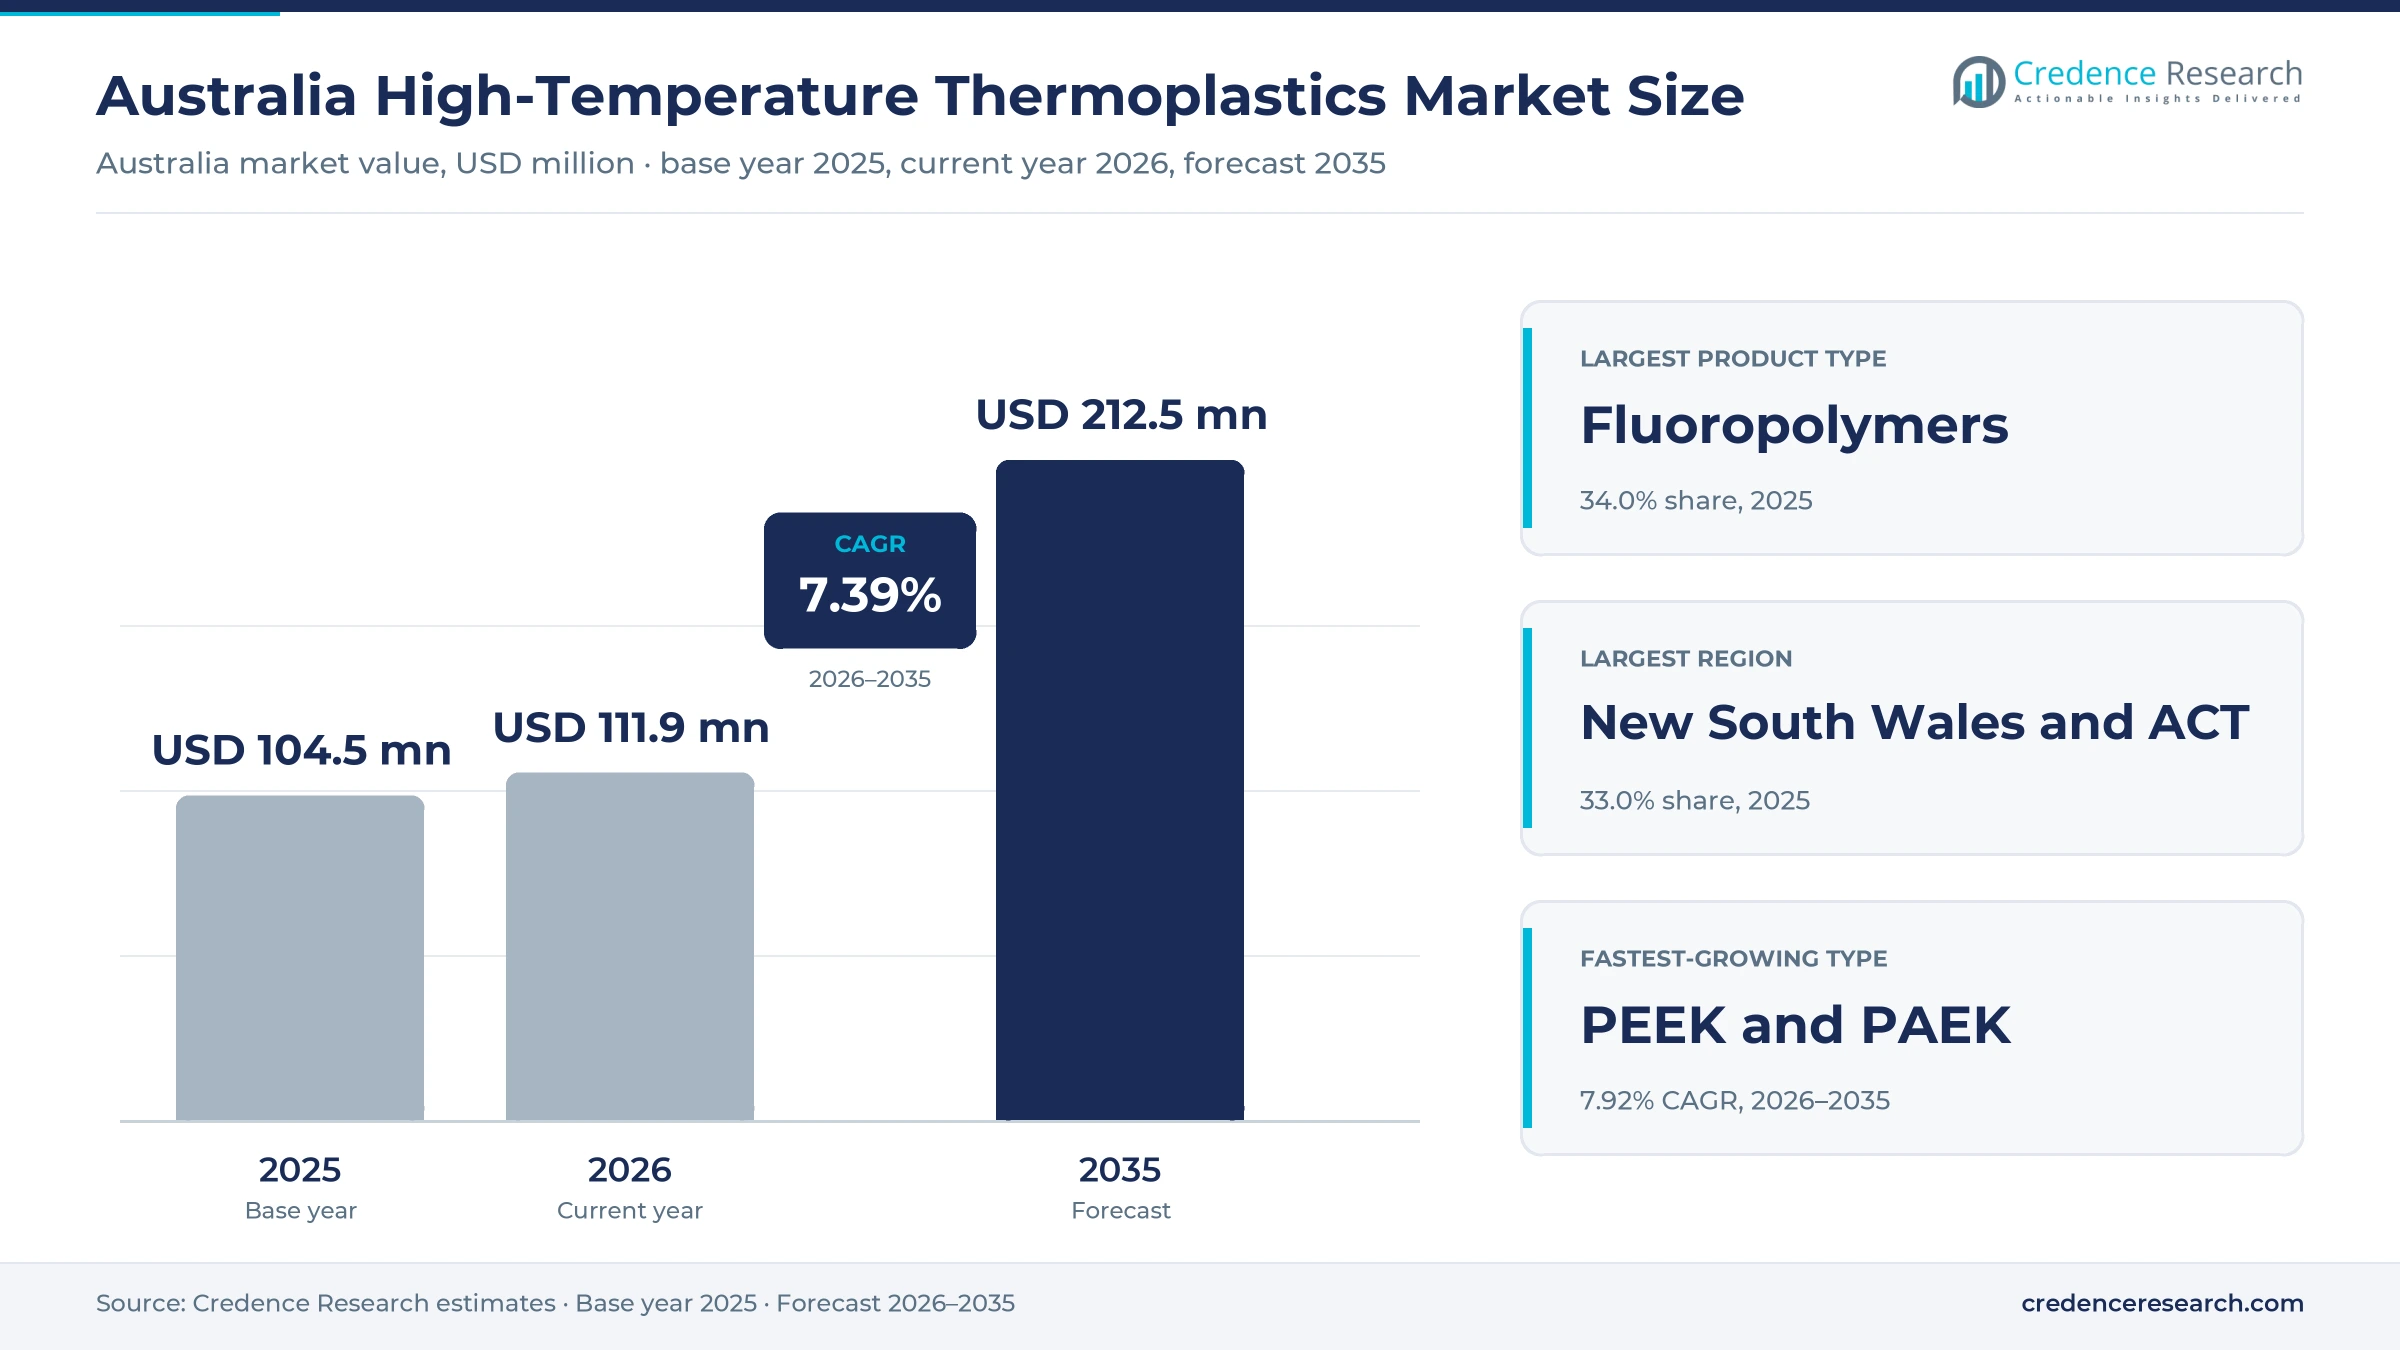
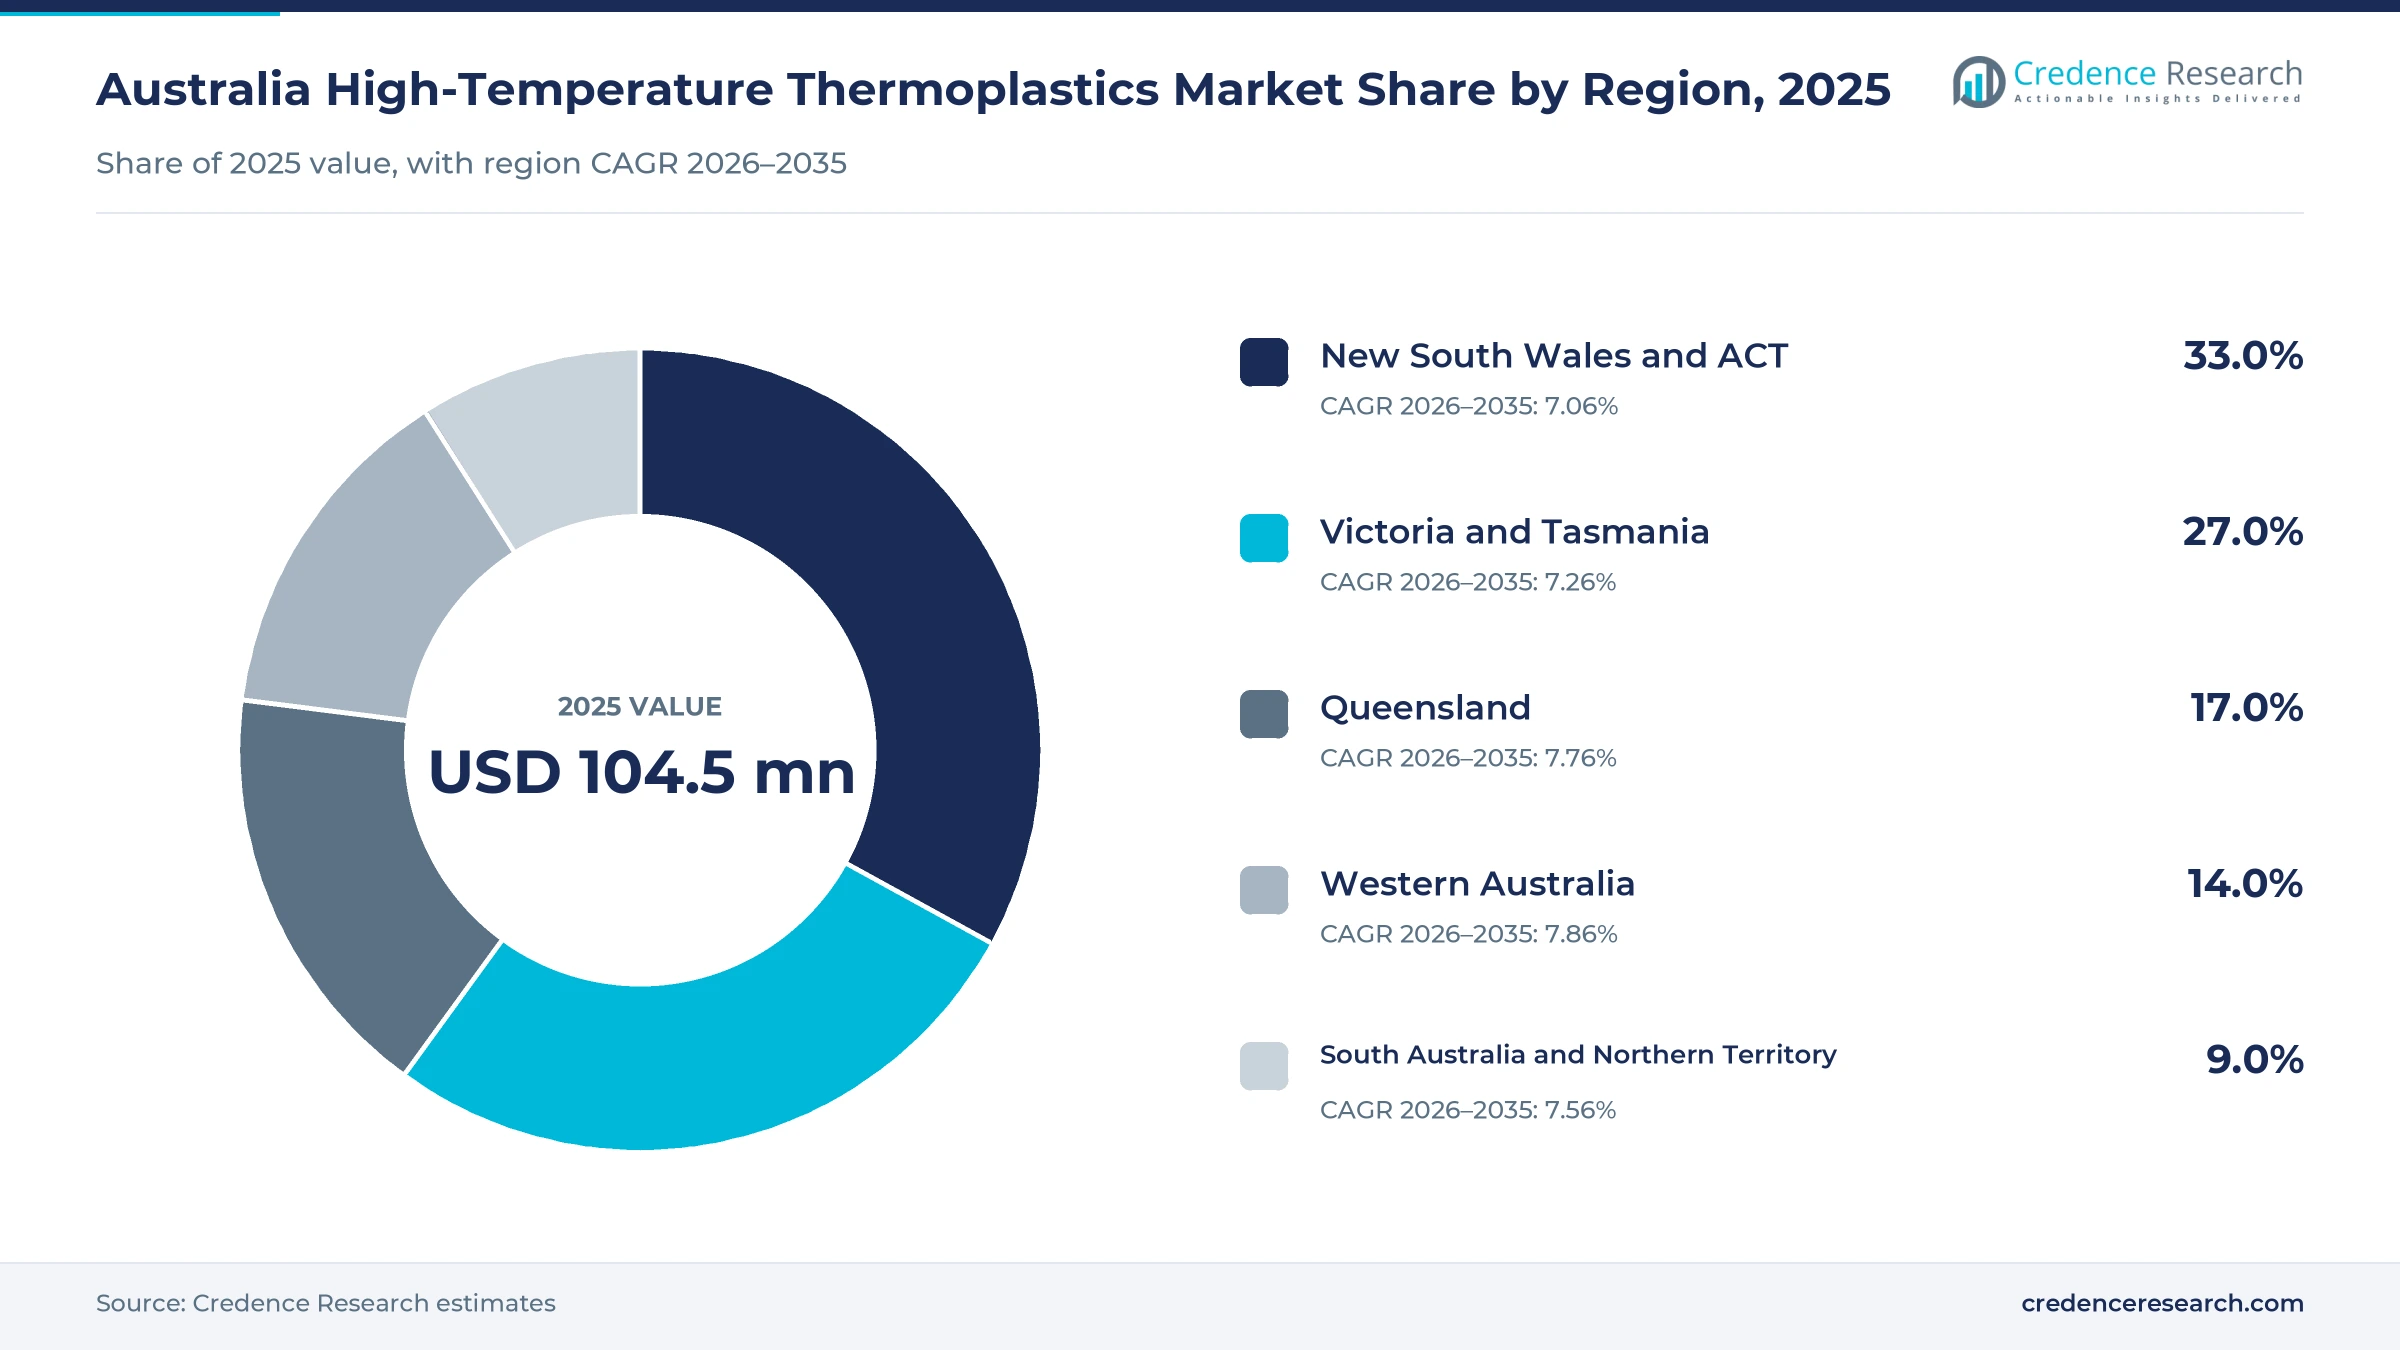
The Australia high-temperature thermoplastics market was valued at USD 104.5 million in 2025 and is projected to increase from USD 111.8 million in 2026 to USD 212.5 million by 2035, registering a CAGR of 7.39% during 2026–2035. Demand comes from mine operators, chemical plants, defense contractors, aircraft makers, medical device firms and electrical manufacturers that need polymer parts able to resist heat, chemicals, wear and sterilization. New South Wales and the Australian Capital Territory held the largest regional share, 33.0% in 2025, because defense buyers, medical makers and technical distributors cluster around Sydney and Canberra. Western Australia is the fastest-growing region at 7.86% a year, as mining and oil and gas operators replace seals, bearings and liners. In turn, new defense production sites and medical-grade printing are pushing buyers toward qualified, locally machined parts.
Which PEEK, PPS, PEI and PTFE parts are counted?
The estimate measures spending in Australia on PEEK and PAEK, PPS, fluoropolymers and PEI and specialty thermoplastics sold as resin, stock shapes, films and finished parts. It covers sealing, bearing, insulation, structural and medical uses in aerospace and defense, mining and chemical processing, medical devices and electrical and precision manufacturing. Values are stated in USD million at current prices and exclude goods and services tax.
The estimate excludes commodity plastics, engineering nylons and acetals, thermoset composites and machining labor billed separately from material. The value chain runs from overseas resin producers through technical distributors and fabricators that machine, mould, extrude or print parts to equipment makers, contract manufacturers, asset owners and research buyers.
Australia High-Temperature Thermoplastics Market Insights
- The Australia high-temperature thermoplastics market was valued at USD 104.5 million in 2025 and is projected to reach USD 212.5 million by 2035, at a 7.39% CAGR during 2026–2035.
- New South Wales and the ACT held a 33.0% share of 2025 value, as defense, medical and distributor activity clusters there.
- Mining and chemical processing led end uses with a 36.0% share of 2025 value, because seals, liners and bearings wear out in harsh duty.
- Boeing began construction of its 9,000 square meter MQ-28 production facility at Wellcamp in Queensland in March 2024.
- PEEK and PAEK grow fastest at 7.92% a year during 2026–2035, as defense, medical and oil and gas buyers specify them.
Fluoropolymers lead while PEEK and PAEK grow fastest
Why does PTFE-based sealing keep fluoropolymers ahead?
Based on product type, the market is categorized into PEEK and PAEK, PPS, fluoropolymers and PEI and specialty thermoplastics. Fluoropolymers led with a 34.0% share of 2025 value, because PTFE seals, gaskets and linings are standard in mines and chemical plants. PEEK and PAEK grow fastest at 7.92% a year, as defense, medical and oil and gas buyers move to stronger grades.
Why do mines and process plants buy most grades?
Based on end-use industry, the market is categorized into aerospace and defense, mining and chemical processing, medical devices and electrical and precision manufacturing. Mining and Chemical Processing led with a 36.0% share of 2025 value, because pumps, valves and conveyors need frequent seal and bearing renewal. Aerospace and defense grows fastest at 8.30% a year, as new plants ramp up.
Why do seals and pipe linings take the most polymer?
Based on application, the market is categorized into sealing and fluid handling, bearings and wear components, electrical insulation and structural and medical components. Sealing and Fluid Handling led with a 38.0% share of 2025 value, because chemical resistance matters most in pumps, valves and pipe linings. Structural and Medical Components grow fastest at 8.28% a year, as implants and aircraft parts use more PEEK.
Producers, distributors or fabricators?
Based on sales channel, the market is categorized into direct producer sales, technical distributor sales and integrated fabricator sales. Technical Distributor Sales led with a 45.0% share of 2025 value, because most Australian buyers order small lots of many grades through local stockists. Integrated Fabricator Sales grow fastest at 7.90% a year, as buyers want finished, machined parts from one supplier.
| Segment Group | Leading Sub-segment | Share, 2025 | Fastest-growing Sub-segment | CAGR, 2026–2035 |
|---|---|---|---|---|
| By Product Type | Fluoropolymers | 34.0% | PEEK and PAEK | 7.92% |
| By End-Use Industry | Mining and Chemical Processing | 36.0% | Aerospace and Defence | 8.30% |
| By Application | Sealing and Fluid Handling | 38.0% | Structural and Medical Components | 8.28% |
| By Sales Channel | Technical Distributor Sales | 45.0% | Integrated Fabricator Sales | 7.90% |
Request a Free Sample
Fill in your details and we'll send you a free sample report.
- Sample data tables & charts
- Research methodology
Defense programs, medical grades and harsh duty drive use
How does defense qualification and sustainment lift demand?
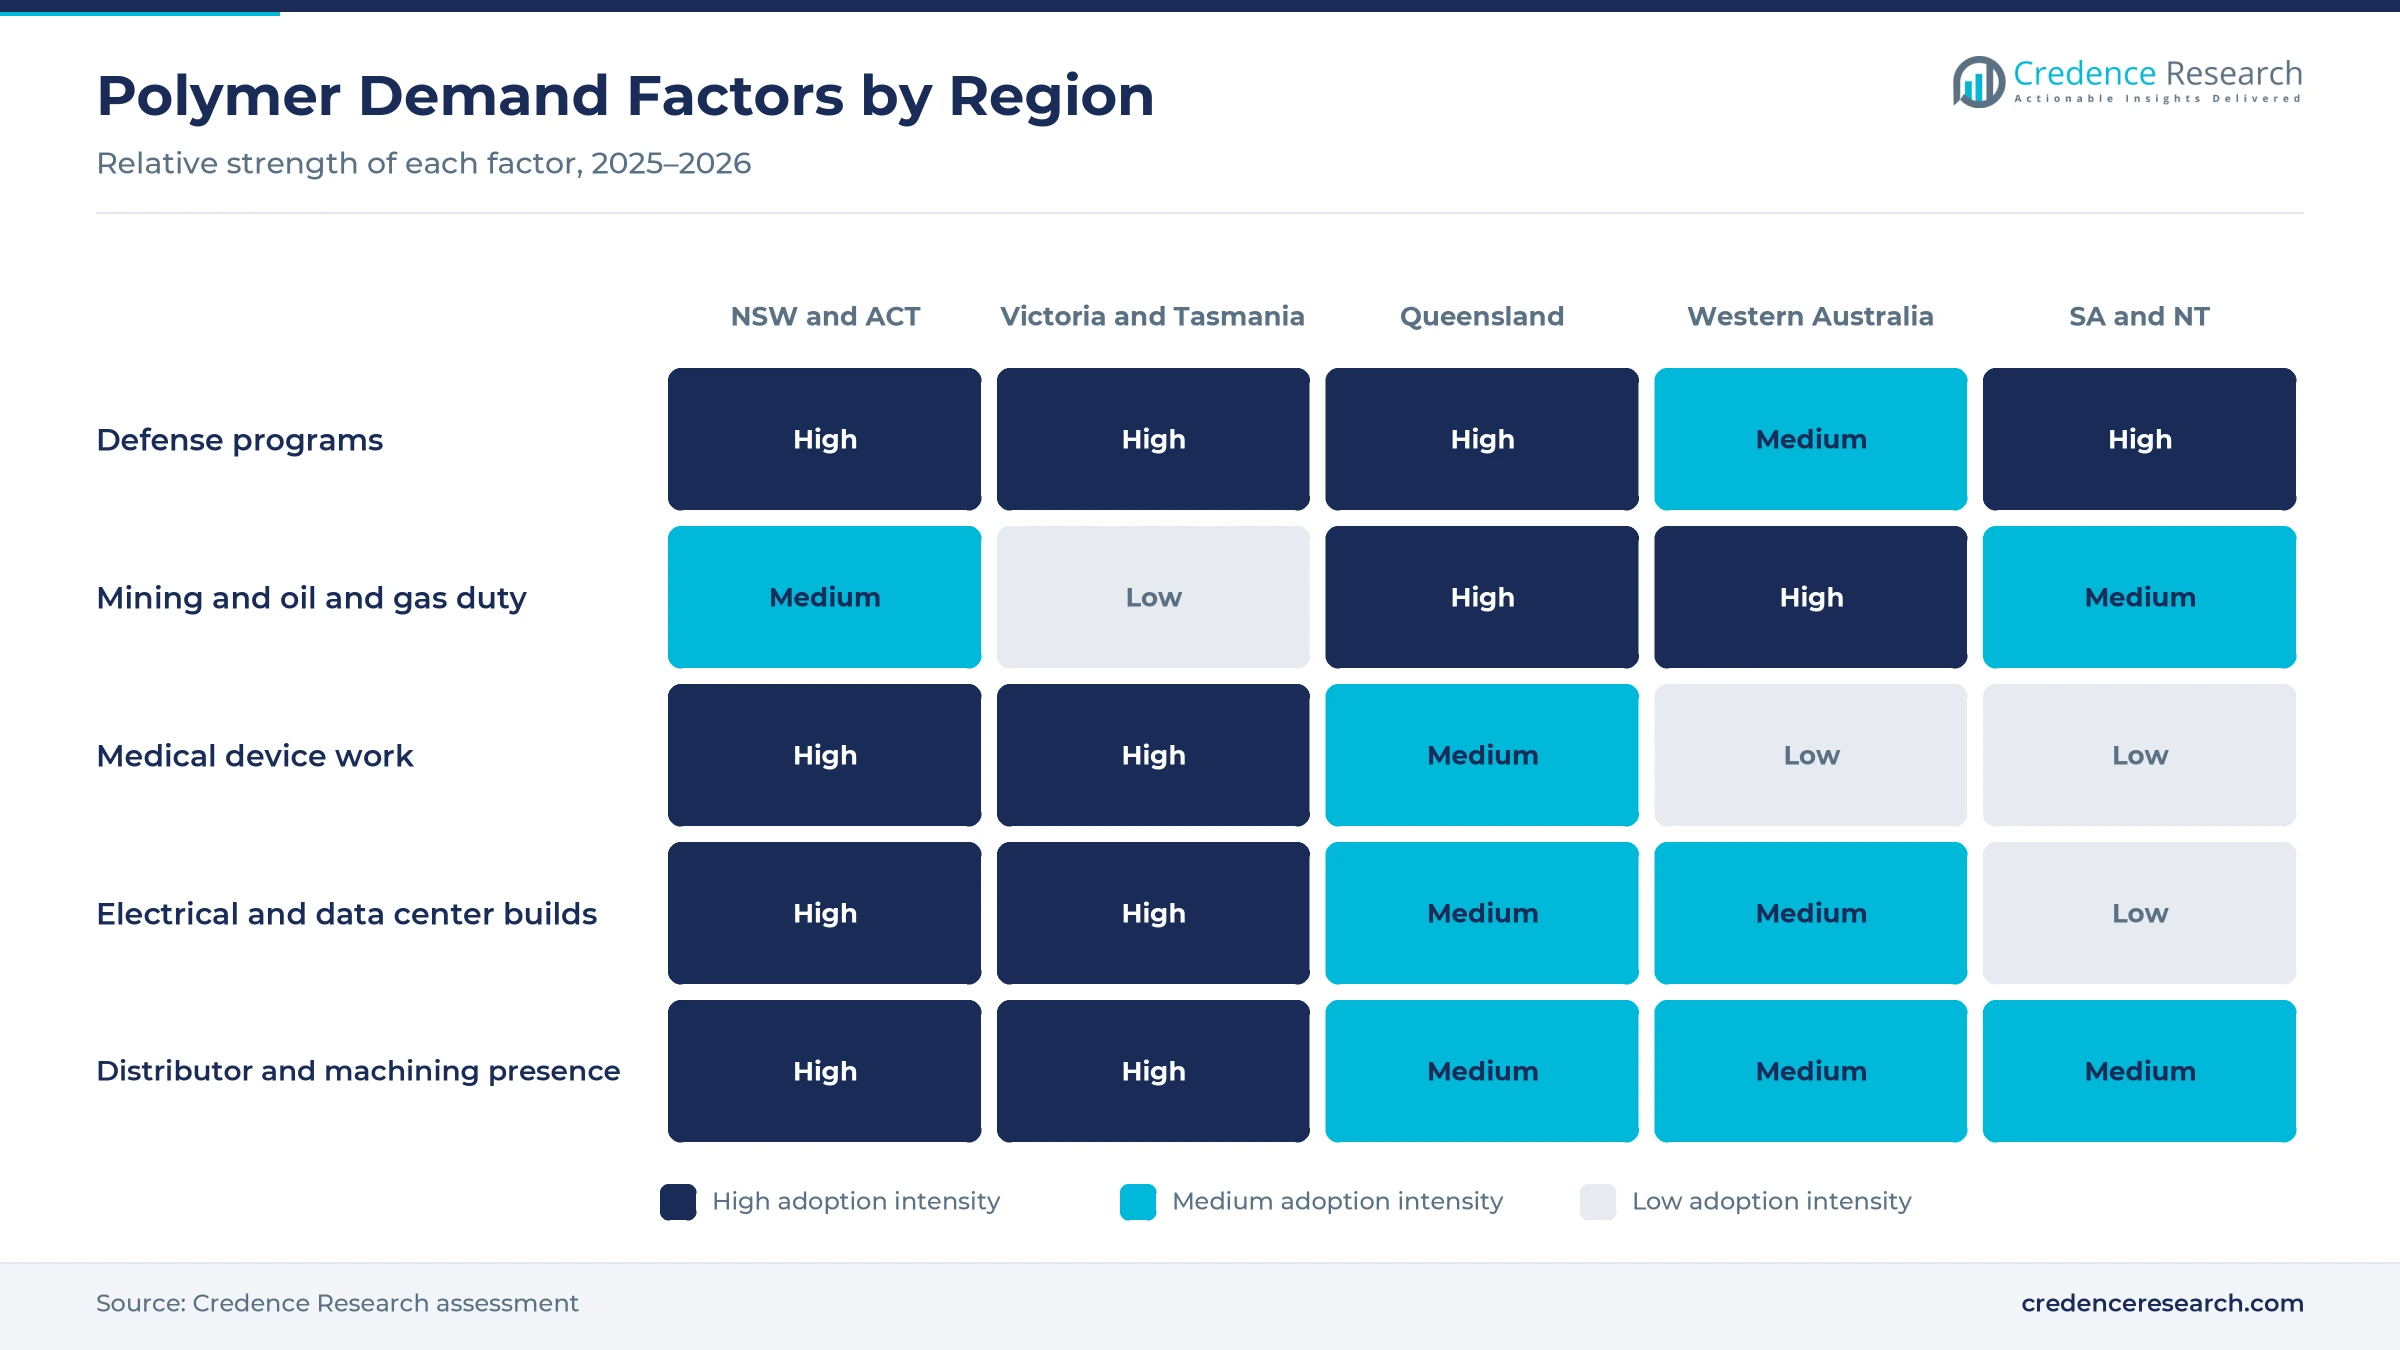
Defense qualification and sustainment lift demand, because aircraft, vehicles and ships need approved polymer seals, bushings, insulators and structural parts over long service lives. The government released its Defence Industry Development Strategy on Feb. 29, 2024, with 7 sovereign priorities including aircraft maintenance and naval shipbuilding, according to the defense industry minister. Boeing announced on March 26, 2024, that construction would begin on a 9,000 square meter MQ-28 facility at Wellcamp, according to the company. Hanwha Aerospace completed its Geelong vehicle plant on Aug. 27, 2024, where 129 Redback vehicles will be built. As a result, aerospace and defense grows fastest at 8.30% a year, alongside demand for aerospace composites.
Why does medical material qualification support growth?
Medical material qualification supports growth, because implant and instrument makers need polymers with documented biocompatibility, sterilization resistance and traceable processing. PEEK combines high-temperature performance, chemical resistance and fatigue resistance, and it tolerates gamma radiation and sterilization, according to a peer-reviewed review. Evonik launched VESTAKEEP i4 3DF in May 2020 as the first medical-grade PEEK filament for implants, meeting the ASTM F2026 implant standard. Chris O'Brien Lifehouse in Sydney installed an EOS PEEK printer in 2021, described as 1 of only 5 in the world and the first in a hospital. Consequently, structural and medical components grow fastest among applications at 8.28% a year, supported by medical device contract manufacturing.
How does harsh-environment duty sustain orders?
Harsh-environment duty sustains orders, because pumps, valves, chutes and conveyors in mines and processing plants wear through seals, liners and bearings on short cycles. Mineral exploration spending rose 3.9% to AUD 1,143 million in the June quarter 2026, seasonally adjusted, and was 17.9% higher than a year earlier, according to the Australian Bureau of Statistics. Petroleum exploration spending also rose 24.1% to AUD 584 million in that quarter. Victrex entered the Australian market at the Australian Oil and Gas exhibition in Perth, targeting oil and gas parts. In turn, mining and chemical processing lead end uses with a 36.0% share, as operators specify fluoropolymers and PEEK for wet, abrasive duty.
Why do local machining networks widen access?
Local machining networks widen access, because most buyers need finished parts quickly rather than bulk resin from overseas producers. Dotmar offers machining at eight locations in Australia and New Zealand and stocks PEEK, PTFE and Duratron PEI, PAI, PI and PBI grades, according to a mining industry profile. The company is an ISO 9001-accredited maker of semi-finished thermoplastics with more than 50 years of experience. BASF has been active in Australia for more than 100 years, and Evonik opened its first Australian sales office in 1956. As a result, integrated fabricator sales grow fastest at 7.90% a year, as stockists add CNC turning, milling and waterjet cutting.
Regional resin supply, printing and sustainment gain ground
How is the rise of Asian resin capacity changing supply?
The rise of Asian resin and compounding capacity is changing supply, because producers are building plants closer to Asia Pacific buyers instead of shipping every grade from Europe or North America. SABIC opened a USD 170 million ULTEM resin plant in Singapore, its first in the region, in November 2024. The company also aims to raise global ULTEM production by more than 50%. Syensqo completed a compounding expansion at its Changshu plant in China on May 26, 2025, covering Ryton PPS and other specialty polymers used in healthcare and electronics. Consequently, PEI and polyphenylene sulfide grades may reach Australian distributors with shorter lead times and more local stock.
Why is the shift to printed polymer parts rising?
The shift to printed polymer parts is rising, because hospitals, defense suppliers and mines want custom parts without tooling costs or long waits. Additive manufacturing methods include selective laser sintering and fused filament fabrication, according to the 2018 peer-reviewed review of 3D printed PEEK implants. Evonik's 2020 medical-grade PEEK filament comes in 250 gram and 500 gram spools for printers with PEEK capability. The Sydney hospital printer is 1 of only 5 such units worldwide and the first installed in a hospital. As a result, PEEK and PAEK grow fastest among products at 7.92% a year, as printing moves from trials toward patient-specific parts.
Can naval and land vehicle sustainment open new demand?
Naval and land vehicle sustainment open a clear opening, because ships and armored vehicles use polymer bearings, seals, insulators and liners that are replaced across long service lives. Dotmar lists the Arafura Class offshore patrol vessels, Collins Class submarines and the Land Combat Vehicle System among its defense projects. Hanwha's Geelong site covers about 150,000 square meters and includes 11 facilities. The 2024 strategy also names continuous naval shipbuilding and sustainment among 7 sovereign priorities. Consequently, suppliers with defense approvals can win long contracts in South Australia, Victoria and Western Australia, where shipyards and vehicle plants need repeat orders for bearings, seals and insulators.
Is there room to grow in data centers and energy?
Data centers and energy projects offer room to grow, because servers, switchgear and power equipment need insulation and connector parts that keep their properties at high temperature. Private new capital expenditure fell 3.6% in the June quarter 2026 but remained 10.7% higher than a year earlier, according to the Australian Bureau of Statistics. Buildings and structures investment rose 2.1% on data center construction and new renewable energy projects. Spending on information technology equipment had risen 199.6% in the previous quarter. As a result, electrical insulation keeps a steady share, while polyetherimide and PPS parts gain from switchboard, server and power equipment builds.
Imports, qualification and machining skills slow growth
Why do overseas resin plants stretch lead times?
Import dependence slows supply, because the main resin producers make PEEK, PPS, PEI and fluoropolymers overseas and ship them through distributors. As a result, lead times stretch when global demand rises or freight is disrupted. Small buyers also face minimum order quantities for special grades. Distributors respond by holding deeper stock of common grades, by sourcing special grades from regional plants in Asia and by agreeing annual supply volumes with major buyers.
Why do part approvals lock in incumbent suppliers?
Qualification cost limits new suppliers, because defense, aerospace and medical buyers need traceable material, certificates and audited processes before a part can be used. Medical implants also need grades that meet the ASTM F2026 standard for PEEK. Consequently, switching suppliers can take months of testing, audits and paperwork for each approved part. Larger distributors respond by sharing certified supply and documentation with smaller fabricators that lack their own quality teams.
When does PEEK pricing push buyers to nylon?
High material prices narrow use, because PEEK, PEI and fluoropolymer stock costs far more than nylon or acetal for the same part. In turn, buyers often choose cheaper plastics unless heat, chemicals or sterilization demand otherwise. Some maintenance projects therefore delay polymer upgrades until a failure forces a change. Suppliers respond with life-cycle cost studies that show fewer shutdowns, longer part life and lower total cost in harsh duty.
Can workshops find staff to machine PEEK and PEI?
Machining skills shortages can hold back fabricators, because high-heat polymers need careful cutting speeds, annealing and inspection to avoid stress cracks. Medical and aerospace parts also need clean handling and records. As a result, some workshops turn away complex jobs or extend delivery dates. Fabricators respond with CNC automation, apprentice training and partnerships with distributors that machine and inspect parts in-house before delivery.
Sydney and Canberra buyers lead while the west gains fastest
| Region | Value, 2025 (USD million) | Share, 2025 | CAGR, 2026–2035 |
|---|---|---|---|
| New South Wales and ACT | 34.5 | 33.0% | 7.06% |
| Victoria and Tasmania | 28.2 | 27.0% | 7.26% |
| Queensland | 17.8 | 17.0% | 7.76% |
| Western Australia | 14.6 | 14.0% | 7.86% |
| South Australia and Northern Territory | 9.4 | 9.0% | 7.56% |
Defense and medical buyers keep New South Wales ahead
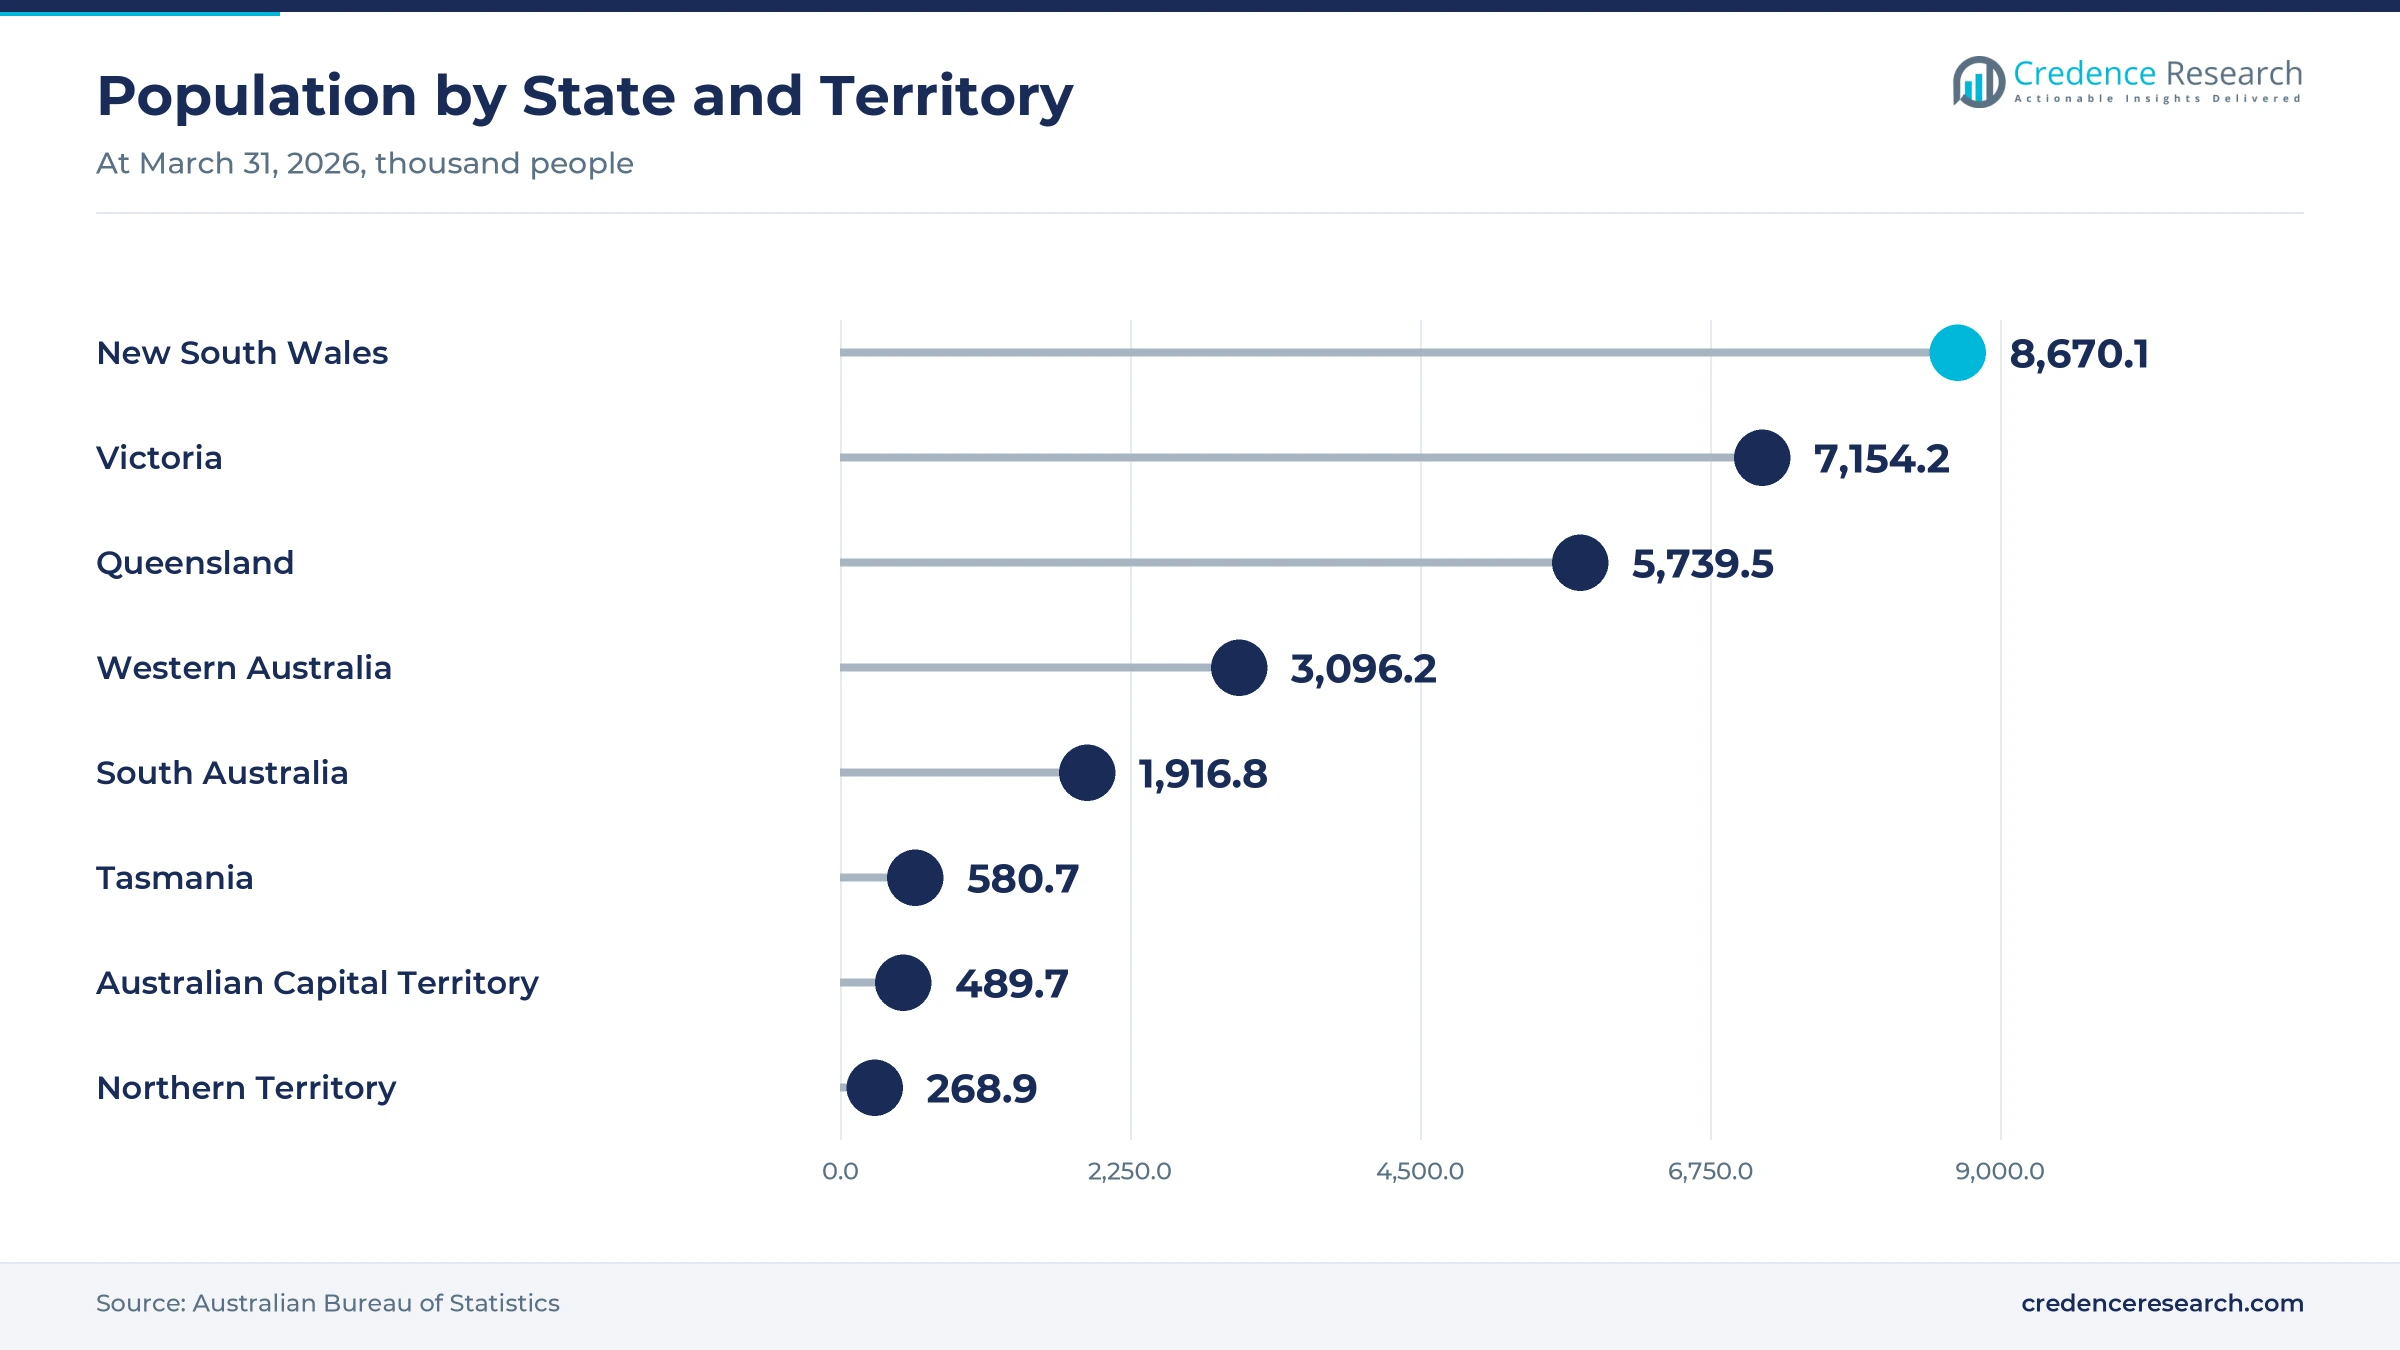
New South Wales and the ACT held a 33.0% share of 2025 value and grow at 7.06% a year. The two jurisdictions had about 9.16 million residents at March 31, 2026, according to the Australian Bureau of Statistics. Chris O'Brien Lifehouse in Sydney runs an EOS PEEK printer, while Canberra hosts defense buyers and program offices. As a result, the region keeps the largest share of medical, defense and distributor sales, supported by dense manufacturing around Sydney.
Geelong vehicle builds anchor Victoria and Tasmania
Victoria and Tasmania held a 27.0% share of 2025 value and grow at 7.26% a year. Hanwha's Geelong plant will build 129 Redback vehicles, while BASF runs an aerospace and surface treatment site at Bayswater. Evonik also runs its Australian sales office from Mount Waverley near Melbourne. Consequently, demand here comes from defense vehicles, food and chemical manufacturing and medical device work across the Melbourne region.
Why does Queensland add aerospace demand?
Queensland held a 17.0% share of 2025 value and grows at 7.76% a year. Boeing's 9,000 square meter MQ-28 facility at Wellcamp is its first final assembly site outside North America. The state population also rose 1.6% to 5,739,500 in the year to March 2026. In turn, aircraft production and mining in central and north Queensland add orders for seals, bearings and insulators, while Brisbane distributors serve both markets.
Pilbara mines and offshore gas lift Western Australia
Western Australia held a 14.0% share of 2025 value and grows fastest at 7.86% a year. The state had the fastest population growth at 2.1% in the year to March 2026. As a result, mine and oil and gas operators in Perth and the Pilbara lift demand fastest.
How do shipyards shape South Australia and the NT?
South Australia and the Northern Territory held a 9.0% share of 2025 value and grow at 7.56% a year. Dotmar lists an office in Regency Park, near the Adelaide shipyards. Consequently, naval sustainment, defense manufacturing and mining add steady demand for machined polymer parts here.
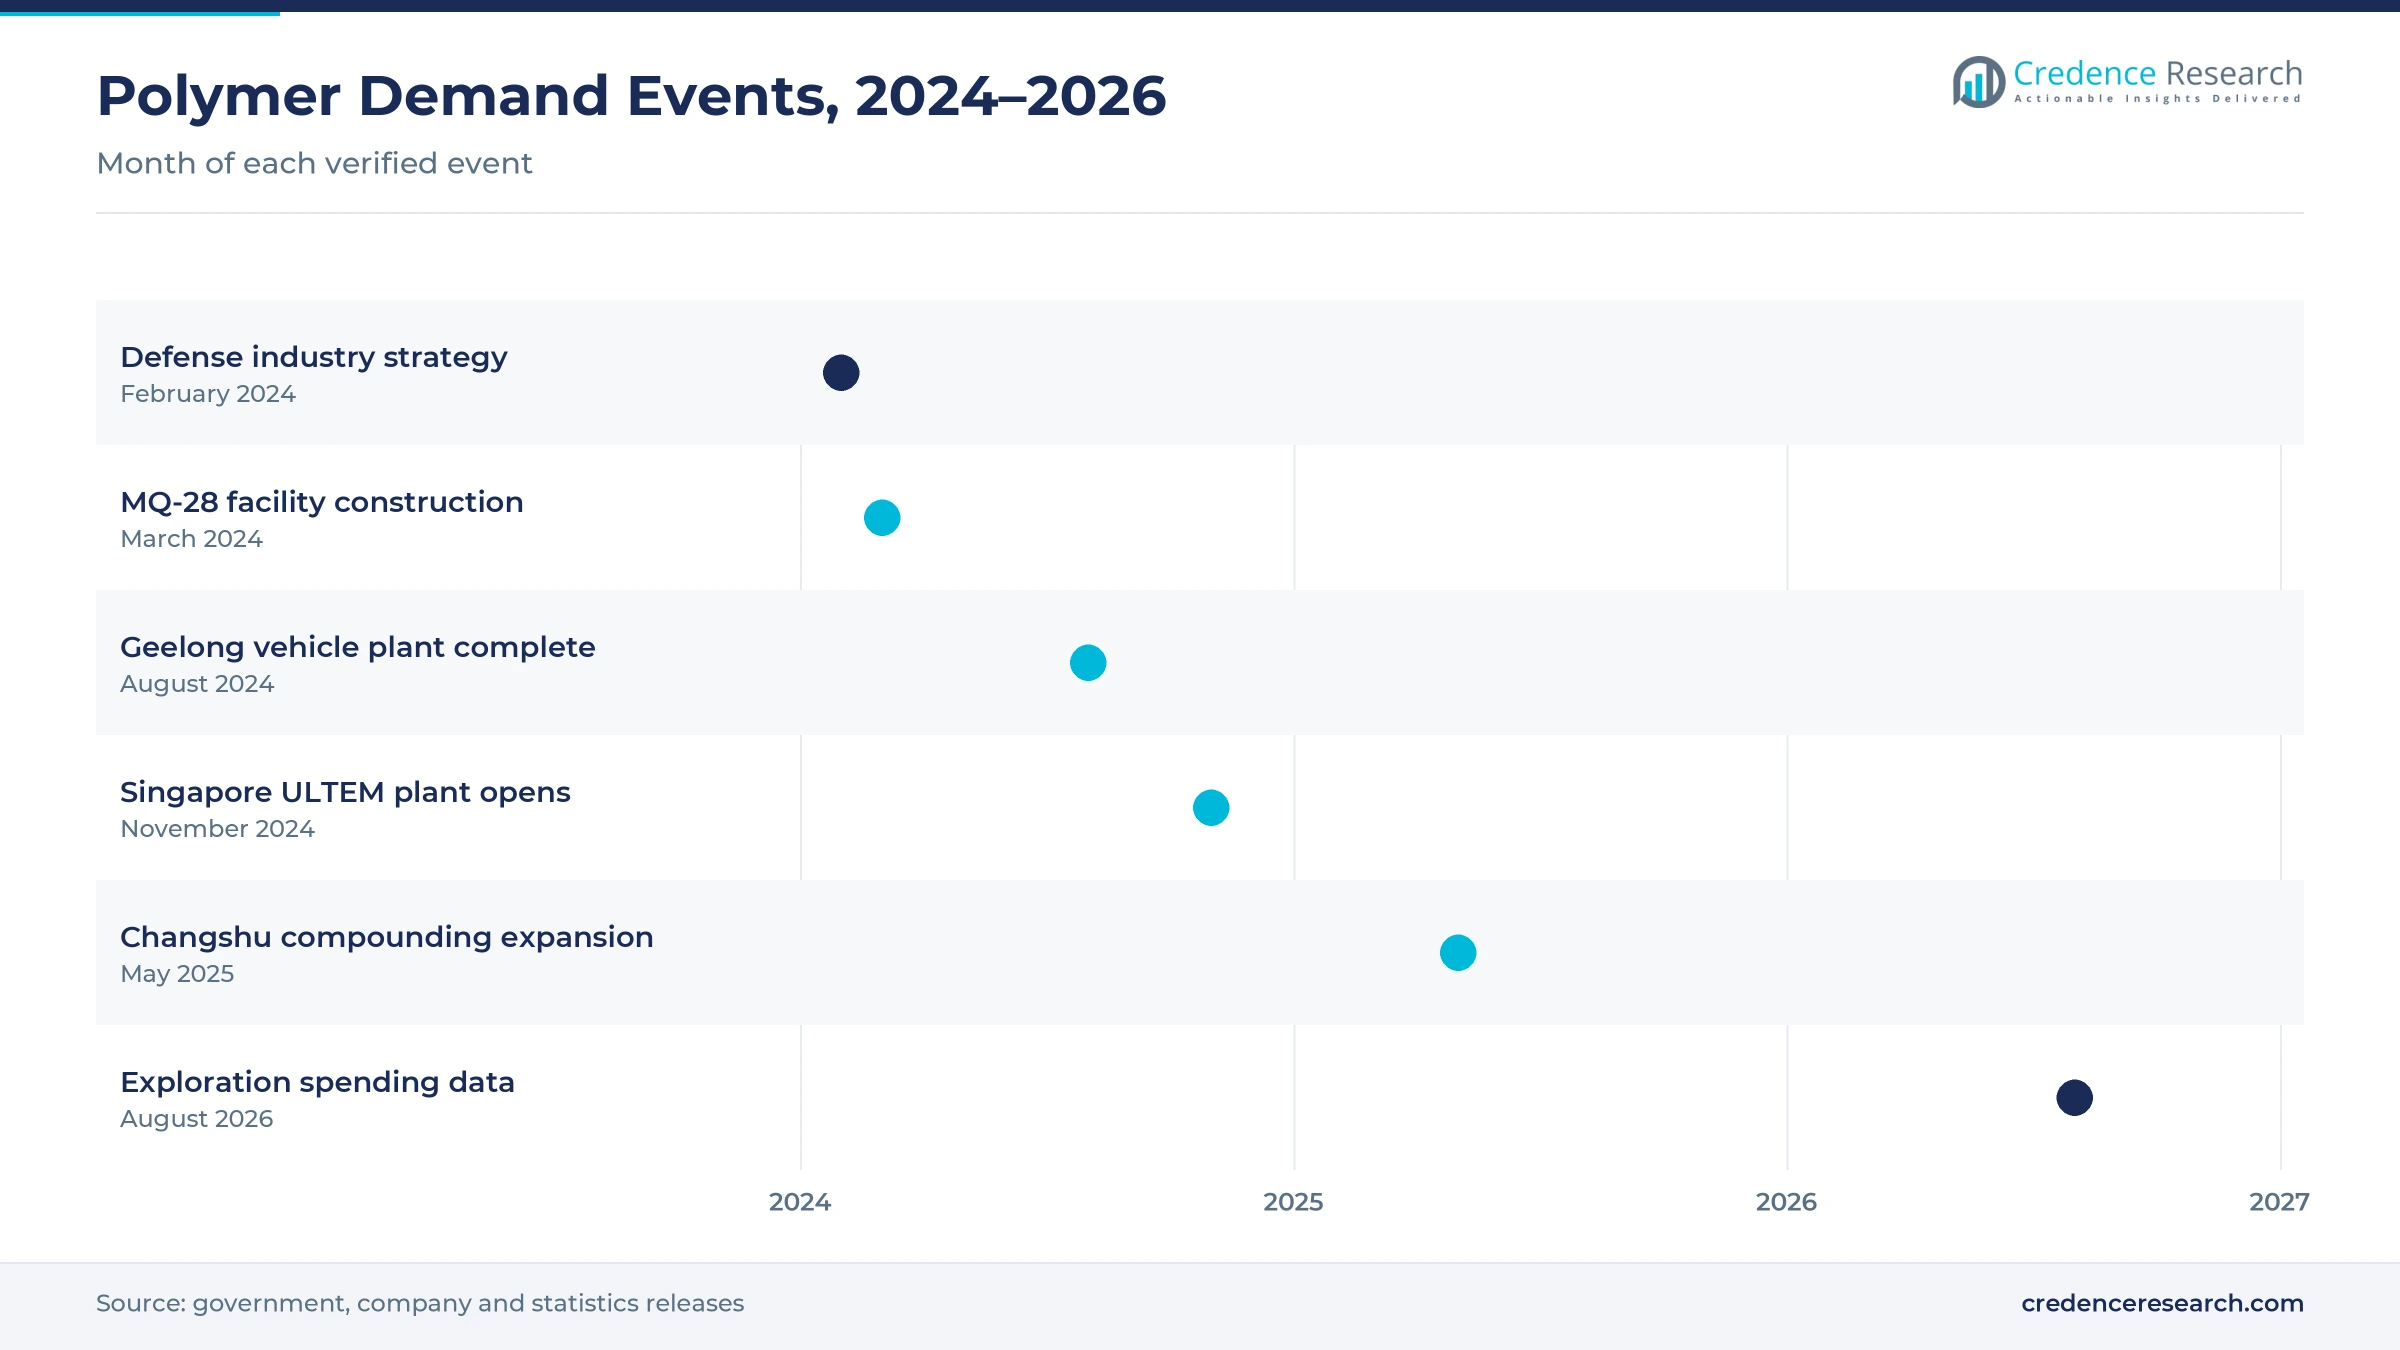
Defense plants, resin capacity and exploration, 2024–2026
| Development | Status and market relevance |
|---|---|
| In March 2024, Boeing announced construction of a 9,000 square meter MQ-28 production facility at Wellcamp, Queensland. | Adds aerospace polymer demand |
| In August 2024, Hanwha Aerospace announced completion of its armored vehicle plant in Geelong for 129 Redback vehicles. | Creates vehicle component demand |
| In May 2025, Syensqo announced completion of a compounding expansion at its Changshu plant, including Ryton PPS lines. | Adds regional PPS compounding |
| In August 2026, the Australian Bureau of Statistics reported that mineral exploration spending rose 3.9% to AUD 1,143 million in the June quarter 2026. | Signals steady mining wear-part demand |
| In August 2026, the Australian Bureau of Statistics reported that private capital expenditure stayed 10.7% higher than a year earlier in the June quarter 2026. | Supports data center and energy builds |
Machining, moulding and printing shape polymer parts
- Machining turns PEEK, PEI and PTFE rod and plate into seals, bushings and medical parts, and still handles most local volume.
- Injection moulding produces repeat parts such as connectors and insulators at lower unit cost once tooling is paid off.
- Extrusion makes rod, tube, film and pipe linings that fabricators cut and finish for chemical and electrical uses.
- Additive manufacturing prints PEEK parts by laser sintering or filament fabrication, which suits implants and low-volume spares.
Need a Custom Version of This Report?
Tailor the scope, geography, or segments to your exact requirements.
- Custom geography or segment scope
- Direct access to our analyst team
Resin makers and distributors compete on grades and speed
Competition combines overseas resin producers with Australian distributors and fabricators that hold stock and machine parts. Victrex entered the Australian market through the oil and gas sector and supplies PEEK polymer, coatings and films. BASF has been active in Australia for more than 100 years and runs an aerospace and surface treatment site at Bayswater. Evonik has sold in Australia since 1956 from an office near Melbourne and offers medical-grade PEEK. Dotmar machines PEEK, PTFE and PEI at eight locations in Australia and New Zealand and supplies defense projects. SABIC and Syensqo supply the region from Asian plants, although their direct Australian activity was not verified for this report. Companies compete on grade range, approvals, stock depth, machining services and delivery speed.
Companies profiled and their roles in this market
| Company | Type | Role in the market |
|---|---|---|
| Victrex | Resin producer | PEEK polymer, coatings and films; entered Australia via oil and gas |
| BASF | Chemical producer | Active for more than 100 years; Bayswater aerospace site |
| Evonik | Specialty chemical producer | Sales office near Melbourne since 1956; medical PEEK |
| Dotmar Engineering Plastics | Distributor and fabricator | PEEK, PTFE and PEI machining at eight locations |
Credence Research sees defense and medical setting pace
Credence Research's view is that Australian demand for high-temperature thermoplastics will grow steadily through 2035, as defense production, medical printing and harsh-duty mining keep specifying stronger polymers. Fluoropolymers should keep the largest product share, while PEEK and PAEK gain most. New South Wales and the ACT will remain the largest region, although Western Australia adds demand fastest. However, import dependence and qualification costs will reward suppliers with local stock, approvals and machining capacity, especially those able to support defense and medical buyers with traceable, certified parts.
Component demand and polymer intensity anchor the model
The report uses 2025 as the base year, with values in USD million at current prices. Market values come from the Credence Research model, which combines component demand, polymer intensity, defense and mining activity and price tiers. The five regional zones, their shares and growth, and segment splits by product type, end-use industry, application and sales channel are Credence Research estimates built from public statistics. Sources used are official statistics, government releases, company pages, peer-reviewed literature and news reports, and no interviews or surveys were used.
Defense, mining and medical work shape demand to 2035
The market is expected to reach USD 212.5 million by 2035, a 7.39% CAGR during 2026–2035, as defense production, medical printing and harsh-duty mining keep demand rising. Spending is projected to rise from USD 111.8 million in 2026 as new defense plants move into production. Growth should be strongest in PEEK and PAEK, aerospace and defense and Western Australia, while New South Wales and the ACT keep the largest share. In contrast, import delays, qualification costs and machining skills shortages could slow orders in some years.
Frequently Asked Questions
How big is the Australia high-temperature thermoplastics market?
Which region leads demand?
Which region grows fastest?
Which product type holds the largest share?
Which product type grows fastest?
How does defense work affect demand?
Who are the leading companies in this market?
What are the main risks to growth?
Table of Content
Chapter 1 Market Segmentation
- 1.1 Segmentation Framework
- 1.1.1 Product and Service Classification
- 1.1.2 Application and End-Use Classification
- 1.1.3 Technology and Solution Classification
- 1.1.4 Customer and Distribution Channel Classification
- 1.1.5 Geographic Segmentation
- 1.1.6 Market Segment Definitions and Boundaries
- 1.2 By Product Type
- 1.2.1 PEEK and PAEK
- 1.2.2 PPS
- 1.2.3 Fluoropolymers
- 1.2.4 PEI and Specialty Thermoplastics
- 1.3 By End-Use Industry
- 1.3.1 Aerospace and Defence
- 1.3.2 Mining and Chemical Processing
- 1.3.3 Medical Devices
- 1.3.4 Electrical and Precision Manufacturing
- 1.4 By Application
- 1.4.1 Sealing and Fluid Handling
- 1.4.2 Bearings and Wear Components
- 1.4.3 Electrical Insulation
- 1.4.4 Structural and Medical Components
- 1.5 By Sales Channel
- 1.5.1 Direct Producer Sales
- 1.5.2 Technical Distributor Sales
- 1.5.3 Integrated Fabricator Sales
Chapter 2 Introduction
- 2.1 Report Objectives and Scope
- 2.2 Product Definition and Industry Terminology
- 2.3 Market Inclusions and Exclusions
- 2.4 Research Process
- 2.4.1 Primary Research and Expert Interviews
- 2.4.2 Secondary Research and Source Review
- 2.4.3 Top-Down and Bottom-Up Estimation
- 2.4.4 Data Triangulation and Verification
- 2.5 Market Size Measurement Basis
- 2.5.1 2025: USD 104.5 million → 2035: USD 212.5 million
- 2.6 Historical and Forecast Reference Periods
- 2.6.1 Historical Period: 2018-2025
- 2.6.2 Base Year: 2025
- 2.6.3 Forecast Period: 2025-2035
- 2.7 Research Assumptions and Limitations
Chapter 3 Executive Summary
- 3.1 Market Snapshot and Key Findings
- 3.2 Base-Year Market Size, 2025
- 3.3 Forecast Market Size, 2035
- 3.4 Revenue and Volume Growth Outlook
- 3.5 Key Demand and Supply Indicators
- 3.6 Leading Market Segments
- 3.7 Fastest-Growing Market Opportunities
- 3.8 Regional Performance Highlights
- 3.9 Technology and Industry Transformation
- 3.10 Competitive Landscape Summary
- 3.11 Analyst View and Strategic Implications
Chapter 4 Australia High-Temperature Thermoplastics Market Trends and Developments
- 4.1 Historical Industry Development, 2018-2025
- 4.2 Recent Market Trends and Developments
- 4.3 Demand and Customer Behavior Trends
- 4.4 Technology and Product Innovation
- 4.5 Artificial Intelligence, Automation and Digitalization
- 4.6 Local Manufacturing and Supply Chain Realignment
- 4.7 Industry Partnerships, Mergers and Acquisitions
- 4.8 Sustainability and Circular Economy Developments
- 4.9 Government and Private Sector Investment Trends
- 4.10 Emerging Business Models and Commercialization
- 4.11 Industry Developments and Announcements
Chapter 5 Australia High-Temperature Thermoplastics Market Production, Supply and Demand Analysis
- 5.1 Demand Trend and Consumption Analysis, 2018-2025
- 5.2 Demand Forecast, 2025-2035
- 5.3 Production and Output Trend, 2018-2025
- 5.4 Production and Output Forecast, 2025-2035
- 5.5 Installed Capacity and Capacity Utilization
- 5.6 Company-Wise Production Plants and Statistics
- 5.6.1 Installed Production Capacity
- 5.6.2 Actual Production
- 5.6.3 Planned Capacity and Expansion Targets
- 5.7 Supply Chain Structure and Procurement Trends
- 5.8 Supply-Demand Gap and Bottlenecks
- 5.9 Import Dependence and Sourcing Structure
- 5.10 Contract Manufacturing and Outsourcing
- 5.11 Regional Supply and Demand Concentration
Chapter 6 Australia High-Temperature Thermoplastics Market Pricing Analysis
- 6.1 Pricing Structure and Measurement
- 6.2 Historical Pricing Trends, 2018-2025
- 6.3 Pricing Outlook, 2025-2035
- 6.4 Average Selling Price and Unit Economics
- 6.5 Pricing by Product and Market Segment
- 6.6 Geographic Pricing Differences
- 6.7 Key Input, Energy, Labor and Logistics Costs
- 6.8 Contract Pricing and Purchasing Models
- 6.9 Pricing Sensitivity and Competitive Positioning
- 6.10 Price, Margin and Profitability Implications
Chapter 7 Australia High-Temperature Thermoplastics Market Dynamics
- 7.1 Market Growth Drivers
- 7.1.1 Demand-Side Drivers
- 7.1.2 Technology and Innovation Drivers
- 7.1.3 Infrastructure and Investment Drivers
- 7.1.4 Regulatory and Policy Drivers
- 7.2 Market Restraints
- 7.2.1 Cost and Affordability Constraints
- 7.2.2 Technology and Adoption Barriers
- 7.2.3 Supply Chain and Operational Constraints
- 7.3 Market Challenges
- 7.3.1 Competitive Pressure and Margin Erosion
- 7.3.2 Skills, Infrastructure and Implementation Gaps
- 7.4 Emerging Market Opportunities
- 7.5 Market Dynamics Impact and Time-Horizon Assessment
Chapter 8 Australia High-Temperature Thermoplastics Value Chain Analysis
- 8.1 Industry Value Chain Overview
- 8.2 Upstream Suppliers and Critical Inputs
- 8.3 Technology and Component Providers
- 8.4 Manufacturing or Service Delivery
- 8.5 Distribution, Channel Partners and Integrators
- 8.6 Downstream Applications and End Users
- 8.7 Value Addition and Profit Pools
- 8.8 Vertical Integration and Outsourcing
- 8.9 Supplier Concentration and Risk
- 8.10 Supply Chain Localization and Resilience
Chapter 9 Australia High-Temperature Thermoplastics Market Regulations and Policies
- 9.1 Relevant Laws, Standards and Compliance Frameworks
- 9.2 Product, Service, Safety and Quality Requirements
- 9.3 Government Policies, Incentives and Subsidies
- 9.4 Imports, Exports and Trade Barriers
- 9.5 Public Procurement and Local Content Requirements
- 9.6 Environmental and Sustainability Compliance
- 9.7 Upcoming Policy Changes and Market Implications
Chapter 10 Australia High-Temperature Thermoplastics Market Hotspots and Opportunities
- 10.1 Market Opportunity Mapping and Growth Hotspots
- 10.2 High-Growth Applications and Customer Groups
- 10.3 Underserved Markets and White-Space Opportunities
- 10.4 Emerging Technology and Product Opportunities
- 10.5 New Capacity and Investment Hotspots
- 10.6 Market Entry and Expansion Opportunities
- 10.7 Distribution and Partnership Opportunities
- 10.8 Near-Term and Long-Term Commercial Potential
- 10.9 Opportunity Attractiveness and Execution Risks
Chapter 11 Australia High-Temperature Thermoplastics Market Outlook, 2025-2035
- 11.1 Market Size and Analysis
- 11.1.1 Revenue (Market Measurement: 2025: USD 104.5 million → 2035: USD 212.5 million)
- 11.1.2 Market Volume and Quantity Sold
- 11.1.3 Historical Market Size, 2018-2025
- 11.1.4 Base-Year Market Size, 2025
- 11.2 Market Forecast, 2025-2035
- 11.2.1 Revenue Forecast to 2035
- 11.2.2 Volume Forecast to 2035
- 11.2.3 CAGR and Year-on-Year Growth
- 11.2.4 Incremental Revenue Opportunity
- 11.3 Forecast Assumptions and Scenario Analysis
- 11.3.1 Base-Case Forecast
- 11.3.2 Optimistic and Conservative Scenarios
- 11.3.3 Technology, Pricing and Policy Sensitivities
- 11.4 Market Attractiveness and Growth Outlook
Chapter 12 Australia High-Temperature Thermoplastics Market Segmentation and Outlook
- 12.1 Segmentation Summary and Market Shares, 2025
- 12.2 Largest and Fastest-Growing Segments
- 12.3 By Product Type - Market Size and Forecast, 2025-2035
- 12.3.1 Segment Definition and Scope
- 12.3.2 Historical Market Size, 2018-2025
- 12.3.3 Revenue Forecast, 2025-2035
- 12.3.4 Volume Forecast, 2025-2035
- 12.3.5 Base-Year Market Share, 2025
- 12.3.6 Segment CAGR and Growth Drivers
- 12.3.7 Subsegment Market Size and Forecast
- 12.3.7.1 PEEK and PAEK
- 12.3.7.2 PPS
- 12.3.7.3 Fluoropolymers
- 12.3.7.4 PEI and Specialty Thermoplastics
- 12.3.8 Subsegment Pricing and Adoption Trends
- 12.3.9 Leading Suppliers and Competition
- 12.3.10 Regional Demand and Opportunities
- 12.4 By End-Use Industry - Market Size and Forecast, 2025-2035
- 12.4.1 Segment Definition and Scope
- 12.4.2 Historical Market Size, 2018-2025
- 12.4.3 Revenue Forecast, 2025-2035
- 12.4.4 Volume Forecast, 2025-2035
- 12.4.5 Base-Year Market Share, 2025
- 12.4.6 Segment CAGR and Growth Drivers
- 12.4.7 Subsegment Market Size and Forecast
- 12.4.7.1 Aerospace and Defence
- 12.4.7.2 Mining and Chemical Processing
- 12.4.7.3 Medical Devices
- 12.4.7.4 Electrical and Precision Manufacturing
- 12.4.8 Subsegment Pricing and Adoption Trends
- 12.4.9 Leading Suppliers and Competition
- 12.4.10 Regional Demand and Opportunities
- 12.5 By Application - Market Size and Forecast, 2025-2035
- 12.5.1 Segment Definition and Scope
- 12.5.2 Historical Market Size, 2018-2025
- 12.5.3 Revenue Forecast, 2025-2035
- 12.5.4 Volume Forecast, 2025-2035
- 12.5.5 Base-Year Market Share, 2025
- 12.5.6 Segment CAGR and Growth Drivers
- 12.5.7 Subsegment Market Size and Forecast
- 12.5.7.1 Sealing and Fluid Handling
- 12.5.7.2 Bearings and Wear Components
- 12.5.7.3 Electrical Insulation
- 12.5.7.4 Structural and Medical Components
- 12.5.8 Subsegment Pricing and Adoption Trends
- 12.5.9 Leading Suppliers and Competition
- 12.5.10 Regional Demand and Opportunities
- 12.6 By Sales Channel - Market Size and Forecast, 2025-2035
- 12.6.1 Segment Definition and Scope
- 12.6.2 Historical Market Size, 2018-2025
- 12.6.3 Revenue Forecast, 2025-2035
- 12.6.4 Volume Forecast, 2025-2035
- 12.6.5 Base-Year Market Share, 2025
- 12.6.6 Segment CAGR and Growth Drivers
- 12.6.7 Subsegment Market Size and Forecast
- 12.6.7.1 Direct Producer Sales
- 12.6.7.2 Technical Distributor Sales
- 12.6.7.3 Integrated Fabricator Sales
- 12.6.8 Subsegment Pricing and Adoption Trends
- 12.6.9 Leading Suppliers and Competition
- 12.6.10 Regional Demand and Opportunities
- 12.7 Segment Growth Comparison
- 12.8 Segment Attractiveness and Priority Matrix
Chapter 13 Australia High-Temperature Thermoplastics End-Use and Application Market Outlook
- 13.1 End-Use Industry and Customer Demand Structure
- 13.2 Leading Applications and Customer Groups
- 13.3 End-Use Market Size, Share and Forecast
- 13.4 Major End-Use Industry Deep Dives
- 13.4.1 Customer Requirements and Use Cases
- 13.4.2 Demand and Replacement Cycles
- 13.4.3 Technical and Regulatory Considerations
- 13.4.4 Purchasing and Procurement Models
- 13.4.5 Leading Vendors and Distribution Channels
- 13.4.6 Forecast and Commercial Opportunities
- 13.5 Emerging Applications and Cross-Segment Demand
- 13.6 End-Use Industry Investment Priorities
Chapter 14 Australia High-Temperature Thermoplastics Geographic Market Outlook, 2025-2035
- 14.1 Domestic Market Distribution and Demand Clusters
- 14.2 State- or Province-Wise Market Size and Forecast, 2025-2035
- 14.3 City and Metropolitan Market Outlook
- 14.4 Industrial, Manufacturing and Commercial Clusters
- 14.5 Geographic Concentration of Key End Users
- 14.6 Local Pricing and Purchasing Differences
- 14.7 Domestic Production Facilities and Capacity Map
- 14.8 Local Infrastructure and Project Pipeline
- 14.9 State-Level Policy and Incentive Differences
- 14.10 Subnational Investment Hotspots and Opportunities
- 14.11 Distribution and Logistics Networks
- 14.12 Domestic Competitive Footprint
Chapter 15 Australia High-Temperature Thermoplastics Technology, Innovation and Sustainability Outlook
- 15.1 Technology Landscape and Maturity
- 15.2 Product, Process and Service Innovation
- 15.3 AI, Automation and Digital Tools in the Industry
- 15.4 Technology Adoption and Performance Benchmarking
- 15.5 Innovation Pipeline and R&D Investment
- 15.6 Patent and Intellectual Property Trends
- 15.7 Energy Efficiency and Resource Management
- 15.8 Sustainability, Recycling and Circularity
- 15.9 Technology Roadmap, 2025-2035
- 15.10 Risks of Obsolescence and Technology Substitution
Chapter 16 Australia High-Temperature Thermoplastics Market Key Strategic Imperatives
- 16.1 Growth and Market Entry Priorities
- 16.2 High-Return Products and Segments
- 16.3 Pricing, Profitability and Cost Optimization
- 16.4 Technology Investment and Product Differentiation
- 16.5 Supply Chain Localization and Resilience
- 16.6 Distribution and Customer Acquisition
- 16.7 Partnership, Acquisition and Capacity Strategy
- 16.8 Regional Expansion Priorities
- 16.9 Short-, Medium- and Long-Term Actions
Chapter 17 Competition Outlook
- 17.1 Industry Competition Characteristics
- 17.2 Market Structure and Concentration
- 17.3 Market Share and Competitive Positioning, 2025
- 17.4 Company-Wise Revenue and Product Benchmarking
- 17.5 Production and Service Capacity Benchmarking
- 17.6 Technology, Pricing and Differentiation
- 17.7 Regional Footprint and Distribution Strength
- 17.8 Mergers, Acquisitions and Strategic Alliances
- 17.9 New Entrants and Competitive Threats
- 17.10 Porter's Five Forces and Industry Attractiveness
- 17.11 Competitive Outlook, 2025-2035
Chapter 18 Company Profiles
- 18.1 Company Coverage and Selection Criteria
- 18.2 SABIC
- 18.2.1 Business Description
- 18.2.2 Company Ownership and Geographic Presence
- 18.2.3 Product and Service Portfolio
- 18.2.4 Manufacturing and Operating Footprint
- 18.2.5 Production Capacity and Expansion Plans
- 18.2.6 Financial Performance and Investment
- 18.2.7 Market Share and Competitive Position
- 18.2.8 Technology and Innovation Capabilities
- 18.2.9 Strategic Alliances or Partnerships
- 18.2.10 Recent Developments
- 18.2.11 Growth Strategy and Outlook
- 18.3 Syensqo
- 18.4 Victrex
- 18.5 BASF
- 18.6 Evonik
- 18.7 Dotmar Engineering Plastics
- 18.8 Other Relevant Market Participants
Note: Every listed company is profiled on the structure shown under the first company. The company list is preliminary and may change based on research findings, market developments, data availability and client requirements.
Chapter 19 Disclaimer
- 19.1 Research and Forecast Disclaimer
- 19.2 Data Source and Estimation Limitations
Note: The depth of individual sections depends on data availability for this market. Volume, capacity, trade and other unit-based metrics are included where applicable.

