Home » Mining, Minerals and Metals » Foundry Market

Foundry Market By Casting Processes (Sand Casting, Investment Casting, Die Casting, Permanent Mold Casting); By End-user (Automotive, Aerospace, Construction & Infrastructure, Energy); By Foundry Size and Scale (Large Foundries, Small & Medium Sized Foundries) – Growth, Share, Opportunities & Competitive Analysis, 2024 – 2032

Report ID: 32041 | Report Format : Excel, PDF

Market Overview

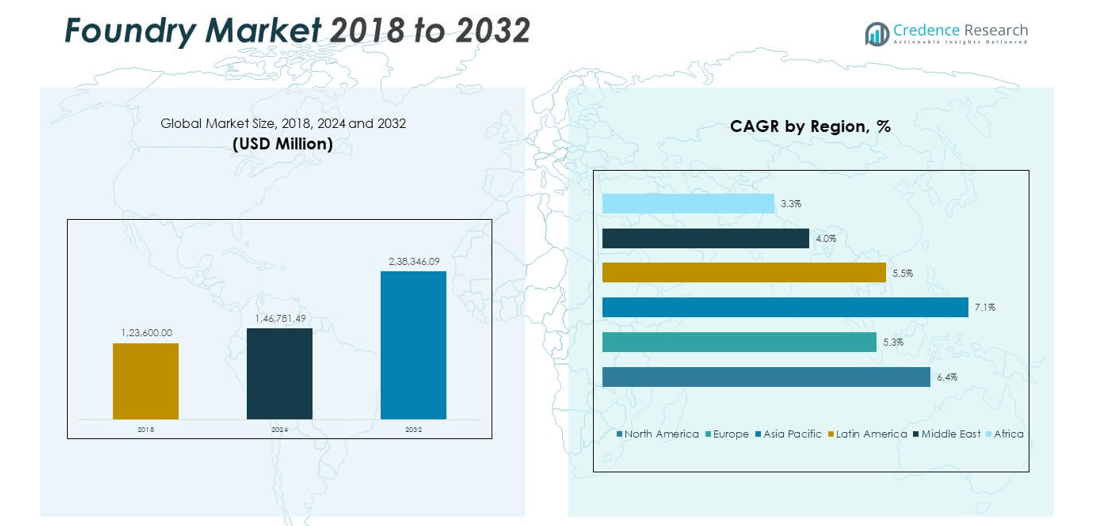
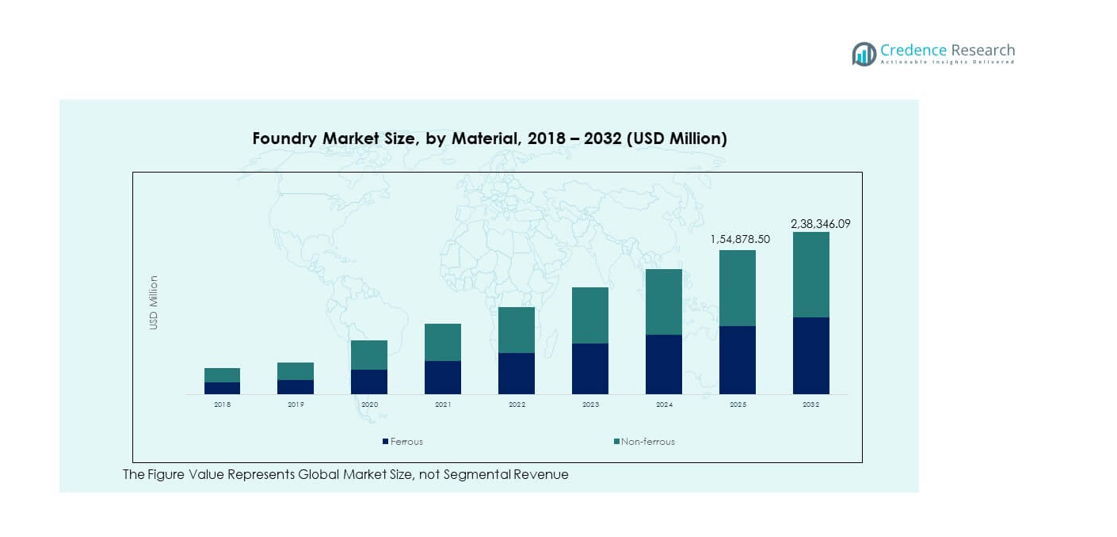
The Foundry Market was valued at USD 125.56 billion in 2023 and is projected to reach USD 171.70 billion by 2032, growing at a CAGR of 3.99% during the forecast period (2024–2032).

REPORT ATTRIBUTE DETAILS
Historical Period 2020-2023
Base Year 2024
Forecast Period 2025-2032
 Foundry Market Size 2023 USD 125.56 Billion
 Foundry Market, CAGR 3.99%
 Foundry Market Size 2032 USD 171.70 Billion

The foundry market is led by key players such as JSW Steel Ltd., Kirloskar Ferrous Industries Ltd., Brakes India Pvt. Ltd., Larsen & Toubro Ltd., and Electrosteel Castings Ltd. These companies dominate through large-scale production, technological innovation, and diversified product portfolios across ferrous and non-ferrous casting applications. Strategic investments in digital foundries, lightweight alloy development, and energy-efficient operations strengthen their competitiveness. Asia-Pacific remains the leading region, holding about 39% of the global market share in 2024, driven by high automotive and infrastructure demand in China and India. North America and Europe follow, supported by advanced automation and sustainability initiatives in foundry operations.

Access crucial information at unmatched prices!

Request your sample report today & start making informed decisions powered by Credence Research Inc.!

Download Sample

Market Insights

  • The global foundry market was valued at USD 125.56 billion in 2023 and is projected to reach USD 171.70 billion by 2032, growing at a CAGR of 3.99%.
  • Strong demand from the automotive sector, supported by the transition to electric vehicles and lightweight casting materials, drives steady market growth.
  • Key trends include the rise of digital foundries, use of 3D sand printing, and adoption of sustainable alloy compositions to enhance efficiency and lower emissions.
  • Major players such as JSW Steel Ltd., Kirloskar Ferrous Industries Ltd., and Larsen & Toubro Ltd. focus on automation and alloy innovation to gain competitive advantage.
  • Asia-Pacific leads with 39% share due to large-scale production in China and India, followed by Europe at 27% and North America at 24%, while sand casting remains the dominant process segment with 42% market share globally.

Market Segmentation Analysis:

By Casting Processes

Sand casting dominated the foundry market in 2024, accounting for around 42% of the total share. Its leadership stems from its versatility, cost efficiency, and suitability for producing large and complex metal components. The process is widely used across automotive and construction industries due to low tooling costs and adaptability to various metals. Growth is supported by increasing demand for lightweight aluminum and iron castings. Continuous advancements in 3D sand printing and resin-coated sands enhance production precision and reduce material waste, strengthening its position in global foundry operations.

  • For instance, the BMW Group produced electric motor housings at its Landshut foundry in 2024, using sand casting technology in combination with automated 3D sand printing systems for complex internal sand cores. This innovative manufacturing process allows for optimized component designs and uses inorganic binders to reduce emissions. In 2024, the Landshut light metal foundry produced almost 78,000 tonnes of total castings, including engine components, electric drive components, and structural parts.

By End-user

The automotive segment held the largest share of about 48% in 2024. Automakers rely heavily on cast components for engine blocks, transmission housings, and brake parts. The push toward electric mobility and lightweight vehicle structures further drives casting demand for aluminum and magnesium alloys. Foundries are adapting to produce complex geometries that improve fuel efficiency and performance. Expanding vehicle production across Asia-Pacific and Europe, coupled with sustainability initiatives favoring recyclable materials, continues to reinforce the segment’s dominance in the foundry market.

  • For instance, in 2024, Nemak sold 39.5 million equivalent units of automotive cast components. This included structural and e-mobility parts made from high-strength aluminum alloys for global OEMs.

By Foundry Size and Scale

Large foundries captured around 56% of the market share in 2024 due to their advanced automation, higher production capacities, and established client networks. These facilities are better equipped to handle bulk contracts for automotive and aerospace OEMs, ensuring consistent quality and scalability. Adoption of digital foundry technologies such as real-time process monitoring and predictive maintenance strengthens operational efficiency. However, small and medium-sized foundries are gaining traction through customization and regional supply chain flexibility, supporting localized production needs in emerging economies.

Foundry Market Size

Key Growth Drivers

Expanding Demand from the Automotive Sector

The automotive industry remains the largest demand driver for the global foundry market. Increasing vehicle production, particularly in Asia-Pacific, continues to accelerate the use of cast components in engines, chassis, and braking systems. Electric vehicle (EV) adoption further fuels demand for lightweight aluminum and magnesium castings to improve energy efficiency and reduce vehicle weight. Leading manufacturers are expanding foundry automation and die-casting capacity to meet precision standards required by EV platforms. The integration of smart foundries and computer-aided casting design improves product quality, consistency, and turnaround times, making the sector a cornerstone of foundry market growth.

  • For instance, in 2024, Tesla’s Gigafactory Texas used several IDRA Giga Press machines to produce aluminum gigacastings for its vehicles. Specifically, 6,000-ton Giga Presses manufactured rear castings for the Model Y and front castings for the Cybertruck.

Advancements in Casting Technologies

Technological innovation has transformed traditional casting into a highly automated, digitally monitored process. The rise of additive manufacturing, 3D sand printing, and simulation-based design tools allows foundries to achieve complex geometries with higher dimensional accuracy. Automation, robotics, and real-time monitoring systems improve productivity and reduce scrap rates. Energy-efficient melting systems and digital twins enhance process control while reducing carbon emissions. These advancements lower production costs, increase material utilization, and support sustainability goals. Continuous research in alloy development and process modeling ensures foundries stay competitive in precision-demanding sectors such as aerospace and defense.

  • For instance, Bühler Group’s Carat 920 two-platen die-casting machine was installed in 2024 at multiple foundries and can achieve up to 30% greater productivity compared to earlier systems.

Infrastructure and Industrial Expansion

The surge in infrastructure investment and industrialization across emerging economies significantly boosts foundry activities. Construction machinery, rail components, and heavy equipment rely heavily on cast iron and steel parts for durability and strength. Governments in India, China, and the Middle East are launching large-scale construction programs that stimulate local foundry demand. Energy sector projects, including wind turbines and power transmission systems, also contribute to the growing need for precision castings. Expanding industrial bases and localized production networks ensure steady foundry utilization rates and increased investment in modern facilities across developing regions.

Key Trends & Opportunities

Shift Toward Lightweight and Sustainable Casting Materials

Global decarbonization targets are pushing foundries toward lightweight and environmentally friendly materials. The shift from traditional ferrous to non-ferrous metals such as aluminum, magnesium, and composites aligns with automotive and aerospace sustainability requirements. Advanced alloys enhance performance while reducing emissions and fuel consumption. Companies are also adopting circular production models, reusing scrap metals and implementing cleaner melting technologies. This trend not only reduces environmental impact but also opens opportunities for foundries offering eco-friendly, high-strength cast solutions for green mobility and renewable energy sectors.

  • For instance, in 2024, Rio Tinto supplied customers with low-carbon aluminum under its RenewAl™ brand, which is produced with a lower carbon footprint than the industry average. Rio Tinto reported its total primary aluminum production for the year to be 3.3 million metric tons. The company also announced a partnership with BMW, with some of its low-carbon aluminum being used in vehicle parts and having the potential to reduce CO2 emissions by up to 70% compared to traditionally manufactured aluminum when combined with recycled content.

Digital Transformation and Smart Foundries

The integration of Industry 4.0 technologies is reshaping the operational landscape of foundries. Adoption of IoT sensors, machine learning, and AI-driven analytics enables predictive maintenance, improved process accuracy, and reduced downtime. Real-time monitoring enhances metallurgical control and consistency in casting output. Digital twins and simulation software are increasingly used to optimize mold design and material flow. This digital transformation supports higher throughput and improved product quality, giving competitive advantage to foundries that invest in data-driven automation and cloud-based production management systems.

Key Challenges

High Energy Consumption and Environmental Regulations

Foundry operations are energy-intensive, with melting and molding processes consuming large amounts of power and generating emissions. Rising energy costs and stricter environmental standards pose challenges for profitability and compliance. Regulations targeting CO₂ reduction and waste management require investments in cleaner technologies and emission control systems. Smaller foundries face higher financial strain due to limited access to capital for such upgrades. The pressure to decarbonize production without compromising output efficiency remains a significant challenge for the industry.

Shortage of Skilled Workforce and Technological Gaps

The foundry industry faces a growing skills gap as it transitions toward automation and digital technologies. Traditional casting expertise alone no longer suffices for operating modern CNC systems, robotics, or AI-based quality control platforms. Many foundries struggle to recruit technicians with both metallurgical knowledge and data analytics skills. Aging workforces in developed markets further exacerbate this challenge. Without targeted training programs and technical upskilling, productivity gains from new technologies may remain limited, slowing overall modernization across the global foundry sector.

Regional Analysis

North America

North America accounted for around 24% of the global foundry market share in 2024. The region’s growth is driven by high demand for precision cast components in automotive, aerospace, and industrial machinery sectors. The United States leads with strong adoption of aluminum and magnesium castings for lightweight vehicles and aircraft. Technological advancements, including automated molding systems and additive manufacturing, enhance production efficiency. Increasing investment in green foundries and energy-efficient processes supports regional competitiveness. Continuous reshoring of manufacturing operations and modernization of existing foundry facilities further sustain market expansion across North America.

Europe

Europe held about 27% of the foundry market share in 2024, supported by robust industrial bases in Germany, Italy, and France. Automotive and energy industries are key end-users, relying on high-precision, low-emission casting technologies. European foundries emphasize sustainability through electric melting systems and circular metal recycling. Strict EU environmental regulations accelerate the shift toward eco-friendly production methods. Innovation in lightweight alloy development for electric vehicles and aerospace applications strengthens market positioning. Strategic collaborations between foundries and OEMs across the region enhance efficiency and ensure steady demand for advanced casting solutions.

Asia-Pacific

Asia-Pacific dominated the global foundry market with a 39% share in 2024. China, India, and Japan lead production due to large automotive and construction industries. Rapid urbanization and infrastructure expansion increase demand for steel, iron, and aluminum cast components. Local foundries benefit from government support for industrial modernization and digital manufacturing. China remains the global hub for mass casting, while India emerges as a growing exporter of precision components. Expanding industrial clusters and lower production costs continue to position Asia-Pacific as the center of foundry manufacturing globally.

Latin America

Latin America represented around 6% of the foundry market share in 2024. Brazil and Mexico are key contributors, driven by growth in automotive assembly, mining, and construction sectors. The region’s focus on heavy machinery and transportation equipment supports demand for ferrous castings. Ongoing investment in industrial infrastructure modernization and renewable energy projects adds momentum. However, limited technological adoption and fluctuating raw material costs restrict faster growth. Increasing partnerships with international manufacturers and the establishment of regional casting facilities are gradually improving production capacity across Latin America.

Middle East & Africa

The Middle East & Africa accounted for roughly 4% of the global foundry market in 2024. Expansion of oil and gas, construction, and power generation projects drives regional demand for cast iron and steel components. The United Arab Emirates and Saudi Arabia are leading investors in industrial foundries supporting energy infrastructure. Africa’s mining and transport sectors also stimulate localized casting production. Although smaller in scale, the region is witnessing steady adoption of automated systems and cleaner production technologies. Government initiatives promoting industrial diversification are gradually strengthening foundry capacity and exports.

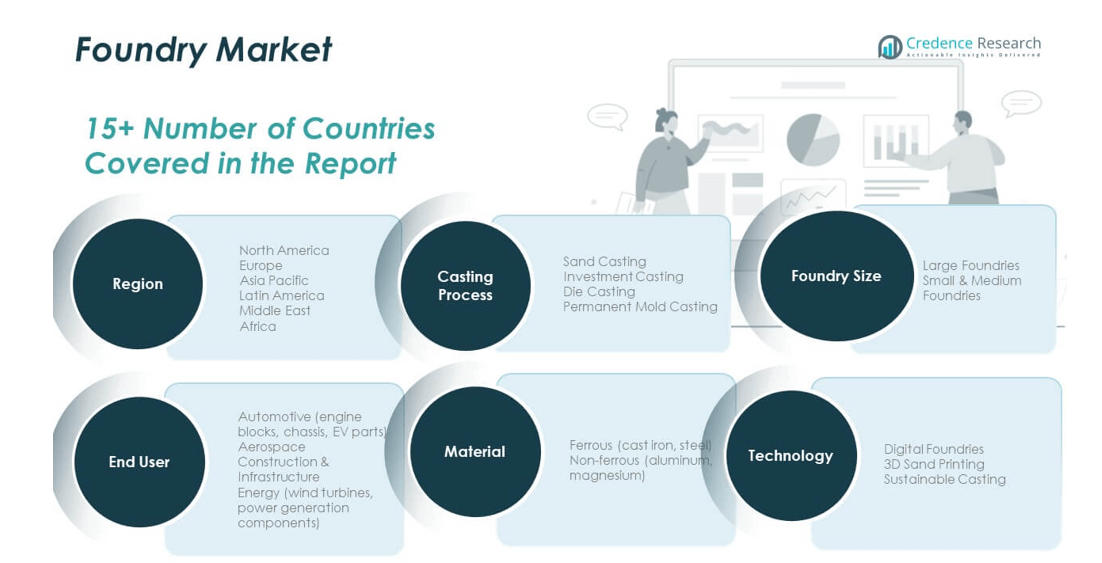
Market Segmentations:

By Casting Processes:

  • Sand Casting
  • Investment Casting
  • Die Casting
  • Permanent Mold Casting

By End-user:

  • Automotive
  • Aerospace
  • Construction & Infrastructure
  • Energy

By Foundry Size and Scale:

  • Large Foundries
  • Small & Medium Sized Foundries

By Geography:

  • North America
    • U.S.
    • Canada
  • Europe
    • Germany
    • France
    • U.K.
    • Italy
    • Spain
    • Rest of Europe
  • Asia Pacific
    • China
    • Japan
    • India
    • South Korea
    • South-east Asia
    • Rest of Asia Pacific
  • Latin America
    • Brazil
    • Mexico
    • Rest of Latin America
  • Middle East & Africa
    • GCC Countries
    • South Africa
    • Rest of the Middle East and Africa

Competitive Landscape

The global foundry market is moderately fragmented, with both multinational corporations and regional players competing across diverse casting technologies. Companies such as JSW Steel Ltd., Kirloskar Ferrous Industries Ltd., Brakes India Pvt. Ltd., and Electrosteel Castings Ltd. maintain strong market positions through integrated production capabilities and large distribution networks. Strategic investments in automation, advanced molding systems, and sustainability-focused operations are reshaping competitiveness. Firms like Larsen & Toubro Ltd. and Kalyani Group are leveraging digital foundry solutions and process simulation tools to enhance efficiency and reduce waste. Meanwhile, Aditya Birla Management Corp. Pvt. Ltd. and Jayaswal Neco Industries Ltd. focus on material innovation and customized casting solutions for automotive and construction clients. Continuous R&D, capacity expansion, and collaborations with OEMs are central strategies among leading players. The growing adoption of lightweight alloys and smart manufacturing technologies further intensifies competition across both developed and emerging foundry markets.

Shape Your Report to Specific Countries or Regions & Enjoy 30% Off!

Key Player Analysis

  • Aditya Birla Management Corp. Pvt. Ltd.
  • Ashok Iron Works P Ltd.
  • Brakes India Pvt. Ltd.
  • CALMET
  • Cooper Corp. Pvt. Ltd.
  • DCM Ltd.
  • Electrosteel Castings Ltd.
  • Fortune Foundries Pvt. Ltd.
  • Gujarat Metal Cast Industries Pvt. Ltd.
  • Hackforth Holding GmbH and Co. KG
  • Jayaswal Neco Industries Ltd.
  • JSW STEEL Ltd.
  • Kalyani Group
  • Kirloskar Ferrous Industries Ltd.
  • Larsen and Toubro Ltd.
  • Menon and Menon Ltd.
  • Nelcast Ltd.

Recent Developments

  • In February 2024, Brakes India announced a significant expansion of its manufacturing capabilities with the inauguration of two state-of-the-art units in Satara.
  • In September 2023, Kirloskar Ferrous Industries Limited (KFIL) announced the acquisition of Oliver Engineering Pvt. Ltd., a company engaged in the foundry business.
  • In June 2022, Brakes India partnered with Volvo Group to produce green iron castings at Brakes India’s foundries, aiming to reduce their carbon footprint.

Report Coverage

The research report offers an in-depth analysis based on Casting Processes, End User, Foundry Size and Scale and Geography. It details leading market players, providing an overview of their business, product offerings, investments, revenue streams, and key applications. Additionally, the report includes insights into the competitive environment, SWOT analysis, current market trends, as well as the primary drivers and constraints. Furthermore, it discusses various factors that have driven market expansion in recent years. The report also explores market dynamics, regulatory scenarios, and technological advancements that are shaping the industry. It assesses the impact of external factors and global economic changes on market growth. Lastly, it provides strategic recommendations for new entrants and established companies to navigate the complexities of the market.

Future Outlook

  1. The foundry market will experience steady growth driven by rising industrial and automotive production.
  2. Increased adoption of automation and smart foundry technologies will improve process efficiency.
  3. Demand for lightweight alloys such as aluminum and magnesium will continue to rise.
  4. Sustainable and low-emission casting methods will become a key industry focus.
  5. Additive manufacturing and 3D sand printing will reshape mold design and prototyping.
  6. The shift toward electric vehicles will boost demand for precision and non-ferrous castings.
  7. Digital twins and AI-based quality control will enhance product consistency and reduce waste.
  8. Foundries in Asia-Pacific will expand capacity to meet global manufacturing demand.
  9. Collaboration between foundries and OEMs will strengthen supply chain integration.
  10. Investments in energy-efficient furnaces and recycling systems will support long-term competitiveness.

1.1.1. Report Description 27
Purpose of the Report 27
USP & Key Offerings 27
1.1.2. Key Benefits for Stakeholders 27
1.1.3. Target Audience 28
1.1.4. Report Scope 28
1.1.5. Regional Scope 29
2.1. Foundry Market Snapshot 30
2.1.1. Global Foundry Market, 2018 – 2032 (Unit) (USD Million) 32
2.2. Insights from Primary Respondents 33
3.1. Russia-Ukraine and Israel-Palestine War Impacts 34
4.1. Introduction 35
4.2. Market Drivers 36
4.2.1. Driving Factor 1 Analysis 36
4.2.2. Driving Factor 2 Analysis 37
4.3. Market Restraints 38
4.3.1. Restraining Factor Analysis 38
4.4. Market Opportunities 39
4.4.1. Market Opportunity Analysis 39
4.5. Porter’s Five Forces Analysis 40
5.1. Company Market Share Analysis – 2023 41
5.1.1. Global Foundry Market: Company Market Share, by Volume, 2023 41
5.1.2. Global Foundry Market: Company Market Share, by Revenue, 2023 42
5.1.3. Global Foundry Market: Top 6 Company Market Share, by Revenue, 2023 42
5.1.4. Global Foundry Market: Top 3 Company Market Share, by Revenue, 2023 43
5.2. Global Foundry Market Company Volume Market Share, 2023 44
5.3. Global Foundry Market Company Revenue Market Share, 2023 45
5.4. Company Assessment Metrics, 2023 46
5.4.1. Stars 46
5.4.2. Emerging Leaders 46
5.4.3. Pervasive Players 46
5.4.4. Participants 46
5.4.5. Pricing Strategies 46
5.5. Strategic Developments 47
5.5.1. Acquisitions & Mergers 47
New Product Launch 47
Regional Expansion 47
5.6. Key Players Product Matrix 48
6.1. PESTEL 49
6.1.1. Political Factors 49
6.1.2. Economic Factors 49
6.1.3. Social Factors 49
6.1.4. Technological Factors 49
6.1.5. Environmental Factors 49
6.1.6. Legal Factors 49
6.2. Adjacent Market Analysis 49
7.1. Buying Criteria50
7.1. Challenges 50
7.2. Key Industries 50
8.1. Regulations 51
8.1.1. Automotive 51
8.1.2. Construction 51
8.1.3. Electronics 51
8.1.4. Construction & Infrastructure 518.1.5. Others 51
8.2. Technological Advancements 51
9.1. Carbon taxes 52
9.2. Recycled materials 52
9.3. Competitive Advantage 52
10.1. Customer Metrics 53
10.2. Reasons for Churn 53
10.3. Product Feedback 53
11.1. Foundry Market Overview, by Metal Types Segment 54
11.1.1. Foundry Market Volume Share, By Metal Types, 2023 & 2032 55
11.1.2. Foundry Market Revenue Share, By Metal Types, 2023 & 2032 55
11.1.3. Foundry Market Attractiveness Analysis, By Metal Types 56
11.1.4. Incremental Revenue Growth Opportunity, by Metal Types, 2024 – 2032 56
11.1.5. Foundry Market Revenue, By Metal Types, 2018, 2023, 2027 & 2032 57
11.2. Ferrous Foundries 58
11.2 1.Global Ferrous Foundries Foundry Market Volume & Revenue, By Region, 2018 – 2023
(Unit) (USD Million) 59
11.2 2.Global Ferrous Foundries Foundry Market Volume & Revenue, By Region, 2024 – 2032
(Unit) (USD Million) 59
11.3. Non-Ferrous Foundries 59
11.3.1. Global Non-Ferrous Foundries Foundry Market Volume & Revenue, By Region, 2018 – 2023 (Unit) (USD Million) 61
11.3.2. Global Non-Ferrous Foundries Foundry Market Volume & Revenue, By Region, 2024 –
2032 (Unit) (USD Million) 61
12.1. Foundry Market Overview, by Casting Processes Segment 62
12.1.1. Foundry Market Volume Share, By Casting Processes, 2023 & 2032 63
12.1.2. Foundry Market Revenue Share, By Casting Processes, 2023 & 2032 63
12.1.3. Foundry Market Attractiveness Analysis, By Casting Processes 64
12.1.4. Incremental Revenue Growth Opportunity, by Casting Processes, 2024 – 2032 64
12.1.5. Foundry Market Revenue, By Casting Processes, 2018, 2023, 2027 & 2032 65
12.2. Sand Casting 66
12.2.1. Global Sand-Casting Foundry Market Volume & Revenue, By Region, 2018 – 2023 (Unit) (USD Million) 67
12.2.2. Global Sand-Casting Foundry Market Volume & Revenue, By Region, 2024 – 2032 (Unit) (USD Million) 67
12.3. Investment Casting 68
12.3 1.Global Investment Casting Foundry Market Volume & Revenue, By Region, 2018 – 2023
(Unit) (USD Million) 69
12.3 2.Global Investment Casting Foundry Market Volume & Revenue, By Region, 2024 – 2032
(Unit) (USD Million) 69
12.4. Die Casting 69
12.4.1. Global Die Casting Foundry Market Volume & Revenue, By Region, 2018 – 2023 (Unit) (USD Million) 71
12.4.2. Global Die Casting Foundry Market Volume & Revenue, By Region, 2024 – 2032 (Unit) (USD Million) 71
12.5. Permanent Mold Casting 72
12.5 1.Global Permanent Mold Casting Foundry Market Volume & Revenue, By Region, 2018 –
2023 (Unit) (USD Million) 73
12.5 2.Global Permanent Mold Casting Foundry Market Volume & Revenue, By Region, 2024 –
2032 (Unit) (USD Million) 73
13.1. Foundry Market Overview, by Application Segment 74
13.1.1. Foundry Market Volume Share, By Application, 2023 & 2032 75
13.1.2. Foundry Market Revenue Share, By Application, 2023 & 2032 75
13.1.3. Foundry Market Attractiveness Analysis, By Application 76
13.1.4. Incremental Revenue Growth Opportunity, by Application, 2024 – 2032 76
13.1.5. Foundry Market Revenue, By Application, 2018, 2023, 2027 & 2032 77
13.2. Automotive 78
13.2.1. Global Automotive Foundry Market Volume & Revenue, By Region, 2018 – 2023 (Unit) (USD Million) 79
13.2.2. Global Automotive Foundry Market Volume & Revenue, By Region, 2024 – 2032 (Unit) (USD Million) 79
13.3. Aerospace 80
13.3.1. Global Aerospace Foundry Market Volume & Revenue, By Region, 2018 – 2023 (Unit) (USD Million) 81
13.3.2. Global Aerospace Foundry Market Volume & Revenue, By Region, 2024 – 2032 (Unit) (USD Million) 81
13.4. Construction & Infrastructure 82
13.4.1. Global Construction & Infrastructure Foundry Market Volume & Revenue, By Region, 2018 – 2023 (Unit) (USD Million) 83
13.4.2. Global Construction & Infrastructure Foundry Market Volume & Revenue, By Region, 2024 – 2032 (Unit) (USD Million) 83
13.5. Energy 84
13.5.1. Global Energy Foundry Market Volume & Revenue, By Region, 2018 – 2023 (Unit) (USD Million) 85
13.5.2. Global Energy Foundry Market Volume & Revenue, By Region, 2024 – 2032 (Unit) (USD Million) 85
14.1. Foundry Market Overview, by Foundry Size and Scale Segment 86
14.1.1. Foundry Market Volume Share, By Foundry Size and Scale, 2023 & 2032 87
14.1.2. Foundry Market Revenue Share, By Foundry Size and Scale, 2023 & 2032 87
14.1.3. Foundry Market Attractiveness Analysis, By Foundry Size and Scale 88
14.1.4. Incremental Revenue Growth Opportunity, by Foundry Size and Scale, 2024 – 2032 88
14.1.5. Foundry Market Revenue, By Foundry Size and Scale, 2018, 2023, 2027 & 2032 89
14.2. Large Foundries 90
14.2 1.Global Large Foundries Foundry Market Volume & Revenue, By Region, 2018 – 2023
(Unit) (USD Million) 91
14.2 2.Global Large Foundries Foundry Market Volume & Revenue, By Region, 2024 – 2032
(Unit) (USD Million) 91
14.3. Small & Medium Sized Foundries 92
14.3.1. Global Small & Medium Sized Foundries Foundry Market Volume & Revenue, By Region, 2018 – 2023 (Unit) (USD Million) 93
14.3.2. Global Small & Medium Sized Foundries Foundry Market Volume & Revenue, By Region, 2024 – 2032 (Unit) (USD Million) 93
15.1. Foundry Market Overview, by Distribution Channel 94
15.1.1. Foundry Market Volume Share, By Distribution Channel, 2023 & 2032 95
15.1.2. Foundry Market Revenue Share, By Distribution Channel, 2023 & 2032 95
15.1.3. Foundry Market Attractiveness Analysis, By Distribution Channel 96
15.1.4. Incremental Revenue Growth Opportunity, by Distribution Channel, 2024 – 2032 96
15.1.5. Foundry Market Revenue, By Distribution Channel, 2018, 2023, 2027 & 2032 97
15.2. B2B 98
15.2.1. Global B2B Foundry Market Volume & Revenue, By Region, 2018 – 2023 (Unit) (USD Million) 99
15.2.2. Global B2B Foundry Market Volume & Revenue, By Region, 2024 – 2032 (Unit) (USD Million) 99
15.3. Digital Channels 100
15.3 1.Global Digital Channels Foundry Market Volume & Revenue, By Region, 2018 – 2023
(Unit) (USD Million) 101
15.3 2.Global Digital Channels Foundry Market Volume & Revenue, By Region, 2024 – 2032
(Unit) (USD Million) 101
16.1. Foundry Market Overview, by Regional Segments 102
16.2. Region 103
16.2.1. Global Foundry Market Volume Share, By Region, 2023 & 2032 103
16.2.2. Global Foundry Market Revenue Share, By Region, 2023 & 2032 103
16.2.3. Foundry Market Attractiveness Analysis, By Region 104
16.2.4. Incremental Revenue Growth Opportunity, by Region, 2024 – 2032 104
16.2.5. Foundry Market Revenue, By Region, 2018, 2023, 2027 & 2032 105
16.2.6. Global Foundry Market Volume & Revenue, By Region, 2018 – 2023 (Unit) (USD Million) 106
16.2.7. Global Foundry Market Volume & Revenue, By Region, 2024 – 2032 (Unit) (USD Million) 106
16.3. Metal Types 107
16.3.1. Global Foundry Market Volume & Revenue, By Metal Types, 2018 – 2023 (Unit) (USD Million) 107
16.3.2. Global Foundry Market Volume & Revenue, By Metal Types, 2024 – 2032 (Unit) (USD Million) 107
16.4. Casting Processes 108
16.4.1. Global Foundry Market Volume & Revenue, By Casting Processes, 2018 – 2023 (Unit) (USD Million) 108
16.4.2. Global Foundry Market Volume & Revenue, By Casting Processes, 2024 – 2032 (Unit) (USD Million) 108
16.5. Application 109
16.5.1. Global Foundry Market Volume & Revenue, By Application, 2018 – 2023 (Unit) (USD Million) 109
16.5.2. Global Foundry Market Volume & Revenue, By Application, 2024 – 2032 (Unit) (USD Million) 109
16.6. Foundry Size and Scale 110
16.6 1.Global Foundry Market Volume & Revenue, By Foundry Size and Scale, 2018 – 2023
(Unit) (USD Million) 110
16.6 2.Global Foundry Market Volume & Revenue, By Foundry Size and Scale, 2024 – 2032
(Unit) (USD Million) 110
16.7. Distribution Channel 111
16.7.1. Global Foundry Market Volume & Revenue, By Distribution Channel, 2018 – 2023 (Unit) (USD Million) 111
16.7.2. Global Foundry Market Volume & Revenue, By Distribution Channel, 2024 – 2032 (Unit) (USD Million) 111
17.1. North America112 17.1.1.Key Highlights 112
17.1.2. North America Foundry Market Volume, By Country, 2018 – 2032 (Unit) 113
17.1.3. North America Foundry Market Revenue, By Country, 2018 – 2023 (USD Million) 114
17.1.4. North America Foundry Market Volume, By Metal Types, 2018 – 2023 (Unit) 115
17.1.5. North America Foundry Market Revenue, By Metal Types, 2018 – 2023 (USD Million) 116
17.1.6.North America Foundry Market Volume, By Casting Processes, 2018 – 2023 (Unit) 117
17.1.7. North America Foundry Market Revenue, By Casting Processes, 2018 – 2023 (USD Million) 118
17.1.8. North America Foundry Market Volume, By Application, 2018 – 2023 (Unit) 119
17.1.9. North America Foundry Market Revenue, By Application, 2018 – 2023 (USD Million). 120
17.1.10. North America Foundry Market Volume, By Foundry Size and Scale, 2018
– 2023 (Unit) 121
17.1.11. North America Foundry Market Revenue, By Foundry Size and Scale, 2018
– 2023 (USD Million) 122
17.1.12. North America Foundry Market Volume, By Distribution Channel, 2018 – 2023 (Unit) 123
17.1.13. North America Foundry Market Revenue, By Distribution Channel, 2018 – 2023 (USD Million) 124
17.2.
U.S.
125
17.3.
Canada
125
17.4.
Mexico
125
18.1. Europe 126
18.1 1.Key Highlights 126
18.1.2. Europe Foundry Market Volume, By Country, 2018 – 2032 (Unit) 127
18.1.3. Europe Foundry Market Revenue, By Country, 2018 – 2023 (USD Million) 128
18.1.4. Europe Foundry Market Volume, By Metal Types, 2018 – 2023 (Unit) 129
18.1.5. Europe Foundry Market Revenue, By Metal Types, 2018 – 2023 (USD Million) 130
18.1.6. Europe Foundry Market Volume, By Casting Processes, 2018 – 2023 (Unit) 131
18.1.7. Europe Foundry Market Revenue, By Casting Processes, 2018 – 2023 (USD Million) … 132
18.1.8.Europe Foundry Market Volume, By Application, 2018 – 2023 (Unit) 133
18.1.9.Europe Foundry Market Revenue, By Application, 2018 – 2023 (USD Million) 134
18.1.10.
Europe Foundry Market Volume, By Foundry Size and Scale, 2018 – 2023
(Unit)
135
18.1.11.
Europe Foundry Market Revenue, By Foundry Size and Scale, 2018 – 2023
(USD Million)
136
18.1.12.
Europe Foundry Market Volume, By Distribution Channel, 2018 – 2023
(Unit)
137
18.1.13.
Europe Foundry Market Revenue, By Distribution Channel, 2018 – 2023
(USD Million)
138
18.2. UK
139
18.3. France
139
18.4. Germany
139
18.5. Italy
139
18.6. Spain
139
18.7. Russia
139
18.8. Belgium
139
18.9. Netherland
139
18.10. Austria
139
18.11. Sweden
139
18.12. Poland
139
18.13. Denmark
139
18.14. Switzerland
139
18.15. Rest of Europe139
19.1. Asia Pacific 140 19.1.1.Key Highlights 140
19.1.2. Asia Pacific Foundry Market Volume, By Country, 2018 – 2032 (Unit) 141
19.1.3. Asia Pacific Foundry Market Revenue, By Country, 2018 – 2023 (USD Million) 142
19.1.4. Asia Pacific Foundry Market Volume, By Metal Types, 2018 – 2023 (Unit) 143
19.1.5. Asia Pacific Foundry Market Revenue, By Metal Types, 2018 – 2023 (USD Million) 144
19.1.6. Asia Pacific Foundry Market Volume, By Casting Processes, 2018 – 2023 (Unit) 145
19.1.7. Asia Pacific Foundry Market Revenue, By Casting Processes, 2018 – 2023 (USD Million) 146
19.1.8. Asia Pacific Foundry Market Volume, By Application, 2018 – 2023 (Unit) 147
19.1.9. Asia Pacific Foundry Market Revenue, By Application, 2018 – 2023 (USD Million) 148
19.1.10. Asia Pacific Foundry Market Volume, By Foundry Size and Scale, 2018 – 2023 (Unit) 149
19.1.11. Asia Pacific Foundry Market Revenue, By Foundry Size and Scale, 2018 – 2023 (USD Million) 150
19.1.12. Asia Pacific Foundry Market Volume, By Distribution Channel, 2018 – 2023 (Unit) 151
19.1.13. Asia Pacific Foundry Market Revenue, By Distribution Channel, 2018 – 2023 (USD Million) 152
19.2.
China
153
19.3.
Japan
153
19.4.
South Korea
153
19.5.
India
153
19.6.
Australia
153
19.7.
Thailand
153
19.8.
Indonesia
153
19.9.
Vietnam
153
19.10.
Malaysia
153
19.11.
Philippines
153
19.12.
Taiwan
153
19.13. Rest of Asia Pacific 153
20.1. Latin America 154 20.1.1.Key Highlights 154
20.1.2. Latin America Foundry Market Volume, By Country, 2018 – 2032 (Unit) 155
20.1.3. Latin America Foundry Market Revenue, By Country, 2018 – 2023 (USD Million) 156
20.1.4. Latin America Foundry Market Volume, By Metal Types, 2018 – 2023 (Unit) 157
20.1.5. Latin America Foundry Market Revenue, By Metal Types, 2018 – 2023 (USD Million) . 158 20.1.6.Latin America Foundry Market Volume, By Casting Processes, 2018 – 2023 (Unit) 159
20.1.7. Latin America Foundry Market Revenue, By Casting Processes, 2018 – 2023 (USD Million) 160
20.1.8. Latin America Foundry Market Volume, By Application, 2018 – 2023 (Unit) 161
20.1.9. Latin America Foundry Market Revenue, By Application, 2018 – 2023 (USD Million) 162
20.1.10. Latin America Foundry Market Volume, By Foundry Size and Scale, 2018 – 2023 (Unit) 163
20.1.11. Latin America Foundry Market Revenue, By Foundry Size and Scale, 2018
– 2023 (USD Million) 164
20.1.12. Latin America Foundry Market Volume, By Distribution Channel, 2018 – 2023 (Unit) 165
20.1.13. Latin America Foundry Market Revenue, By Distribution Channel, 2018 – 2023 (USD Million) 166
20.2.
Brazil
167
20.3.
Argentina
167
20.4.
Peru
167
20.5.
Chile
167
20.6.
Colombia
167
20.7. Rest of Latin America 167
21.1. Middle East 168 21.1.1.Key Highlights 168
21.1.2. Middle East Foundry Market Volume, By Country, 2018 – 2032 (Unit) 169
21.1.3. Middle East Foundry Market Revenue, By Country, 2018 – 2023 (USD Million) 170
21.1.4. Middle East Foundry Market Volume, By Metal Types, 2018 – 2023 (Unit) 171
21.1.5. Middle East Foundry Market Revenue, By Metal Types, 2018 – 2023 (USD Million) 172
21.1.6. Middle East Foundry Market Volume, By Casting Processes, 2018 – 2023 (Unit) 173
21.1.7. Middle East Foundry Market Revenue, By Casting Processes, 2018 – 2023 (USD Million) 174
21.1.8. Middle East Foundry Market Volume, By Application, 2018 – 2023 (Unit) 175
21.1.9. Middle East Foundry Market Revenue, By Application, 2018 – 2023 (USD Million) 176
21.1.10. Middle East Foundry Market Volume, By Foundry Size and Scale, 2018 – 2023 (Unit) 177
21.1.11. Middle East Foundry Market Revenue, By Foundry Size and Scale, 2018 – 2023 (USD Million) 178
21.1.12. Middle East Foundry Market Volume, By Distribution Channel, 2018 – 2023 (Unit) 179
21.1.13. Middle East Foundry Market Revenue, By Distribution Channel, 2018 – 2023 (USD Million) 180
21.2. UAE 181
21.3. KSA 181
21.4. Israel 181
21.5. Turkey 181
21.6. Iran 181
21.7. Rest of Middle East 181
22.1. Africa 182
22.1 1.Key Highlights 182
22.1.2. Africa Foundry Market Volume, By Country, 2018 – 2032 (Unit) 183
22.1.3. Africa Foundry Market Revenue, By Country, 2018 – 2023 (USD Million) 184
22.1.4. Africa Foundry Market Volume, By Metal Types, 2018 – 2023 (Unit) 185
22.1.5. Africa Foundry Market Revenue, By Metal Types, 2018 – 2023 (USD Million) 186
22.1.6. Africa Foundry Market Volume, By Casting Processes, 2018 – 2023 (Unit) 187
22.1.7. Africa Foundry Market Revenue, By Casting Processes, 2018 – 2023 (USD Million) 188
22.1.8. Africa Foundry Market Volume, By Application, 2018 – 2023 (Unit) 189
22.1.9. Africa Foundry Market Revenue, By Application, 2018 – 2023 (USD Million) 190
22.1.10. Africa Foundry Market Volume, By Foundry Size and Scale, 2018 – 2023 (Unit) 191
22.1.11. Africa Foundry Market Revenue, By Foundry Size and Scale, 2018 – 2023 (USD Million) 192
22.1.12. Africa Foundry Market Volume, By Distribution Channel, 2018 – 2023 (Unit) 193
22.1.13. Africa Foundry Market Revenue, By Distribution Channel, 2018 – 2023 (USD Million) 194
22.2. Egypt 195
22.3. Nigeria 195
22.4. Algeria 195
22.5. Morocco 195
22.6. Rest of Africa 195
23.1. A Cast Foundry 196
23.1.1. Company Overview 196
23.1.2. Product Portfolio 196
23.1.3. Swot Analysis 196
23.1.4. Business Strategy 196
23.1.5. Financial Overview 197
23.2.
ASK Chemicals
198
23.3.
Ferroglobe
198
23.4.
Elkem
198
23.5. Aditya Birla Management Corp. Pvt. Ltd 198
23.6. Ashok Iron Works P Ltd 198
23.7. Brakes India Pvt. Ltd 198
23.8. CALMET 198
23.9. Cooper Corp. Pvt. Ltd 198
23.10. DCM Ltd. 198
23.11. Electrosteel Castings Ltd 198
23.12. Fortune Foundries Pvt. Ltd 198
23.13. Gujarat Metal Cast Industries Pvt. Ltd 198
23.14. Hackforth Holding GmbH and Co. KG 198
23.15. Jayaswal Neco Industries Ltd 198
23.16. JSW STEEL Ltd.198
23.17. . Kalyani Group 198
23.18. Kirloskar Ferrous Industries Ltd 198
23.19. Larsen and Toubro Ltd 198
23.20. Menon and Menod Ltd 198
23.21. ElkemNelcast Ltd 198
24.1. Research Methodology 199
24.1.1. Phase I – Secondary Research 200
24.1.2. Phase II – Data Modeling 200
Company Share Analysis Model 201
Revenue Based Modeling 201
24.1.3. Phase III – Primary Research 202
24.1.4. Research Limitations 203
Assumptions 203
List of Figures
FIG NO. 1. Global Foundry Market Volume & Revenue, 2018 – 2032 (Unit) (USD Million) 32
FIG NO. 2. Porter’s Five Forces Analysis for Global Foundry Market 40
FIG NO. 3. Company Share Analysis, 2023 41
FIG NO. 4. Company Share Analysis, 2023 42
FIG NO. 5. Company Share Analysis, 2023 42
FIG NO. 6. Company Share Analysis, 2023 43
FIG NO. 7. Foundry Market – Company Volume Market Share, 2023 44
FIG NO. 8. Foundry Market – Company Revenue Market Share, 2023 45
FIG NO. 9. Foundry Market Volume Share, By Metal Types, 2023 & 2032 55
FIG NO. 10. Foundry Market Revenue Share, By Metal Types, 2023 & 2032 55
FIG NO. 11. Market Attractiveness Analysis, By Metal Types 56
FIG NO. 12. Incremental Revenue Growth Opportunity by Metal Types, 2024 – 2032 56
FIG NO. 13. Foundry Market Revenue, By Metal Types, 2018, 2023, 2027 & 2032 57
FIG NO. 14. Global Foundry Market for Ferrous Foundries, Volume & Revenue (Unit) (USD Million)
2018 – 2032………………………………………………………………………………………………………… 58
FIG NO. 15. Global Foundry Market for Non-Ferrous Foundries, Volume & Revenue (Unit) (USD
Million) 2018 – 2032 60
FIG NO. 16. Foundry Market Volume Share, By Casting Processes, 2023 & 2032 63
FIG NO. 17. Foundry Market Revenue Share, By Casting Processes, 2023 & 2032 63
FIG NO. 18. Market Attractiveness Analysis, By Casting Processes 64
FIG NO. 19. Incremental Revenue Growth Opportunity by Casting Processes, 2024 – 2032 64
FIG NO. 20. Foundry Market Revenue, By Casting Processes, 2018, 2023, 2027 & 2032 65
FIG NO. 21. Global Foundry Market for Sand Casting, Volume & Revenue (Unit) (USD Million) 2018 –
2032 …………………………………………………………………………………………………………………. 66
FIG NO. 22. Global Foundry Market for Investment Casting, Volume & Revenue (Unit) (USD Million)
2018 – 2032………………………………………………………………………………………………………… 68
FIG NO. 23. Global Foundry Market for Die Casting, Volume & Revenue (Unit) (USD Million) 2018 –
2032 …………………………………………………………………………………………………………………. 70
FIG NO. 24. Global Foundry Market for Permanent Mold Casting, Volume & Revenue (Unit) (USD
Million) 2018 – 2032 72
FIG NO. 25. Foundry Market Volume Share, By Application, 2023 & 2032 75
FIG NO. 26. Foundry Market Revenue Share, By Application, 2023 & 2032 75
FIG NO. 27. Market Attractiveness Analysis, By Application 76
FIG NO. 28. Incremental Revenue Growth Opportunity by Application, 2024 – 2032 76
FIG NO. 29. Foundry Market Revenue, By Application, 2018, 2023, 2027 & 2032 77
FIG NO. 30. Global Foundry Market for Automotive, Volume & Revenue (Unit) (USD Million) 2018 –
2032 …………………………………………………………………………………………………………………. 78
FIG NO. 31. Global Foundry Market for Aerospace, Volume & Revenue (Unit) (USD Million) 2018 –
2032 …………………………………………………………………………………………………………………. 80
FIG NO. 32. Global Foundry Market for Construction & Infrastructure, Volume & Revenue (Unit) (USD Million) 2018 – 2032 82
FIG NO. 33. Global Foundry Market for Energy, Volume & Revenue (Unit) (USD Million) 2018 – 2032 84
FIG NO. 34. Foundry Market Volume Share, By Foundry Size and Scale, 2023 & 2032 87
FIG NO. 35. Foundry Market Revenue Share, By Foundry Size and Scale, 2023 & 2032 87
FIG NO. 36. Market Attractiveness Analysis, By Foundry Size and Scale 88
FIG NO. 37. Incremental Revenue Growth Opportunity by Foundry Size and Scale, 2024 – 2032 88
FIG NO. 38. Foundry Market Revenue, By Foundry Size and Scale, 2018, 2023, 2027 & 2032 89
FIG NO. 39. Global Foundry Market for Large Foundries, Volume & Revenue (Unit) (USD Million) 2018
– 2032 ……………………………………………………………………………………………………………….. 90
FIG NO. 40. Global Foundry Market for Small & Medium Sized Foundries, Volume & Revenue (Unit)
(USD Million) 2018 – 2032 92
FIG NO. 41. Foundry Market Volume Share, By Foundry Size and Scale, 2023 & 2032 95
FIG NO. 42. Foundry Market Revenue Share, By Foundry Size and Scale, 2023 & 2032 95
FIG NO. 43. Market Attractiveness Analysis, By Foundry Size and Scale 96
FIG NO. 44. Incremental Revenue Growth Opportunity by Foundry Size and Scale, 2024 – 2032 96
FIG NO. 45. Foundry Market Revenue, By Foundry Size and Scale, 2018, 2023, 2027 & 2032 97
FIG NO. 46. Global Foundry Market for B2B, Volume & Revenue (Unit) (USD Million) 2018 – 2032 98
FIG NO. 47. Global Foundry Market for Digital Channels, Volume & Revenue (Unit) (USD Million) 2018
– 2032 ……………………………………………………………………………………………………………….100
FIG NO. 48. Global Foundry Market Volume Share, By Region, 2023 & 2032 103
FIG NO. 49. Global Foundry Market Revenue Share, By Region, 2023 & 2032 103
FIG NO. 50. Market Attractiveness Analysis, By Region 104
FIG NO. 51. Incremental Revenue Growth Opportunity by Region, 2024 – 2032 104
FIG NO. 52. Foundry Market Revenue, By Region, 2018, 2023, 2027 & 2032 105
FIG NO. 53. North America Foundry Market Volume & Revenue, 2018 – 2032 (Unit) (USD Million) 112
FIG NO. 54. Europe Foundry Market Volume & Revenue, 2018 – 2032 (Unit) (USD Million) 126
FIG NO. 55. Asia Pacific Foundry Market Volume & Revenue, 2018 – 2032 (Unit) (USD Million) 140
FIG NO. 56. Latin America Foundry Market Volume & Revenue, 2018 – 2032 (Unit) (USD Million) 154
FIG NO. 57. Middle East Foundry Market Volume & Revenue, 2018 – 2032 (Unit) (USD Million) 168
FIG NO. 58. Africa Foundry Market Volume & Revenue, 2018 – 2032 (Unit) (USD Million) 182
FIG NO. 59. Research Methodology – Detailed View 199
FIG NO. 60. Research Methodology 200
List of Tables
TABLE NO. 1. : Global Foundry Market: Snapshot 30
TABLE NO. 2. : Drivers for the Foundry Market: Impact Analysis 36
TABLE NO. 3. : Restraints for the Foundry Market: Impact Analysis 38
TABLE NO. 4. : Global Ferrous Foundries Foundry Market Volume & Revenue, By Region, 2018 – 2023
(Unit) (USD Million) 59
TABLE NO. 5. : Global Ferrous Foundries Foundry Market Volume & Revenue, By Region, 2024 – 2032
(Unit) (USD Million) 59
TABLE NO. 6. : Global Non-Ferrous Foundries Foundry Market Volume & Revenue, By Region, 2018 –
2023 (Unit) (USD Million) 61
TABLE NO. 7. : Global Non-Ferrous Foundries Foundry Market Volume & Revenue, By Region, 2024 –
2032 (Unit) (USD Million) 61
TABLE NO. 8. : Global Sand-Casting Foundry Market Volume & Revenue, By Region, 2018 – 2023 (Unit)
(USD Million) 67
TABLE NO. 9. : Global Sand-Casting Foundry Market Volume & Revenue, By Region, 2024 – 2032 (Unit)
(USD Million) 67
TABLE NO. 10. : Global Investment Casting Foundry Market Volume & Revenue, By Region, 2018 – 2023 (Unit) (USD Million) 69
TABLE NO. 11. : Global Investment Casting Foundry Market Volume & Revenue, By Region, 2024 – 2032 (Unit) (USD Million) 69
TABLE NO. 12. : Global Die Casting Foundry Market Volume & Revenue, By Region, 2018 – 2023 (Unit)
(USD Million) 71
TABLE NO. 13. : Global Die Casting Foundry Market Volume & Revenue, By Region, 2024 – 2032 (Unit)
(USD Million) 71
TABLE NO. 14. : Global Permanent Mold Casting Foundry Market Volume & Revenue, By Region, 2018 –
2023 (Unit) (USD Million) 73
TABLE NO. 15. : Global Permanent Mold Casting Foundry Market Volume & Revenue, By Region, 2024 –
2032 (Unit) (USD Million) 73
TABLE NO. 16. : Global Automotive Foundry Market Volume & Revenue, By Region, 2018 – 2023 (Unit)
(USD Million) 79
TABLE NO. 17. : Global Automotive Foundry Market Volume & Revenue, By Region, 2024 – 2032 (Unit)
(USD Million) 79
TABLE NO. 18. : Global Aerospace Foundry Market Volume & Revenue, By Region, 2018 – 2023 (Unit)
(USD Million) 81
TABLE NO. 19. : Global Aerospace Foundry Market Volume & Revenue, By Region, 2024 – 2032 (Unit)
(USD Million) 81
TABLE NO. 20. : Global Construction & Infrastructure Foundry Market Volume & Revenue, By Region,
2018 – 2023 (Unit) (USD Million) 83
TABLE NO. 21. : Global Construction & Infrastructure Foundry Market Volume & Revenue, By Region,
2024 – 2032 (Unit) (USD Million) 83
TABLE NO. 22. : Global Energy Foundry Market Volume & Revenue, By Region, 2018 – 2023 (Unit) (USD Million) 85
TABLE NO. 23. : Global Energy Foundry Market Volume & Revenue, By Region, 2024 – 2032 (Unit) (USD Million) 85
TABLE NO. 24. : Global Large Foundries Foundry Market Volume & Revenue, By Region, 2018 – 2023
(Unit) (USD Million) 91
TABLE NO. 25. : Global Large Foundries Foundry Market Volume & Revenue, By Region, 2024 – 2032
(Unit) (USD Million) 91
TABLE NO. 26. : Global Small & Medium Sized Foundries Foundry Market Volume & Revenue, By Region, 2018 – 2023 (Unit) (USD Million) 93
TABLE NO. 27. : Global Small & Medium Sized Foundries Foundry Market Volume & Revenue, By Region, 2024 – 2032 (Unit) (USD Million) 93
TABLE NO. 28. : Global B2B Foundry Market Volume & Revenue, By Region, 2018 – 2023 (Unit) (USD
Million) 99
TABLE NO. 29. : Global B2B Foundry Market Volume & Revenue, By Region, 2024 – 2032 (Unit) (USD
Million) 99
TABLE NO. 30. : Global Digital Channels Foundry Market Volume & Revenue, By Region, 2018 – 2023
(Unit) (USD Million) 101
TABLE NO. 31. : Global Digital Channels Foundry Market Volume & Revenue, By Region, 2024 – 2032
(Unit) (USD Million) 101
TABLE NO. 32. : Global Foundry Market Volume & Revenue, By Region, 2018 – 2023 (Unit) (USD Million) 106
TABLE NO. 33. : Global Foundry Market Volume & Revenue, By Region, 2024 – 2032 (Unit) (USD Million) 106
TABLE NO. 34. : Global Foundry Market Volume & Revenue, By Metal Types, 2018 – 2023 (Unit) (USD
Million) 107
TABLE NO. 35. : Global Foundry Market Volume & Revenue, By Metal Types, 2024 – 2032 (Unit) (USD
Million) 107
TABLE NO. 36. : Global Foundry Market Volume & Revenue, By Casting Processes, 2018 – 2023 (Unit) (USD Million) 108
TABLE NO. 37. : Global Foundry Market Volume & Revenue, By Casting Processes, 2024 – 2032 (Unit) (USD Million) 108
TABLE NO. 38. : Global Foundry Market Volume & Revenue, By Application, 2018 – 2023 (Unit) (USD
Million) 109
TABLE NO. 39. : Global Foundry Market Volume & Revenue, By Application, 2024 – 2032 (Unit) (USD
Million) 109
TABLE NO. 40. : Global Foundry Market Volume & Revenue, By Foundry Size and Scale, 2018 – 2023 (Unit) (USD Million) 110
TABLE NO. 41. : Global Foundry Market Volume & Revenue, By Foundry Size and Scale, 2024 – 2032 (Unit) (USD Million) 110
TABLE NO. 42. : Global Foundry Market Volume & Revenue, By Distribution Channel, 2018 – 2023 (Unit)
(USD Million) 111
TABLE NO. 43. : Global Foundry Market Volume & Revenue, By Distribution Channel, 2024 – 2032 (Unit)
(USD Million) 111
TABLE NO. 44. : North America Foundry Market Volume, By Country, 2018 – 2023 (Unit) 113
TABLE NO. 45. : North America Foundry Market Volume, By Country, 2024 – 2032 (Unit) 113
TABLE NO. 46. : North America Foundry Market Revenue, By Country, 2018 – 2023 (USD Million) 114
TABLE NO. 47. : North America Foundry Market Revenue, By Country, 2024 – 2032 (USD Million) 114
TABLE NO. 48. : North America Foundry Market Volume, By Metal Types, 2018 – 2023 (Unit) 115
TABLE NO. 49. : North America Foundry Market Volume, By Metal Types, 2024 – 2032 (Unit) 115
TABLE NO. 50. : North America Foundry Market Revenue, By Metal Types, 2018 – 2023 (USD Million) 116
TABLE NO. 51. : North America Foundry Market Revenue, By Metal Types, 2024 – 2032 (USD Million) 116
TABLE NO. 52. : North America Foundry Market Volume, By Casting Processes, 2018 – 2023 (Unit) 117
TABLE NO. 53. : North America Foundry Market Volume, By Casting Processes, 2024 – 2032 (Unit) 117
TABLE NO. 54. : North America Foundry Market Revenue, By Casting Processes, 2018 – 2023 (USD Million)118
TABLE NO. 55. : North America Foundry Market Revenue, By Casting Processes, 2024 – 2032 (USD Million)118
TABLE NO. 56. : North America Foundry Market Volume, By Application, 2018 – 2023 (Unit) 119
TABLE NO. 57. : North America Foundry Market Volume, By Application, 2024 – 2032 (Unit) 119
TABLE NO. 58. : North America Foundry Market Revenue, By Application, 2018 – 2023 (USD Million) 120
TABLE NO. 59. : North America Foundry Market Revenue, By Application, 2024 – 2032 (USD Million) 120
TABLE NO. 60. : North America Foundry Market Volume, By Foundry Size and Scale, 2018 – 2023 (Unit) 121
TABLE NO. 61. : North America Foundry Market Volume, By Foundry Size and Scale, 2024 – 2032 (Unit) 121
TABLE NO. 62. : North America Foundry Market Revenue, By Foundry Size and Scale, 2018 – 2023 (USD Million) 122
TABLE NO. 63. : North America Foundry Market Revenue, By Foundry Size and Scale, 2024 – 2032 (USD Million) 122
TABLE NO. 64. : North America Foundry Market Volume, By Distribution Channel, 2018 – 2023 (Unit) 123
TABLE NO. 65. : North America Foundry Market Volume, By Distribution Channel, 2024 – 2032 (Unit) 123
TABLE NO. 66. : North America Foundry Market Revenue, By Distribution Channel, 2018 – 2023 (USD
Million) 124
TABLE NO. 67. : North America Foundry Market Revenue, By Foundry Size and Scale, 2024 – 2032 (USD Million) 124
TABLE NO. 68. : Europe Foundry Market Volume, By Country, 2018 – 2023 (Unit) 127
TABLE NO. 69. : Europe Foundry Market Volume, By Country, 2024 – 2032 (Unit) 127
TABLE NO. 70. : Europe Foundry Market Revenue, By Country, 2018 – 2023 (USD Million) 128
TABLE NO. 71. : Europe Foundry Market Revenue, By Country, 2024 – 2032 (USD Million) 128
TABLE NO. 72. : Europe Foundry Market Volume, By Metal Types, 2018 – 2023 (Unit) 129
TABLE NO. 73. : Europe Foundry Market Volume, By Metal Types, 2024 – 2032 (Unit) 129
TABLE NO. 74. : Europe Foundry Market Revenue, By Metal Types, 2018 – 2023 (USD Million) 130
TABLE NO. 75. : Europe Foundry Market Revenue, By Metal Types, 2024 – 2032 (USD Million) 130
TABLE NO. 76. : Europe Foundry Market Volume, By Casting Processes, 2018 – 2023 (Unit) 131
TABLE NO. 77. : Europe Foundry Market Volume, By Casting Processes, 2024 – 2032 (Unit) 131
TABLE NO. 78. : Europe Foundry Market Revenue, By Casting Processes, 2018 – 2023 (USD Million) 132
TABLE NO. 79. : Europe Foundry Market Revenue, By Casting Processes, 2024 – 2032 (USD Million) 132
TABLE NO. 80. : Europe Foundry Market Volume, By Application, 2018 – 2023 (Unit) 133
TABLE NO. 81. : Europe Foundry Market Volume, By Application, 2024 – 2032 (Unit) 133
TABLE NO. 82. : Europe Foundry Market Revenue, By Application, 2018 – 2023 (USD Million) 134
TABLE NO. 83. : Europe Foundry Market Revenue, By Application, 2024 – 2032 (USD Million) 134
TABLE NO. 84. : Europe Foundry Market Volume, By Foundry Size and Scale, 2018 – 2023 (Unit) 135
TABLE NO. 85. : Europe Foundry Market Volume, By Foundry Size and Scale, 2024 – 2032 (Unit) 135
TABLE NO. 86. : Europe Foundry Market Revenue, By Foundry Size and Scale, 2018 – 2023 (USD Million) 136
TABLE NO. 87. : Europe Foundry Market Revenue, By Foundry Size and Scale, 2024 – 2032 (USD Million) 136
TABLE NO. 88. : Europe Foundry Market Volume, By Distribution Channel, 2018 – 2023 (Unit) 137
TABLE NO. 89. : Europe Foundry Market Volume, By Distribution Channel, 2024 – 2032 (Unit) 137
TABLE NO. 90. : Europe Foundry Market Revenue, By Distribution Channel, 2018 – 2023 (USD Million) 138
TABLE NO. 91. : Europe Foundry Market Revenue, By Foundry Size and Scale, 2024 – 2032 (USD Million) 138
TABLE NO. 92. : Asia Pacific Foundry Market Volume, By Country, 2018 – 2023 (Unit) 141
TABLE NO. 93. : Asia Pacific Foundry Market Volume, By Country, 2024 – 2032 (Unit) 141
TABLE NO. 94. : Asia Pacific Foundry Market Revenue, By Country, 2018 – 2023 (USD Million) 142
TABLE NO. 95. : Asia Pacific Foundry Market Revenue, By Country, 2024 – 2032 (USD Million) 142
TABLE NO. 96. : Asia Pacific Foundry Market Volume, By Metal Types, 2018 – 2023 (Unit) 143
TABLE NO. 97. : Asia Pacific Foundry Market Volume, By Metal Types, 2024 – 2032 (Unit) 143
TABLE NO. 98. : Asia Pacific Foundry Market Revenue, By Metal Types, 2018 – 2023 (USD Million) 144
TABLE NO. 99. : Asia Pacific Foundry Market Revenue, By Metal Types, 2024 – 2032 (USD Million) 144
TABLE NO. 100. : Asia Pacific Foundry Market Volume, By Casting Processes, 2018 – 2023 (Unit) 145
TABLE NO. 101. : Asia Pacific Foundry Market Volume, By Casting Processes, 2024 – 2032 (Unit) 145
TABLE NO. 102. : Asia Pacific Foundry Market Revenue, By Casting Processes, 2018 – 2023 (USD Million) 146
TABLE NO. 103. : Asia Pacific Foundry Market Revenue, By Casting Processes, 2024 – 2032 (USD Million) 146
TABLE NO. 104. : Asia Pacific Foundry Market Volume, By Application, 2018 – 2023 (Unit) 147
TABLE NO. 105. : Asia Pacific Foundry Market Volume, By Application, 2024 – 2032 (Unit) 147
TABLE NO. 106. : Asia Pacific Foundry Market Revenue, By Application, 2018 – 2023 (USD Million) 148
TABLE NO. 107. : Asia Pacific Foundry Market Revenue, By Application, 2024 – 2032 (USD Million) 148
TABLE NO. 108. : Asia Pacific Foundry Market Volume, By Foundry Size and Scale, 2018 – 2023 (Unit) 149
TABLE NO. 109. : Asia Pacific Foundry Market Volume, By Foundry Size and Scale, 2024 – 2032 (Unit) 149
TABLE NO. 110. : Asia Pacific Foundry Market Revenue, By Foundry Size and Scale, 2018 – 2023 (USD
Million) 150
TABLE NO. 111. : Asia Pacific Foundry Market Revenue, By Foundry Size and Scale, 2024 – 2032 (USD
Million) 150
TABLE NO. 112. : Asia Pacific Foundry Market Volume, By Distribution Channel, 2018 – 2023 (Unit) 151
TABLE NO. 113. : Asia Pacific Foundry Market Volume, By Distribution Channel, 2024 – 2032 (Unit) 151
TABLE NO. 114. : Asia Pacific Foundry Market Revenue, By Distribution Channel, 2018 – 2023 (USD Million).152
TABLE NO. 115. : Asia Pacific Foundry Market Revenue, By Foundry Size and Scale, 2024 – 2032 (USD
Million) 152
TABLE NO. 116. : Latin America Foundry Market Volume, By Country, 2018 – 2023 (Unit) 155
TABLE NO. 117. : Latin America Foundry Market Volume, By Country, 2024 – 2032 (Unit) 155
TABLE NO. 118. : Latin America Foundry Market Revenue, By Country, 2018 – 2023 (USD Million) 156
TABLE NO. 119. : Latin America Foundry Market Revenue, By Country, 2024 – 2032 (USD Million) 156
TABLE NO. 120. : Latin America Foundry Market Volume, By Metal Types, 2018 – 2023 (Unit) 157
TABLE NO. 121. : Latin America Foundry Market Volume, By Metal Types, 2024 – 2032 (Unit) 157
TABLE NO. 122. : Latin America Foundry Market Revenue, By Metal Types, 2018 – 2023 (USD Million) 158
TABLE NO. 123. : Latin America Foundry Market Revenue, By Metal Types, 2024 – 2032 (USD Million) 158
TABLE NO. 124. : Latin America Foundry Market Volume, By Casting Processes, 2018 – 2023 (Unit) 159
TABLE NO. 125. : Latin America Foundry Market Volume, By Casting Processes, 2024 – 2032 (Unit) 159
TABLE NO. 126. : Latin America Foundry Market Revenue, By Casting Processes, 2018 – 2023 (USD Million) .160
TABLE NO. 127. : Latin America Foundry Market Revenue, By Casting Processes, 2024 – 2032 (USD Million) .160
TABLE NO. 128. : Latin America Foundry Market Volume, By Application, 2018 – 2023 (Unit) 161
TABLE NO. 129. : Latin America Foundry Market Volume, By Application, 2024 – 2032 (Unit) 161
TABLE NO. 130. : Latin America Foundry Market Revenue, By Application, 2018 – 2023 (USD Million) 162
TABLE NO. 131. : Latin America Foundry Market Revenue, By Application, 2024 – 2032 (USD Million) 162
TABLE NO. 132. : Latin America Foundry Market Volume, By Foundry Size and Scale, 2018 – 2023 (Unit) 163
TABLE NO. 133. : Latin America Foundry Market Volume, By Foundry Size and Scale, 2024 – 2032 (Unit) 163
TABLE NO. 134. : Latin America Foundry Market Revenue, By Foundry Size and Scale, 2018 – 2023 (USD Million) 164
TABLE NO. 135. : Latin America Foundry Market Revenue, By Foundry Size and Scale, 2024 – 2032 (USD Million) 164
TABLE NO. 136. : Latin America Foundry Market Volume, By Distribution Channel, 2018 – 2023 (Unit) 165
TABLE NO. 137. : Latin America Foundry Market Volume, By Distribution Channel, 2024 – 2032 (Unit) 165
TABLE NO. 138. : Latin America Foundry Market Revenue, By Distribution Channel, 2018 – 2023 (USD
Million) 166
TABLE NO. 139. : Latin America Foundry Market Revenue, By Foundry Size and Scale, 2024 – 2032 (USD Million) 166
TABLE NO. 140. : Middle East Foundry Market Volume, By Country, 2018 – 2023 (Unit) 169
TABLE NO. 141. : Middle East Foundry Market Volume, By Country, 2024 – 2032 (Unit) 169
TABLE NO. 142. : Middle East Foundry Market Revenue, By Country, 2018 – 2023 (USD Million) 170
TABLE NO. 143. : Middle East Foundry Market Revenue, By Country, 2024 – 2032 (USD Million) 170
TABLE NO. 144. : Middle East Foundry Market Volume, By Metal Types, 2018 – 2023 (Unit) 171
TABLE NO. 145. : Middle East Foundry Market Volume, By Metal Types, 2024 – 2032 (Unit) 171
TABLE NO. 146. : Middle East Foundry Market Revenue, By Metal Types, 2018 – 2023 (USD Million) 172
TABLE NO. 147. : Middle East Foundry Market Revenue, By Metal Types, 2024 – 2032 (USD Million) 172
TABLE NO. 148. : Middle East Foundry Market Volume, By Casting Processes, 2018 – 2023 (Unit) 173
TABLE NO. 149. : Middle East Foundry Market Volume, By Casting Processes, 2024 – 2032 (Unit) 173
TABLE NO. 150. : Middle East Foundry Market Revenue, By Casting Processes, 2018 – 2023 (USD Million) 174
TABLE NO. 151. : Middle East Foundry Market Revenue, By Casting Processes, 2024 – 2032 (USD Million) 174
TABLE NO. 152. : Middle East Foundry Market Volume, By Application, 2018 – 2023 (Unit) 175
TABLE NO. 153. : Middle East Foundry Market Volume, By Application, 2024 – 2032 (Unit) 175
TABLE NO. 154. : Middle East Foundry Market Revenue, By Application, 2018 – 2023 (USD Million) 176
TABLE NO. 155. : Middle East Foundry Market Revenue, By Application, 2024 – 2032 (USD Million) 176
TABLE NO. 156. : Middle East Foundry Market Volume, By Foundry Size and Scale, 2018 – 2023 (Unit) 177
TABLE NO. 157. : Middle East Foundry Market Volume, By Foundry Size and Scale, 2024 – 2032 (Unit) 177
TABLE NO. 158. : Middle East Foundry Market Revenue, By Foundry Size and Scale, 2018 – 2023 (USD
Million) 178
TABLE NO. 159. : Middle East Foundry Market Revenue, By Foundry Size and Scale, 2024 – 2032 (USD
Million) 178
TABLE NO. 160. : Middle East Foundry Market Volume, By Distribution Channel, 2018 – 2023 (Unit) 179
TABLE NO. 161. : Middle East Foundry Market Volume, By Distribution Channel, 2024 – 2032 (Unit) 179
TABLE NO. 162. : Middle East Foundry Market Revenue, By Distribution Channel, 2018 – 2023 (USD Million)180
TABLE NO. 163. : Middle East Foundry Market Revenue, By Foundry Size and Scale, 2024 – 2032 (USD
Million) 180
TABLE NO. 164. : Africa Foundry Market Volume, By Country, 2018 – 2023 (Unit) 183
TABLE NO. 165. : Africa Foundry Market Volume, By Country, 2024 – 2032 (Unit) 183
TABLE NO. 166. : Africa Foundry Market Revenue, By Country, 2018 – 2023 (USD Million) 184
TABLE NO. 167. : Africa Foundry Market Revenue, By Country, 2024 – 2032 (USD Million) 184
TABLE NO. 168. : Africa Foundry Market Volume, By Metal Types, 2018 – 2023 (Unit) 185
TABLE NO. 169. : Africa Foundry Market Volume, By Metal Types, 2024 – 2032 (Unit) 185
TABLE NO. 170. : Africa Foundry Market Revenue, By Metal Types, 2018 – 2023 (USD Million) 186
TABLE NO. 171. : Africa Foundry Market Revenue, By Metal Types, 2024 – 2032 (USD Million) 186
TABLE NO. 172. : Africa Foundry Market Volume, By Casting Processes, 2018 – 2023 (Unit) 187
TABLE NO. 173. : Africa Foundry Market Volume, By Casting Processes, 2024 – 2032 (Unit) 187
TABLE NO. 174. : Africa Foundry Market Revenue, By Casting Processes, 2018 – 2023 (USD Million) 188
TABLE NO. 175. : Africa Foundry Market Revenue, By Casting Processes, 2024 – 2032 (USD Million) 188
TABLE NO. 176. : Africa Foundry Market Volume, By Application, 2018 – 2023 (Unit) 189
TABLE NO. 177. : Africa Foundry Market Volume, By Application, 2024 – 2032 (Unit) 189
TABLE NO. 178. : Africa Foundry Market Revenue, By Application, 2018 – 2023 (USD Million) 190
TABLE NO. 179. : Africa Foundry Market Revenue, By Application, 2024 – 2032 (USD Million) 190
TABLE NO. 180. : Africa Foundry Market Volume, By Foundry Size and Scale, 2018 – 2023 (Unit) 191
TABLE NO. 181. : Africa Foundry Market Volume, By Foundry Size and Scale, 2024 – 2032 (Unit) 191
TABLE NO. 182. : Africa Foundry Market Revenue, By Foundry Size and Scale, 2018 – 2023 (USD Million) 192
TABLE NO. 183. : Africa Foundry Market Revenue, By Foundry Size and Scale, 2024 – 2032 (USD Million) 192
TABLE NO. 184. : Africa Foundry Market Volume, By Distribution Channel, 2018 – 2023 (Unit) 193
TABLE NO. 185. : Africa Foundry Market Volume, By Distribution Channel, 2024 – 2032 (Unit) 193
TABLE NO. 186. : Africa Foundry Market Revenue, By Distribution Channel, 2018 – 2023 (USD Million) 194
TABLE NO. 187. : Africa Foundry Market Revenue, By Foundry Size and Scale, 2024 – 2032 (USD Million) 194


Request Free Sample

We prioritize the confidentiality and security of your data. Our promise: your information remains private.

Ready to Transform Data into Decisions?

Request Your Sample Report and Start Your Journey of Informed Choices


Providing the strategic compass for industry titans.

cr-clients-logos
What is the current market size for the Foundry market, and what is its projected size in 2032?

The Foundry market was valued at USD 125.56 billion in 2023 and is projected to reach USD 171.70 billion by 2032.

At what Compound Annual Growth Rate is the Foundry market projected to grow between 2025 and 2032?

The market is expected to grow at a CAGR of 3.99% during the forecast period.

Which Foundry market segment held the largest share in 2024?

The sand-casting segment dominated the market in 2024 with around 42% share.

What are the primary factors fueling the growth of the Foundry market?

Key drivers include rising automotive production, infrastructure expansion, and advancements in casting automation technologies.

Who are the leading companies in the Foundry market?

Major players include JSW Steel Ltd., Kirloskar Ferrous Industries Ltd., Larsen & Toubro Ltd., and Electrosteel Castings Ltd.

Which region commanded the largest share of the Foundry market in 2024?

Asia-Pacific led the market with about 39% share, driven by strong demand in China and India.

About Author

Ganesh Chandwade

Ganesh Chandwade

Senior Industry Consultant

Ganesh is a senior industry consultant specializing in heavy industries and advanced materials.

View Profile

Related Reports

Scandium Metal Market

The global demand for the Scandium Metal Market was valued at USD 611.95 Million in 2024 is expected to reach USD 1,205.89 Million in 2032 growing at a CAGR of 8.70% between 2025 and 2032.

Sealless Magnetic Drive Pump Market

Seal Less Magnetic Drive Pump Market size was valued at USD 3797.5 Million in 2024 and is anticipated to reach USD 5568.03 Million by 2032, at a CAGR of 4.9% during the forecast period.

Biomining Market

The Biomining Market was valued at USD 11 billion in 2024 and is projected to reach USD 27.3 billion by 2032, growing at a 12.33% CAGR during the forecast period.

Collapsible Metal Tubes Market

The Collapsible Metal Tubes Market size was valued at USD 1.09 billion in 2024 and is anticipated to reach USD 1.51 billion by 2032, growing at a CAGR of 4.2% during the forecast period.

Aluminium Flat Products Market

The Aluminium Flat Products Market was valued at USD 61,564 million in 2024 and is projected to reach USD 86,882 million by 2032, growing at a CAGR of 4.4% during the forecast period.

Electrical Steel Market

Electrical Steel Market was valued USD 45.05 billion in 2024 and is anticipated to reach USD 72.34 billion by 2032, at a CAGR of 6.1% during the forecast period.

Aluminum Alloys Market

Aluminum Alloys Market size was valued at USD 136,192 million in 2024 and is anticipated to reach USD 223,710 million by 2032, growing at a CAGR of 6.4% during the forecast period.

Electric Mining Equipment Market

The Electric Mining Equipment Market size was valued at USD 2,100.00 million in 2018, increasing to USD 3,256.08 million in 2024, and is anticipated to reach USD 9,881.20 million by 2032, growing at a CAGR of 15.02% during the forecast period.

Mining Pipe Market

The Global Mining Pipe Market size was valued at USD 4,955.75 million in 2018 to USD  7,446.43 million in 2024 and is anticipated to reach USD  12,811.36 million by 2032, at a CAGR of 6.53% during the forecast period.

Endodontic Files Market

Endodontic Files Market size was valued USD 338.5 million in 2024 and is anticipated to reach USD 575.55 million by 2032, at a CAGR of 6.86% during the forecast period.

Ferromanganese Market

Ferromanganese Market size was valued USD 12.41 billion in 2024 and is anticipated to reach USD 16.36 billion by 2032, at a CAGR of 3.52% during the forecast period.

Safety Valves Market

Safety Valves Market size was valued at USD 7.75 Billion in 2024 and is anticipated to reach USD 14.57 Billion by 2032, at a CAGR of 8.21% during the forecast period.

Licence Option

The report comes as a view-only PDF document, optimized for individual clients. This version is recommended for personal digital use and does not allow printing. Use restricted to one purchaser only.
$4999

To meet the needs of modern corporate teams, our report comes in two formats: a printable PDF and a data-rich Excel sheet. This package is optimized for internal analysis. Unlimited users allowed within one corporate location (e.g., regional office).
$6999

The report will be delivered in printable PDF format along with the report’s data Excel sheet. This license offers 100 Free Analyst hours where the client can utilize Credence Research Inc. research team. Permitted for unlimited global use by all users within the purchasing corporation, such as all employees of a single company.
$12999

Report delivery within 24 to 48 hours

Credence Staff 3

WILLIAM, North America

Support Staff at Credence Research

KEITH PHILLIPS, Europe

Lee - CR Sales Staff

LEE VALLANCE, Asia Pacific

Kieran Jameson

KIERAN JAMESON, Australia

Smallform of Sample request
User Review

Thank you for the data! The numbers are exactly what we asked for and what we need to build our business case.

Materials Scientist
(privacy requested)

User Review

The report was an excellent overview of the Industrial Burners market. This report does a great job of breaking everything down into manageable chunks.

Imre Hof
Management Assistant, Bekaert

cr-clients-logos

Request Sample