CHAPTER NO. 1 : GENESIS OF THE MARKET
1.1 Market Prelude – Introduction & Scope
1.2 The Big Picture – Objectives & Vision
1.3 Strategic Edge – Unique Value Proposition
1.4 Stakeholder Compass – Key Beneficiaries
CHAPTER NO. 2 : EXECUTIVE LENS
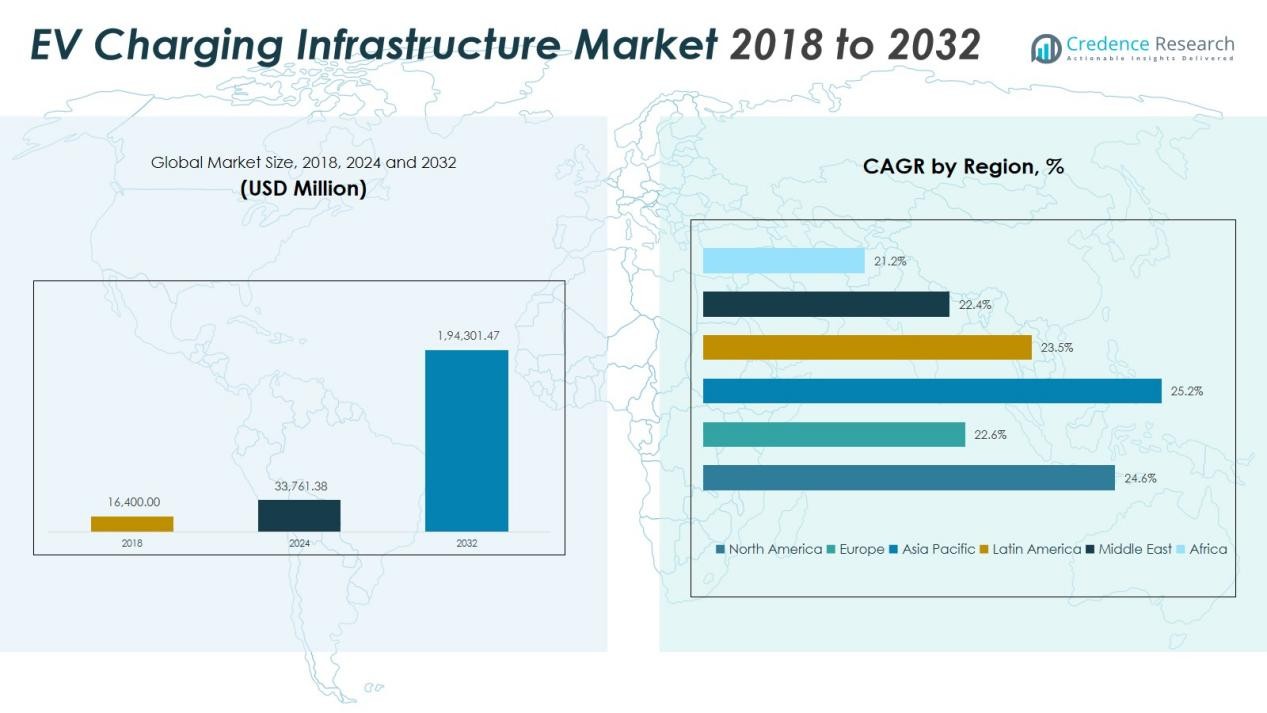
2.1 Pulse of the Industry – Market Snapshot
2.2 Growth Arc – Revenue Projections (USD Million)
2.3. Premium Insights – Based on Primary Interviews
CHAPTER NO. 3 : EV CHARGING INFRASTRUCTURE MARKET FORCES & INDUSTRY PULSE
3.1 Foundations of Change – Market Overview
3.2 Catalysts of Expansion – Key Market Drivers
3.2.1 Momentum Boosters – Growth Triggers
3.2.2 Innovation Fuel – Disruptive Technologies
3.3 Headwinds & Crosswinds – Market Restraints
3.3.1 Regulatory Tides – Compliance Challenges
3.3.2 Economic Frictions – Inflationary Pressures
3.4 Untapped Horizons – Growth Potential & Opportunities
3.5 Strategic Navigation – Industry Frameworks
3.5.1 Market Equilibrium – Porter’s Five Forces
3.5.2 Ecosystem Dynamics – Value Chain Analysis
3.5.3 Macro Forces – PESTEL Breakdown
3.6 Price Trend Analysis
3.6.1 Regional Price Trend
3.6.2 Price Trend by product
CHAPTER NO. 4 : KEY INVESTMENT EPICENTER
4.1 Regional Goldmines – High-Growth Geographies
4.2 Product Frontiers – Lucrative Product Categories
4.3 Application Sweet Spots – Emerging Demand Segments
CHAPTER NO. 5: REVENUE TRAJECTORY & WEALTH MAPPING
5.1 Momentum Metrics – Forecast & Growth Curves
5.2 Regional Revenue Footprint – Market Share Insights
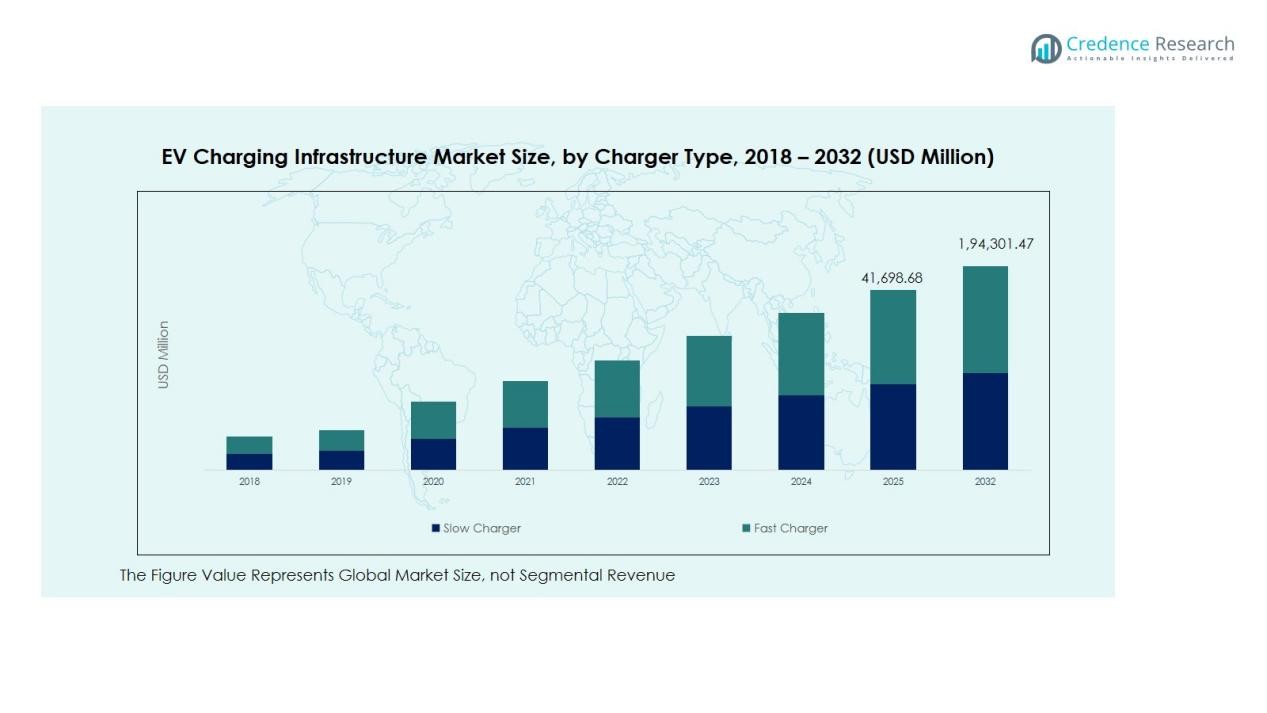
5.3 Segmental Wealth Flow – Charger Type & Application Revenue
CHAPTER NO. 6 : TRADE & COMMERCE ANALYSIS
6.1. Import Analysis by Region
6.1.1. Global EV Charging Infrastructure Market Import Revenue By Region
6.2. Export Analysis by Region
6.2.1. Global EV Charging Infrastructure Market Export Revenue By Region
CHAPTER NO. 7 : COMPETITION ANALYSIS
7.1. Company Market Share Analysis
7.1.1. Global EV Charging Infrastructure Market: Company Market Share
7.2. Global EV Charging Infrastructure Market Company Revenue Market Share
7.3. Strategic Developments
7.3.1. Acquisitions & Mergers
7.3.2. New Product Launch
7.3.3. Regional Expansion
7.4. Competitive Dashboard
7.5. Company Assessment Metrics, 2024
CHAPTER NO. 8 : EV CHARGING INFRASTRUCTURE MARKET – BY CHARGER TYPE SEGMENT ANALYSIS
8.1. EV Charging Infrastructure Market Overview by Charger Type Segment
8.1.1. EV Charging Infrastructure Market Revenue Share By Charger Type
8.2. Slow Charger
8.3. Fast Charger
CHAPTER NO. 9 : EV CHARGING INFRASTRUCTURE MARKET – BY APPLICATION SEGMENT ANALYSIS
9.1. EV Charging Infrastructure Market Overview by Application Segment
9.1.1. EV Charging Infrastructure Market Revenue Share By Application
9.2. Commercial
9.2.1 Destination Charging Stations
9.2.2 Highway Charging Stations
9.2.3 Bus Charging Stations
9.2.4 Fleet Charging Stations
9.2.5 Other Charging Stations
9.3. Residential
9.3.1 Private Houses
9.3.2 Apartments/Societies
CHAPTER NO. 10 : EV CHARGING INFRASTRUCTURE MARKET – BY CONNECTOR TYPE SEGMENT ANALYSIS
10.1. EV Charging Infrastructure Market Overview by Connector Type Segment
10.1.1. EV Charging Infrastructure Market Revenue Share By Connector Type
10.2. CHAdeMO
10.3. CCS
10.4. Others
CHAPTER NO. 11 : EV CHARGING INFRASTRUCTURE MARKET – BY LEVEL OF CHARGING SEGMENT ANALYSIS
11.1. EV Charging Infrastructure Market Overview by Level of Charging
11.1.1. EV Charging Infrastructure Market Revenue Share By Level of Charging
11.2. Level 1
11.3. Level 2
11.4. Level 3
CHAPTER NO. 12 : EV CHARGING INFRASTRUCTURE MARKET – BY OPERATION SEGMENT ANALYSIS
12.1. EV Charging Infrastructure Market Overview by Operation Segment
12.1.1. EV Charging Infrastructure Market Revenue Share By Operation
12.2. Mode 1
12.3. Mode 2
12.4. Mode 3
12.5. Mode 4
CHAPTER NO. 13 : EV CHARGING INFRASTRUCTURE MARKET – REGIONAL ANALYSIS
13.1. EV Charging Infrastructure Market Overview by Region Segment
13.1.1. Global EV Charging Infrastructure Market Revenue Share By Region
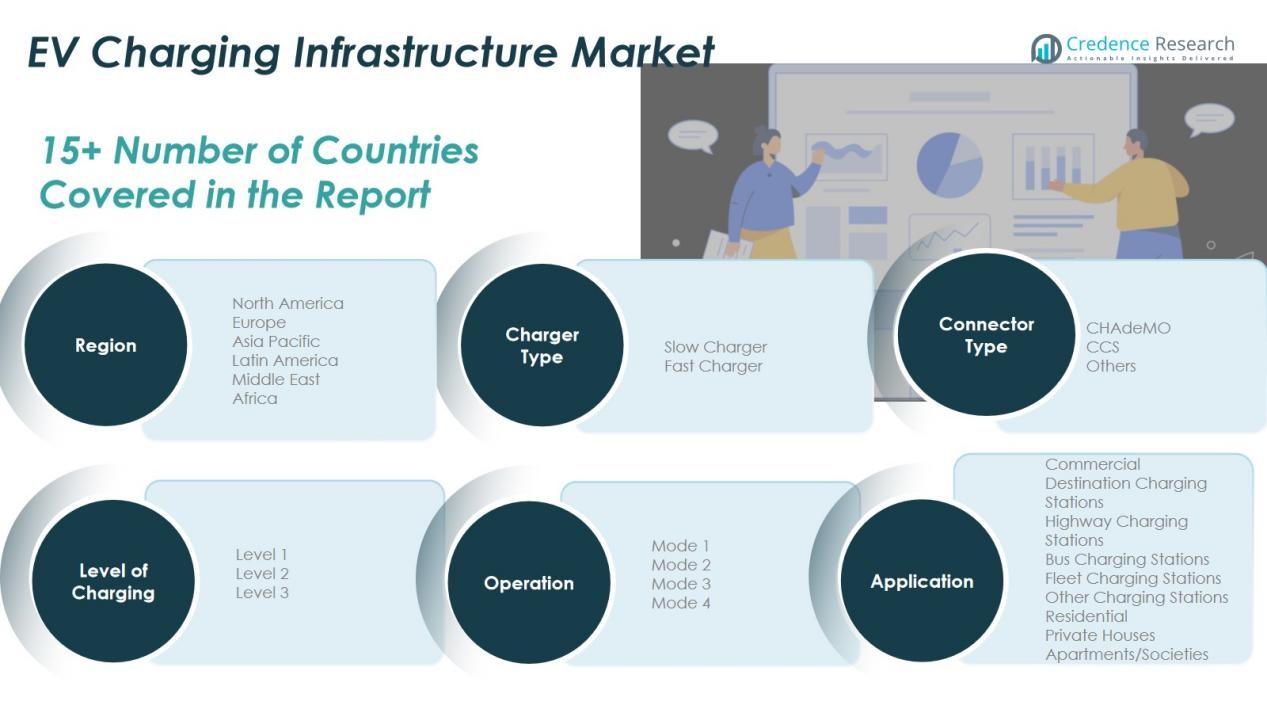
13.1.2. Regions
13.1.3. Global EV Charging Infrastructure Market Revenue By Region
13.1.4. Charger Type
13.1.5. Global EV Charging Infrastructure Market Revenue By Charger Type
13.1.6. Application
13.1.7. Global EV Charging Infrastructure Market Revenue By Application
13.1.8. Connector Type
13.1.9. Global EV Charging Infrastructure Market Revenue By Connector Type
13.1.10. Level of Charging
13.1.12. Global EV Charging Infrastructure Market Revenue By Level of Charging
13.1.13. Operation
13.1.14. Global EV Charging Infrastructure Market Revenue By Operation
CHAPTER NO. 14 : NORTH AMERICA EV CHARGING INFRASTRUCTURE MARKET – COUNTRY ANALYSIS
14.1. North America EV Charging Infrastructure Market Overview by Country Segment
14.1.1. North America EV Charging Infrastructure Market Revenue Share By Region
14.2. North America
14.2.1. North America EV Charging Infrastructure Market Revenue By Country
14.2.2. Charger Type
14.2.3. North America EV Charging Infrastructure Market Revenue By Charger Type
14.2.4. Application
14.2.5. North America EV Charging Infrastructure Market Revenue By Application
14.2.6. Connector Type
14.2.7. North America EV Charging Infrastructure Market Revenue By Connector Type
14.2.8. Level of Charging
14.2.9. North America EV Charging Infrastructure Market Revenue By Level of Charging
14.2.10. Operation
14.2.11. North America EV Charging Infrastructure Market Revenue By Operation
14.3. U.S.
14.4. Canada
14.5. Mexico
CHAPTER NO. 15 : EUROPE EV CHARGING INFRASTRUCTURE MARKET – COUNTRY ANALYSIS
15.1. Europe EV Charging Infrastructure Market Overview by Country Segment
15.1.1. Europe EV Charging Infrastructure Market Revenue Share By Region
15.2. Europe
15.2.1. Europe EV Charging Infrastructure Market Revenue By Country
15.2.2. Charger Type
15.2.3. Europe EV Charging Infrastructure Market Revenue By Charger Type
15.2.4. Application
15.2.5. Europe EV Charging Infrastructure Market Revenue By Application
15.2.6. Connector Type
15.2.7. Europe EV Charging Infrastructure Market Revenue By Connector Type
15.2.8. Level of Charging
15.2.9. Europe EV Charging Infrastructure Market Revenue By Level of Charging
15.2.10. Operation
15.2.11. Europe EV Charging Infrastructure Market Revenue By Operation
15.3. UK
15.4. France
15.5. Germany
15.6. Italy
15.7. Spain
15.8. Russia
15.9. Rest of Europe
CHAPTER NO. 16 : ASIA PACIFIC EV CHARGING INFRASTRUCTURE MARKET – COUNTRY ANALYSIS
16.1. Asia Pacific EV Charging Infrastructure Market Overview by Country Segment
16.1.1. Asia Pacific EV Charging Infrastructure Market Revenue Share By Region
16.2. Asia Pacific
16.2.1. Asia Pacific EV Charging Infrastructure Market Revenue By Country
16.2.2. Charger Type
16.2.3. Asia Pacific EV Charging Infrastructure Market Revenue By Charger Type
16.2.4. Application
16.2.5. Asia Pacific EV Charging Infrastructure Market Revenue By Application
16.2.6. Connector Type
16.2.7. Asia Pacific EV Charging Infrastructure Market Revenue By Connector Type
16.2.8. Level of Charging
16.2.9. Asia Pacific EV Charging Infrastructure Market Revenue By Level of Charging
16.2.10. Operation
16.2.11. Asia Pacific EV Charging Infrastructure Market Revenue By Operation
16.3. China
16.4. Japan
16.5. South Korea
16.6. India
16.7. Australia
16.8. Southeast Asia
16.9. Rest of Asia Pacific
CHAPTER NO. 17 : LATIN AMERICA EV CHARGING INFRASTRUCTURE MARKET – COUNTRY ANALYSIS
17.1. Latin America EV Charging Infrastructure Market Overview by Country Segment
17.1.1. Latin America EV Charging Infrastructure Market Revenue Share By Region
17.2. Latin America
17.2.1. Latin America EV Charging Infrastructure Market Revenue By Country
17.2.2. Charger Type
17.2.3. Latin America EV Charging Infrastructure Market Revenue By Charger Type
17.2.4. Application
17.2.5. Latin America EV Charging Infrastructure Market Revenue By Application
17.2.6. Connector Type
17.2.7. Latin America EV Charging Infrastructure Market Revenue By Connector Type
17.2.8. Level of Charging
17.2.9. Latin America EV Charging Infrastructure Market Revenue By Level of Charging
17.2.10. Operation
17.2.11. Latin America EV Charging Infrastructure Market Revenue By Operation
17.3. Brazil
17.4. Argentina
17.5. Rest of Latin America
CHAPTER NO. 18 : MIDDLE EAST EV CHARGING INFRASTRUCTURE MARKET – COUNTRY ANALYSIS
18.1. Middle East EV Charging Infrastructure Market Overview by Country Segment
18.1.1. Middle East EV Charging Infrastructure Market Revenue Share By Region
18.2. Middle East
18.2.1. Middle East EV Charging Infrastructure Market Revenue By Country
18.2.2. Charger Type
18.2.3. Middle East EV Charging Infrastructure Market Revenue By Charger Type
18.2.4. Application
18.2.5. Middle East EV Charging Infrastructure Market Revenue By Application
18.2.6. Connector Type
18.2.7. Middle East EV Charging Infrastructure Market Revenue By Connector Type
18.2.8. Level of Charging
18.2.9. Middle East EV Charging Infrastructure Market Revenue By Level of Charging
18.2.10. Operation
18.2.11. Middle East EV Charging Infrastructure Market Revenue By Operation
18.3. GCC Countries
18.4. Israel
18.5. Turkey
18.6. Rest of Middle East
CHAPTER NO. 19 : AFRICA EV CHARGING INFRASTRUCTURE MARKET – COUNTRY ANALYSIS
19.1. Africa EV Charging Infrastructure Market Overview by Country Segment
19.1.1. Africa EV Charging Infrastructure Market Revenue Share By Region
19.2. Africa
19.2.1. Africa EV Charging Infrastructure Market Revenue By Country
19.2.2. Charger Type
19.2.3. Africa EV Charging Infrastructure Market Revenue By Charger Type
19.2.4. Application
19.2.5. Africa EV Charging Infrastructure Market Revenue By Application
19.2.6. Connector Type
19.2.7. Africa EV Charging Infrastructure Market Revenue By Connector Type
19.2.8. Level of Charging
19.2.9. Africa EV Charging Infrastructure Market Revenue By Level of Charging
19.2.10. Operation
19.2.11. Africa EV Charging Infrastructure Market Revenue By Operation
19.3. South Africa
19.4. Egypt
19.5. Rest of Africa
CHAPTER NO. 20 : COMPANY PROFILES
20.1. ABB Ltd.
20.1.1. Company Overview
20.1.2. Product Portfolio
20.1.3. Financial Overview
20.1.4. Recent Developments
20.1.5. Growth Strategy
20.1.6. SWOT Analysis
20.2. ChargePoint, Inc.
20.3. Leviton Manufacturing Co., Inc.
20.4. Blink Charging Co.
20.5. Tesla Inc.
20.6. Webasto Group
20.7. Eaton Corporation plc
20.8. Schneider Electric
20.9. Siemens
20.10. Broadband TelCom Power, Inc.
20.11. Delta Electronics, Inc.
20.12. Tritium DCFC Limited