
A licensed, import-only solvent bought by qualified users
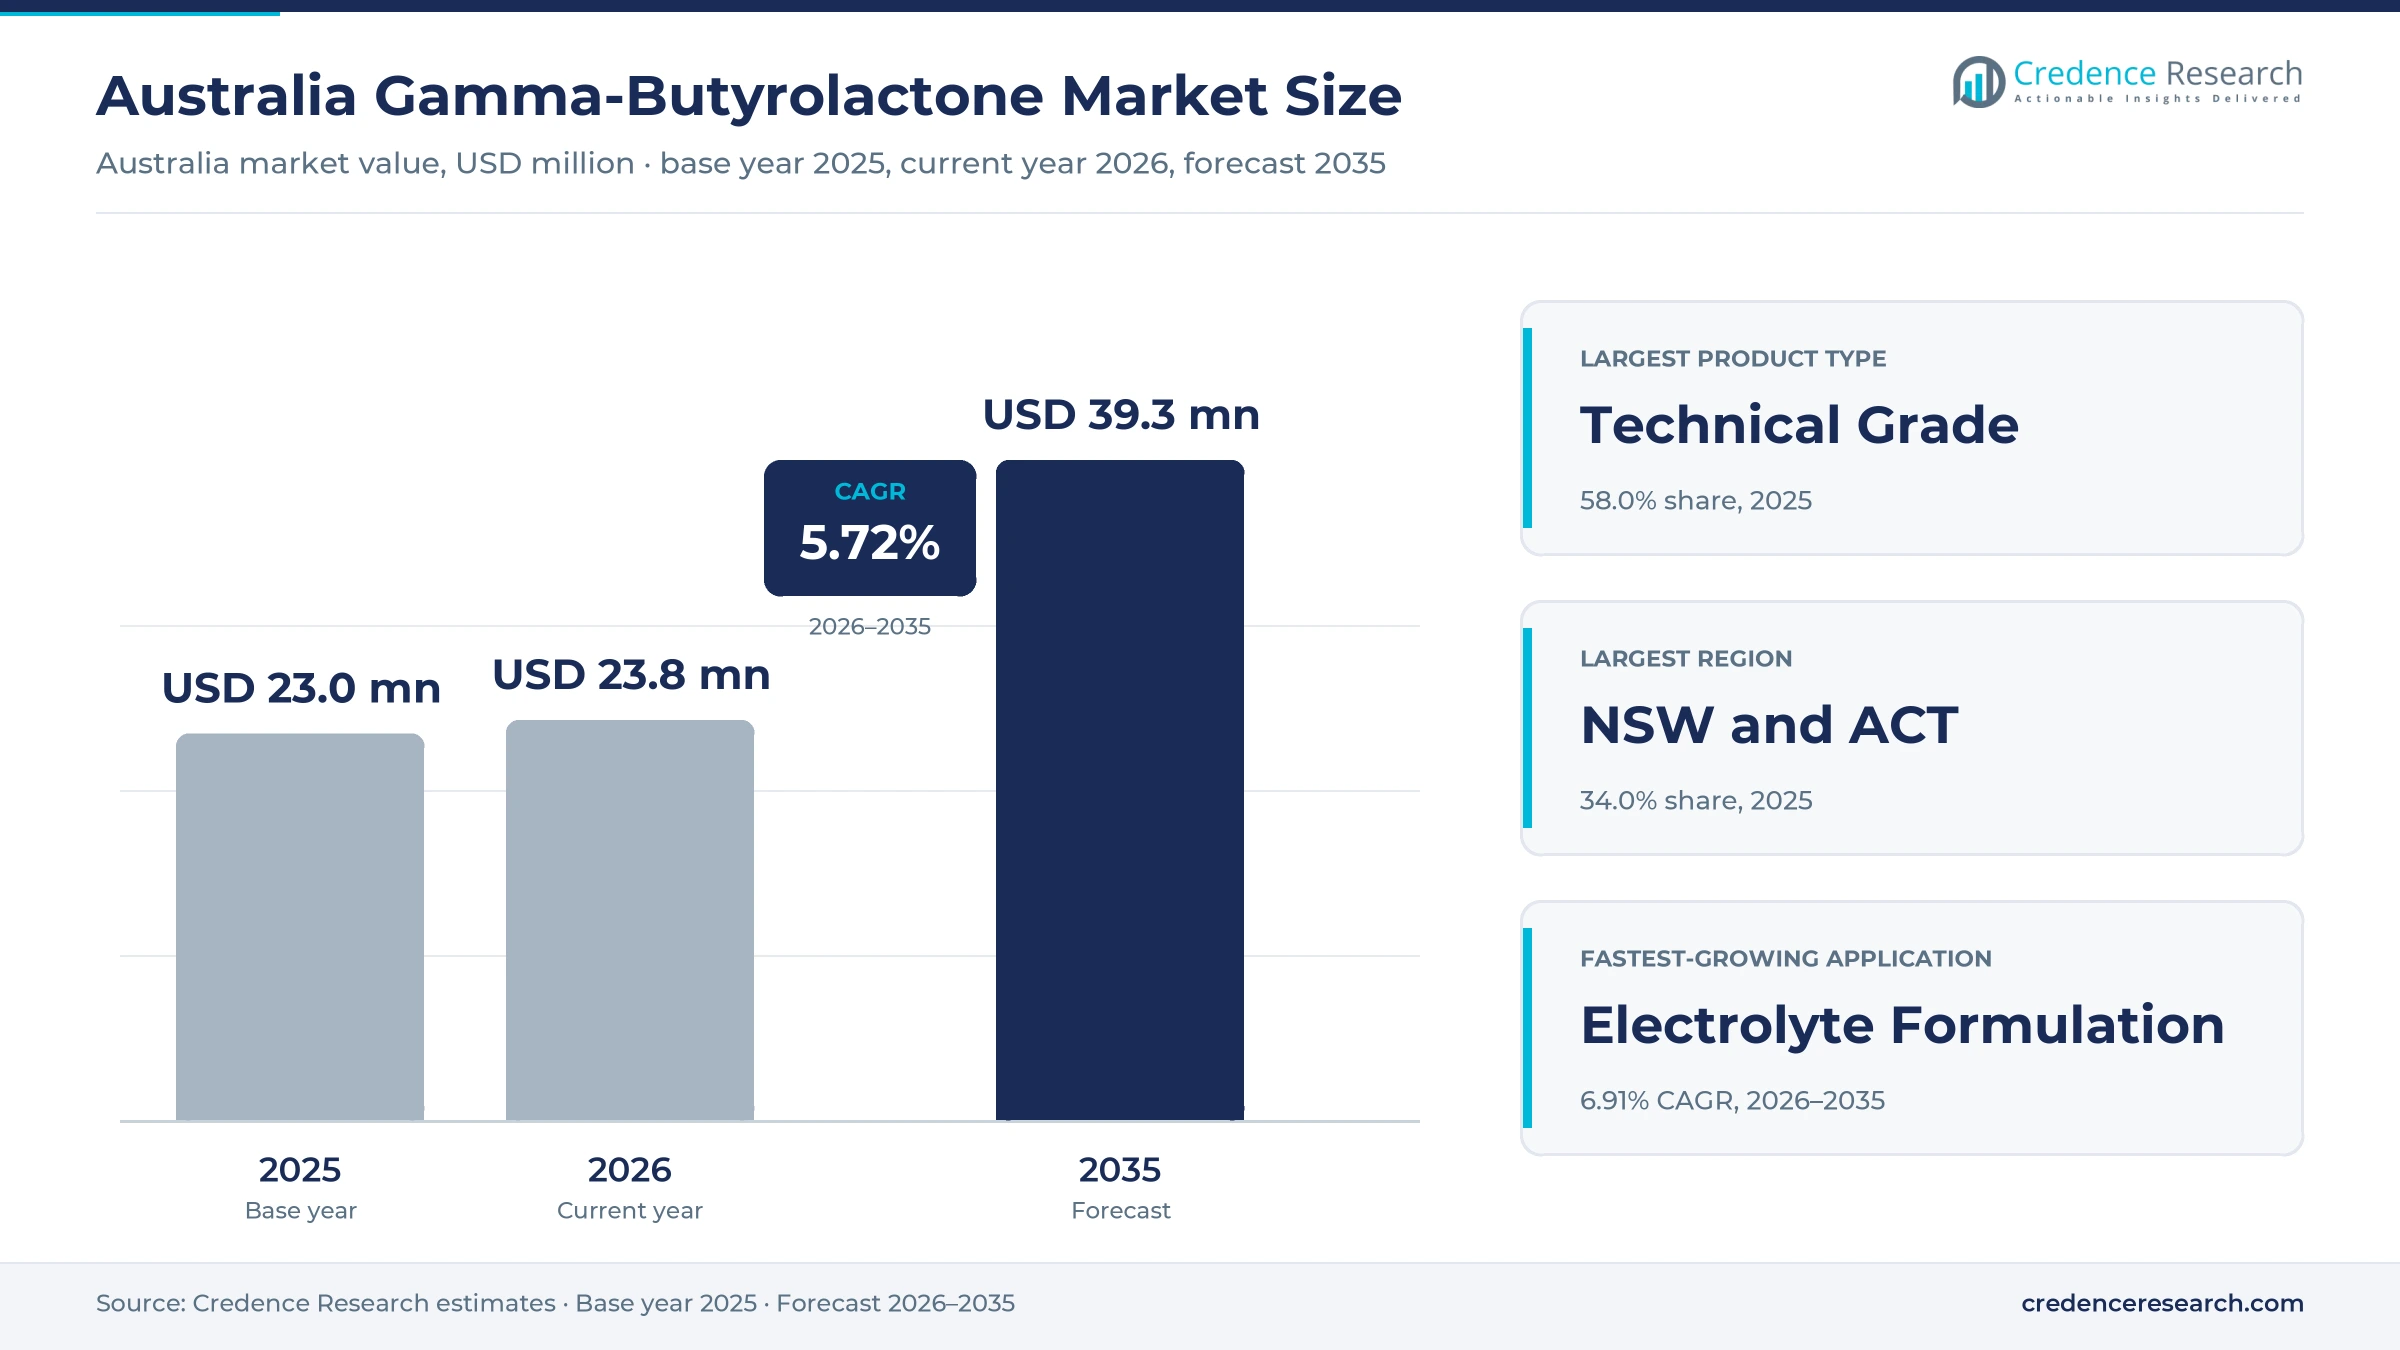
The Australia gamma-butyrolactone market was valued at USD 23.0 million in 2025 and is projected to increase from USD 23.8 million in 2026 to USD 39.3 million by 2035, registering a CAGR of 5.72% during 2026–2035. Demand comes from surface treatment and electronics plants that use the solvent in cleaning and stripping steps, from chemical synthesis and from laboratories that need certified standards for quality control. Because gamma-butyrolactone is a controlled precursor, every consignment enters under an import license and permit issued by the Office of Drug Control. New South Wales and Australian Capital Territory held the largest regional share, 34.0% in 2025, as the zone carries the highest business research spending. Queensland is the fastest-growing zone at 5.87% a year, helped by battery manufacturing plans. Meanwhile, federal customs regulations were amended in February 2025 to extend the list of controlled substances, which keeps compliance central to every supply decision.
Which grades and pack formats does the estimate cover?
Sales of gamma-butyrolactone to users in Australia form the measured value, across technical grade, high-purity grade and analytical standards. It covers drums and bulk containers shipped to licensed industrial users as well as laboratory packs and certified reference materials sold through catalog suppliers and specialist distributors.
The estimate excludes 1,4-butanediol, pyrrolidone solvents made from the lactone, finished electrolyte solutions and formulated stripping products. The value chain runs from producers in China, Europe and the United States through licensed importers and authorized distributors to production plants, contract formulators and research laboratories.
Australia Gamma-Butyrolactone Market Insights
- The Australia gamma-butyrolactone market was valued at USD 23.0 million in 2025 and is projected to reach USD 39.3 million by 2035, registering a CAGR of 5.72% during 2026–2035.
- New South Wales and Australian Capital Territory held 34.0% of 2025 value, as New South Wales recorded A$9,630 million of business R&D in 2023-24.
- Technical grade material led with 58.0% of 2025 value, because plants that clean, strip and synthesize buy drums rather than laboratory packs.
- Australia imported 1,112.6 metric tons of HS 293220 lactones worth USD 13.07 million in 2024, and China supplied 1,073.6 tons of that weight, according to UN Comtrade.
- Each import consignment needs its own Office of Drug Control permit on top of an annual license, which favors distributors that already hold both.
Technical grade leads while electrolyte work grows fastest
Why does technical grade hold the largest share?
Based on product type, the market is categorized into technical grade, high-purity grade and analytical standards. Technical Grade led with a 58.0% share of 2025 value, because surface treatment and synthesis users buy drums for qualified process steps. Analytical Standards grow fastest at 6.41% a year, as testing laboratories need certified material to confirm identity and purity in quality control work.
Which industries account for most purchases?
Based on end-use industry, the market is categorized into surface treatment manufacturing, electronics manufacturing, energy materials and scientific chemical supply. Surface Treatment Manufacturing led with a 36.0% share of 2025 value, because stripping and cleaning lines use the solvent in recurring volumes. Energy Materials grow fastest at 6.90% a year, as federal battery programs fund local cell and component development.
How do cleaning, synthesis and electrolyte uses differ?
Based on application, the market is categorized into surface treatment, precision cleaning, chemical synthesis and electrolyte formulation. Surface Treatment led with a 35.0% share of 2025 value, because paint and coating removal uses larger quantities per batch than other steps. Electrolyte Formulation grows fastest at 6.92% a year, as the solvent's high dielectric constant suits capacitor and battery electrolyte development.
How do Australian buyers source the solvent?
Based on sales channel, the market is categorized into authorized distribution, direct import and specialist laboratory supply. Authorized Distribution led with a 44.0% share of 2025 value, because distributors already hold import licenses and manage end-user declarations for customers. Specialist Laboratory Supply grows fastest at 6.40% a year, as accredited laboratories order certified standards through local reference material distributors.
| Segment Group | Leading Sub-segment | Share, 2025 | Fastest-growing Sub-segment | CAGR, 2026–2035 |
|---|---|---|---|---|
| By Product Type | Technical Grade | 58.0% | Analytical Standards | 6.41% |
| By End-Use Industry | Surface Treatment Manufacturing | 36.0% | Energy Materials | 6.90% |
| By Application | Surface Treatment | 35.0% | Electrolyte Formulation | 6.92% |
| By Sales Channel | Authorized Distribution | 44.0% | Specialist Laboratory Supply | 6.40% |
Request a Free Sample
Fill in your details and we'll send you a free sample report.
- Sample data tables & charts
- Research methodology
Process qualification and lab quality checks sustain demand
How does qualified process demand anchor technical volumes?
Industrial users buy gamma-butyrolactone because it has been qualified into process steps that are costly to change. Ashland's product literature lists the solvent for cleaning circuit boards, as a co-solvent in photoresist strippers and as the precursor to 2-pyrrolidone and alkyl pyrrolidones. Australia imported 1,112.6 metric tons of HS 293220 lactones in 2024, worth USD 13.07 million, according to UN Comtrade, up from 973.9 tons in 2023. Because the customs code also covers other lactones, these figures show the scale of supply rather than the solvent alone. As a result, technical grade material held a 58.0% share of 2025 value, the largest product group.
Why does laboratory quality control lift high-purity orders?
Every licensed user must document what it receives, so laboratory checks of identity and purity sit beside each industrial consignment. Business R&D in Australia reached A$24,410 million in 2023-24, according to the Australian Bureau of Statistics, up 18% from 2021-22. Professional, scientific and technical services spent A$9,171 million of that total, and manufacturing spent A$5,047 million. The National Association of Testing Authorities, set up by the federal government in 1947, uses ISO/IEC 17025 as the main accreditation criteria for most laboratories. In turn, high-purity grade material grows faster than technical grade, as licensed buyers add more identity and purity checks to each lot.
How do reagent specifications shape standards demand?
Australian catalogs set clear purity and pack specifications, which lets laboratories match each grade to its test method. Tokyo Chemical Industry lists its gamma-butyrolactone at more than 99.0% by gas chromatography, in 25 mL and 500 mL bottles priced at A$41 and A$129, ordered through ChemSupply Australia. Merck sells a Supelco analytical standard of at least 99.0% and a ReagentPlus grade of at least 99%. LGC Standards offers a neat Dr. Ehrenstorfer reference material made in Germany, which Novachem distributes from Melbourne. Because each test method names a grade, laboratories rarely switch suppliers once a standard is validated. As a result, analytical standards grow at 6.41% a year, the fastest product group.
Does licensed import favor authorized distribution?
Gamma-butyrolactone is on the list of precursor substances that need both an annual license and a permit for each consignment, according to Office of Drug Control guidance. Importers must attach an end-user declaration describing the intended use, and signed customer declarations when they supply nominated buyers. The office aims to process correct applications within 20 business days, and most within 10 days. Small users therefore prefer to buy from distributors that already hold licenses and manage the paperwork on their behalf. That arrangement also gives distributors repeat orders and better visibility of customer demand. Consequently, authorized distribution held a 44.0% share of 2025 value, the largest sales channel.
Battery policy and traceable supply reshape buying
Is battery policy raising electrolyte interest?
Federal battery policy is increasing interest in solvents used in energy storage components. The National Battery Strategy commits A$523.2 million to Battery Breakthrough production incentives and A$20.3 million to build future battery capabilities. It also provides A$5.6 million for an Australian Made Battery Precinct, with up to A$100 million committed alongside the Queensland Government. A 1991 patent from Nippon Chemi-Con and Mitsubishi Petrochemical describes a capacitor electrolyte based on a gamma-butyrolactone and ethylene glycol blend. Developers of battery electrolyte formulations test such solvents in small lots. As a result, electrolyte formulation grows at 6.92% a year.
Why is traceable, documented supply becoming the norm?
Buyers are shifting toward suppliers that can document every lot from import permit to end use, because control lists keep expanding. The Customs Legislation Amendment (Drugs) Regulations 2025 amended the prohibited imports regulations in February 2025, and ChemLinked reported in March 2025 that the Office of Drug Control introduced new license and permit requirements from March 1. ChemSupply Australia has supplied chemicals since 1989 from Australian manufacturing and logistics sites and holds an ISO 9001 certificate. Users of industrial solvents increasingly run supplier audits that cover chemical security as well as quality. In turn, authorized distribution grows at about the market rate while direct import lags.
Can pyrrolidone and synthesis users open a new niche?
The lactone is the starting point for 2-pyrrolidone and for N-methyl-2-pyrrolidone, which opens an opportunity for local synthesis and toll formulation. Producers make the lactone by dehydrogenating 1,4-butanediol over copper catalysts, so its price tracks that feedstock. Manufacturing businesses spent A$5,047 million on R&D in 2023-24, according to the ABS, and part of that work involves specialty synthesis. Contract formulators that hold licenses can supply small synthesis batches to clients that do not hold their own permits, which removes a permit barrier for small synthesis users. Therefore, chemical synthesis grows at a steady pace and keeps a large share of application value.
Will local repacking of laboratory packs create an opening?
Laboratory buyers want small, certified packs on short notice, and local repackers have a clear opportunity to meet that need. Imported packs often wait weeks for freight and permits, which leaves gaps that a licensed local filler can close. Tokyo Chemical Industry lists same-day stock for some 25 mL units but quotes about two weeks for other orders. ChemSupply Australia operates Australian manufacturing facilities from Port Adelaide, which could support local filling under license. Novachem runs more than 30 proficiency testing schemes, most accredited to ISO/IEC 17043, which ties standards to routine laboratory audits. Consequently, specialist laboratory supply grows at 6.40% a year, the fastest sales channel, as buyers trade price for speed and certification.
Permit timelines and single-source imports limit growth
How do per-consignment permits slow supply?
Each shipment needs its own Office of Drug Control permit, and incomplete applications are returned for amendment, which delays imports. The office aims to process correct applications within 20 business days. Endorsed permits must be returned no later than 14 days after importation. These steps lengthen lead times for plants that run short campaigns, so many users hold extra safety stock or pay distributors a premium for licensed inventory.
Why does border scrutiny raise compliance costs?
Enforcement agencies watch imports of the solvent closely, and that scrutiny raises costs for lawful users. The Australian Federal Police announced in June 2019 that authorities had identified 197 seizures totaling 7.6 metric tons over two years. As a result, legitimate consignments face document checks, and suppliers vet new customers before they sell. Smaller users without compliance staff often choose substitute solvents rather than apply for their own import licenses.
Does reliance on Chinese supply create risk?
China supplied 1,073.6 of the 1,112.6 metric tons of HS 293220 lactones that Australia imported in 2024, according to UN Comtrade. Italy and the United States supplied higher-value but much smaller lots. This concentration exposes buyers to freight delays, export rule changes and price swings in Chinese 1,4-butanediol. Distributors manage the risk by qualifying second sources in Europe, although those lots usually cost more per kilogram.
How do handling hazards limit wider use?
Japan's chemical safety agency NITE classifies the solvent as harmful if swallowed, category 4, and as causing serious eye irritation, category 2A. Merck labels its ReagentPlus grade with a danger signal word and a central nervous system warning. Tokyo Chemical Industry advises storage under inert gas below 15 C because the liquid absorbs moisture. These requirements add handling costs, so some cleaning users switch to less regulated solvents.
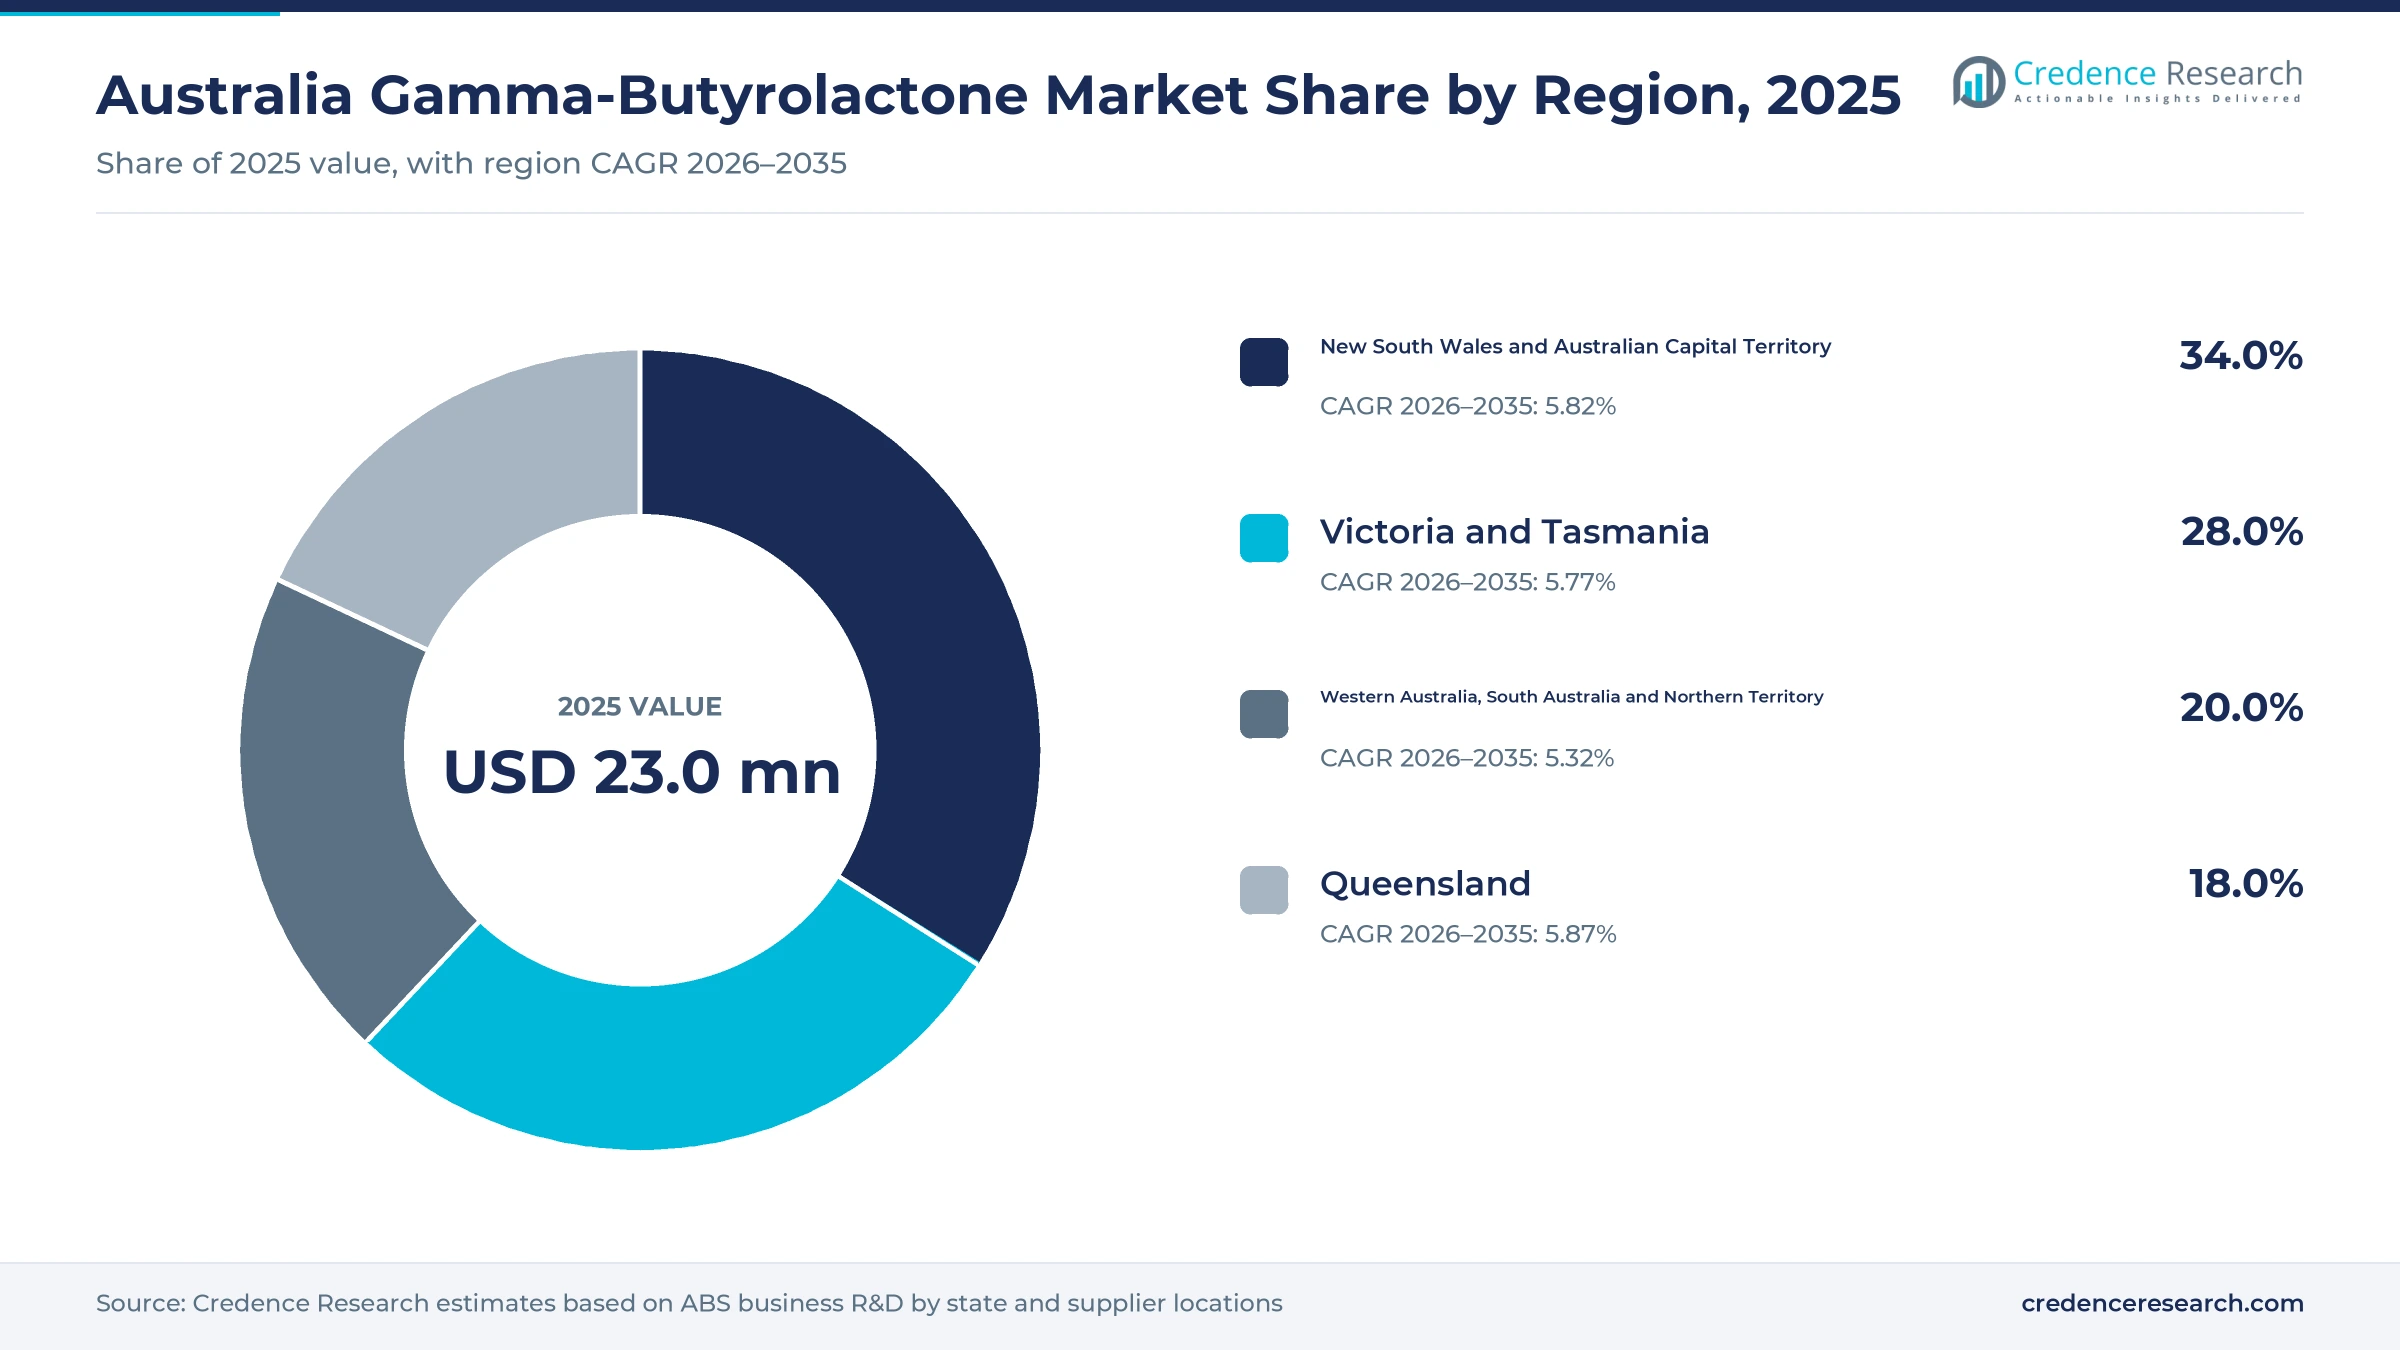
Sydney and Melbourne zones hold most licensed demand
| Region | Value, 2025 (USD million) | Share, 2025 | CAGR, 2026–2035 |
|---|---|---|---|
| New South Wales and Australian Capital Territory | 7.8 | 34.0% | 5.82% |
| Victoria and Tasmania | 6.4 | 28.0% | 5.77% |
| Western Australia, South Australia and Northern Territory | 4.6 | 20.0% | 5.32% |
| Queensland | 4.1 | 18.0% | 5.87% |
Why does the Sydney and Canberra zone lead demand?
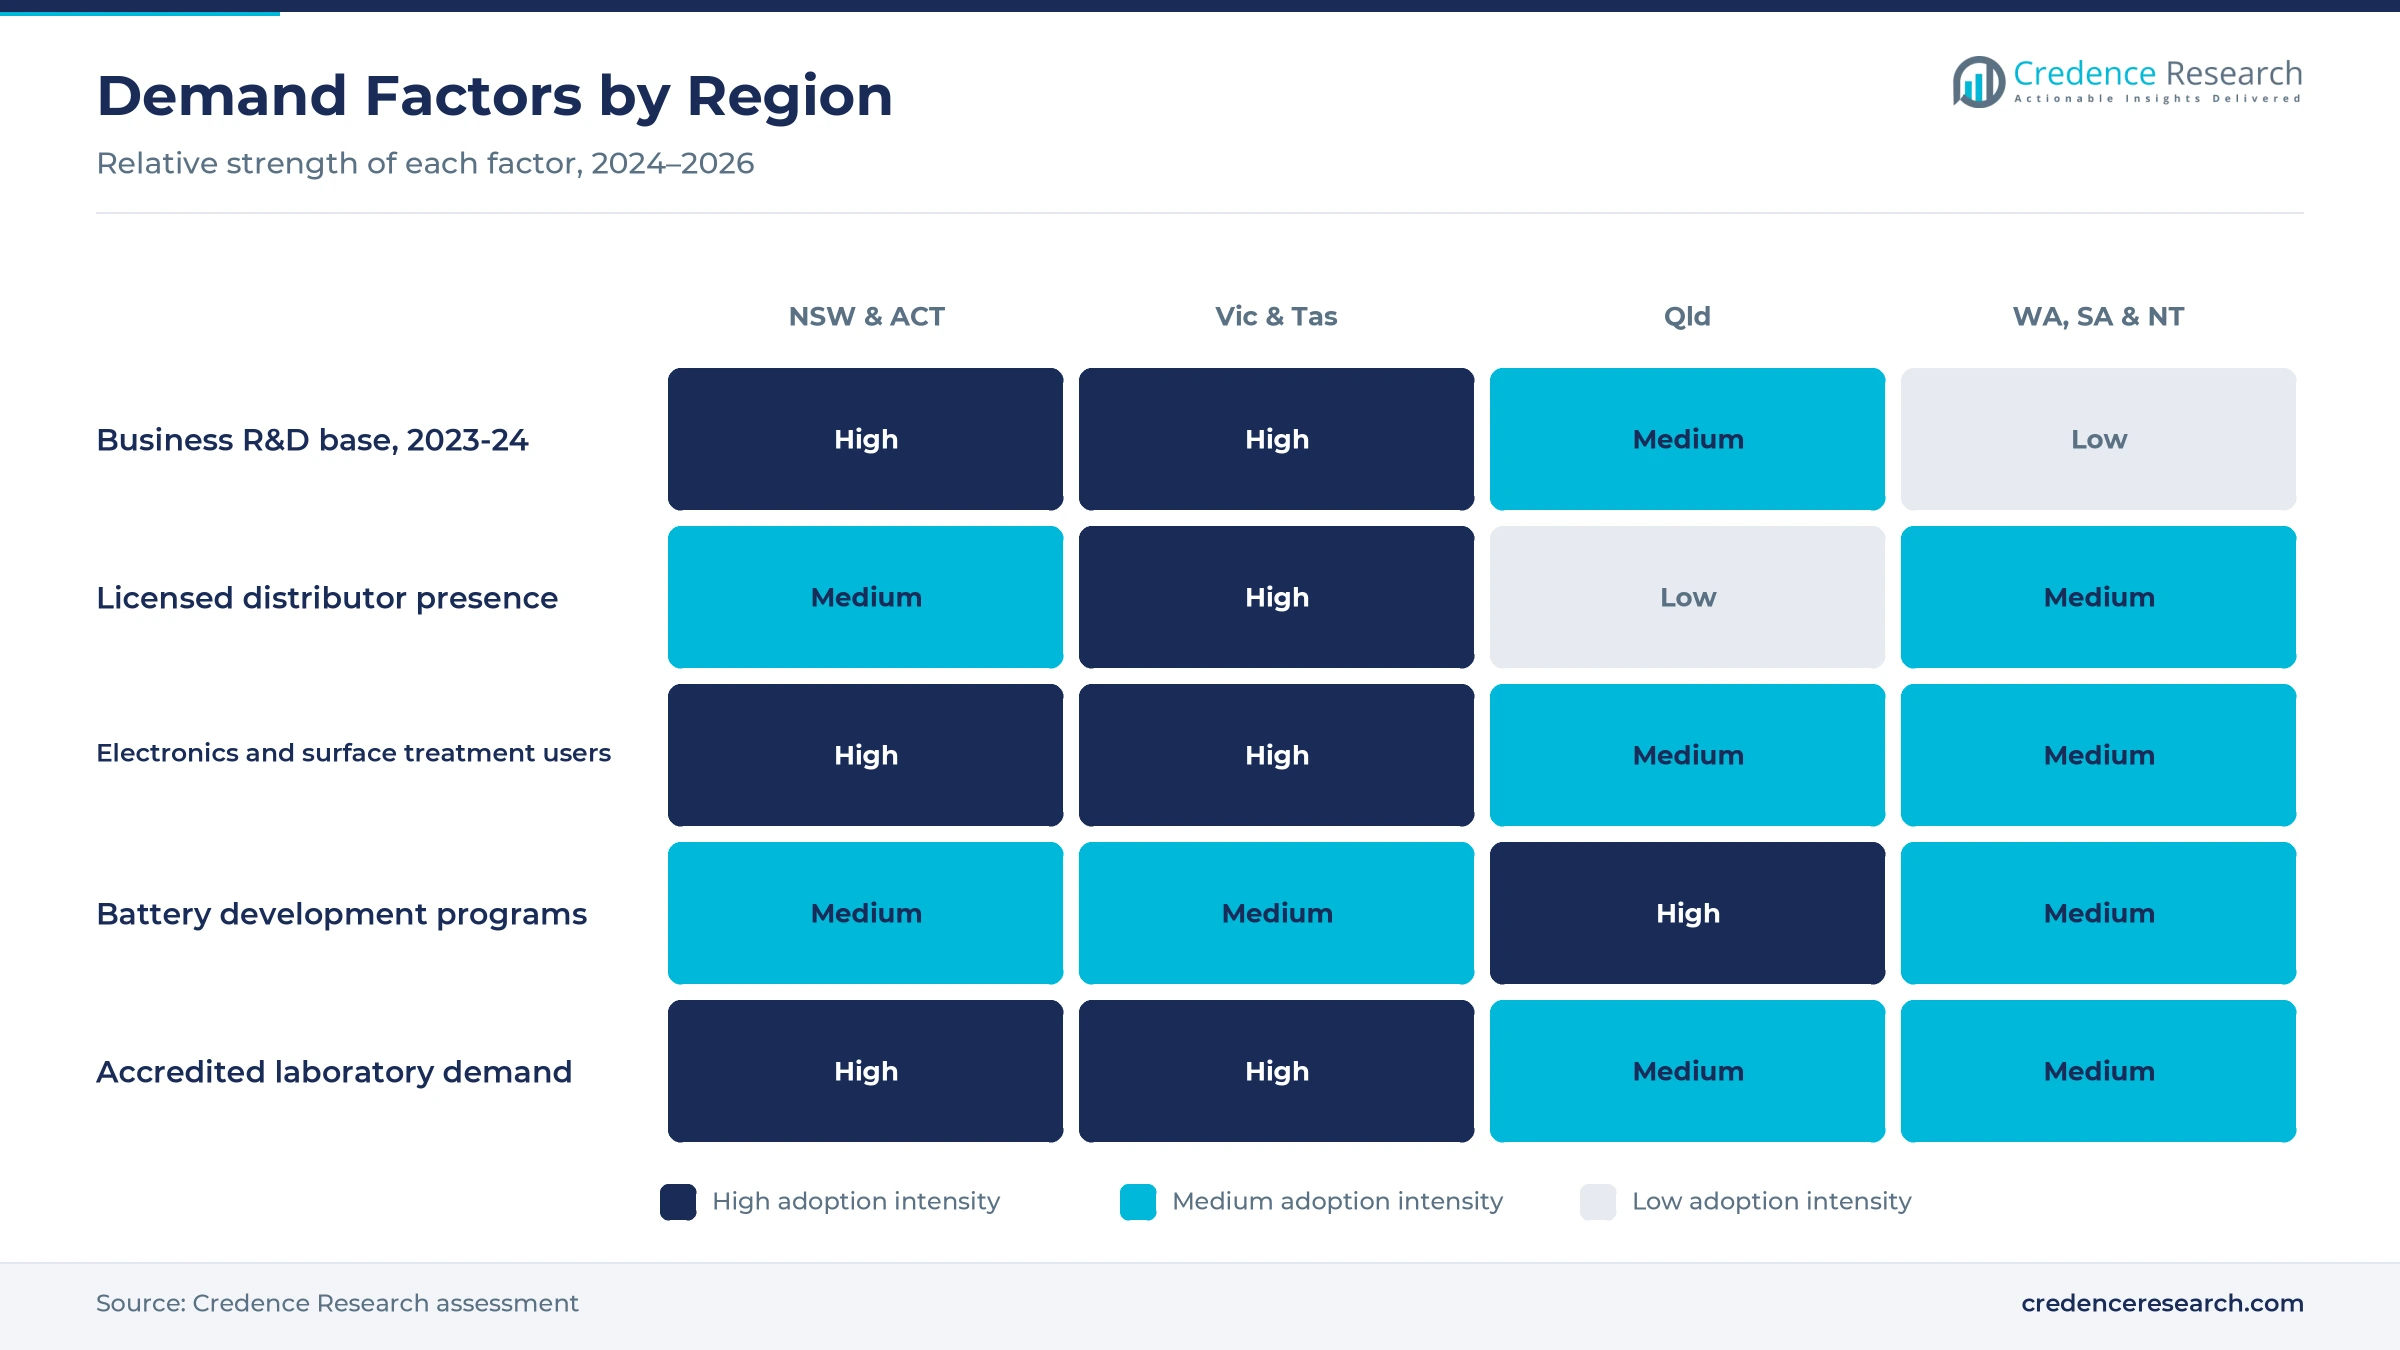
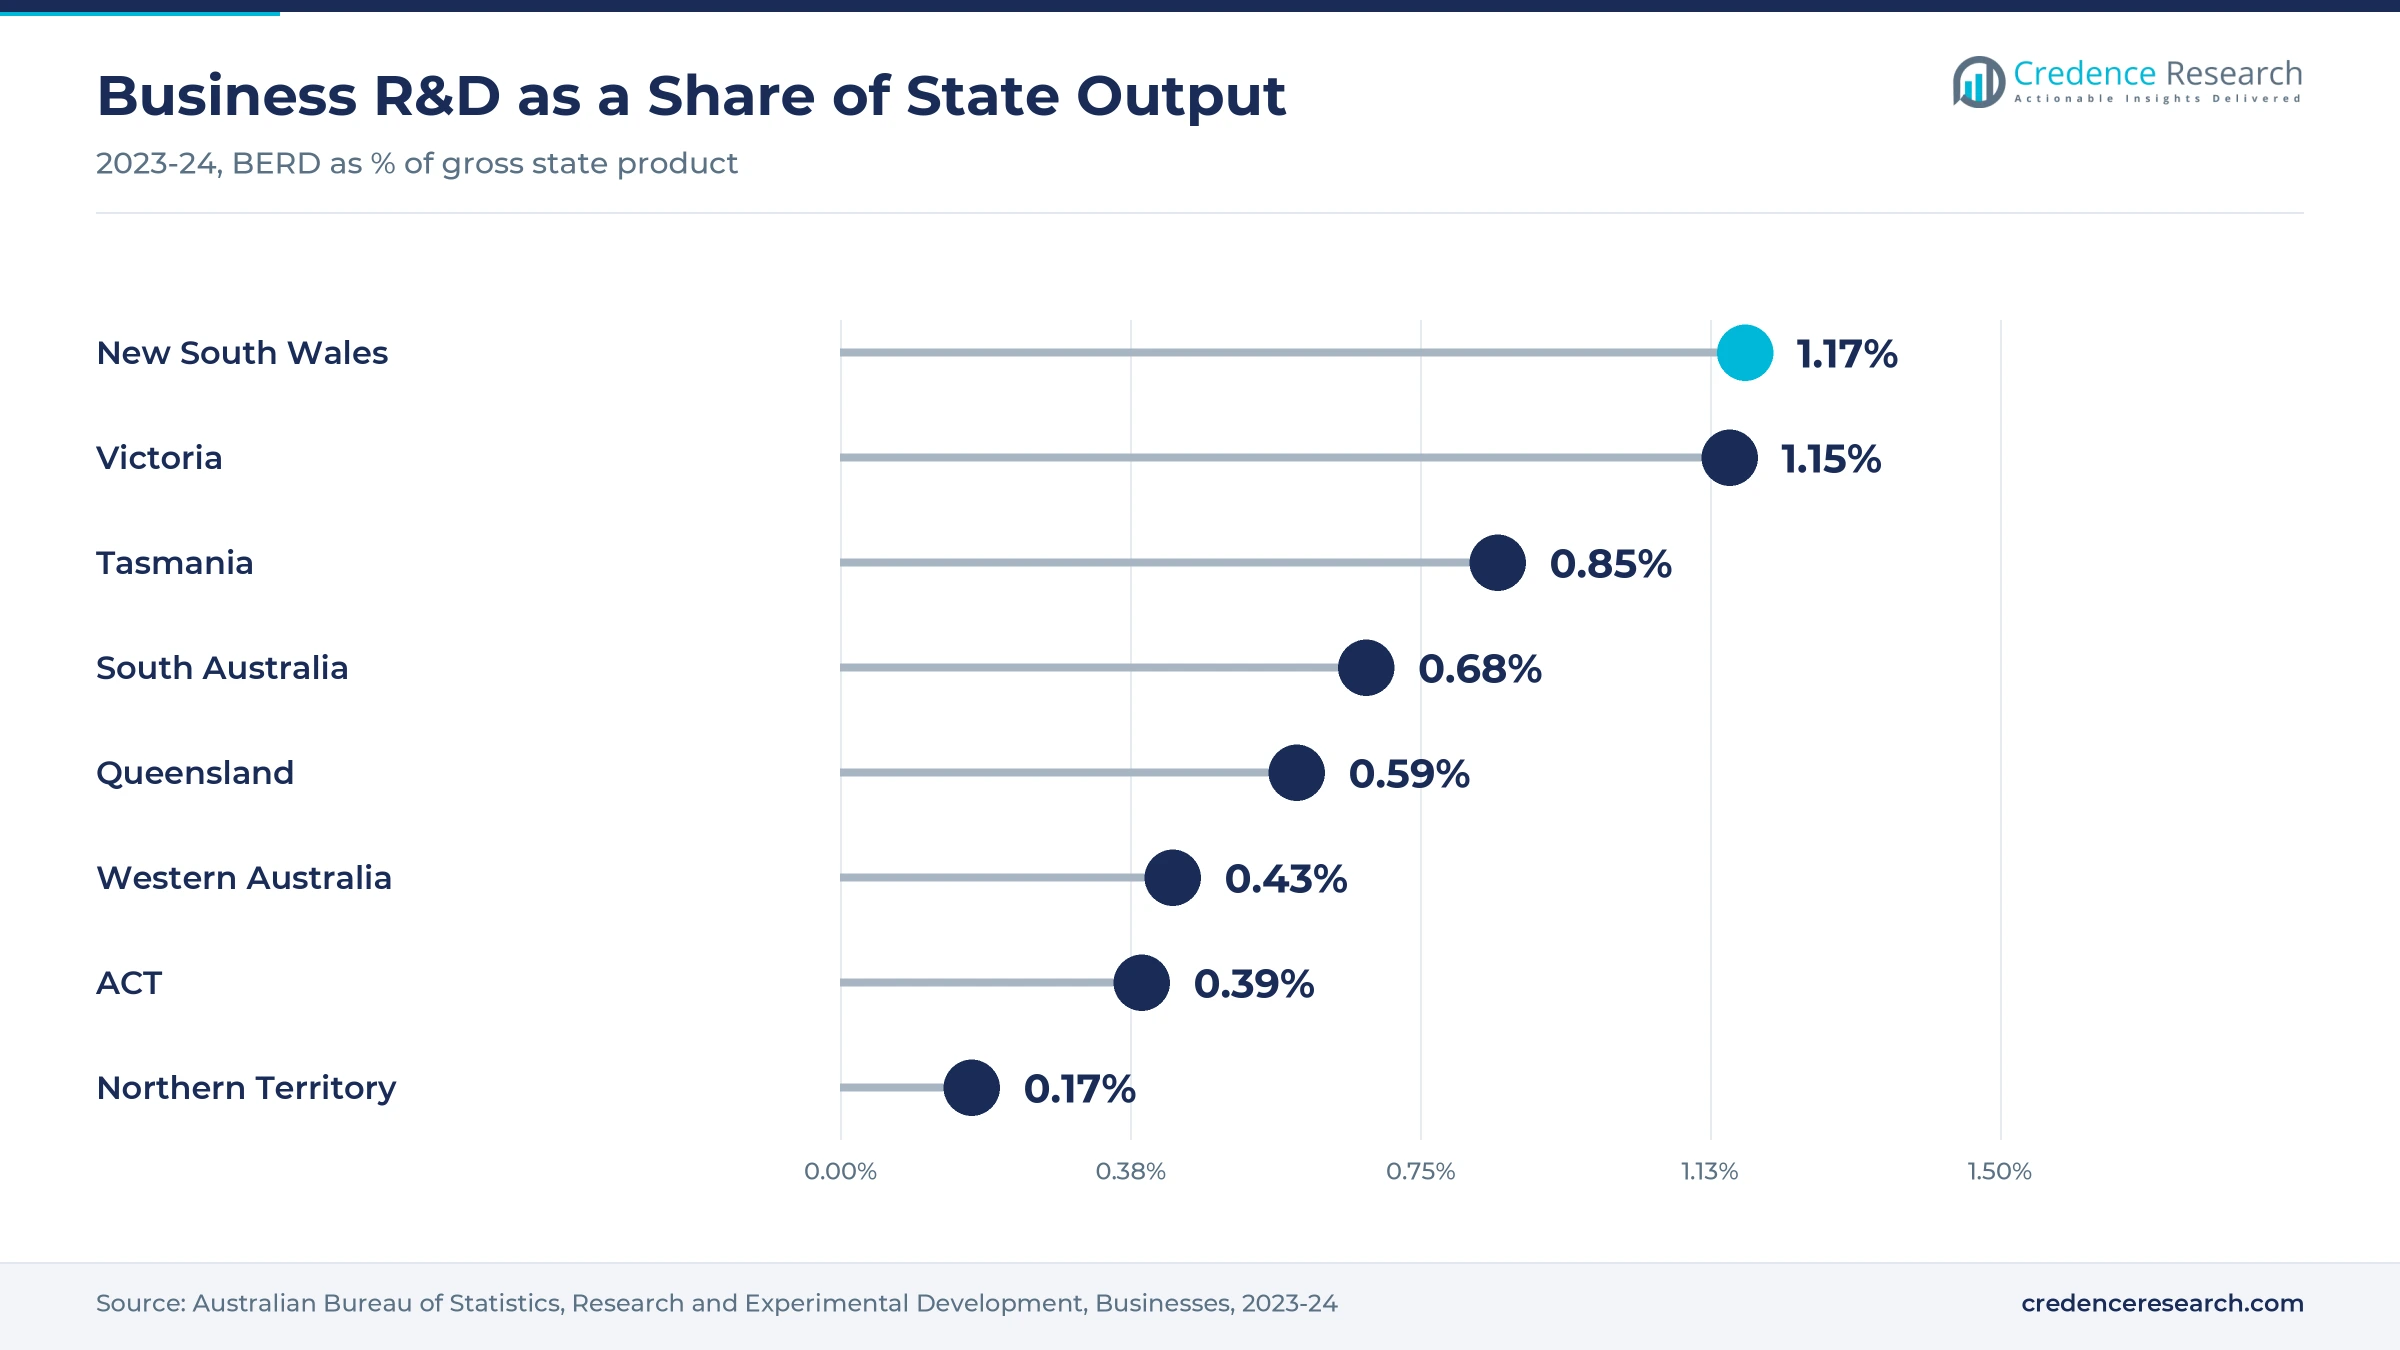
New South Wales and Australian Capital Territory held a 34.0% share of 2025 value and grows at 5.82% a year. New South Wales recorded A$9,630 million of business R&D in 2023-24, or 39% of the national total, and the largest increase of any state, up A$2,130 million. Its business R&D equaled 1.17% of gross state product, the highest ratio in Australia. This base supports electronics, surface treatment and laboratory buyers in Sydney and Canberra that order both drums and certified standards.
How do Melbourne suppliers support the southern zone?
Victoria and Tasmania held a 28.0% share of 2025 value and grows at 5.77% a year. Victoria recorded A$6,953 million of business R&D in 2023-24, or 28% of the national total, equal to 1.15% of gross state product. Merck Life Science operates from Bayswater and Novachem from Heidelberg West, which shortens delivery for local laboratories. Tasmania added research intensity, with its ratio rising 0.09 percentage points to 0.85%.
Why does Queensland grow fastest among the zones?
Queensland held an 18.0% share of 2025 value and grows at 5.87% a year, the fastest zone. In its 2024 battery strategy, the federal government announced up to A$100 million with the Queensland Government to an Australian Made Battery Precinct, which should draw electrolyte and materials development. Business R&D in Queensland equaled 0.59% of gross state product in 2023-24, up from 0.56% in 2021-22, according to the ABS, so the research base is still building.
How do the western and central states add demand?
Western Australia, South Australia and Northern Territory held a 20.0% share of 2025 value and grows at 5.32% a year. ChemSupply Australia operates from Port Adelaide, which gives South Australian users a licensed local source. South Australia recorded the largest rise in research intensity, with business R&D up 0.16 percentage points to 0.68% of gross state product. Western Australia stood at 0.43% and the Northern Territory at 0.17%, so demand stays thinner there.
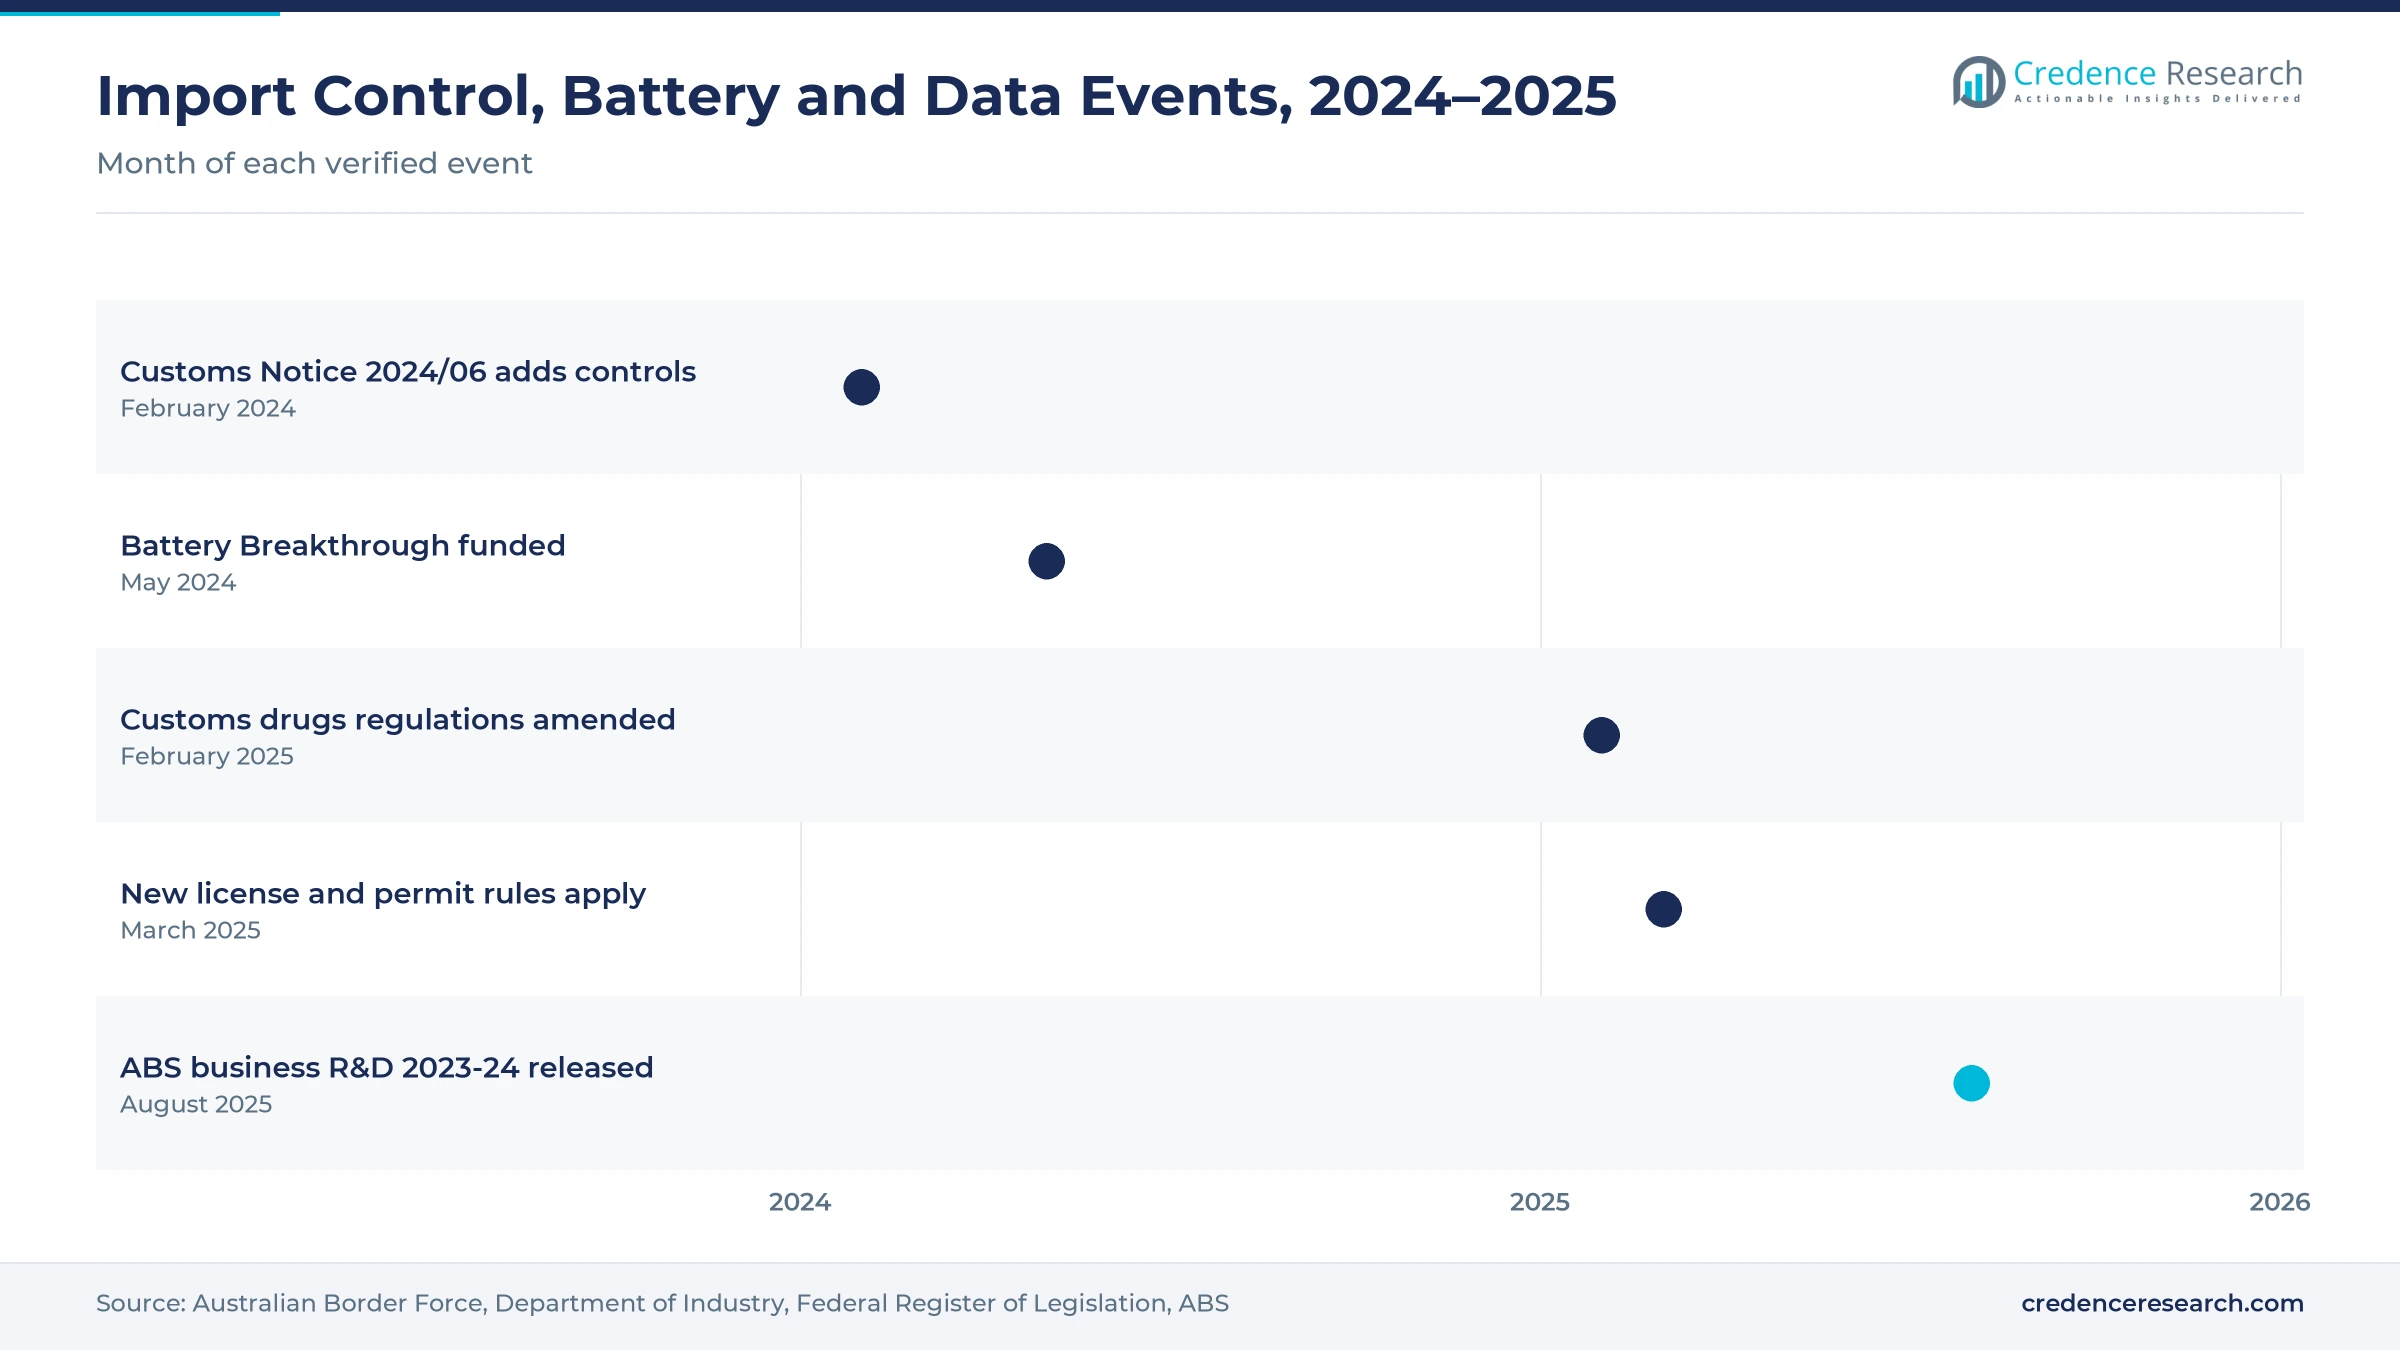
Import control, battery and data milestones, 2024–2025
| Development | Status and market relevance |
|---|---|
| In February 2024, Australian Customs Notice 2024/06 announced that six substances were added to Schedule 4 of the prohibited imports regulations. | Shows the regular updates that licensed importers must track |
| In May 2024, the 2024–25 federal Budget funded A$523.2 million of Battery Breakthrough incentives under the National Battery Strategy. | Supports electrolyte and battery materials development |
| In February 2025, the Customs Legislation Amendment (Drugs) Regulations 2025 amended the prohibited imports and exports regulations. | Extends the list of substances that need licenses and permits |
| In March 2025, new Office of Drug Control license and permit requirements took effect for the added substances. | Raises the compliance work handled by authorized distributors |
| In August 2025, the ABS released business R&D data showing A$24,410 million of spending in 2023-24. | Confirms a larger research base for laboratory buyers |
Purity grades, electrolytes and certified standards
- Purity grading separates technical drums from high-purity lots checked by gas chromatography and from certified reference materials.
- Electrolyte blending pairs the lactone with ethylene glycol and quaternary ammonium salts to make stable capacitor electrolytes with a wide liquid range.
- Certified standards give accredited laboratories traceable neat material and solutions in acetonitrile for identity and purity testing.
- Pyrrolidone synthesis reacts the lactone with ammonia or methylamine to make 2-pyrrolidone and N-methyl pyrrolidone solvents.
Need a Custom Version of This Report?
Tailor the scope, geography, or segments to your exact requirements.
- Custom geography or segment scope
- Direct access to our analyst team
Licensed distributors compete on compliance and stock
Competition is led by global catalog houses and Australian distributors that hold import licenses, because no verified plant makes the solvent in Australia. Merck sells Supelco analytical standard and ReagentPlus grades of the solvent through its Australian storefront and operates Merck Life Science Pty Ltd from Bayswater in Victoria. Tokyo Chemical Industry offers a high-purity grade in 25 mL and 500 mL bottles, ordered through ChemSupply Australia, which has supplied chemicals from Port Adelaide since 1989. LGC Standards offers a Dr. Ehrenstorfer neat reference material, and Novachem distributes LGC Standards products from Heidelberg West in Melbourne. Suppliers compete on license coverage, documented purity, local stock and the ability to manage end-user declarations for customers.
Companies profiled and their roles in this market
| Company | Type | Role in the market |
|---|---|---|
| Merck / Sigma-Aldrich | Laboratory chemical supplier | Supelco analytical standard and ReagentPlus grades; Merck Life Science Pty Ltd in Bayswater, Victoria |
| Tokyo Chemical Industry | Fine chemical producer | Grade of more than 99.0% in 25 mL and 500 mL bottles through its Australian storefront |
| ChemSupply Australia | Distributor and manufacturer | Port Adelaide supplier since 1989 and ordering partner for Tokyo Chemical Industry |
| Novachem | Reference material distributor | Melbourne distributor of LGC Standards and Dr. Ehrenstorfer products |
| LGC Standards | Reference material producer | Neat Dr. Ehrenstorfer gamma-butyrolactone reference material made in Germany |
Credence Research view on a controlled solvent niche
Credence Research's view is that the Australia gamma-butyrolactone market will stay a small, licensed import niche that grows a little faster than general solvent demand. Surface treatment and synthesis users provide the volume, while accredited laboratories and battery developers add the growth through certified and high-purity lots. Distributors that hold Office of Drug Control licenses and manage end-user declarations keep a clear advantage over direct importers. However, permit timelines, border scrutiny and reliance on Chinese supply will keep annual value in the tens of millions.
Trade data, permit rules and catalog checks behind it
The report uses 2025 as the base year for every value, share and growth rate. Market values come from the Credence Research model, and zone shares, segment splits and growth rates are Credence Research estimates. Sources used are UN Comtrade import data, ABS business R&D statistics, Office of Drug Control guidance, federal battery policy documents, legislation records and supplier catalog listings, and no interviews or surveys were used.
Qualified users and battery work steer growth to 2035
Spending is expected to reach USD 39.3 million by 2035, a 5.72% CAGR during 2026–2035, as qualified process users and laboratories keep ordering imported material under license. Growth should stay steady, because most industrial users have validated the solvent and avoid requalifying a substitute. Certified standards, electrolyte development and local repacking should add value at the margin, while prices follow the worldwide lactone solvent trade. Tighter control lists would favor established distributors, whereas a slowdown in research spending would cut laboratory demand.
Frequently Asked Questions
How big is the Australia gamma-butyrolactone market?
Which region leads spending in Australia?
Which product type holds the largest share?
Do importers need a permit to bring the solvent into Australia?
What is gamma-butyrolactone used for in industry?
Which region grows fastest through 2035?
Which companies compete in this market?
What are the main risks for suppliers?
Table of Content
Chapter 1 Market Segmentation
- 1.1 Segmentation Framework
- 1.1.1 Product and Service Classification
- 1.1.2 Application and End-Use Classification
- 1.1.3 Technology and Solution Classification
- 1.1.4 Customer and Distribution Channel Classification
- 1.1.5 Geographic Segmentation
- 1.1.6 Market Segment Definitions and Boundaries
- 1.2 By Product Type
- 1.2.1 Technical Grade
- 1.2.2 High-Purity Grade
- 1.2.3 Analytical Standards
- 1.3 By End-Use Industry
- 1.3.1 Surface Treatment Manufacturing
- 1.3.2 Electronics Manufacturing
- 1.3.3 Energy Materials
- 1.3.4 Scientific Chemical Supply
- 1.4 By Application
- 1.4.1 Surface Treatment
- 1.4.2 Precision Cleaning
- 1.4.3 Chemical Synthesis
- 1.4.4 Electrolyte Formulation
- 1.5 By Sales Channel
- 1.5.1 Authorized Distribution
- 1.5.2 Direct Import
- 1.5.3 Specialist Laboratory Supply
Chapter 2 Introduction
- 2.1 Report Objectives and Scope
- 2.2 Product Definition and Industry Terminology
- 2.3 Market Inclusions and Exclusions
- 2.4 Research Process
- 2.4.1 Primary Research and Expert Interviews
- 2.4.2 Secondary Research and Source Review
- 2.4.3 Top-Down and Bottom-Up Estimation
- 2.4.4 Data Triangulation and Verification
- 2.5 Market Size Measurement Basis
- 2.5.1 2025: USD 23.0 million → 2035: USD 39.3 million
- 2.6 Historical and Forecast Reference Periods
- 2.6.1 Historical Period: 2018-2025
- 2.6.2 Base Year: 2025
- 2.6.3 Forecast Period: 2025-2035
- 2.7 Research Assumptions and Limitations
Chapter 3 Executive Summary
- 3.1 Market Snapshot and Key Findings
- 3.2 Base-Year Market Size, 2025
- 3.3 Forecast Market Size, 2035
- 3.4 Revenue and Volume Growth Outlook
- 3.5 Key Demand and Supply Indicators
- 3.6 Leading Market Segments
- 3.7 Fastest-Growing Market Opportunities
- 3.8 Regional Performance Highlights
- 3.9 Technology and Industry Transformation
- 3.10 Competitive Landscape Summary
- 3.11 Analyst View and Strategic Implications
Chapter 4 Australia Gamma-Butyrolactone Market Trends and Developments
- 4.1 Historical Industry Development, 2018-2025
- 4.2 Recent Market Trends and Developments
- 4.3 Demand and Customer Behavior Trends
- 4.4 Technology and Product Innovation
- 4.5 Artificial Intelligence, Automation and Digitalization
- 4.6 Local Manufacturing and Supply Chain Realignment
- 4.7 Industry Partnerships, Mergers and Acquisitions
- 4.8 Sustainability and Circular Economy Developments
- 4.9 Government and Private Sector Investment Trends
- 4.10 Emerging Business Models and Commercialization
- 4.11 Industry Developments and Announcements
Chapter 5 Australia Gamma-Butyrolactone Market Production, Supply and Demand Analysis
- 5.1 Demand Trend and Consumption Analysis, 2018-2025
- 5.2 Demand Forecast, 2025-2035
- 5.3 Production and Output Trend, 2018-2025
- 5.4 Production and Output Forecast, 2025-2035
- 5.5 Installed Capacity and Capacity Utilization
- 5.6 Company-Wise Production Plants and Statistics
- 5.6.1 Installed Production Capacity
- 5.6.2 Actual Production
- 5.6.3 Planned Capacity and Expansion Targets
- 5.7 Supply Chain Structure and Procurement Trends
- 5.8 Supply-Demand Gap and Bottlenecks
- 5.9 Import Dependence and Sourcing Structure
- 5.10 Contract Manufacturing and Outsourcing
- 5.11 Regional Supply and Demand Concentration
Chapter 6 Australia Gamma-Butyrolactone Market Pricing Analysis
- 6.1 Pricing Structure and Measurement
- 6.2 Historical Pricing Trends, 2018-2025
- 6.3 Pricing Outlook, 2025-2035
- 6.4 Average Selling Price and Unit Economics
- 6.5 Pricing by Product and Market Segment
- 6.6 Geographic Pricing Differences
- 6.7 Key Input, Energy, Labor and Logistics Costs
- 6.8 Contract Pricing and Purchasing Models
- 6.9 Pricing Sensitivity and Competitive Positioning
- 6.10 Price, Margin and Profitability Implications
Chapter 7 Australia Gamma-Butyrolactone Market Dynamics
- 7.1 Market Growth Drivers
- 7.1.1 Demand-Side Drivers
- 7.1.2 Technology and Innovation Drivers
- 7.1.3 Infrastructure and Investment Drivers
- 7.1.4 Regulatory and Policy Drivers
- 7.2 Market Restraints
- 7.2.1 Cost and Affordability Constraints
- 7.2.2 Technology and Adoption Barriers
- 7.2.3 Supply Chain and Operational Constraints
- 7.3 Market Challenges
- 7.3.1 Competitive Pressure and Margin Erosion
- 7.3.2 Skills, Infrastructure and Implementation Gaps
- 7.4 Emerging Market Opportunities
- 7.5 Market Dynamics Impact and Time-Horizon Assessment
Chapter 8 Australia Gamma-Butyrolactone Value Chain Analysis
- 8.1 Industry Value Chain Overview
- 8.2 Upstream Suppliers and Critical Inputs
- 8.3 Technology and Component Providers
- 8.4 Manufacturing or Service Delivery
- 8.5 Distribution, Channel Partners and Integrators
- 8.6 Downstream Applications and End Users
- 8.7 Value Addition and Profit Pools
- 8.8 Vertical Integration and Outsourcing
- 8.9 Supplier Concentration and Risk
- 8.10 Supply Chain Localization and Resilience
Chapter 9 Australia Gamma-Butyrolactone Market Regulations and Policies
- 9.1 Relevant Laws, Standards and Compliance Frameworks
- 9.2 Product, Service, Safety and Quality Requirements
- 9.3 Government Policies, Incentives and Subsidies
- 9.4 Imports, Exports and Trade Barriers
- 9.5 Public Procurement and Local Content Requirements
- 9.6 Environmental and Sustainability Compliance
- 9.7 Upcoming Policy Changes and Market Implications
Chapter 10 Australia Gamma-Butyrolactone Market Hotspots and Opportunities
- 10.1 Market Opportunity Mapping and Growth Hotspots
- 10.2 High-Growth Applications and Customer Groups
- 10.3 Underserved Markets and White-Space Opportunities
- 10.4 Emerging Technology and Product Opportunities
- 10.5 New Capacity and Investment Hotspots
- 10.6 Market Entry and Expansion Opportunities
- 10.7 Distribution and Partnership Opportunities
- 10.8 Near-Term and Long-Term Commercial Potential
- 10.9 Opportunity Attractiveness and Execution Risks
Chapter 11 Australia Gamma-Butyrolactone Market Outlook, 2025-2035
- 11.1 Market Size and Analysis
- 11.1.1 Revenue (Market Measurement: 2025: USD 23.0 million → 2035: USD 39.3 million)
- 11.1.2 Market Volume and Quantity Sold
- 11.1.3 Historical Market Size, 2018-2025
- 11.1.4 Base-Year Market Size, 2025
- 11.2 Market Forecast, 2025-2035
- 11.2.1 Revenue Forecast to 2035
- 11.2.2 Volume Forecast to 2035
- 11.2.3 CAGR and Year-on-Year Growth
- 11.2.4 Incremental Revenue Opportunity
- 11.3 Forecast Assumptions and Scenario Analysis
- 11.3.1 Base-Case Forecast
- 11.3.2 Optimistic and Conservative Scenarios
- 11.3.3 Technology, Pricing and Policy Sensitivities
- 11.4 Market Attractiveness and Growth Outlook
Chapter 12 Australia Gamma-Butyrolactone Market Segmentation and Outlook
- 12.1 Segmentation Summary and Market Shares, 2025
- 12.2 Largest and Fastest-Growing Segments
- 12.3 By Product Type - Market Size and Forecast, 2025-2035
- 12.3.1 Segment Definition and Scope
- 12.3.2 Historical Market Size, 2018-2025
- 12.3.3 Revenue Forecast, 2025-2035
- 12.3.4 Volume Forecast, 2025-2035
- 12.3.5 Base-Year Market Share, 2025
- 12.3.6 Segment CAGR and Growth Drivers
- 12.3.7 Subsegment Market Size and Forecast
- 12.3.7.1 Technical Grade
- 12.3.7.2 High-Purity Grade
- 12.3.7.3 Analytical Standards
- 12.3.8 Subsegment Pricing and Adoption Trends
- 12.3.9 Leading Suppliers and Competition
- 12.3.10 Regional Demand and Opportunities
- 12.4 By End-Use Industry - Market Size and Forecast, 2025-2035
- 12.4.1 Segment Definition and Scope
- 12.4.2 Historical Market Size, 2018-2025
- 12.4.3 Revenue Forecast, 2025-2035
- 12.4.4 Volume Forecast, 2025-2035
- 12.4.5 Base-Year Market Share, 2025
- 12.4.6 Segment CAGR and Growth Drivers
- 12.4.7 Subsegment Market Size and Forecast
- 12.4.7.1 Surface Treatment Manufacturing
- 12.4.7.2 Electronics Manufacturing
- 12.4.7.3 Energy Materials
- 12.4.7.4 Scientific Chemical Supply
- 12.4.8 Subsegment Pricing and Adoption Trends
- 12.4.9 Leading Suppliers and Competition
- 12.4.10 Regional Demand and Opportunities
- 12.5 By Application - Market Size and Forecast, 2025-2035
- 12.5.1 Segment Definition and Scope
- 12.5.2 Historical Market Size, 2018-2025
- 12.5.3 Revenue Forecast, 2025-2035
- 12.5.4 Volume Forecast, 2025-2035
- 12.5.5 Base-Year Market Share, 2025
- 12.5.6 Segment CAGR and Growth Drivers
- 12.5.7 Subsegment Market Size and Forecast
- 12.5.7.1 Surface Treatment
- 12.5.7.2 Precision Cleaning
- 12.5.7.3 Chemical Synthesis
- 12.5.7.4 Electrolyte Formulation
- 12.5.8 Subsegment Pricing and Adoption Trends
- 12.5.9 Leading Suppliers and Competition
- 12.5.10 Regional Demand and Opportunities
- 12.6 By Sales Channel - Market Size and Forecast, 2025-2035
- 12.6.1 Segment Definition and Scope
- 12.6.2 Historical Market Size, 2018-2025
- 12.6.3 Revenue Forecast, 2025-2035
- 12.6.4 Volume Forecast, 2025-2035
- 12.6.5 Base-Year Market Share, 2025
- 12.6.6 Segment CAGR and Growth Drivers
- 12.6.7 Subsegment Market Size and Forecast
- 12.6.7.1 Authorized Distribution
- 12.6.7.2 Direct Import
- 12.6.7.3 Specialist Laboratory Supply
- 12.6.8 Subsegment Pricing and Adoption Trends
- 12.6.9 Leading Suppliers and Competition
- 12.6.10 Regional Demand and Opportunities
- 12.7 Segment Growth Comparison
- 12.8 Segment Attractiveness and Priority Matrix
Chapter 13 Australia Gamma-Butyrolactone End-Use and Application Market Outlook
- 13.1 End-Use Industry and Customer Demand Structure
- 13.2 Leading Applications and Customer Groups
- 13.3 End-Use Market Size, Share and Forecast
- 13.4 Major End-Use Industry Deep Dives
- 13.4.1 Customer Requirements and Use Cases
- 13.4.2 Demand and Replacement Cycles
- 13.4.3 Technical and Regulatory Considerations
- 13.4.4 Purchasing and Procurement Models
- 13.4.5 Leading Vendors and Distribution Channels
- 13.4.6 Forecast and Commercial Opportunities
- 13.5 Emerging Applications and Cross-Segment Demand
- 13.6 End-Use Industry Investment Priorities
Chapter 14 Australia Gamma-Butyrolactone Geographic Market Outlook, 2025-2035
- 14.1 Domestic Market Distribution and Demand Clusters
- 14.2 State- or Province-Wise Market Size and Forecast, 2025-2035
- 14.3 City and Metropolitan Market Outlook
- 14.4 Industrial, Manufacturing and Commercial Clusters
- 14.5 Geographic Concentration of Key End Users
- 14.6 Local Pricing and Purchasing Differences
- 14.7 Domestic Production Facilities and Capacity Map
- 14.8 Local Infrastructure and Project Pipeline
- 14.9 State-Level Policy and Incentive Differences
- 14.10 Subnational Investment Hotspots and Opportunities
- 14.11 Distribution and Logistics Networks
- 14.12 Domestic Competitive Footprint
Chapter 15 Australia Gamma-Butyrolactone Technology, Innovation and Sustainability Outlook
- 15.1 Technology Landscape and Maturity
- 15.2 Product, Process and Service Innovation
- 15.3 AI, Automation and Digital Tools in the Industry
- 15.4 Technology Adoption and Performance Benchmarking
- 15.5 Innovation Pipeline and R&D Investment
- 15.6 Patent and Intellectual Property Trends
- 15.7 Energy Efficiency and Resource Management
- 15.8 Sustainability, Recycling and Circularity
- 15.9 Technology Roadmap, 2025-2035
- 15.10 Risks of Obsolescence and Technology Substitution
Chapter 16 Australia Gamma-Butyrolactone Market Key Strategic Imperatives
- 16.1 Growth and Market Entry Priorities
- 16.2 High-Return Products and Segments
- 16.3 Pricing, Profitability and Cost Optimization
- 16.4 Technology Investment and Product Differentiation
- 16.5 Supply Chain Localization and Resilience
- 16.6 Distribution and Customer Acquisition
- 16.7 Partnership, Acquisition and Capacity Strategy
- 16.8 Regional Expansion Priorities
- 16.9 Short-, Medium- and Long-Term Actions
Chapter 17 Competition Outlook
- 17.1 Industry Competition Characteristics
- 17.2 Market Structure and Concentration
- 17.3 Market Share and Competitive Positioning, 2025
- 17.4 Company-Wise Revenue and Product Benchmarking
- 17.5 Production and Service Capacity Benchmarking
- 17.6 Technology, Pricing and Differentiation
- 17.7 Regional Footprint and Distribution Strength
- 17.8 Mergers, Acquisitions and Strategic Alliances
- 17.9 New Entrants and Competitive Threats
- 17.10 Porter's Five Forces and Industry Attractiveness
- 17.11 Competitive Outlook, 2025-2035
Chapter 18 Company Profiles
- 18.1 Company Coverage and Selection Criteria
- 18.2 Merck / Sigma-Aldrich
- 18.2.1 Business Description
- 18.2.2 Company Ownership and Geographic Presence
- 18.2.3 Product and Service Portfolio
- 18.2.4 Manufacturing and Operating Footprint
- 18.2.5 Production Capacity and Expansion Plans
- 18.2.6 Financial Performance and Investment
- 18.2.7 Market Share and Competitive Position
- 18.2.8 Technology and Innovation Capabilities
- 18.2.9 Strategic Alliances or Partnerships
- 18.2.10 Recent Developments
- 18.2.11 Growth Strategy and Outlook
- 18.3 Tokyo Chemical Industry
- 18.4 ChemSupply Australia
- 18.5 Novachem
- 18.6 LGC Standards
- 18.7 Other Relevant Market Participants
Note: Every listed company is profiled on the structure shown under the first company. The company list is preliminary and may change based on research findings, market developments, data availability and client requirements.
Chapter 19 Disclaimer
- 19.1 Research and Forecast Disclaimer
- 19.2 Data Source and Estimation Limitations
Note: The depth of individual sections depends on data availability for this market. Volume, capacity, trade and other unit-based metrics are included where applicable.

