
Plant-derived cleansing demand anchors regional growth
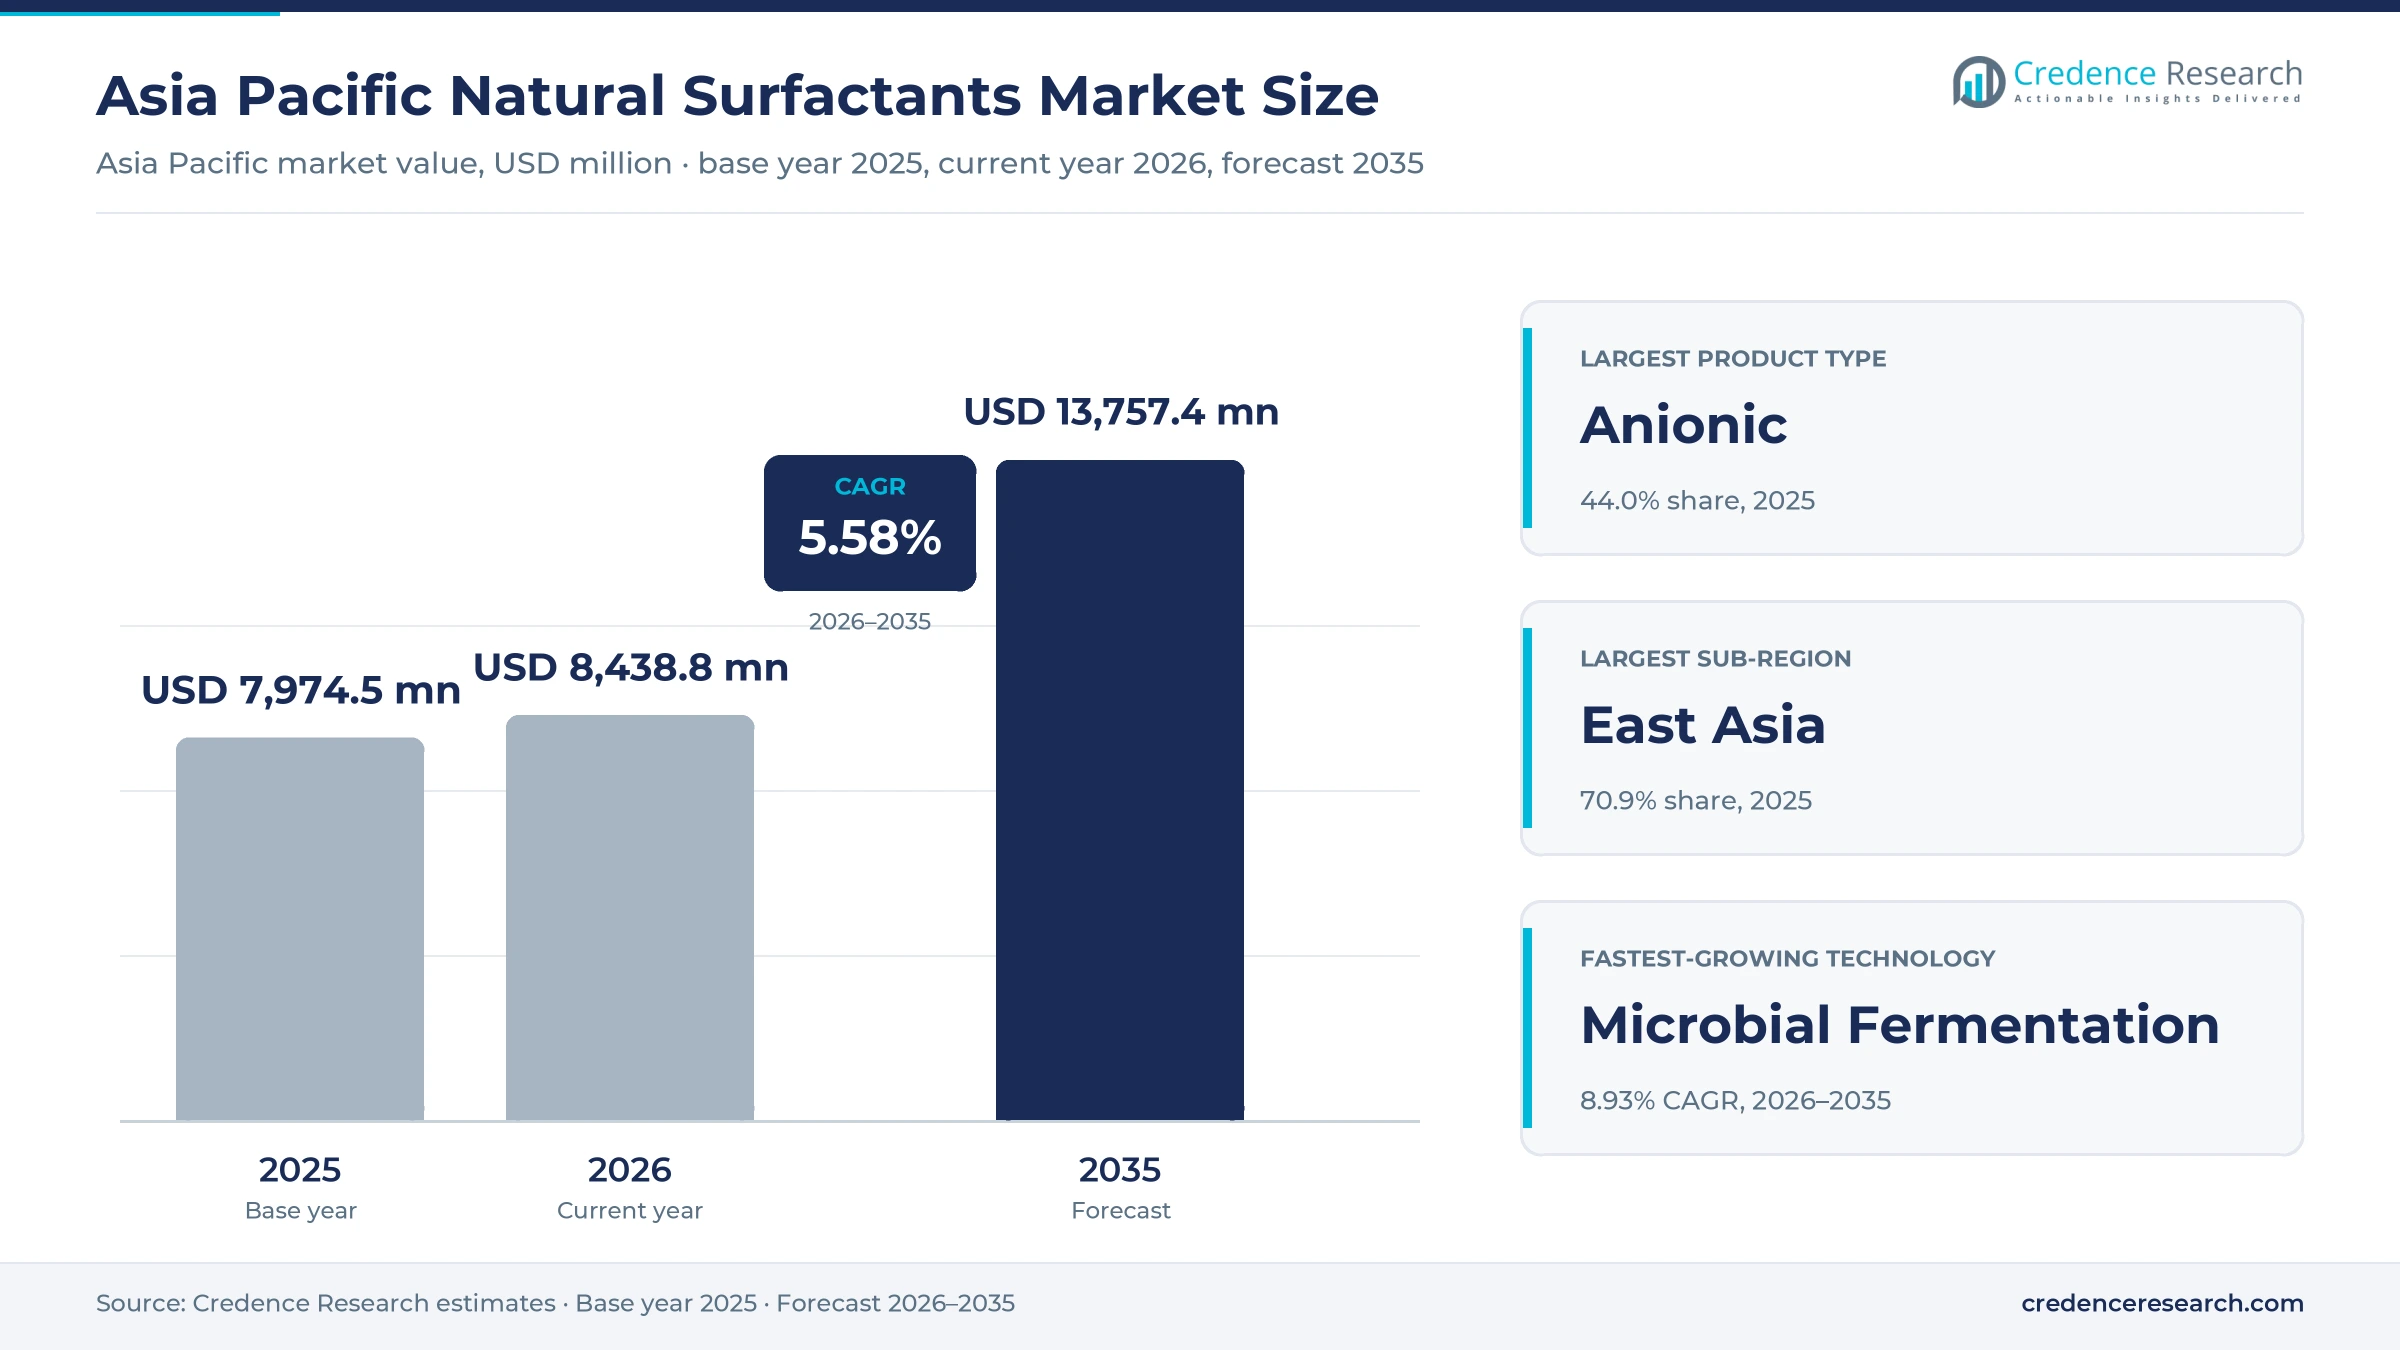
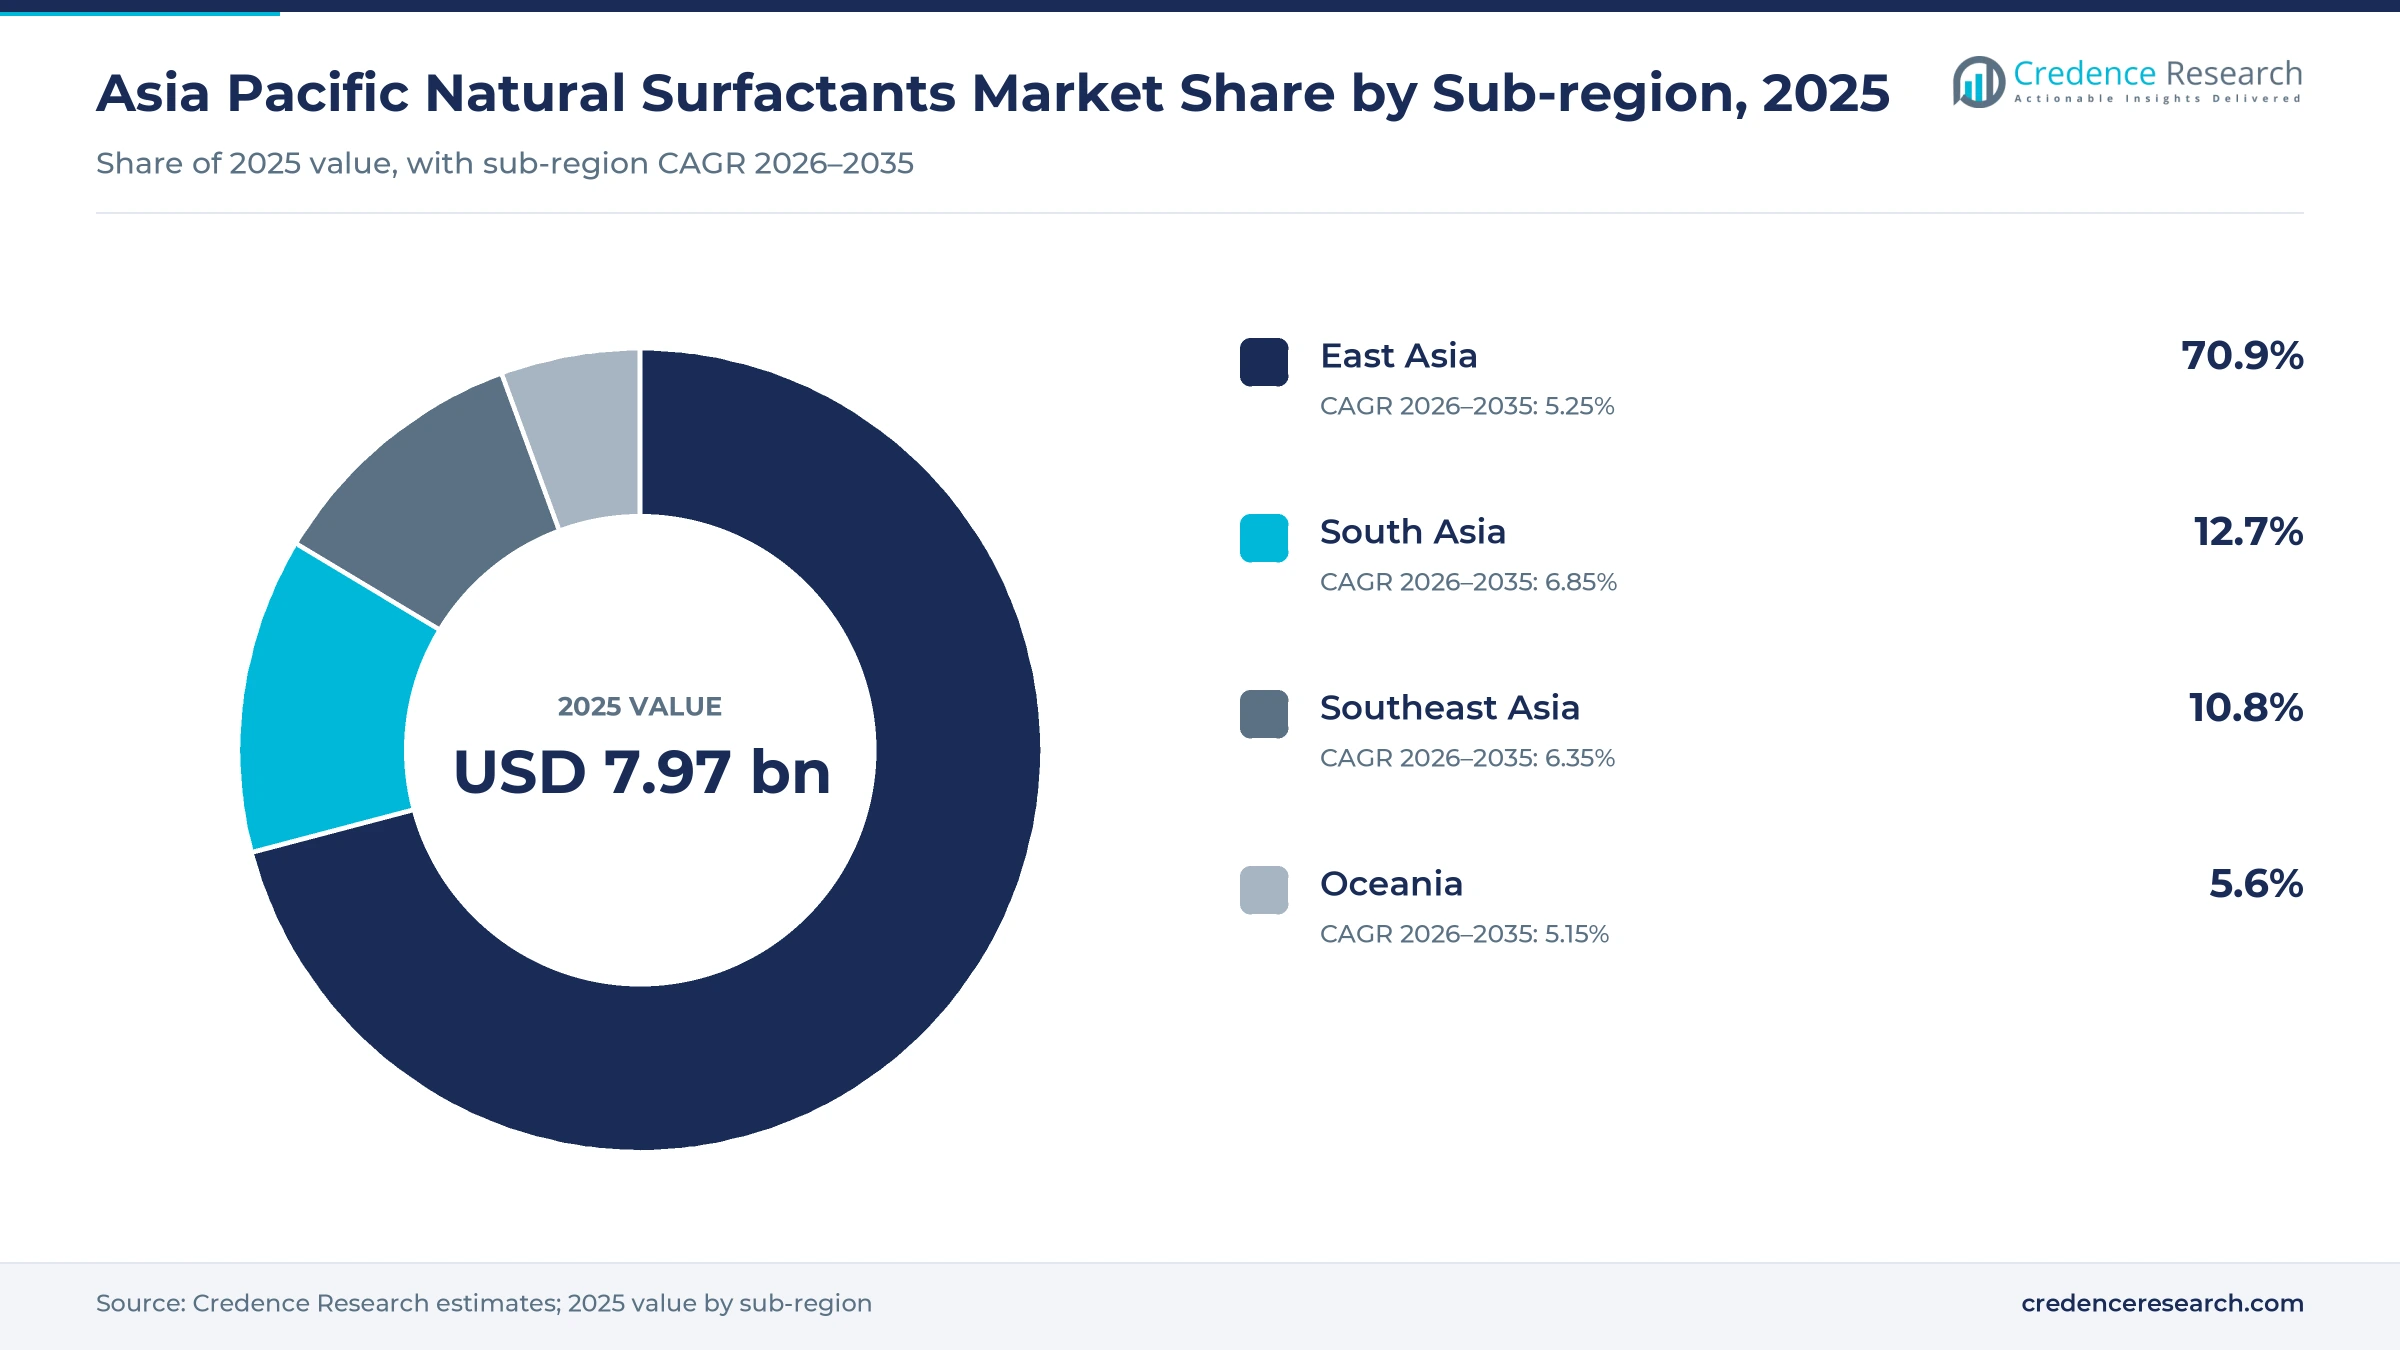
The Asia Pacific natural surfactants market was valued at USD 7.97 billion in 2025 and is projected to increase from USD 8.44 billion in 2026 to USD 13.76 billion by 2035, registering a CAGR of 5.58% during 2026–2035. Demand comes from shampoo, body wash, dishwashing and laundry brands, contract formulators and industrial users that want plant-derived ingredients that clean, foam and break down readily after use. East Asia held the largest share, 70.9% in 2025, because China, Japan and South Korea host the region's biggest detergent and cosmetics production base. South Asia is the fastest-growing sub-region at 6.85% a year, as India adds local alkoxylation capacity and supports bio-based chemicals through national policy. Supply is also changing, because producers are building alkyl polyglucoside and ethoxylate capacity inside Southeast Asia and China. As a result, formulators can source mild renewable ingredients with shorter lead times and documented palm or coconut origin.
Which plant-derived surface-active ingredients are counted?
The estimate measures the value of surfactants made wholly or mainly from renewable feedstocks, such as palm kernel oil, coconut oil, sugars, amino acids and fermentation products, sold in East Asia, South Asia, Southeast Asia and Oceania. It covers anionic, nonionic, amphoteric and cationic grades bought by brand owners, contract manufacturers and specialty formulators under direct contracts, through distributors or on digital procurement platforms.
The estimate excludes fully petrochemical surfactants, finished detergents and cosmetics, and raw vegetable oils sold for food or fuel. The value chain runs from plantations and sugar mills through fatty alcohol, fatty acid and glucose producers to surfactant makers, distributors and the formulators that sell finished products to households and industry.
Asia Pacific Natural Surfactants Market Insights
- The Asia Pacific natural surfactants market was valued at USD 7.97 billion in 2025 and is projected to reach USD 13.76 billion by 2035, registering a CAGR of 5.58% during 2026–2035.
- East Asia held 70.9% of 2025 value, because China, Japan and South Korea host the region's largest detergent and cosmetics production base.
- Anionic grades led product types with 44.0% of 2025 value, as sulfated and sulfonated fatty alcohol derivatives remain the main foaming base in detergents.
- BASF inaugurated an expanded alkyl polyglucoside plant at Bangpakong, Thailand, on Nov. 19, 2025, adding regional supply of a mild plant-based nonionic.
- Microbial fermentation is the fastest-growing technology at 8.93% a year during 2026–2035, as glycolipid biosurfactants move from pilot volumes into cleaners and cosmetics.
Anionics and personal care lead, fermentation grows fastest
Why do anionic grades still carry the most value?
Based on product type, the market is categorized into Anionic, Nonionic, Amphoteric and Cationic. Anionic led with 44.0% of 2025 value, because sulfated fatty alcohols from palm kernel and coconut oil remain the main foaming base in shampoos, dish liquids and laundry products. Amphoteric grades grow fastest at 6.43% a year, as formulators add betaines and amino acid derivatives to make cleansers milder.
How do personal care brands shape regional demand?
Based on end-use industry, the market is categorized into Personal Care and Cosmetics, Home Care, Process and Institutional Markets and Agriculture and Resource Industries. Personal Care and Cosmetics led with 38.0% of 2025 value and also grows fastest at 5.99% a year, because brands pay more for mild renewable cleansing systems. Home care follows closely, since dish and laundry products use large volumes of plant-derived anionics.
Why does cleansing and foaming dominate use?
Based on application, the market is categorized into Cleansing and Foaming, Wetting and Dispersion, Emulsification and Solubilization and Conditioning and Antistatic Treatment. Cleansing and Foaming led with 52.0% of 2025 value, because every wash-off product needs a primary foaming surfactant. Emulsification and solubilization grows fastest at 6.03% a year, as skin care, makeup removers and crop sprays use more plant-based emulsifiers and solubilizers.
How fast is fermentation gaining against chemical routes?
Based on technology, the market is categorized into Sulfonation and Sulfation, Alkoxylation and Glycosidation, Acylation and Quaternization and Microbial Fermentation. Sulfonation and Sulfation led with 40.0% of 2025 value, because fatty alcohol sulfates and ether sulfates are made at large scale across the region. Microbial fermentation grows fastest at 8.93% a year, as rhamnolipids, sophorolipids and other glycolipids gain commercial volumes.
| Segment Group | Leading Sub-segment | Share, 2025 | Fastest-growing Sub-segment | CAGR, 2026–2035 |
|---|---|---|---|---|
| By Product Type | Anionic | 44.0% | Amphoteric | 6.43% |
| By End-Use Industry | Personal Care and Cosmetics | 38.0% | Personal Care and Cosmetics | 5.99% |
| By Application | Cleansing and Foaming | 52.0% | Emulsification and Solubilization | 6.03% |
| By Technology | Sulfonation and Sulfation | 40.0% | Microbial Fermentation | 8.93% |
Request a Free Sample
Fill in your details and we'll send you a free sample report.
- Sample data tables & charts
- Research methodology
Local APG supply, mild reformulation and traceable feedstock
How does regional APG capacity widen renewable supply?
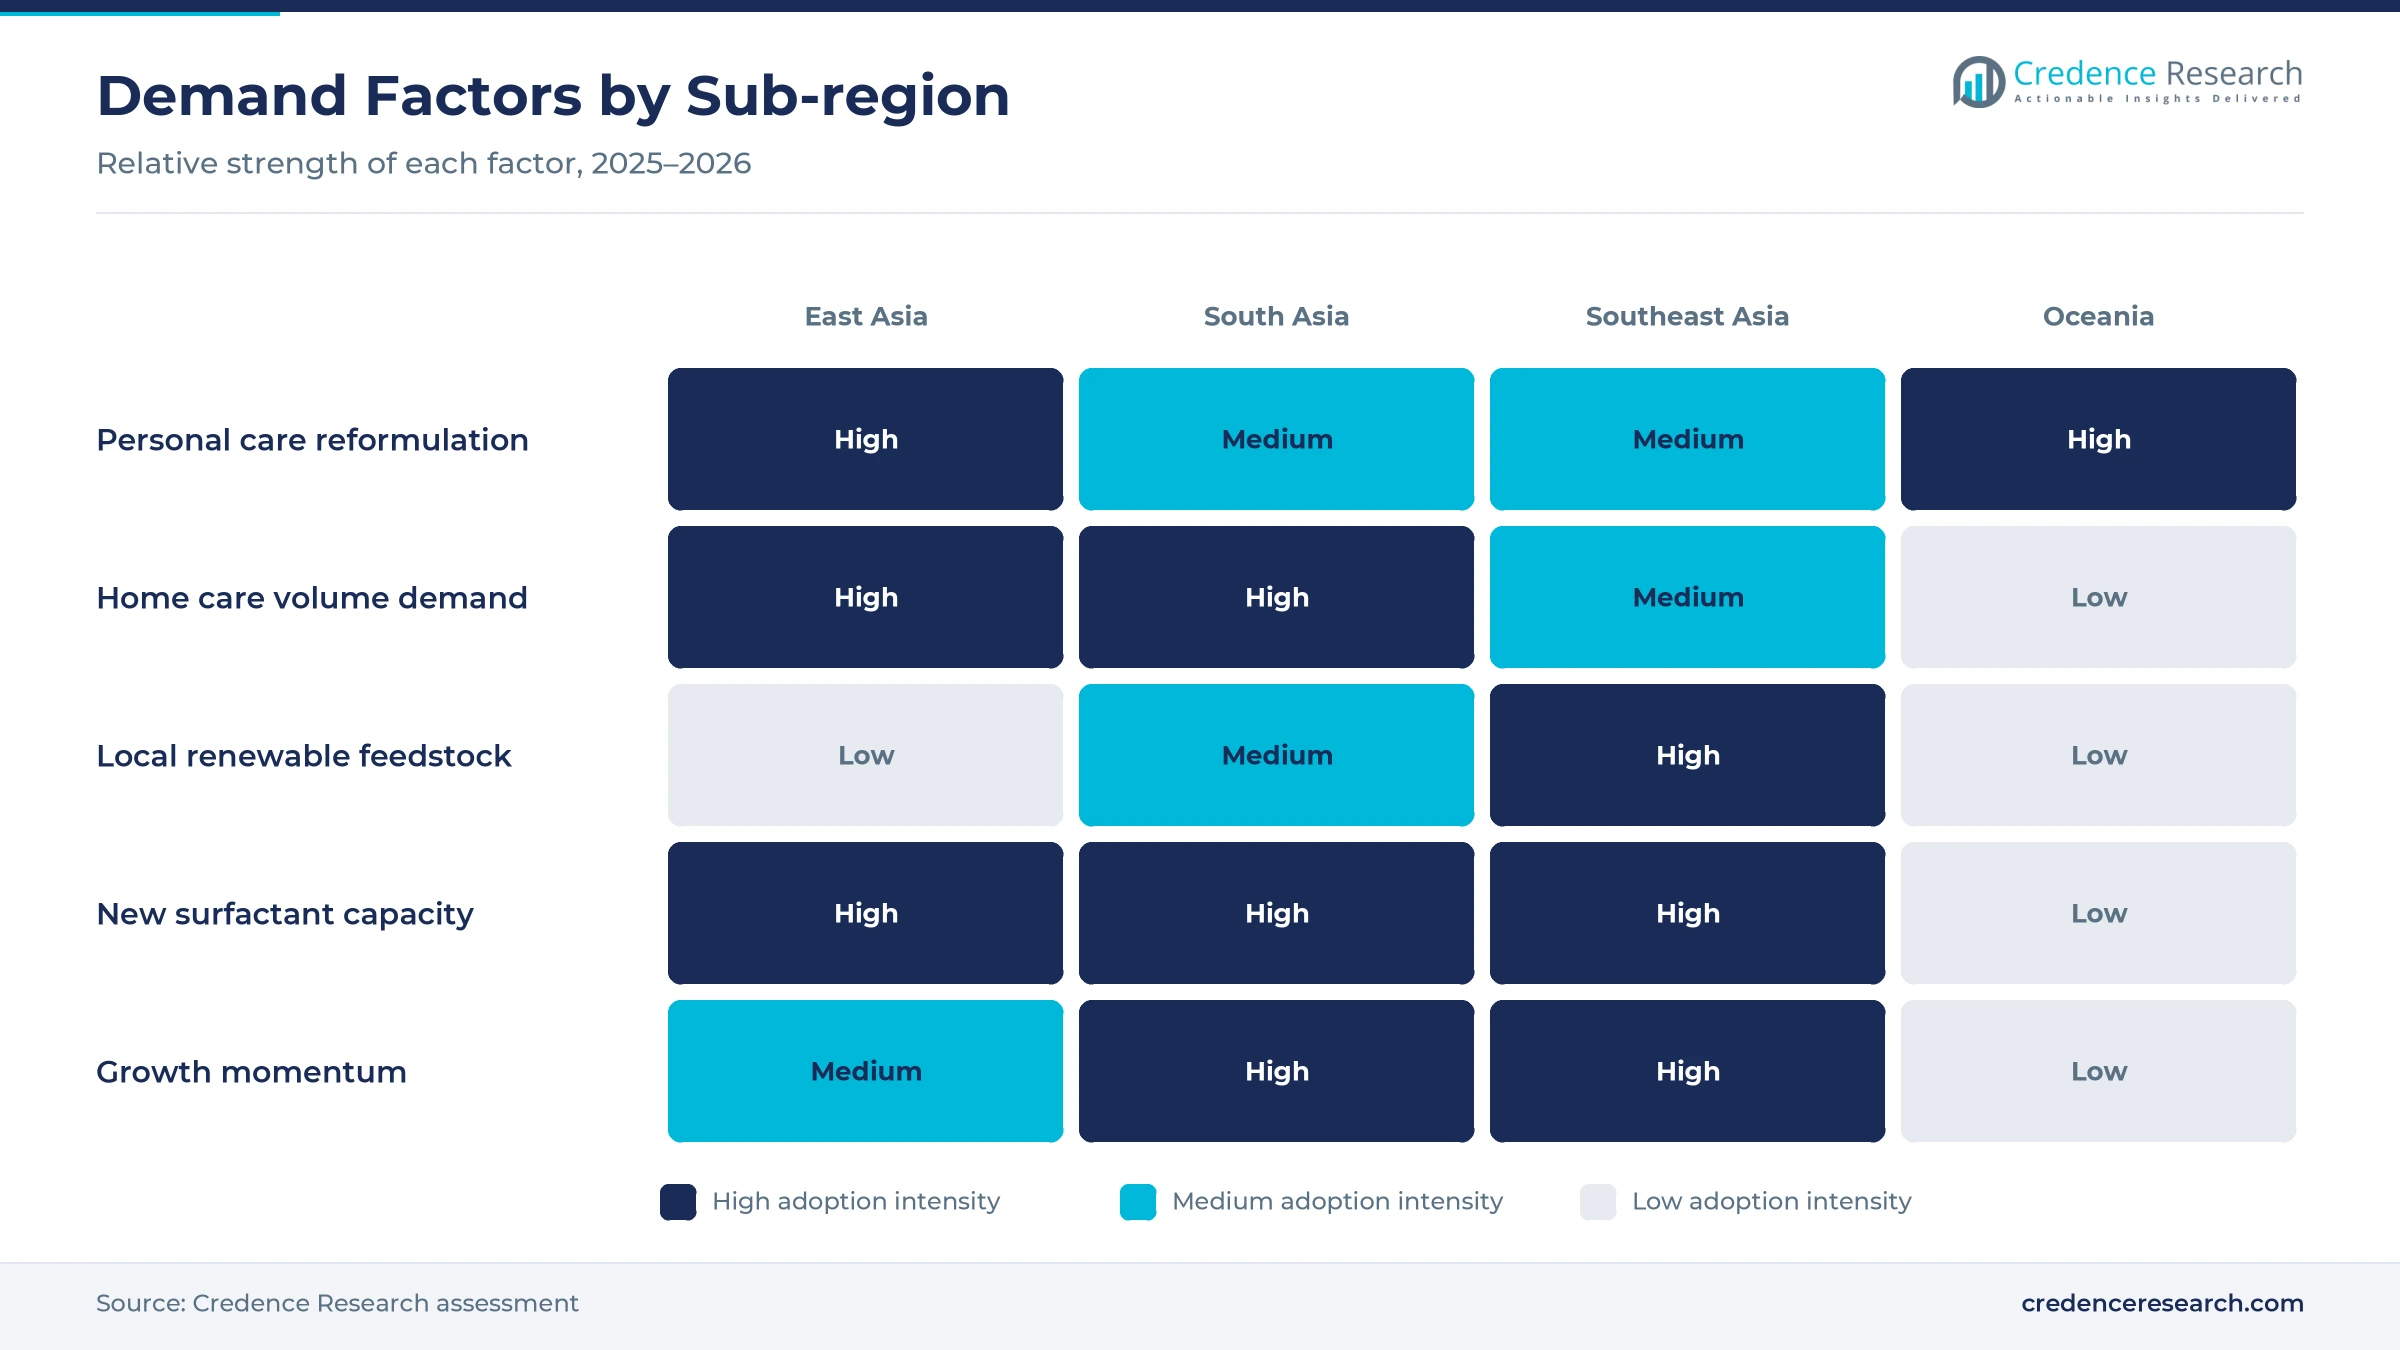
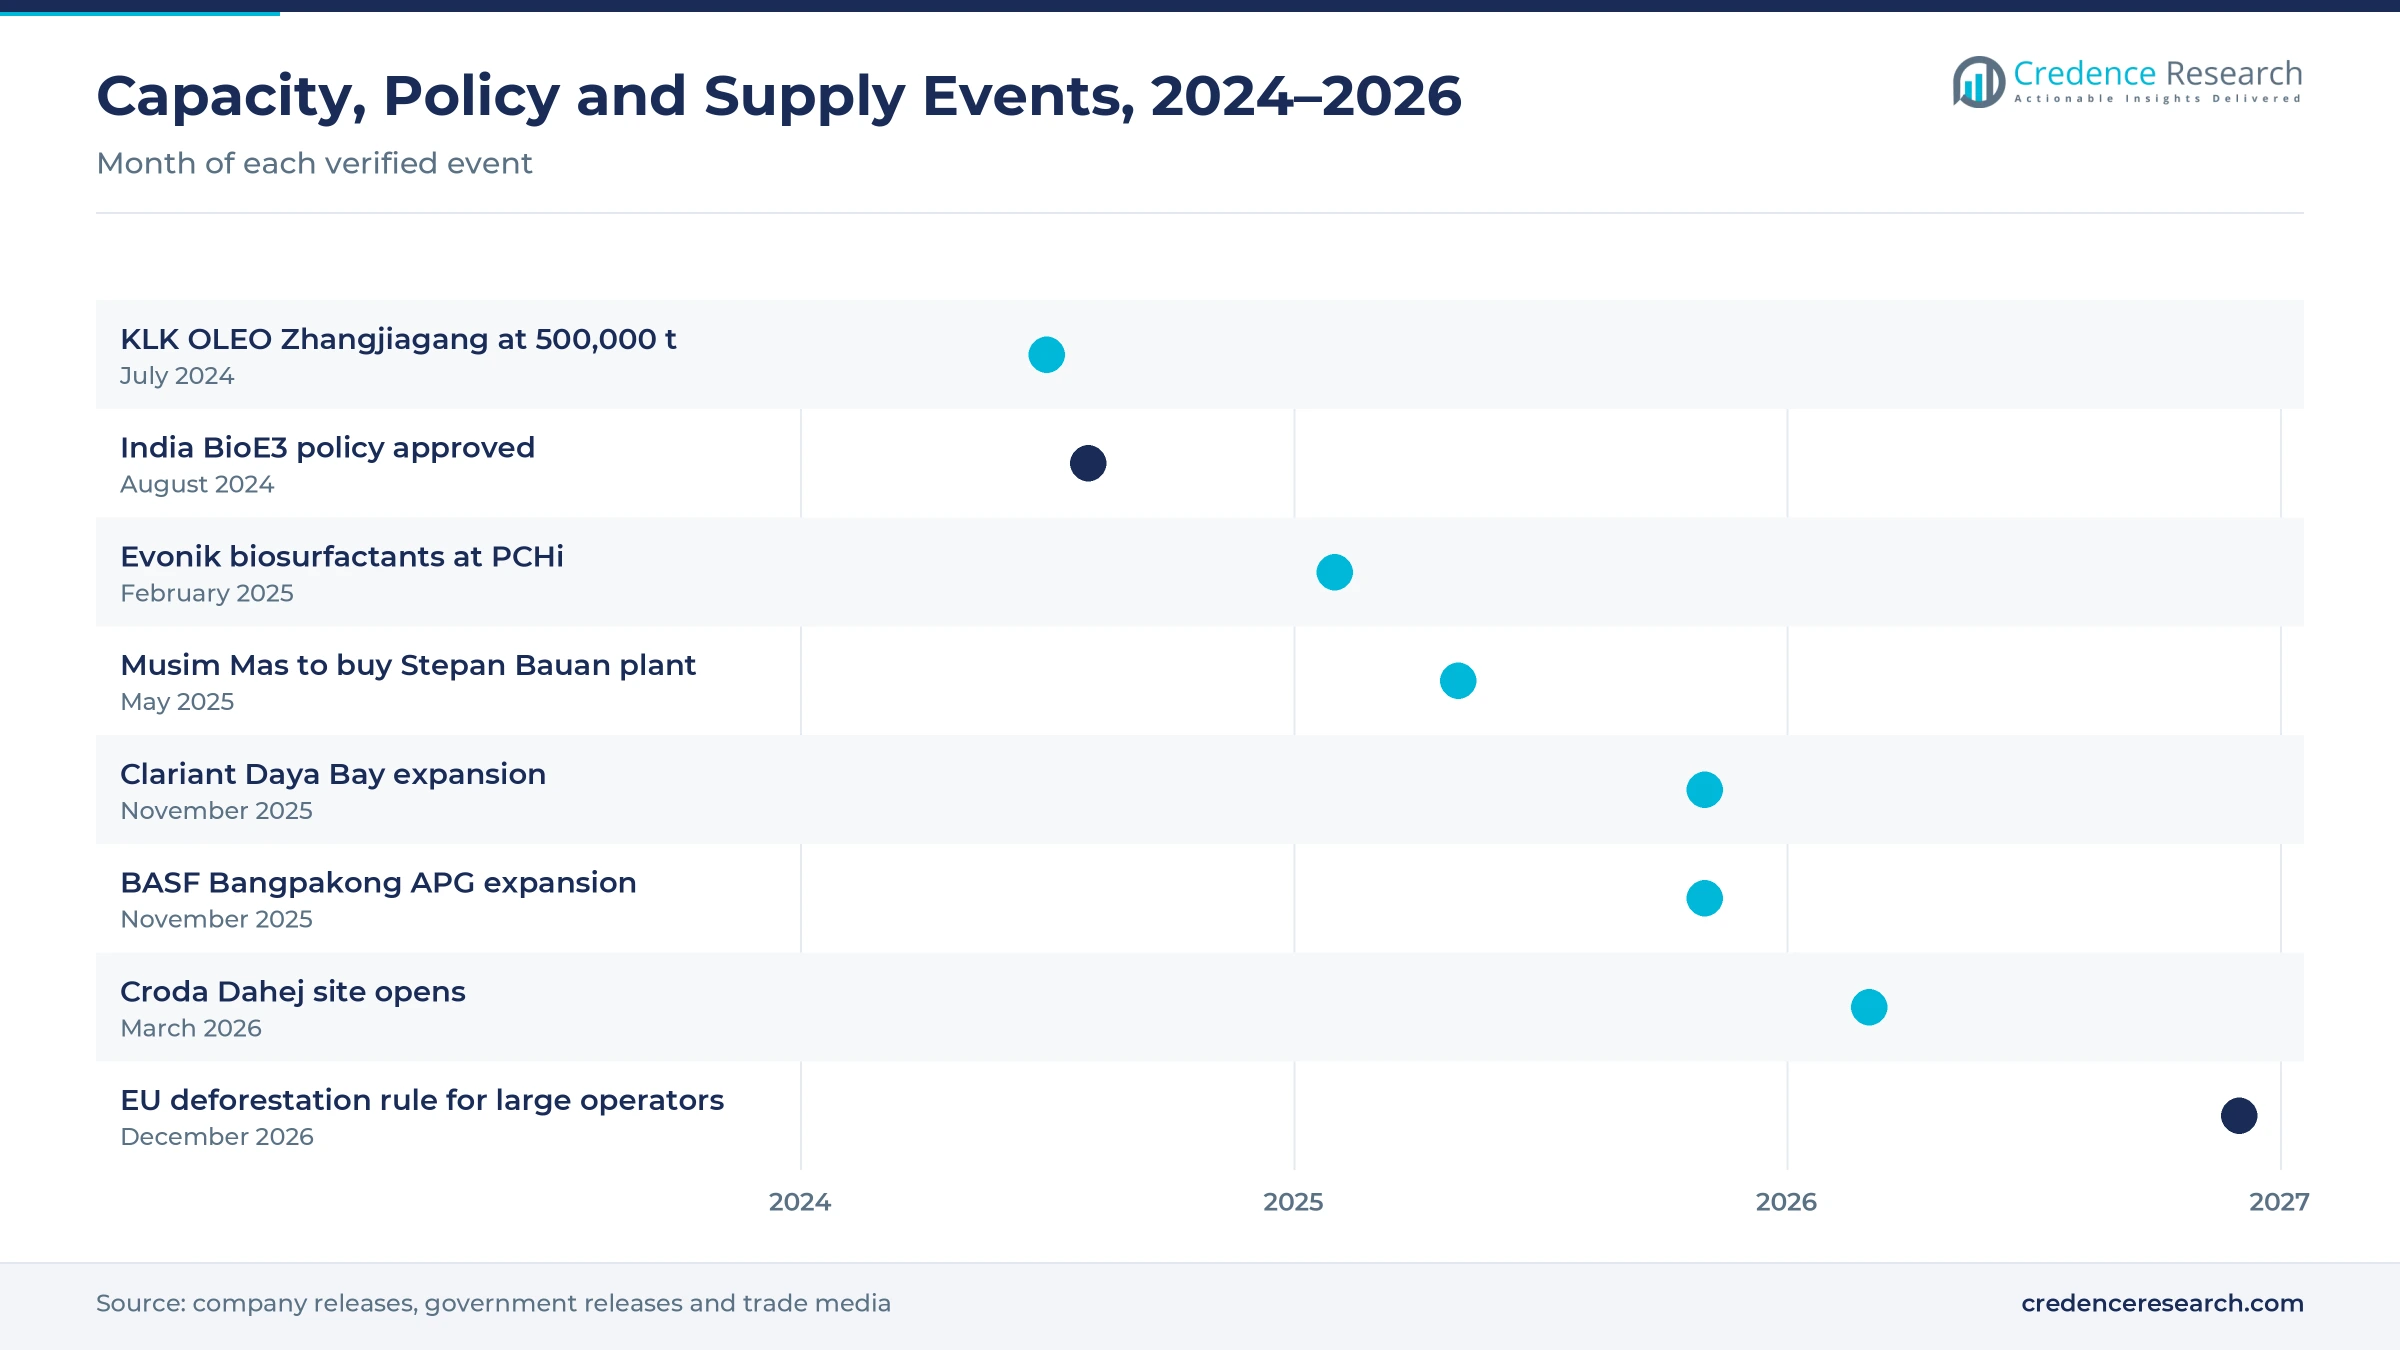
Producers are adding alkyl polyglucoside capacity inside the region, which shortens lead times for formulators that want mild, plant-derived nonionic ingredients. BASF inaugurated an expanded APG plant at its Bangpakong site in Chonburi, Thailand, on Nov. 19, 2025, adding to its existing APG production in Jinshan, China. The company said APGs are made from fully renewable raw materials and serve personal care, home care, industrial cleaning and agricultural customers. KLK OLEO's Zhangjiagang complex in China also reached 500,000 tons of annual processing capacity after a new fatty acid and glycerine plant, F&L Asia reported in July 2024. As a result, alkoxylation and glycosidation held a large technology share in 2025, and Southeast Asia grows at 6.35% a year.
Why are brands reformulating for milder cleansing?
Brand owners in China and across Asia are reformulating shampoos, body washes and facial cleansers around milder plant-derived surfactants that still foam well. China's cosmetics retail sales reached 465.3 billion yuan in 2025, up 5.1%, while daily necessities rose 6.3% to 867.5 billion yuan, according to the National Bureau of Statistics. Evonik presented ingredients developed for China at PCHi 2025 in Guangzhou in February 2025, including glycolipid biosurfactants made from corn feedstock. Galaxy Surfactants reported double-digit specialty volume growth in the September 2025 quarter, while its rest-of-world volumes gained in Latin America and Asia Pacific. As a result, personal care and cosmetics led end uses with 38.0% of 2025 value.
How do traceable palm and coconut chains lift demand?
Multinational buyers increasingly ask for traceable palm and coconut derivatives, which favors surfactant makers that can document certified oleochemical chains. Certified sustainable palm oil output rose 7.3% to 9.27 million tons in 2023, and certified plantation area reached about 2.7 million hectares, InfoSAWIT reported from RSPO data in September 2025. The EU deforestation regulation will apply to large operators from Dec. 30, 2026, after a further delay, The Star reported on Dec. 19, 2025, so Asian exporters of palm-based ingredients must prove deforestation-free origin. Croda said its new Dahej site in India, inaugurated in March 2026, uses RSPO-certified oleochemicals. Therefore, producers with segregated or mass-balance supply win more contracts from global brands.
How does India's bio-manufacturing policy add capacity?
India is building its own renewable chemicals base, which supports faster growth for plant-derived surfactants in South Asia. The Union Cabinet approved the BioE3 policy on Aug. 24, 2024, naming bio-based chemicals and enzymes as one of six priority biomanufacturing sectors. Croda invested about GBP 50 million in a greenfield alkoxylation plant at Dahej, Gujarat, which runs entirely on renewable electricity, Machinist reported in August 2025. Galaxy Surfactants said India's GST rate cut on consumer goods led large customers to adjust inventories in the September 2025 quarter, and its management expected the reform to lift consumption over the medium term. As a result, South Asia gains regional share through 2035, led by Indian personal care and laundry demand.
Biosurfactants, local labs and feedstock-integrated plants
How are fermentation-made biosurfactants changing supply?
Suppliers are shifting part of their renewable range toward glycolipids made by microbial fermentation, which offer strong foam and full biodegradability. Evonik inaugurated the first industrial-scale rhamnolipid plant in Slovakia in 2024, and it presented RHEANCE One for personal care and the REWOFERM series for household cleaners to Chinese customers at PCHi in Guangzhou from Feb. 19 to 21, 2025. Evonik said these glycolipids are made from renewable corn feedstock through a biotechnological process. Ajinomoto makes its Amisoft surfactants from glutamic acid obtained by plant-based fermentation, and a USD 21 million plant in Brazil raised its global Amisoft capacity by about 60%, according to Speciality Chemicals Magazine. As a result, microbial fermentation grows fastest by technology at 8.93% a year from a small base.
Why is the shift to local application laboratories notable?
Global suppliers are moving formulation and testing work into China, so local brands can launch mild renewable products faster. Clariant unveiled a CHF 80 million Care Chemicals expansion at Daya Bay on Nov. 5, 2025, adding reactor capacity for ethylene oxide derivatives and mild surfactants for beauty and home care customers. Nouryon opened a Shanghai innovation center on Nov. 10, 2025, with eight laboratories and a customer experience center for personal care, CHEManager reported. Evonik also said it adopted a more locally focused organization for Greater China to respond faster to customers. Therefore, contract formulation manufacturers gain quicker access to tested renewable systems and ready-made starting formulas.
Can Southeast Asian feedstock owners open new supply?
Palm and coconut producers in Southeast Asia have an opening to move further downstream into finished surfactants, because they control the main lauric feedstocks. Musim Mas agreed on May 28, 2025, to buy Stepan's surfactant plant at Bauan, Batangas, in the Philippines, with fabric softeners as a major focus, Lokmat Times reported. In an April 2025 report, the U.S. Department of Agriculture's Foreign Agricultural Service forecast Indonesia's palm oil output to rise 3% to 47 million metric tons in 2025/26. Kao already operates fatty alcohol bases in the Philippines and Malaysia, which supply surfactant makers across Asia. As a result, Southeast Asia can capture more value as a producer as well as a consumer.
Can amphoteric and amino acid systems open premium demand?
Mild amphoteric and amino acid surfactants offer an opening for premium skin and hair care, where brands promise low irritation without losing foam. Amphoteric grades are the fastest-growing product type at 6.43% a year, as betaines and glutamate-based cleansers replace part of the sulfate base. Ajinomoto's Amisoft range is used mainly in shampoos, shower gels and face washes, and its Kawasaki plant in Japan was redirected to liquid Amilite, a glycine-based amino acid cleansing range, lifting global liquid capacity by about 30%, Speciality Chemicals Magazine reported. Galaxy Surfactants cited growing demand for masstige specialties in Asia Pacific in May 2025, and its specialty volumes grew at double digits in the quarter ended September 2025. Therefore, suppliers of mild co-surfactants can earn higher margins than commodity sulfate producers.
Lauric oil prices and compliance costs squeeze margins
How do lauric oil price spikes hit producers?
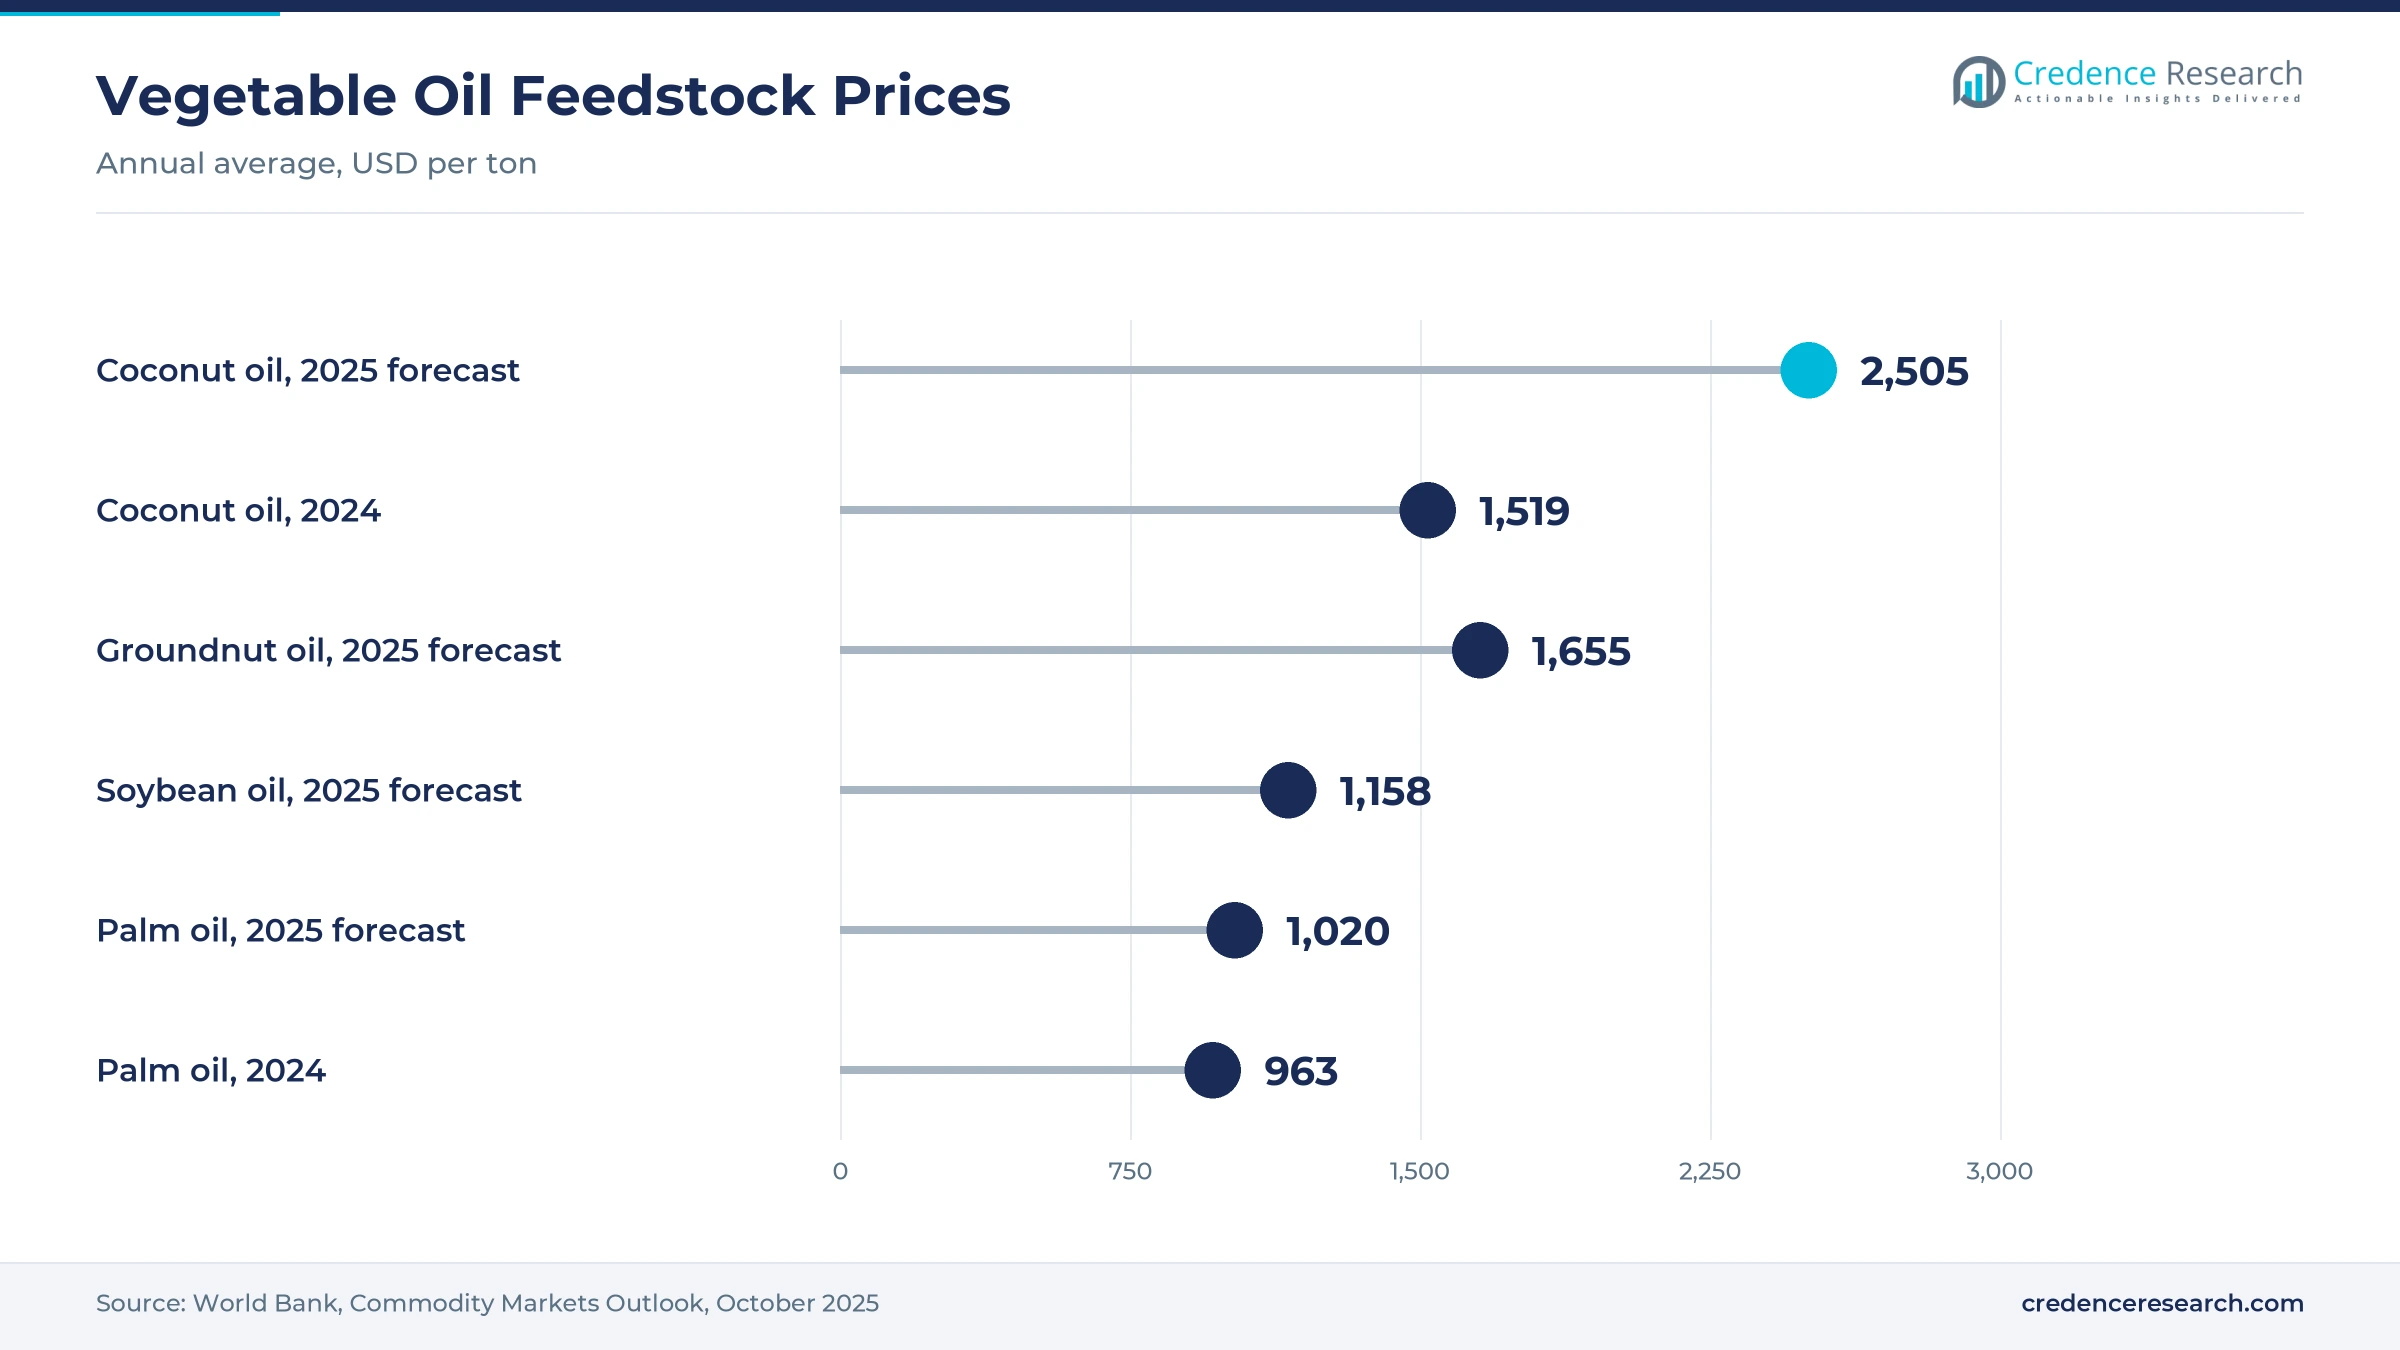
Coconut and palm kernel oil supply the short-chain fatty alcohols that natural anionics need, so their prices drive ingredient costs. Coconut oil averaged USD 1,519 per ton in 2024 and was forecast at USD 2,505 in 2025, according to the World Bank. Galaxy Surfactants said feedstock prices stayed high because palm kernel oil output fell short in the September 2025 quarter. As a result, some customers reformulated products to cut cost, and producers now hedge purchases and blend palm and coconut sources to protect margins.
Why does the price gap with petrochemical grades persist?
Many renewable surfactants still cost more than petrochemical alternatives, especially APGs, amino acid grades and fermentation products made at smaller scale. Price-sensitive household brands in South and Southeast Asia therefore keep linear alkylbenzene sulfonate as their main base. In turn, plant-derived grades win share mainly in premium personal care, where shoppers accept higher shelf prices. Suppliers narrow the gap through larger plants, blended systems and certified claims that let brands charge more for finished products.
How do traceability rules burden smallholder supply?
Traceability rules require proof of origin back to plantations, and many palm and coconut growers are smallholders with limited records. RSPO-certified smallholders reached 25,579 in 2023, covering only 58,418 hectares, InfoSAWIT reported. As a result, certified volumes stay limited and command premiums that raise surfactant costs for brand owners and contract formulators. Producers respond with smallholder training programs, plantation mapping tools and mass-balance supply, which spreads certified volumes across more product lines.
Why do performance limits slow switching in industry?
Industrial and institutional cleaners often need stability in hard water, high alkalinity or high temperatures, where some plant-derived grades perform less consistently. Formulators therefore need extra testing before they replace proven petrochemical systems. In turn, switching cycles in process and institutional markets take longer than in personal care, and buyers often run plant trials for a year or more. Suppliers respond with blended systems, published application data and local technical service teams that support customer trials.
China-led East Asia dominates as India lifts South Asia
| Sub-region | Value, 2025 (USD billion) | Share, 2025 | CAGR, 2026–2035 |
|---|---|---|---|
| East Asia | 5.65 | 70.9% | 5.25% |
| South Asia | 1.01 | 12.7% | 6.85% |
| Southeast Asia | 0.86 | 10.8% | 6.35% |
| Oceania | 0.45 | 5.6% | 5.15% |
Why does East Asia hold most regional value?
East Asia held 70.9% of 2025 value and grows at 5.25% a year, slightly below the regional rate. China is the anchor, with cosmetics retail sales of 465.3 billion yuan in 2025 and large detergent plants in coastal provinces. BASF makes APGs in Jinshan, Clariant expanded Daya Bay in November 2025, and KLK OLEO processes oleochemicals in Zhangjiagang. Japan and South Korea add premium personal care demand, although slower volume growth keeps the sub-region's rate modest.
How does South Asia become the fastest-growing sub-region?
South Asia held 12.7% of 2025 value and grows fastest at 6.85% a year. India leads this sub-region, where the BioE3 policy of August 2024 supports bio-based chemicals and Croda opened its Dahej alkoxylation site in March 2026. Galaxy Surfactants supplies performance and specialty grades from India to domestic and export customers. Rising use of fatty alcohol ethoxylates in laundry and personal care also supports local demand.
Why is Southeast Asia both feedstock base and growth market?
Southeast Asia held 10.8% of 2025 value and grows at 6.35% a year, above the regional average. Indonesia, Malaysia and the Philippines supply most of the palm kernel and coconut oil that natural anionics need. BASF expanded APG output in Thailand in November 2025, and Musim Mas agreed to buy a Philippine surfactant plant in May 2025. As a result, more value now stays in the producing countries.
How does Oceania sustain steady premium demand?
Oceania held 5.6% of 2025 value and grows at 5.15% a year, the slowest rate in the region. Australia and New Zealand import most of their surfactant ingredients from Asian and European plants. Their personal care and home care brands favor plant-derived and readily biodegradable claims, which keeps unit values high. However, a small population limits volume growth compared with the larger Asian sub-regions.
Plant expansions and acquisitions from 2024 to 2026
| Development | Status and market relevance |
|---|---|
| In July 2024, KLK OLEO's Zhangjiagang complex in China reached 500,000 tons of annual processing capacity after a new fatty acid and glycerine plant. | Raises regional oleochemical feedstock supply |
| In May 2025, Musim Mas agreed to buy Stepan's surfactant manufacturing plant at Bauan, Batangas, in the Philippines. | Moves a palm producer into finished surfactants |
| In November 2025, Clariant unveiled a CHF 80 million Care Chemicals expansion at Daya Bay, China. | Adds mild surfactant and ethoxylate capacity |
| In November 2025, BASF inaugurated an expanded alkyl polyglucoside plant at Bangpakong, Thailand. | Adds local supply of bio-based APGs |
| In March 2026, Croda inaugurated its greenfield Dahej manufacturing site in Gujarat, India. | Uses RSPO-certified oleochemicals and renewable power |
Glycosidation and fermentation reshape ingredient supply
- Glycosidation joins fatty alcohols with plant sugars to make alkyl polyglucosides, which BASF now produces in China and Thailand.
- Microbial fermentation turns sugars or corn feedstock into glycolipid biosurfactants such as rhamnolipids, which foam well and break down fully.
- Amino acid acylation links fatty acids with glutamic acid or glycine to make very mild cleansers for face washes and baby care.
- Certified feedstock tracking records palm and coconut origin through mass-balance or segregated supply, which helps exporters meet EU rules on oleochemical imports.
Need a Custom Version of This Report?
Tailor the scope, geography, or segments to your exact requirements.
- Custom geography or segment scope
- Direct access to our analyst team
Global specialty firms face integrated palm producers
Competition combines global specialty chemical groups with Asian oleochemical producers that control palm and coconut feedstocks. BASF, Clariant, Evonik and Croda compete on mild, certified and biodegradable portfolios, backed by local plants and application laboratories in China, Thailand and India. KLK OLEO and Kao draw on integrated fatty alcohol and fatty acid production in Malaysia, the Philippines and China. Galaxy Surfactants serves Indian and export customers with performance and specialty grades, while Nouryon focuses on specialty chemistry and opened a larger Shanghai innovation center in November 2025. Stepan agreed to sell its Philippine surfactant plant to Musim Mas, which shows feedstock owners moving downstream. Sino Lion competes in amino acid-based cosmetic ingredients for personal care. Suppliers compete on mildness, foam, certification, local service and price.
Companies profiled and their roles in this market
| Company | Type | Role in the market |
|---|---|---|
| BASF SE | German specialty chemical group | Inaugurated an expanded APG plant in Bangpakong, Thailand, in November 2025 and also makes APGs in Jinshan, China |
| Kao Corporation | Japanese consumer and chemical group | Runs fatty alcohol bases in the Philippines and Malaysia and makes tertiary amines used in surfactants |
| KLK OLEO | Malaysian oleochemical producer | Raised its Zhangjiagang, China, complex to 500,000 tons of annual processing capacity |
| Evonik Industries AG | German specialty chemical group | Showed glycolipid biosurfactants and China-developed ingredients at PCHi 2025 in Guangzhou |
| Galaxy Surfactants Limited | Indian surfactant producer | Reported double-digit specialty volume growth in the September 2025 quarter |
| Croda International Plc | British specialty chemical group | Opened a greenfield Dahej site in India in March 2026 using RSPO-certified oleochemicals |
| Nouryon | Dutch specialty chemical group | Opened a Shanghai innovation center with a personal care customer experience center in November 2025 |
| Clariant AG | Swiss specialty chemical group | Completed a CHF 80 million Care Chemicals expansion at Daya Bay, China, in November 2025 |
| Stepan Company | U.S. surfactant producer | Agreed in May 2025 to sell its Bauan, Philippines, surfactant plant to Musim Mas |
Credence Research view on regional demand
Credence Research's view is that Asia Pacific natural surfactant demand will grow steadily because brands keep moving wash-off products toward milder plant-derived systems while suppliers build capacity close to customers. East Asia remains the anchor market, while India adds the most new demand and capacity. Lauric oil prices are the main swing factor for margins. Suppliers that secure certified feedstock, run local application labs and offer amphoteric, APG and fermentation-based grades are best placed through 2035.
How the regional estimate was built
The report uses 2025 as the base year and presents market values in USD million through 2035. Market values come from the Credence Research model, and sub-region, product type, end-use industry, application and technology splits are Credence Research estimates. Sub-regional shares follow the Credence Research regional model, checked against cosmetics and daily necessities sales, feedstock output and the location of surfactant plants. Inputs include national statistics, World Bank commodity data, government releases, company press releases and trade media. No interviews or surveys were used in preparing these estimates.
Mild cleansers and South Asia lead growth to 2035
The Asia Pacific natural surfactants market is expected to reach USD 13.76 billion by 2035, a 5.58% CAGR during 2026–2035, as brands reformulate for mildness and suppliers add APG, alkoxylation and fermentation capacity in the region. South Asia and Southeast Asia should gain share, while East Asia stays the largest sub-region. Amphoteric grades, personal care uses and fermentation-made biosurfactants are expected to grow faster than the regional average. Prolonged high coconut oil prices would lower this outlook, while faster certified supply would raise it.
Frequently Asked Questions
How big is the Asia Pacific natural surfactants market?
Which sub-region leads demand?
Which sub-region grows fastest?
Which product type holds the largest share?
Which technology grows fastest?
Why do alkyl polyglucosides matter for the region?
What is the main challenge for producers?
Who are the main companies in the market?
Table of Content
Chapter 1 Market Segmentation
- 1.1 Segmentation Framework
- 1.1.1 Product and Service Classification
- 1.1.2 Application and End-Use Classification
- 1.1.3 Technology and Solution Classification
- 1.1.4 Customer and Distribution Channel Classification
- 1.1.5 Geographic Segmentation
- 1.1.6 Market Segment Definitions and Boundaries
- 1.2 By Product Type
- 1.2.1 Anionic
- 1.2.2 Nonionic
- 1.2.3 Amphoteric
- 1.2.4 Cationic
- 1.3 By End-Use Industry
- 1.3.1 Personal Care and Cosmetics
- 1.3.2 Home Care
- 1.3.3 Process and Institutional Markets
- 1.3.4 Agriculture and Resource Industries
- 1.4 By Application
- 1.4.1 Cleansing and Foaming
- 1.4.2 Wetting and Dispersion
- 1.4.3 Emulsification and Solubilization
- 1.4.4 Conditioning and Antistatic Treatment
- 1.5 By Technology
- 1.5.1 Sulfonation and Sulfation
- 1.5.2 Alkoxylation and Glycosidation
- 1.5.3 Acylation and Quaternization
- 1.5.4 Microbial Fermentation
- 1.6 By Sub-region
- 1.6.1 East Asia
- 1.6.2 South Asia
- 1.6.3 Southeast Asia
- 1.6.4 Oceania
Chapter 2 Introduction
- 2.1 Report Objectives and Scope
- 2.2 Product Definition and Industry Terminology
- 2.3 Market Inclusions and Exclusions
- 2.4 Research Process
- 2.4.1 Primary Research and Expert Interviews
- 2.4.2 Secondary Research and Source Review
- 2.4.3 Top-Down and Bottom-Up Estimation
- 2.4.4 Data Triangulation and Verification
- 2.5 Market Size Measurement Basis
- 2.5.1 2025: USD 7.97 billion → 2035: USD 13.76 billion
- 2.6 Historical and Forecast Reference Periods
- 2.6.1 Historical Period: 2018-2025
- 2.6.2 Base Year: 2025
- 2.6.3 Forecast Period: 2025-2035
- 2.7 Research Assumptions and Limitations
Chapter 3 Executive Summary
- 3.1 Market Snapshot and Key Findings
- 3.2 Base-Year Market Size, 2025
- 3.3 Forecast Market Size, 2035
- 3.4 Revenue and Volume Growth Outlook
- 3.5 Key Demand and Supply Indicators
- 3.6 Leading Market Segments
- 3.7 Fastest-Growing Market Opportunities
- 3.8 Regional Performance Highlights
- 3.9 Technology and Industry Transformation
- 3.10 Competitive Landscape Summary
- 3.11 Analyst View and Strategic Implications
Chapter 4 Asia Pacific Natural Surfactants Market Trends and Developments
- 4.1 Historical Industry Development, 2018-2025
- 4.2 Recent Market Trends and Developments
- 4.3 Demand and Customer Behavior Trends
- 4.4 Technology and Product Innovation
- 4.5 Artificial Intelligence, Automation and Digitalization
- 4.6 Local Manufacturing and Supply Chain Realignment
- 4.7 Industry Partnerships, Mergers and Acquisitions
- 4.8 Sustainability and Circular Economy Developments
- 4.9 Government and Private Sector Investment Trends
- 4.10 Emerging Business Models and Commercialization
- 4.11 Industry Developments and Announcements
Chapter 5 Asia Pacific Natural Surfactants Market Production, Supply and Demand Analysis
- 5.1 Demand Trend and Consumption Analysis, 2018-2025
- 5.2 Demand Forecast, 2025-2035
- 5.3 Production and Output Trend, 2018-2025
- 5.4 Production and Output Forecast, 2025-2035
- 5.5 Installed Capacity and Capacity Utilization
- 5.6 Company-Wise Production Plants and Statistics
- 5.6.1 Installed Production Capacity
- 5.6.2 Actual Production
- 5.6.3 Planned Capacity and Expansion Targets
- 5.7 Supply Chain Structure and Procurement Trends
- 5.8 Supply-Demand Gap and Bottlenecks
- 5.9 Import Dependence and Sourcing Structure
- 5.10 Contract Manufacturing and Outsourcing
- 5.11 Regional Supply and Demand Concentration
Chapter 6 Asia Pacific Natural Surfactants Market Pricing Analysis
- 6.1 Pricing Structure and Measurement
- 6.2 Historical Pricing Trends, 2018-2025
- 6.3 Pricing Outlook, 2025-2035
- 6.4 Average Selling Price and Unit Economics
- 6.5 Pricing by Product and Market Segment
- 6.6 Geographic Pricing Differences
- 6.7 Key Input, Energy, Labor and Logistics Costs
- 6.8 Contract Pricing and Purchasing Models
- 6.9 Pricing Sensitivity and Competitive Positioning
- 6.10 Price, Margin and Profitability Implications
Chapter 7 Asia Pacific Natural Surfactants Market Dynamics
- 7.1 Market Growth Drivers
- 7.1.1 Demand-Side Drivers
- 7.1.2 Technology and Innovation Drivers
- 7.1.3 Infrastructure and Investment Drivers
- 7.1.4 Regulatory and Policy Drivers
- 7.2 Market Restraints
- 7.2.1 Cost and Affordability Constraints
- 7.2.2 Technology and Adoption Barriers
- 7.2.3 Supply Chain and Operational Constraints
- 7.3 Market Challenges
- 7.3.1 Competitive Pressure and Margin Erosion
- 7.3.2 Skills, Infrastructure and Implementation Gaps
- 7.4 Emerging Market Opportunities
- 7.5 Market Dynamics Impact and Time-Horizon Assessment
Chapter 8 Asia Pacific Natural Surfactants Value Chain Analysis
- 8.1 Industry Value Chain Overview
- 8.2 Upstream Suppliers and Critical Inputs
- 8.3 Technology and Component Providers
- 8.4 Manufacturing or Service Delivery
- 8.5 Distribution, Channel Partners and Integrators
- 8.6 Downstream Applications and End Users
- 8.7 Value Addition and Profit Pools
- 8.8 Vertical Integration and Outsourcing
- 8.9 Supplier Concentration and Risk
- 8.10 Supply Chain Localization and Resilience
Chapter 9 Asia Pacific Natural Surfactants Market Regulations and Policies
- 9.1 Relevant Laws, Standards and Compliance Frameworks
- 9.2 Product, Service, Safety and Quality Requirements
- 9.3 Government Policies, Incentives and Subsidies
- 9.4 Imports, Exports and Trade Barriers
- 9.5 Public Procurement and Local Content Requirements
- 9.6 Environmental and Sustainability Compliance
- 9.7 Upcoming Policy Changes and Market Implications
Chapter 10 Asia Pacific Natural Surfactants Market Hotspots and Opportunities
- 10.1 Market Opportunity Mapping and Growth Hotspots
- 10.2 High-Growth Applications and Customer Groups
- 10.3 Underserved Markets and White-Space Opportunities
- 10.4 Emerging Technology and Product Opportunities
- 10.5 New Capacity and Investment Hotspots
- 10.6 Market Entry and Expansion Opportunities
- 10.7 Distribution and Partnership Opportunities
- 10.8 Near-Term and Long-Term Commercial Potential
- 10.9 Opportunity Attractiveness and Execution Risks
Chapter 11 Asia Pacific Natural Surfactants Market Outlook, 2025-2035
- 11.1 Market Size and Analysis
- 11.1.1 Revenue (Market Measurement: 2025: USD 7.97 billion → 2035: USD 13.76 billion)
- 11.1.2 Market Volume and Quantity Sold
- 11.1.3 Historical Market Size, 2018-2025
- 11.1.4 Base-Year Market Size, 2025
- 11.2 Market Forecast, 2025-2035
- 11.2.1 Revenue Forecast to 2035
- 11.2.2 Volume Forecast to 2035
- 11.2.3 CAGR and Year-on-Year Growth
- 11.2.4 Incremental Revenue Opportunity
- 11.3 Forecast Assumptions and Scenario Analysis
- 11.3.1 Base-Case Forecast
- 11.3.2 Optimistic and Conservative Scenarios
- 11.3.3 Technology, Pricing and Policy Sensitivities
- 11.4 Market Attractiveness and Growth Outlook
Chapter 12 Asia Pacific Natural Surfactants Market Segmentation and Outlook
- 12.1 Segmentation Summary and Market Shares, 2025
- 12.2 Largest and Fastest-Growing Segments
- 12.3 By Product Type - Market Size and Forecast, 2025-2035
- 12.3.1 Segment Definition and Scope
- 12.3.2 Historical Market Size, 2018-2025
- 12.3.3 Revenue Forecast, 2025-2035
- 12.3.4 Volume Forecast, 2025-2035
- 12.3.5 Base-Year Market Share, 2025
- 12.3.6 Segment CAGR and Growth Drivers
- 12.3.7 Subsegment Market Size and Forecast
- 12.3.7.1 Anionic
- 12.3.7.2 Nonionic
- 12.3.7.3 Amphoteric
- 12.3.7.4 Cationic
- 12.3.8 Subsegment Pricing and Adoption Trends
- 12.3.9 Leading Suppliers and Competition
- 12.3.10 Regional Demand and Opportunities
- 12.4 By End-Use Industry - Market Size and Forecast, 2025-2035
- 12.4.1 Segment Definition and Scope
- 12.4.2 Historical Market Size, 2018-2025
- 12.4.3 Revenue Forecast, 2025-2035
- 12.4.4 Volume Forecast, 2025-2035
- 12.4.5 Base-Year Market Share, 2025
- 12.4.6 Segment CAGR and Growth Drivers
- 12.4.7 Subsegment Market Size and Forecast
- 12.4.7.1 Personal Care and Cosmetics
- 12.4.7.2 Home Care
- 12.4.7.3 Process and Institutional Markets
- 12.4.7.4 Agriculture and Resource Industries
- 12.4.8 Subsegment Pricing and Adoption Trends
- 12.4.9 Leading Suppliers and Competition
- 12.4.10 Regional Demand and Opportunities
- 12.5 By Application - Market Size and Forecast, 2025-2035
- 12.5.1 Segment Definition and Scope
- 12.5.2 Historical Market Size, 2018-2025
- 12.5.3 Revenue Forecast, 2025-2035
- 12.5.4 Volume Forecast, 2025-2035
- 12.5.5 Base-Year Market Share, 2025
- 12.5.6 Segment CAGR and Growth Drivers
- 12.5.7 Subsegment Market Size and Forecast
- 12.5.7.1 Cleansing and Foaming
- 12.5.7.2 Wetting and Dispersion
- 12.5.7.3 Emulsification and Solubilization
- 12.5.7.4 Conditioning and Antistatic Treatment
- 12.5.8 Subsegment Pricing and Adoption Trends
- 12.5.9 Leading Suppliers and Competition
- 12.5.10 Regional Demand and Opportunities
- 12.6 By Technology - Market Size and Forecast, 2025-2035
- 12.6.1 Segment Definition and Scope
- 12.6.2 Historical Market Size, 2018-2025
- 12.6.3 Revenue Forecast, 2025-2035
- 12.6.4 Volume Forecast, 2025-2035
- 12.6.5 Base-Year Market Share, 2025
- 12.6.6 Segment CAGR and Growth Drivers
- 12.6.7 Subsegment Market Size and Forecast
- 12.6.7.1 Sulfonation and Sulfation
- 12.6.7.2 Alkoxylation and Glycosidation
- 12.6.7.3 Acylation and Quaternization
- 12.6.7.4 Microbial Fermentation
- 12.6.8 Subsegment Pricing and Adoption Trends
- 12.6.9 Leading Suppliers and Competition
- 12.6.10 Regional Demand and Opportunities
- 12.7 By Sub-region - Market Size and Forecast, 2025-2035
- 12.7.1 Segment Definition and Scope
- 12.7.2 Historical Market Size, 2018-2025
- 12.7.3 Revenue Forecast, 2025-2035
- 12.7.4 Volume Forecast, 2025-2035
- 12.7.5 Base-Year Market Share, 2025
- 12.7.6 Segment CAGR and Growth Drivers
- 12.7.7 Subsegment Market Size and Forecast
- 12.7.7.1 East Asia
- 12.7.7.2 South Asia
- 12.7.7.3 Southeast Asia
- 12.7.7.4 Oceania
- 12.7.8 Subsegment Pricing and Adoption Trends
- 12.7.9 Leading Suppliers and Competition
- 12.7.10 Regional Demand and Opportunities
- 12.8 Segment Growth Comparison
- 12.9 Segment Attractiveness and Priority Matrix
Chapter 13 Asia Pacific Natural Surfactants End-Use and Application Market Outlook
- 13.1 End-Use Industry and Customer Demand Structure
- 13.2 Leading Applications and Customer Groups
- 13.3 End-Use Market Size, Share and Forecast
- 13.4 Major End-Use Industry Deep Dives
- 13.4.1 Customer Requirements and Use Cases
- 13.4.2 Demand and Replacement Cycles
- 13.4.3 Technical and Regulatory Considerations
- 13.4.4 Purchasing and Procurement Models
- 13.4.5 Leading Vendors and Distribution Channels
- 13.4.6 Forecast and Commercial Opportunities
- 13.5 Emerging Applications and Cross-Segment Demand
- 13.6 End-Use Industry Investment Priorities
Chapter 14 Asia Pacific Natural Surfactants Geographic Market Outlook, 2025-2035
- 14.1 Regional Market Size and Country-Level Shares, 2025
- 14.2 Country Market Size Comparison, 2025
- 14.3 Country Market Forecasts, 2025-2035
- 14.4 Subregional Industrial and Demand Clusters
- 14.5 Intra-Regional Pricing and Cost Differences
- 14.6 Cross-Border Trade and Supply Networks
- 14.7 Regional Supply and Demand Balances
- 14.8 Country Opportunity Comparison and Prioritization
Note: Every listed country is covered on the structure shown under the first country.
Chapter 15 Asia Pacific Natural Surfactants Technology, Innovation and Sustainability Outlook
- 15.1 Technology Landscape and Maturity
- 15.2 Product, Process and Service Innovation
- 15.3 AI, Automation and Digital Tools in the Industry
- 15.4 Technology Adoption and Performance Benchmarking
- 15.5 Innovation Pipeline and R&D Investment
- 15.6 Patent and Intellectual Property Trends
- 15.7 Energy Efficiency and Resource Management
- 15.8 Sustainability, Recycling and Circularity
- 15.9 Technology Roadmap, 2025-2035
- 15.10 Risks of Obsolescence and Technology Substitution
Chapter 16 Asia Pacific Natural Surfactants Market Key Strategic Imperatives
- 16.1 Growth and Market Entry Priorities
- 16.2 High-Return Products and Segments
- 16.3 Pricing, Profitability and Cost Optimization
- 16.4 Technology Investment and Product Differentiation
- 16.5 Supply Chain Localization and Resilience
- 16.6 Distribution and Customer Acquisition
- 16.7 Partnership, Acquisition and Capacity Strategy
- 16.8 Regional Expansion Priorities
- 16.9 Short-, Medium- and Long-Term Actions
Chapter 17 Competition Outlook
- 17.1 Industry Competition Characteristics
- 17.2 Market Structure and Concentration
- 17.3 Market Share and Competitive Positioning, 2025
- 17.4 Company-Wise Revenue and Product Benchmarking
- 17.5 Production and Service Capacity Benchmarking
- 17.6 Technology, Pricing and Differentiation
- 17.7 Regional Footprint and Distribution Strength
- 17.8 Mergers, Acquisitions and Strategic Alliances
- 17.9 New Entrants and Competitive Threats
- 17.10 Porter's Five Forces and Industry Attractiveness
- 17.11 Competitive Outlook, 2025-2035
Chapter 18 Company Profiles
- 18.1 Company Coverage and Selection Criteria
- 18.2 BASF SE
- 18.2.1 Business Description
- 18.2.2 Company Ownership and Geographic Presence
- 18.2.3 Product and Service Portfolio
- 18.2.4 Manufacturing and Operating Footprint
- 18.2.5 Production Capacity and Expansion Plans
- 18.2.6 Financial Performance and Investment
- 18.2.7 Market Share and Competitive Position
- 18.2.8 Technology and Innovation Capabilities
- 18.2.9 Strategic Alliances or Partnerships
- 18.2.10 Recent Developments
- 18.2.11 Growth Strategy and Outlook
- 18.3 Kao Corporation
- 18.4 KLK OLEO
- 18.5 Evonik Industries AG
- 18.6 Galaxy Surfactants Limited
- 18.7 Croda International Plc
- 18.8 Nouryon
- 18.9 Clariant AG
- 18.10 Stepan Company
- 18.11 Sino Lion
- 18.12 Other Relevant Market Participants
Note: Every listed company is profiled on the structure shown under the first company. The company list is preliminary and may change based on research findings, market developments, data availability and client requirements.
Chapter 19 Disclaimer
- 19.1 Research and Forecast Disclaimer
- 19.2 Data Source and Estimation Limitations
Note: The depth of individual sections depends on data availability for this market. Volume, capacity, trade and other unit-based metrics are included where applicable.

