
Asia Pacific polymer emulsions shift to local supply
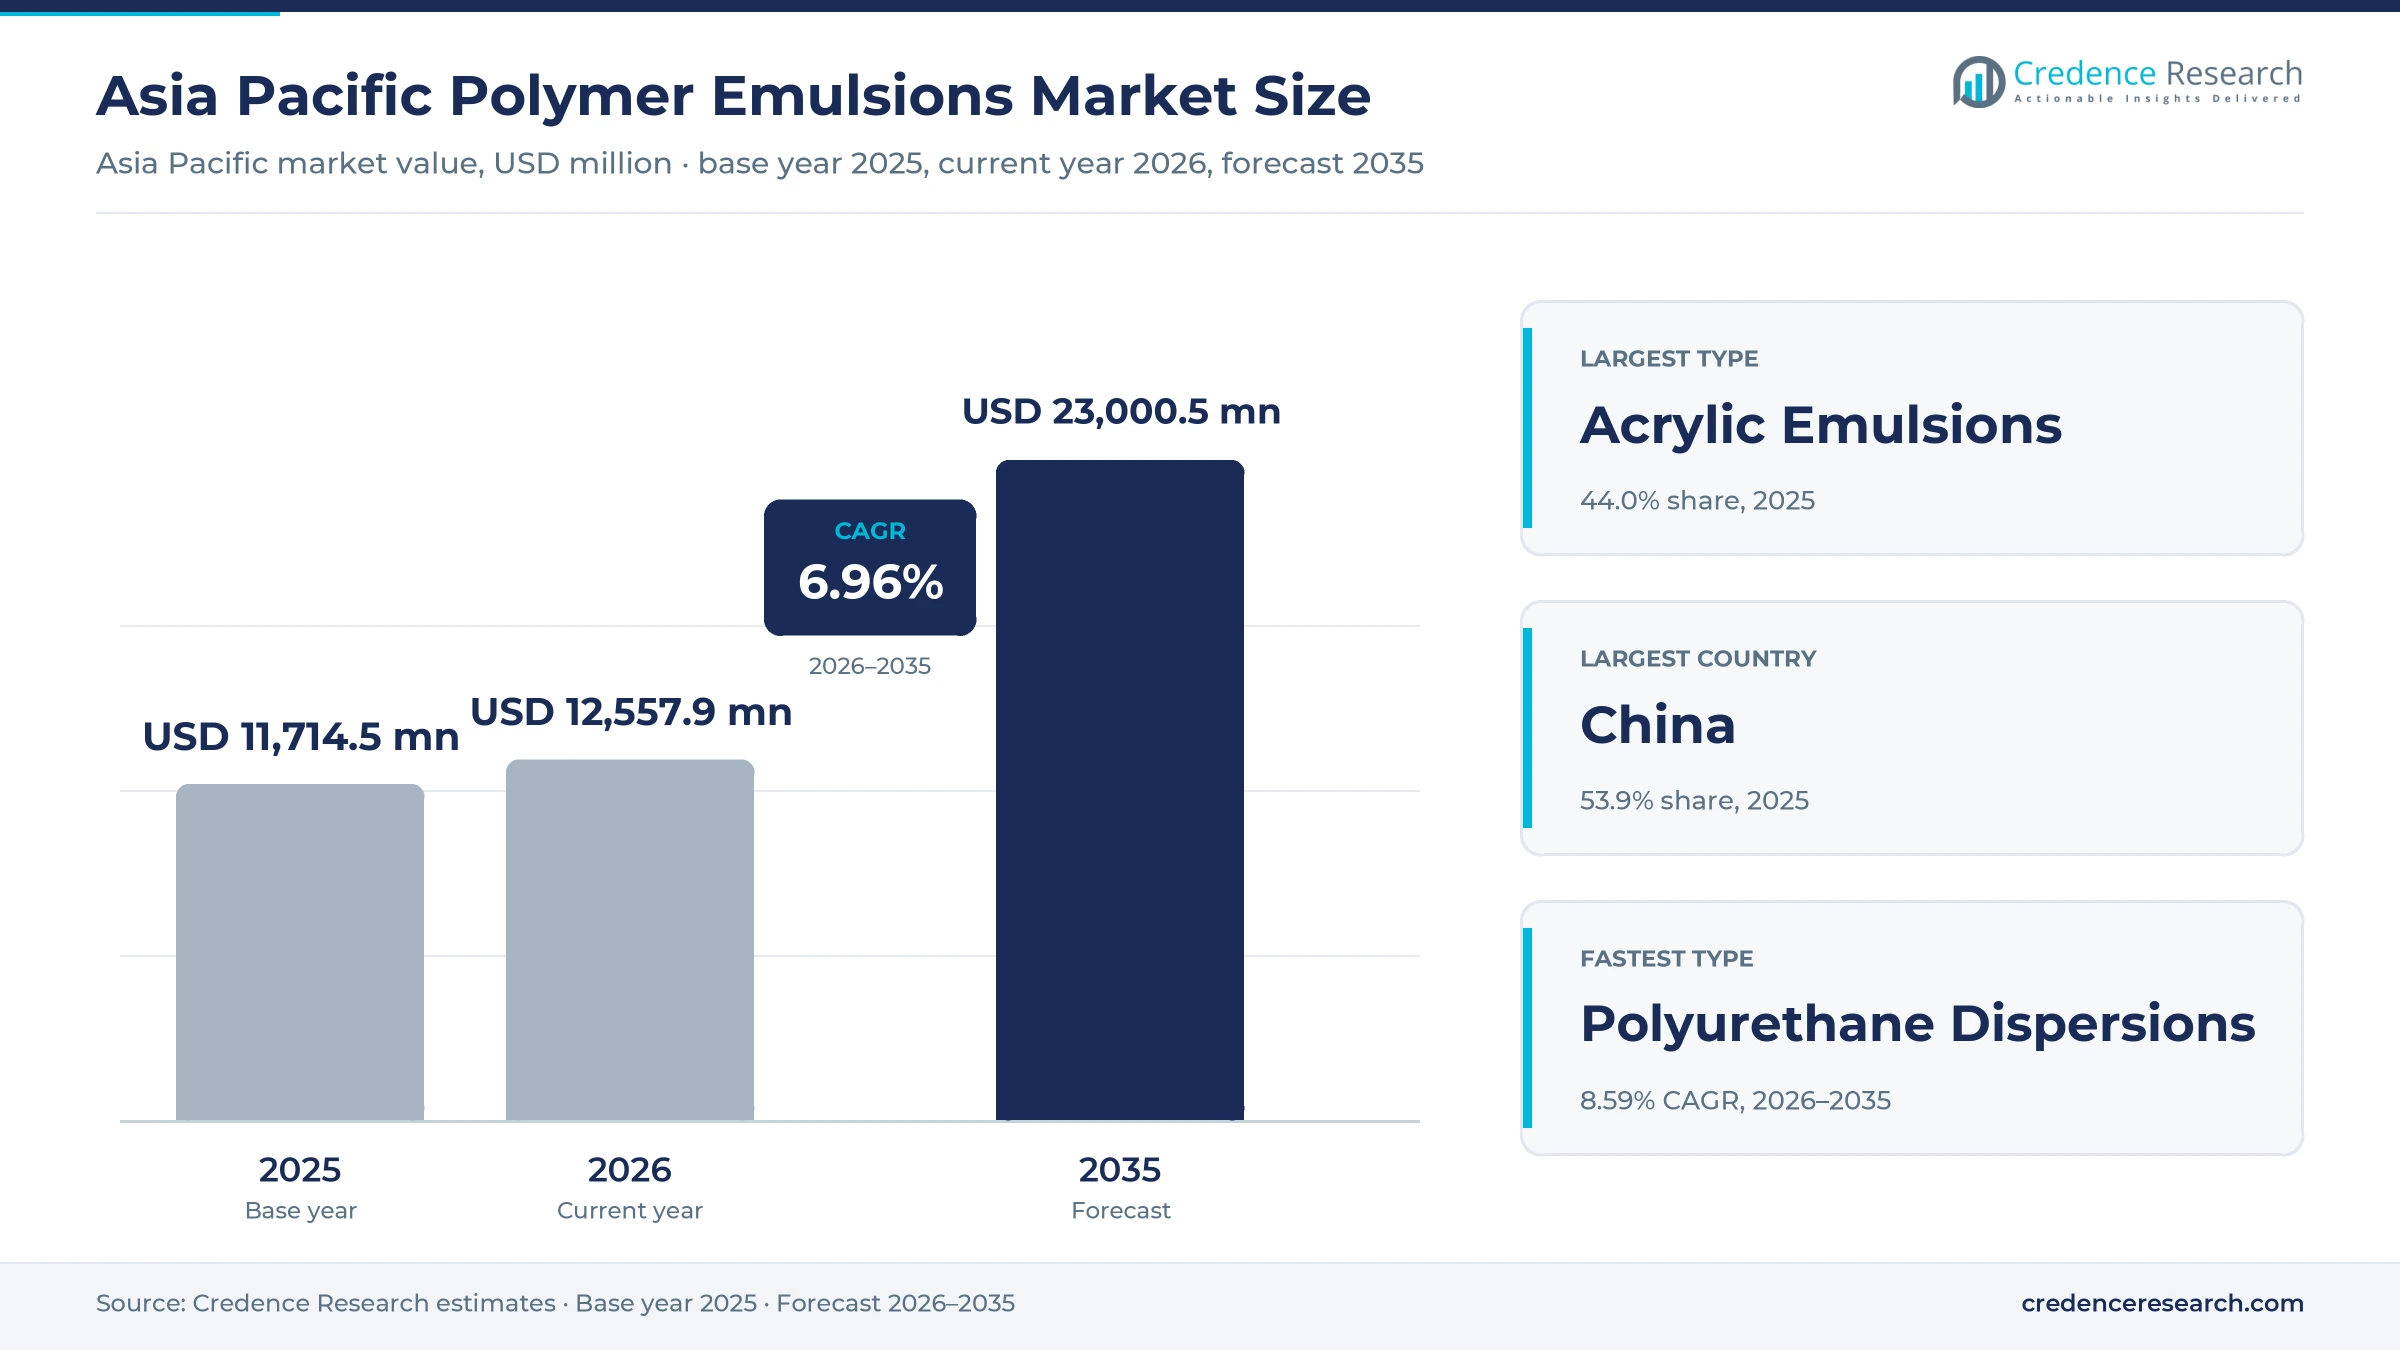
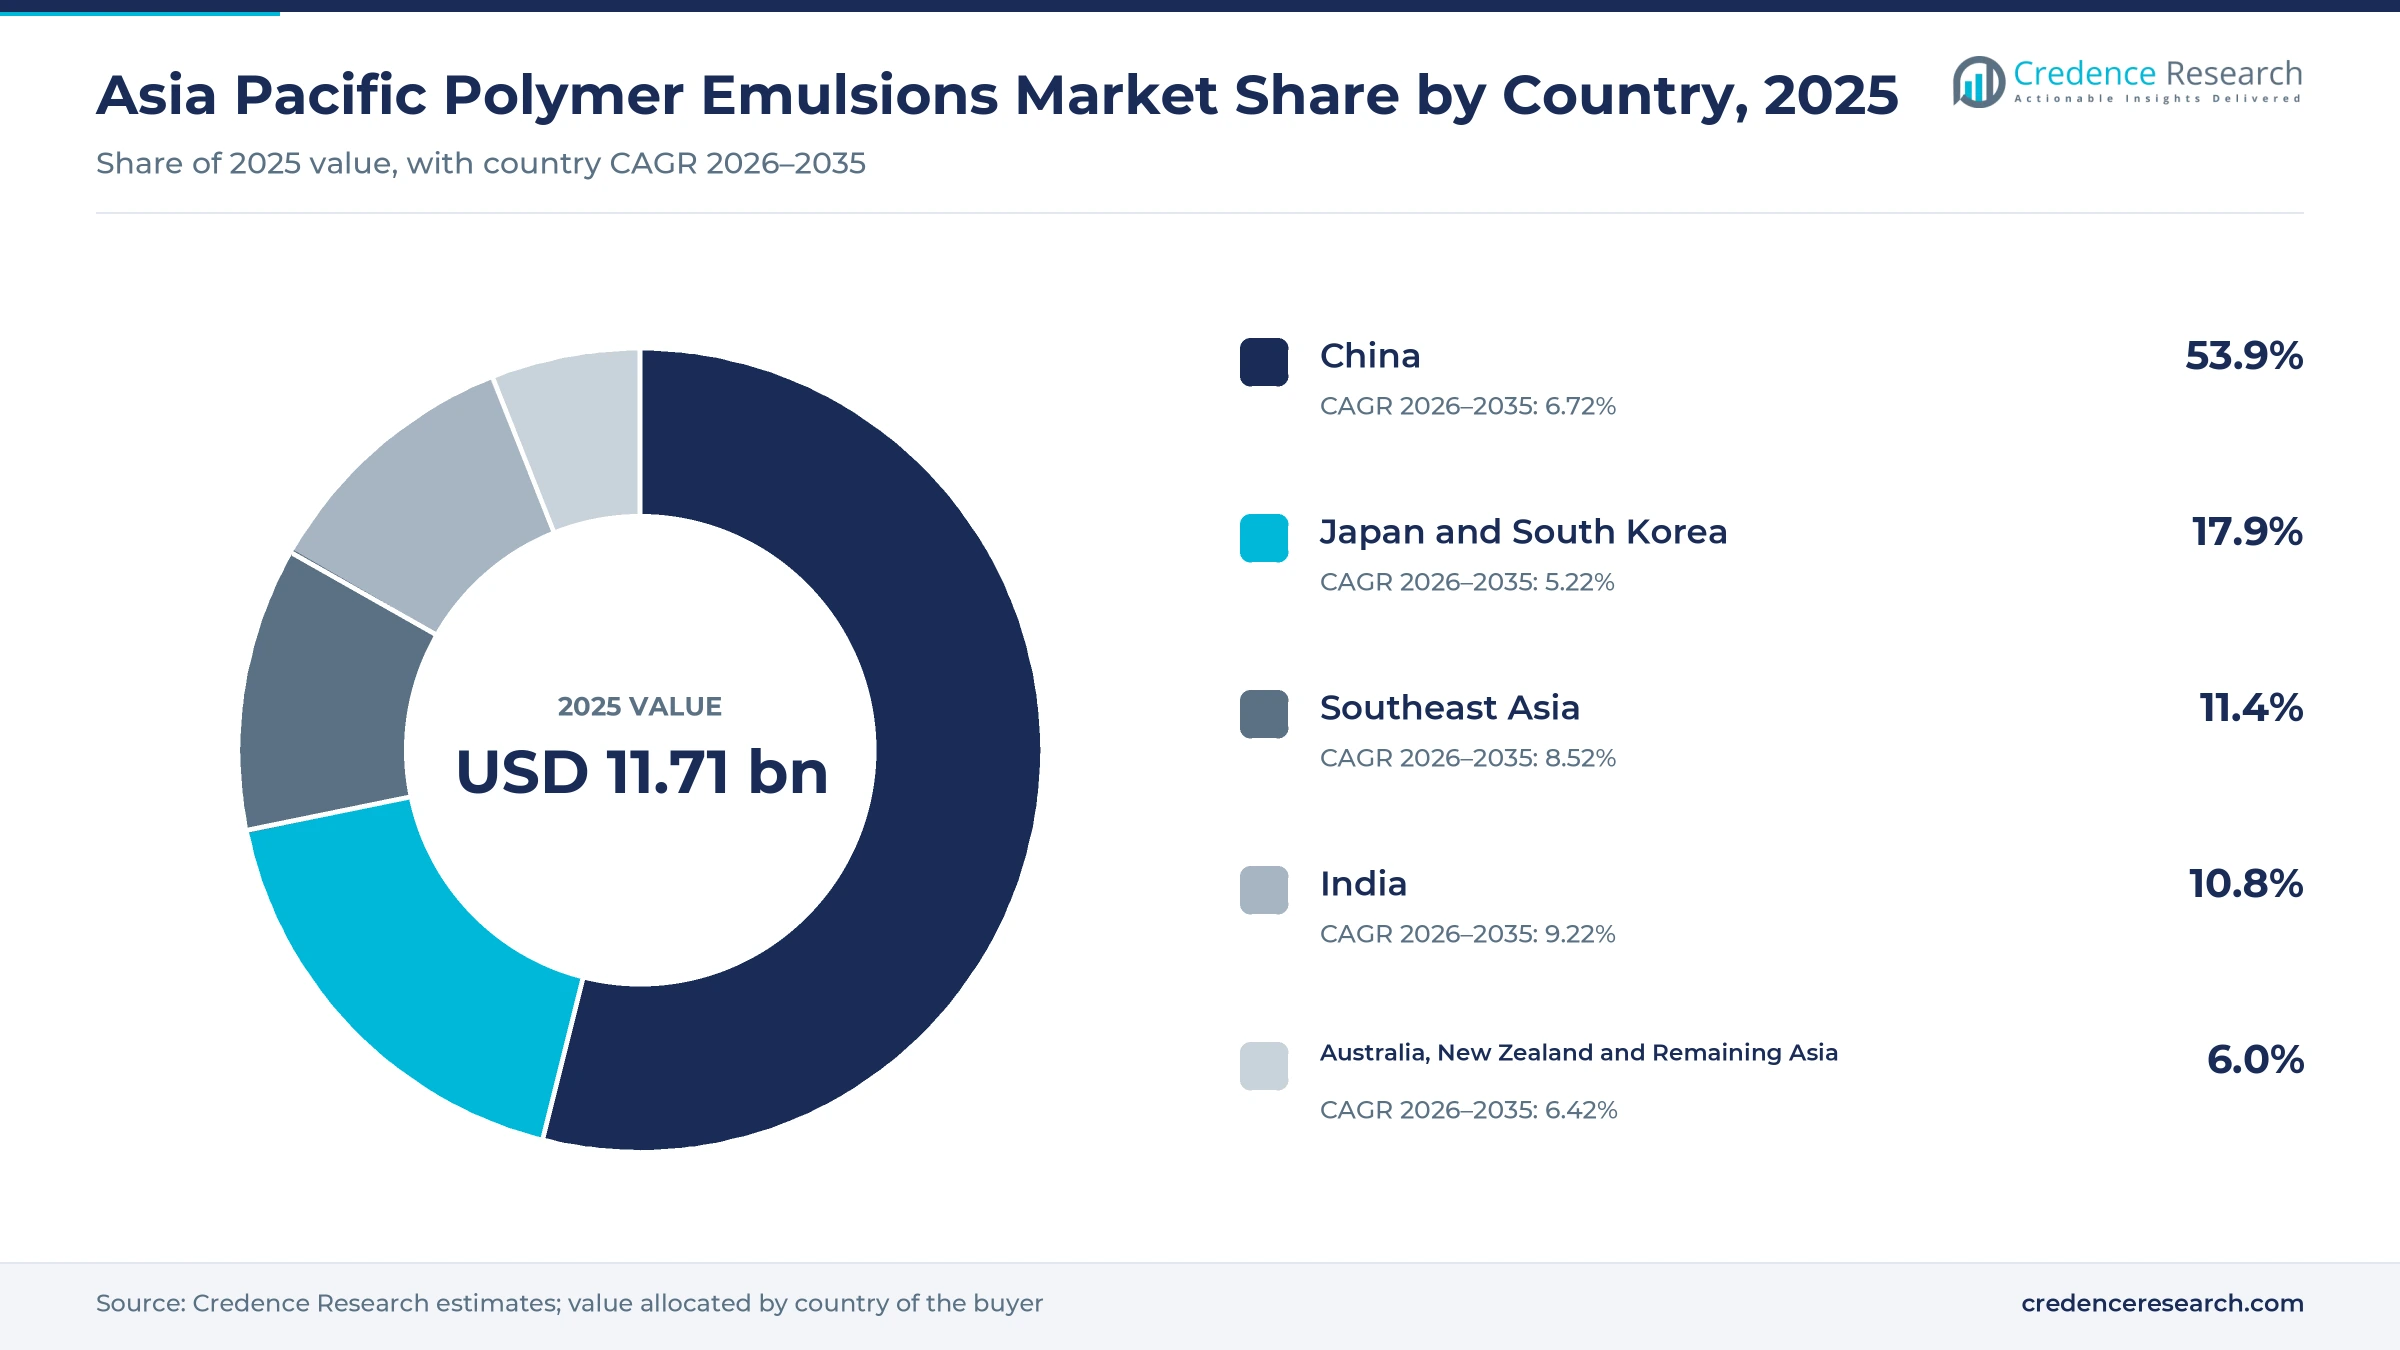
The Asia Pacific polymer emulsions market was valued at USD 11.71 billion in 2025 and is projected to increase from USD 12.56 billion in 2026 to USD 23.00 billion by 2035, registering a CAGR of 6.96% during 2026–2035. Demand comes from water-based paints, adhesives, waterproofing membranes, paper coatings and textile binders, and it follows renovation budgets more closely than new-build housing. China held the largest share, 53.9% in 2025, on the scale of its coatings and construction chemical industries. India is the fastest-growing country at 9.22% a year, as housing approvals and new domestic binder capacity arrive together. China has also tightened the rulebook, because its GB 30981.1-2025 architectural coatings standard took effect on June 1, 2026. Supply is moving closer to buyers too, since water-heavy binders are costly to ship, and producers have added lines in Huizhou, Nanjing, Shanghai, Merak and Dahej.
What do polymer emulsions do for formulators in Asia Pacific?
Polymer emulsions are fine polymer particles dispersed in water, and they act as the binder that forms a film, bonds a substrate or modifies cement once the water leaves. The market counts acrylic, vinyl acetate-based, styrene-butadiene, polyurethane and specialty dispersions sold to paint makers, adhesive formulators, paper mills and construction chemical producers.
The scope excludes solvent-borne resins, redispersible powders sold as powders, natural rubber latex and finished paints or adhesives. Most volume moves through direct contracts with regional plants, while technical distributors and stocking resellers serve smaller formulators that buy by the drum or intermediate bulk container.
Asia Pacific Polymer Emulsions Market Insights
- The market rises from USD 11.71 billion in 2025 to USD 23.00 billion by 2035, a 6.96% CAGR, as water-based formulations replace solvent systems under tighter Asian VOC rules.
- China held 53.9% of regional value in 2025, supported by coatings output of 15.304 million tons in the first half of 2025.
- Acrylic emulsions led product types with 44.0% of 2025 value, while BASF plans about 400,000 metric tons of butyl acrylate yearly in Zhanjiang.
- Asian Paints began commercial production at its 150,000-ton VAE emulsion plant in Dahej in September 2026, which shows paint majors integrating backward into binders.
- BASF, Wacker and Covestro have added Asian dispersion capacity since 2023, because local plants cut freight on water-heavy products and shorten delivery times.
Acrylic binders and coatings set the value mix
Why do acrylic emulsions lead and polyurethane dispersions grow fastest?
Based on product type, the market is categorized into acrylic emulsions, vinyl acetate-based emulsions, styrene-butadiene latex, polyurethane dispersions and specialty non-acrylic dispersions. Acrylic Emulsions led with 44.0% of 2025 value, because butyl acrylate feedstock is abundant, and Chinese industry data counted China capacity reaching 3.74 million tons after a 12% rise. Polyurethane Dispersions grow fastest at 8.59% a year, as they replace solvent-based grades in shoes, packaging and automotive coatings. Covestro completed a dedicated Shanghai plant for that demand in August 2023, with start-up planned for early 2024.
Which end-use industry buys the most binder, and which grows fastest?
Based on end-use industry, the market is categorized into paints and coatings, adhesives and sealants, paper and packaging, construction chemicals and textiles and specialty manufacturing. Paints and Coatings led with 45.0% of 2025 value, because China alone produced 15.304 million tons of coatings in the first half of 2025, according to Chinese coatings industry data. Construction Chemicals grow fastest at 8.07% a year, as repair programs enlarge waterproofing and tile adhesive work. China plans 115,000 ageing community renovations and 365,000 kilometers of pipeline upgrades by 2030, The Star reported in June 2026.
Why does film formation dominate while cement modification gains?
Based on application, the market is categorized into surface film formation, substrate bonding, cementitious modification, fiber and particle binding, and barrier and primer treatment. Surface Film Formation led with 46.0% of 2025 value, because wall paints use binder mainly to form a durable film, and GB 30981.1-2025 now governs those architectural products across China. Cementitious Modification grows fastest at 8.14% a year, as polymer-modified mortars spread through repair work. Wacker said its US$100 million Nanjing expansion, completed in May 2023, serves ceramic tile adhesives and waterproofing membranes, which are cement-modifying uses.
How do buying patterns differ between formulators and integrated groups?
Based on customer type, the market is categorized into integrated formulation groups, independent formulators and direct-use converters. Independent Formulators led with 44.0% of 2025 value, because most regional paint and adhesive makers still buy binder rather than make it, and Chinese coatings industry data showed over 70% of 20-plus coatings projects disclosed in the first half of 2025 targeted waterborne or high-solids lines. Integrated Formulation Groups grow fastest at 7.78% a year, as paint majors integrate backward. Asian Paints started commercial output at its 150,000-ton VAE plant in Dahej in September 2026, according to Sahi Markets.
| Segment Group | Leading Sub-segment | Share, 2025 | Fastest-growing Sub-segment | CAGR, 2026–2035 |
|---|---|---|---|---|
| By Product Type | Acrylic Emulsions | 44.0% | Polyurethane Dispersions | 8.59% |
| By End-Use Industry | Paints and Coatings | 45.0% | Construction Chemicals | 8.07% |
| By Application | Surface Film Formation | 46.0% | Cementitious Modification | 8.14% |
| By Customer Type | Independent Formulators | 44.0% | Integrated Formulation Groups | 7.78% |
Request a Free Sample
Fill in your details and we'll send you a free sample report.
- Sample data tables & charts
- Research methodology
Low-VOC rules, repair budgets and new plants lift demand
Waterborne adhesive substitution moves volume away from solvents
Adhesive makers are the clearest switchers to water-based binders, because regulation and customer specifications now point the same way. China's GB 33372-2020 limit on VOC content in adhesives has applied since Dec. 1, 2020, according to the State Administration for Market Regulation, which gives packaging and footwear buyers a compliance reason to switch. Covestro then built its Shanghai dispersion plant for coatings and adhesives used in automobiles, construction, shoes and packaging, completing it in August 2023. Wacker described China as one of the world's most important adhesive markets when it opened new Nanjing capacity in May 2023. As a result, adhesives and sealants stay a core outlet, and acrylic pressure-sensitive grades are among the main beneficiaries of that switch.
Infrastructure maintenance and waterproofing widen binder use
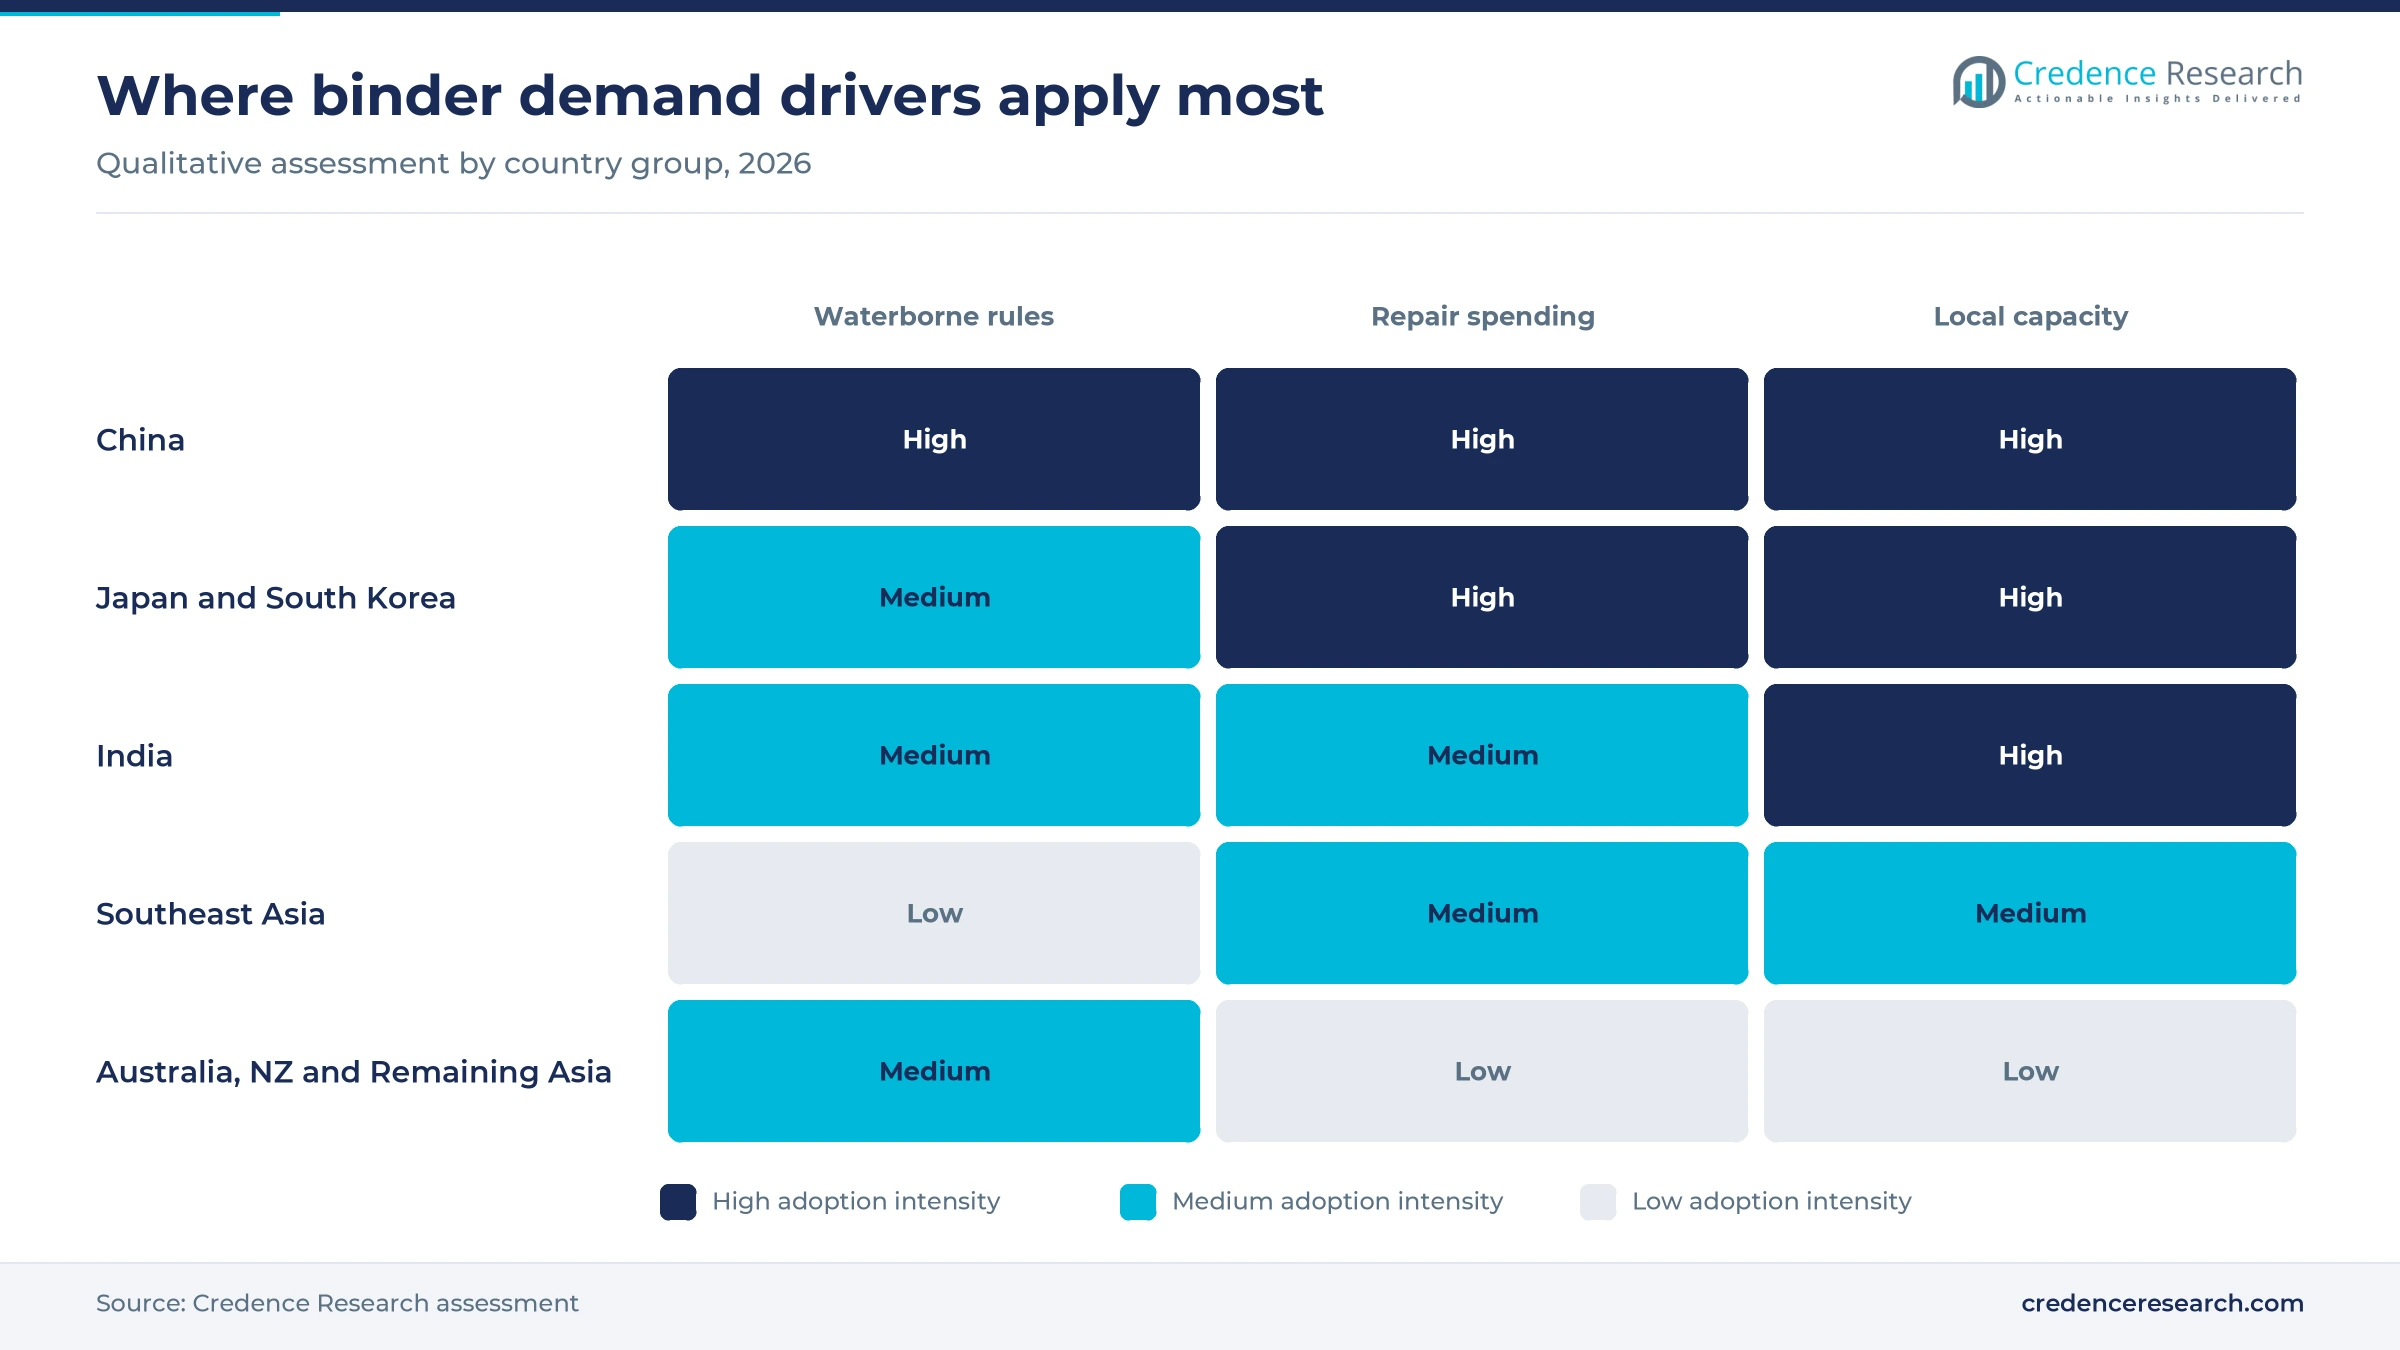
Repair spending now supports binder demand even where new construction is weak, because waterproofing and patching use polymer-modified systems. China launched renovation at 25,100 old urban residential communities in the first 10 months of 2025, above its 25,000 goal, according to its housing ministry. Its first national urban renewal plan then targets 115,000 ageing communities by 2030, The Star reported in June 2026. Japan approved a plan worth more than 20 trillion yen for fiscal 2026 through 2030, lifting the repair rate for about 92,000 urgent bridges from 55% to 80%, The Tribune reported. These programs feed the construction chemicals chain directly, so Construction Chemicals grow at 8.07% a year.
Localization of dispersion supply brings capacity closer to buyers
Producers are building next to customers, because water-heavy binders lose their margin over long freight routes. Trinseo's fiscal 2025 annual report states that latex binders are costly to ship long distances due to high water content. BASF's second Daya Bay line in Huizhou became fully operational in the second quarter of 2024, Adhesives & Sealants Industry reported, shortening delivery times for South China. BASF's Merak expansion in Indonesia added styrene-butadiene capacity for new Southeast Asian and Oceanian paper mills, with operation planned from the second half of 2023. Wacker more than doubled its Nanjing VAE capacity through a US$100 million project completed in May 2023, so regional formulators can increasingly source binder from plants inside their own markets.
India's housing approvals pull new binder investment
India pairs fresh housing demand with new binder capacity, which makes it the fastest-growing country in the region. The government approved 1.877 million houses under PMAY-Urban 2.0 at a central committee meeting reported in September 2026, adding to paint and waterproofing demand across its cities. Asian Paints raised its Dahej VAE and VAM project to Rs. 3,250 crore in March 2025, according to Indian Chemical News, and then began commercial VAE output there in September 2026. DIC subsidiary Ideal Chemi Plast opened a coating resins plant in the Supa industrial zone in February 2024, tripling its capacity, for automotive and infrastructure uses. Together these steps reduce India's reliance on imported binder grades and shift purchasing toward domestic contracts over the forecast period.
Renovation and battery binders reshape the binder mix
Renovation is replacing new-build as the main paint binder outlet
The shift from new construction toward repainting favors interior latex grades and reduces reliance on developer volumes. Chinese coatings industry data published in August 2025 showed that China's property slump continued to weigh on architectural coatings, while the interior latex niche had stabilized. Renovation demand is already large, since housing ministry data show projects launched at about 280,000 old residential communities between 2019 and 2024. China's housing ministry also counted 2.9 trillion yuan of urban renewal investment in 2024, The Star reported in June 2026. Because renovation buyers often repaint occupied homes, they favor low-odor and low-VOC wall paints, which supports premium Acrylic Emulsions and the broader waterborne coatings chain, rewarding suppliers with finer particle grades.
Tighter harmful-substance rules are shifting binder specifications
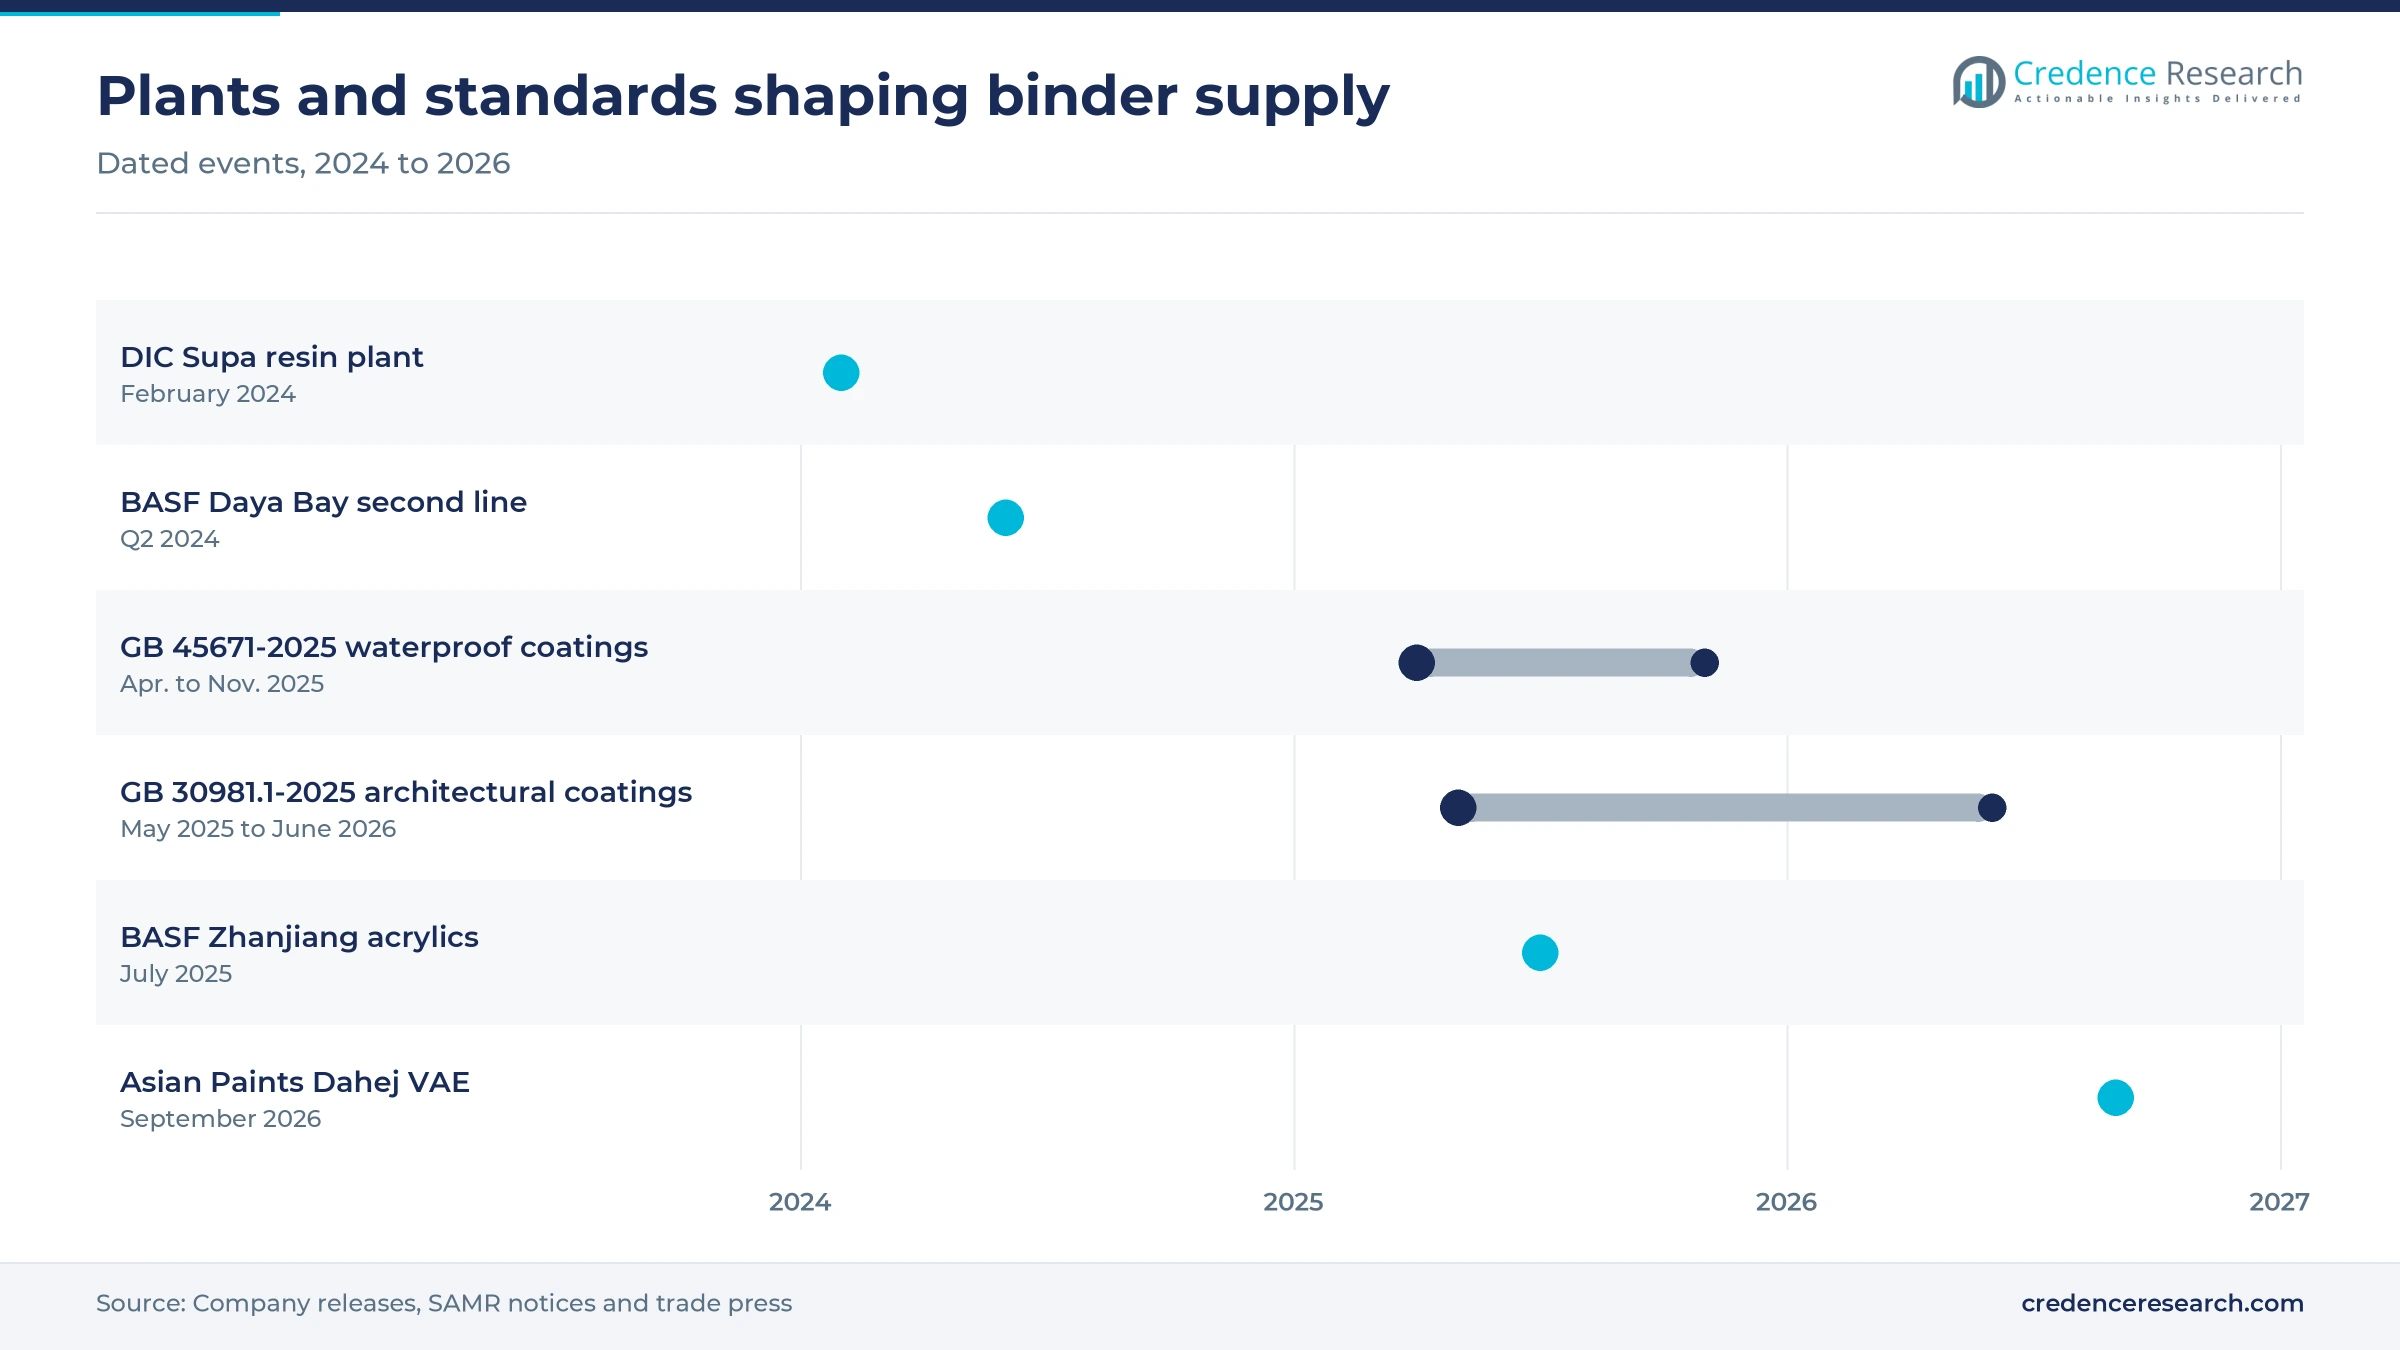
Regulation is moving from broad VOC caps toward finer limits, and that shift changes which binder grades qualify. GB 30981.1-2025 was released on May 30, 2025 and took effect on June 1, 2026, replacing GB 18582-2020 and GB 38468-2019. Enviliance reported in August 2025 that the standard expands regulated substances to semi-volatile organic compounds and biocides. GB 45671-2025 for construction waterproof coatings followed, published on April 25, 2025 and implemented on Nov. 1, 2025. Suppliers are responding with cleaner grades, and BASF has promoted Acronal PLUS 7679, which uses Advanced Odor Reduction technology for interior walls, SpecialChem reported. Over time, this emerging specification gap favors producers that can document residual monomer and biocide content batch by batch.
Southeast Asian paper and textile mills open a binder opportunity
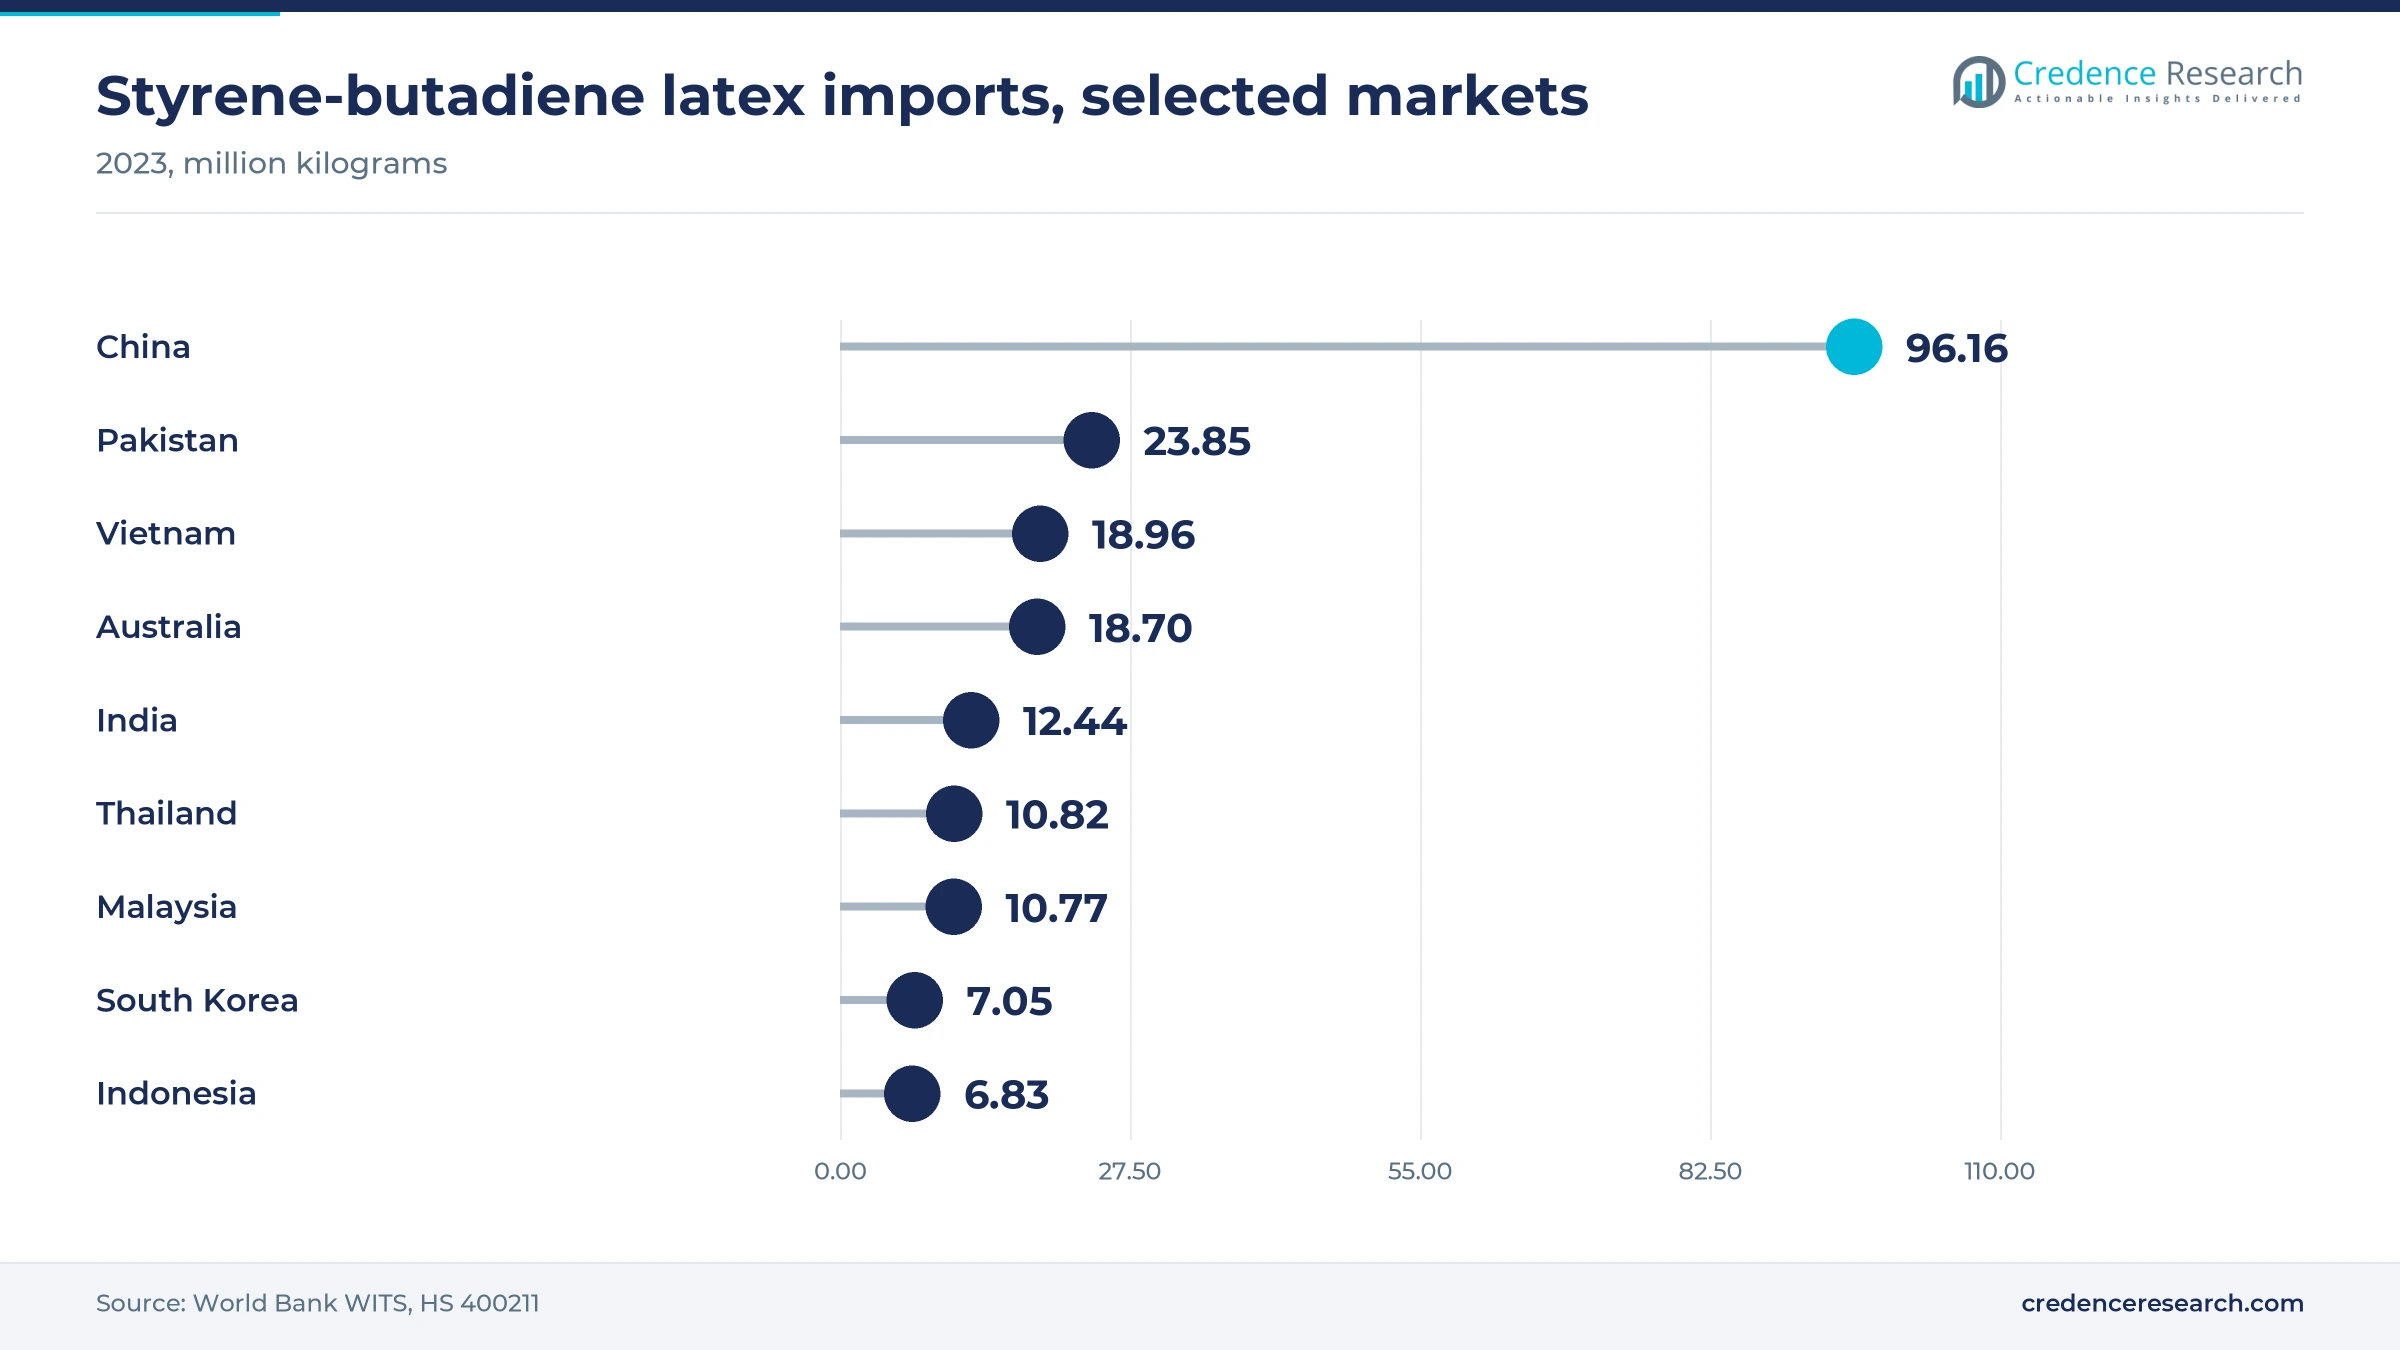
Southeast Asia offers an opening for suppliers that can serve mills without long supply lines, because local binder trade is still thin. World Bank WITS data show Vietnam imported about 18.96 million kilograms of styrene-butadiene latex in 2023, while Thailand and Malaysia each took about 10.8 million kilograms. BASF said in January 2023 that major paper and board makers were expanding capacity in ASEAN, which justified its Merak investment. Vietnam's textile and garment exports were estimated at $46 billion for 2025, according to Viet Nam News, and that scale supports coating and printing binders. Because 11.4% of regional value sits here and it grows at 8.52% a year, a local line or toll-manufacturing agreement can win accounts that imports now serve.
Battery electrode binders offer an adjacent opportunity for latex makers
Lithium-ion electrodes give latex producers an opportunity outside construction and paper, where volume growth is more cyclical. SpecialChem reported that BASF named lithium-ion batteries among the target markets for its second Daya Bay dispersions line, alongside construction, coatings and paper. Trinseo's fiscal 2025 annual report also lists battery applications with coatings and adhesives as a key focus because of their higher growth and margin potential. Regional latex trade is large, since South Korea exported 44.09 million and India 39.22 million kilograms in 2023 while China imported 96.16 million kilograms, according to WITS, though the code mixes all grades, and the Daya Bay line became operational in the second quarter of 2024. Qualifying with cell makers takes time, so the opening suits producers that already run purified styrene-butadiene lines.
Monomer oversupply and property weakness squeeze margins
Butyl acrylate oversupply keeps pushing binder prices down
Monomer oversupply passes straight into binder pricing, which squeezes producers without feedstock integration. Chinese industry data put China's butyl acrylate capacity at 3.74 million tons after a 12% rise, while the 2024 average price slipped 2.11% to 9,037 yuan per ton. BASF's Zhanjiang complex, which also makes acrylic acid, adds about 400,000 metric tons a year of planned supply. Formulators then expect price cuts, so merchant emulsion makers defend margin through formula service, local delivery and specialty grades.
A weak property cycle limits architectural coatings volume
A weak property market caps the largest outlet for binder, and China's numbers show the strain clearly. Binder demand tracks coatings output, which rose only 0.7% to 15.304 million tons in the first half of 2025, according to Chinese coatings industry data, which also cited a continuing property slump. As a result, architectural binder suppliers in China face flat volumes. Producers are responding by shifting sales toward renovation paint, waterproofing and industrial grades, where demand depends less on developers.
High water content makes long-distance trade uneconomic
Freight economics limit how far a plant can sell, and that forces costly regional capacity decisions. Trinseo states that latex binders are costly to ship long distances because of their water content. World Bank WITS data show China paid about $210.28 million for 96.16 million kilograms of imported latex in 2023, near $2.19 a kilogram. Import prices therefore vary widely by market and grade, while producers must decide which countries justify a local reactor or tolling partner.
Fast-moving standards raise reformulation and testing costs
Frequent rule changes raise compliance costs, especially for formulators selling across several Asian markets. China published GB 45671-2025 for waterproof coatings in April 2025, and its Ministry of Industry and Information Technology proposed a first amendment on April 2, 2026 covering burning-behavior tests, CIRS reported. Formulators may therefore need to retest products about a year after the standard was published. Suppliers can reduce the burden by sharing test data, though smaller independent formulators still carry most of the cost and delay.
China anchors value as India and Southeast Asia grow faster
| Country | Value, 2025 (USD billion) | Share, 2025 | CAGR, 2026–2035 |
|---|---|---|---|
| China | 6.31 | 53.9% | 6.72% |
| Japan and South Korea | 2.10 | 17.9% | 5.22% |
| Southeast Asia | 1.34 | 11.4% | 8.52% |
| India | 1.27 | 10.8% | 9.22% |
| Australia, New Zealand and Remaining Asia | 0.70 | 6.0% | 6.42% |
China sets the regional volume and price benchmark
China held 53.9% of 2025 value and grows at 6.72% a year, supported by coatings output of 15.304 million tons in the first half of 2025, according to Chinese coatings industry data. New capacity includes BASF's second Daya Bay line and Wacker's Nanjing expansion, while Dow has produced acrylic emulsion in Meishan since May 2018. Renovation at 25,100 communities in the first 10 months of 2025 now offsets part of the weakness in new housing.
India grows fastest as domestic VAE capacity arrives
India held 10.8% of 2025 value and leads growth at 9.22% a year, because housing approvals and integration are arriving together. Its 1.877 million PMAY-Urban 2.0 approvals support paint and waterproofing use, while Asian Paints' Dahej VAE plant adds 150,000 tons a year. WITS shows India exported 39.22 million kilograms of styrene-butadiene latex in 2023 against 12.44 million kilograms imported, which marks it as a net exporter in that product.
Southeast Asia gains on paper mills and textile exports
Southeast Asia held 11.4% of 2025 value and grows at 8.52% a year, helped by paper and packaging investment. BASF expanded styrene-butadiene capacity at Merak, a site running since 1994, to serve new mills across Southeast Asia and Oceania. Indonesia exported about 35.81 million kilograms of the latex in 2023, according to WITS, while Vietnam imported 18.96 million kilograms. Vietnam's estimated $46 billion in 2025 textile exports adds a further outlet for coating binders.
Japan and South Korea rely on repair work and specialty grades
Japan and South Korea held 17.9% of 2025 value and grow at 5.22% a year, the slowest pace here because their housing stock is mature. Japan's plan of more than 20 trillion yen for fiscal 2026 through 2030 supports bridge and sewer repair. South Korea exported 44.09 million kilograms of styrene-butadiene latex in 2023, according to WITS, and Wacker reported 90,000 tons a year of VAE dispersion capacity at Ulsan in 2013.
Australia and remaining Asia buy mostly on specification and service
Australia, New Zealand and Remaining Asia held 6.0% of 2025 value and grow at 6.42% a year. Australia imported 18.70 million kilograms of styrene-butadiene latex in 2023, according to WITS, which shows import dependence for many grades. DuluxGroup reports that its factory in Melbourne's north can make 50 million liters of water-based decorative paint a year. Pakistan took a further 23.85 million kilograms, making it a sizable import outlet.
Plants and standards that changed the market since 2024
| Development | Status and market relevance |
|---|---|
| In February 2024, DIC subsidiary Ideal Chemi Plast opened a coating resins plant in the Supa Japanese Industrial Zone in Maharashtra, tripling its capacity. | Operating; serves automotive and infrastructure coatings in India and South Asia |
| In June 2024, BASF inaugurated its second polymer dispersions line at Daya Bay in Huizhou, fully operational from the second quarter. | Operating; shortens delivery times for South China buyers |
| In May 2025, Chinese regulators released GB 30981.1-2025 for architectural coatings, effective June 1, 2026. | In force; replaces GB 18582-2020 and GB 38468-2019 |
| In July 2025, BASF reached mechanical completion of glacial acrylic acid and butyl acrylate plants at Zhanjiang, with about 400,000 metric tons of butyl acrylate planned. | Start-up phase; adds regional acrylic feedstock |
| In September 2026, Asian Paints began commercial production at its 150,000-ton-a-year VAE emulsion plant in Dahej, Gujarat. | Operating; reduces import reliance for India |
Particle design and prepolymer routes widen performance
- Conventional emulsion polymerization remains the volume route for acrylic, VAE and styrene-butadiene grades, and it runs at scale in plants such as Nanjing, Ulsan and Merak, where large reactors keep unit costs low for paint and paper buyers.
- Structured-particle emulsion polymerization builds core-shell or multiphase particles, which lets formulators lower coalescent use and odor without losing film hardness, a useful property now that GB 30981.1-2025 applies to wall paints in China.
- Prepolymer dispersion processing makes polyurethane dispersions by chain-extending a prepolymer in water, and Covestro's Shanghai plant supplies polyurethane dispersions for automotive, construction, shoe and packaging uses.
- Sales channel design follows the chemistry, since direct domestic contracts suit bulk reactor output, while technical distributors and stocking resellers carry specialty drums for smaller formulators across Southeast Asia, Australia and New Zealand.
Need a Custom Version of This Report?
Tailor the scope, geography, or segments to your exact requirements.
- Custom geography or segment scope
- Direct access to our analyst team
Local plants decide who wins binder contracts
Competition turns on plant location, feedstock access and technical service, because water-heavy products rarely justify long freight. BASF combines acrylic feedstock at Zhanjiang with dispersion lines at Daya Bay and Merak, which gives it reach across China and Southeast Asia. Wacker concentrates on VAE, with Nanjing and Ulsan serving tile adhesive, waterproofing and carpet customers. Dow has produced acrylic emulsion at Meishan since May 2018 for architectural and industrial coating buyers in western China. Trinseo competes in styrene-acrylate and styrene-butadiene latex, naming BASF and Synthomer as main rivals in its fiscal 2025 filing, while also disclosing plant closures and capital structure talks. DIC approaches the market through coating resins, including Ideal Chemi Plast in India. Paint majors have also become a competitive force, since Asian Paints now makes its own VAE at Dahej, removing volume from merchant sellers.
Companies profiled and their roles in this market
| Company | Type | Role in the market |
|---|---|---|
| BASF SE | Integrated producer | Acrylic and styrene-butadiene dispersions at Daya Bay and Merak, with butyl acrylate at Zhanjiang |
| The Dow Chemical Company | Multinational producer | Acrylic emulsion at Meishan for architectural and industrial coatings since May 2018 |
| Trinseo PLC | Latex specialist | Styrene-acrylate and styrene-butadiene latex binders for paper, carpet and coatings with Asian production |
| Wacker Chemie AG | VAE specialist | VAE dispersions at Nanjing and Ulsan for tile adhesives, waterproofing and carpets |
| DIC Corporation | Resin producer | Coating resins through Ideal Chemi Plast in India, tripled capacity in February 2024 |
Where binder value moves next in the region
Credence Research's view is that the market's center of gravity moves from new-build paint toward repair and specialty binding. China still decides pricing, but butyl acrylate oversupply there hands value to suppliers with formula know-how rather than to those selling commodity volume. India is the clearest growth bet because housing approvals, domestic VAE and rising paint capacity arrive together. Backward integration by paint majors is the main threat to merchant producers, and Asian Paints' Dahej plant is the first large test. Suppliers should prioritize low-odor acrylics, cement-modifying VAE and qualified local capacity in Southeast Asia.
How the market estimate was built
The report uses 2025 as the base year and forecasts values for 2026 to 2035. Market values come from the Credence Research model, checked against a bottom-up estimate using coatings output, binder intensity and traded latex unit values. Regional shares follow the Credence Research regional model, and segment splits are Credence Research estimates. Source types include government statistics, national standards, World Bank WITS trade data, company releases, annual filings and named trade publications. No interviews or surveys were conducted for this edition of the report.
Repair work and local capacity carry growth to 2035
Through 2035, the market should reach USD 23.00 billion, growing at 6.96% a year from USD 12.56 billion in 2026. Growth should lean on repair, waterproofing and specialty binding as Chinese renewal programs and Japanese infrastructure budgets continue through 2030. India and Southeast Asia should gain share because local plants improve availability and reduce freight costs. Pricing pressure is likely to persist while acrylic monomer capacity runs ahead of demand, which favors differentiated grades. Further integration by large paint groups would shrink merchant volume, so independent suppliers will need specialty portfolios and closer service to formulators.
Frequently Asked Questions
How big is the Asia Pacific polymer emulsions market?
Which product type leads the market?
Which country holds the largest share?
Which country is growing fastest?
What rule changed coating binders most recently in China?
Why are producers building plants close to buyers?
What is the main challenge for emulsion suppliers?
Who are the main companies in this market?
Table of Content
Chapter 1 Market Segmentation
- 1.1 Segmentation Framework
- 1.1.1 Product and Service Classification
- 1.1.2 Application and End-Use Classification
- 1.1.3 Technology and Solution Classification
- 1.1.4 Customer and Distribution Channel Classification
- 1.1.5 Geographic Segmentation
- 1.1.6 Market Segment Definitions and Boundaries
- 1.2 By Product Type
- 1.2.1 Acrylic Emulsions
- 1.2.2 Vinyl Acetate-Based Emulsions
- 1.2.3 Styrene-Butadiene Latex
- 1.2.4 Polyurethane Dispersions
- 1.2.5 Specialty Non-Acrylic Dispersions
- 1.3 By End-Use Industry
- 1.3.1 Paints and Coatings
- 1.3.2 Adhesives and Sealants
- 1.3.3 Paper and Packaging
- 1.3.4 Construction Chemicals
- 1.3.5 Textiles and Specialty Manufacturing
- 1.4 By Application
- 1.4.1 Surface Film Formation
- 1.4.2 Substrate Bonding
- 1.4.3 Cementitious Modification
- 1.4.4 Fiber and Particle Binding
- 1.4.5 Barrier and Primer Treatment
- 1.5 By Customer Type
- 1.5.1 Integrated Formulation Groups
- 1.5.2 Independent Formulators
- 1.5.3 Direct-Use Converters
- 1.6 By Country
- 1.6.1 China
- 1.6.2 Japan and South Korea
- 1.6.3 India
- 1.6.4 Southeast Asia
- 1.6.5 Australia, New Zealand and Remaining Asia
Chapter 2 Introduction
- 2.1 Report Objectives and Scope
- 2.2 Product Definition and Industry Terminology
- 2.3 Market Inclusions and Exclusions
- 2.4 Research Process
- 2.4.1 Primary Research and Expert Interviews
- 2.4.2 Secondary Research and Source Review
- 2.4.3 Top-Down and Bottom-Up Estimation
- 2.4.4 Data Triangulation and Verification
- 2.5 Market Size Measurement Basis
- 2.5.1 2025: USD 11.71 billion → 2035: USD 23.00 billion
- 2.6 Historical and Forecast Reference Periods
- 2.6.1 Historical Period: 2018-2025
- 2.6.2 Base Year: 2025
- 2.6.3 Forecast Period: 2025-2035
- 2.7 Research Assumptions and Limitations
Chapter 3 Executive Summary
- 3.1 Market Snapshot and Key Findings
- 3.2 Base-Year Market Size, 2025
- 3.3 Forecast Market Size, 2035
- 3.4 Revenue and Volume Growth Outlook
- 3.5 Key Demand and Supply Indicators
- 3.6 Leading Market Segments
- 3.7 Fastest-Growing Market Opportunities
- 3.8 Regional Performance Highlights
- 3.9 Technology and Industry Transformation
- 3.10 Competitive Landscape Summary
- 3.11 Analyst View and Strategic Implications
Chapter 4 Asia Pacific Polymer Emulsions Market Trends and Developments
- 4.1 Historical Industry Development, 2018-2025
- 4.2 Recent Market Trends and Developments
- 4.3 Demand and Customer Behavior Trends
- 4.4 Technology and Product Innovation
- 4.5 Artificial Intelligence, Automation and Digitalization
- 4.6 Local Manufacturing and Supply Chain Realignment
- 4.7 Industry Partnerships, Mergers and Acquisitions
- 4.8 Sustainability and Circular Economy Developments
- 4.9 Government and Private Sector Investment Trends
- 4.10 Emerging Business Models and Commercialization
- 4.11 Industry Developments and Announcements
Chapter 5 Asia Pacific Polymer Emulsions Market Production, Supply and Demand Analysis
- 5.1 Demand Trend and Consumption Analysis, 2018-2025
- 5.2 Demand Forecast, 2025-2035
- 5.3 Production and Output Trend, 2018-2025
- 5.4 Production and Output Forecast, 2025-2035
- 5.5 Installed Capacity and Capacity Utilization
- 5.6 Company-Wise Production Plants and Statistics
- 5.6.1 Installed Production Capacity
- 5.6.2 Actual Production
- 5.6.3 Planned Capacity and Expansion Targets
- 5.7 Supply Chain Structure and Procurement Trends
- 5.8 Supply-Demand Gap and Bottlenecks
- 5.9 Import Dependence and Sourcing Structure
- 5.10 Contract Manufacturing and Outsourcing
- 5.11 Regional Supply and Demand Concentration
Chapter 6 Asia Pacific Polymer Emulsions Market Pricing Analysis
- 6.1 Pricing Structure and Measurement
- 6.2 Historical Pricing Trends, 2018-2025
- 6.3 Pricing Outlook, 2025-2035
- 6.4 Average Selling Price and Unit Economics
- 6.5 Pricing by Product and Market Segment
- 6.6 Geographic Pricing Differences
- 6.7 Key Input, Energy, Labor and Logistics Costs
- 6.8 Contract Pricing and Purchasing Models
- 6.9 Pricing Sensitivity and Competitive Positioning
- 6.10 Price, Margin and Profitability Implications
Chapter 7 Asia Pacific Polymer Emulsions Market Dynamics
- 7.1 Market Growth Drivers
- 7.1.1 Demand-Side Drivers
- 7.1.2 Technology and Innovation Drivers
- 7.1.3 Infrastructure and Investment Drivers
- 7.1.4 Regulatory and Policy Drivers
- 7.2 Market Restraints
- 7.2.1 Cost and Affordability Constraints
- 7.2.2 Technology and Adoption Barriers
- 7.2.3 Supply Chain and Operational Constraints
- 7.3 Market Challenges
- 7.3.1 Competitive Pressure and Margin Erosion
- 7.3.2 Skills, Infrastructure and Implementation Gaps
- 7.4 Emerging Market Opportunities
- 7.5 Market Dynamics Impact and Time-Horizon Assessment
Chapter 8 Asia Pacific Polymer Emulsions Value Chain Analysis
- 8.1 Industry Value Chain Overview
- 8.2 Upstream Suppliers and Critical Inputs
- 8.3 Technology and Component Providers
- 8.4 Manufacturing or Service Delivery
- 8.5 Distribution, Channel Partners and Integrators
- 8.6 Downstream Applications and End Users
- 8.7 Value Addition and Profit Pools
- 8.8 Vertical Integration and Outsourcing
- 8.9 Supplier Concentration and Risk
- 8.10 Supply Chain Localization and Resilience
Chapter 9 Asia Pacific Polymer Emulsions Market Regulations and Policies
- 9.1 Relevant Laws, Standards and Compliance Frameworks
- 9.2 Product, Service, Safety and Quality Requirements
- 9.3 Government Policies, Incentives and Subsidies
- 9.4 Imports, Exports and Trade Barriers
- 9.5 Public Procurement and Local Content Requirements
- 9.6 Environmental and Sustainability Compliance
- 9.7 Upcoming Policy Changes and Market Implications
Chapter 10 Asia Pacific Polymer Emulsions Market Hotspots and Opportunities
- 10.1 Market Opportunity Mapping and Growth Hotspots
- 10.2 High-Growth Applications and Customer Groups
- 10.3 Underserved Markets and White-Space Opportunities
- 10.4 Emerging Technology and Product Opportunities
- 10.5 New Capacity and Investment Hotspots
- 10.6 Market Entry and Expansion Opportunities
- 10.7 Distribution and Partnership Opportunities
- 10.8 Near-Term and Long-Term Commercial Potential
- 10.9 Opportunity Attractiveness and Execution Risks
Chapter 11 Asia Pacific Polymer Emulsions Market Outlook, 2025-2035
- 11.1 Market Size and Analysis
- 11.1.1 Revenue (Market Measurement: 2025: USD 11.71 billion → 2035: USD 23.00 billion)
- 11.1.2 Market Volume and Quantity Sold
- 11.1.3 Historical Market Size, 2018-2025
- 11.1.4 Base-Year Market Size, 2025
- 11.2 Market Forecast, 2025-2035
- 11.2.1 Revenue Forecast to 2035
- 11.2.2 Volume Forecast to 2035
- 11.2.3 CAGR and Year-on-Year Growth
- 11.2.4 Incremental Revenue Opportunity
- 11.3 Forecast Assumptions and Scenario Analysis
- 11.3.1 Base-Case Forecast
- 11.3.2 Optimistic and Conservative Scenarios
- 11.3.3 Technology, Pricing and Policy Sensitivities
- 11.4 Market Attractiveness and Growth Outlook
Chapter 12 Asia Pacific Polymer Emulsions Market Segmentation and Outlook
- 12.1 Segmentation Summary and Market Shares, 2025
- 12.2 Largest and Fastest-Growing Segments
- 12.3 By Product Type - Market Size and Forecast, 2025-2035
- 12.3.1 Segment Definition and Scope
- 12.3.2 Historical Market Size, 2018-2025
- 12.3.3 Revenue Forecast, 2025-2035
- 12.3.4 Volume Forecast, 2025-2035
- 12.3.5 Base-Year Market Share, 2025
- 12.3.6 Segment CAGR and Growth Drivers
- 12.3.7 Subsegment Market Size and Forecast
- 12.3.7.1 Acrylic Emulsions
- 12.3.7.2 Vinyl Acetate-Based Emulsions
- 12.3.7.3 Styrene-Butadiene Latex
- 12.3.7.4 Polyurethane Dispersions
- 12.3.7.5 Specialty Non-Acrylic Dispersions
- 12.3.8 Subsegment Pricing and Adoption Trends
- 12.3.9 Leading Suppliers and Competition
- 12.3.10 Regional Demand and Opportunities
- 12.4 By End-Use Industry - Market Size and Forecast, 2025-2035
- 12.4.1 Segment Definition and Scope
- 12.4.2 Historical Market Size, 2018-2025
- 12.4.3 Revenue Forecast, 2025-2035
- 12.4.4 Volume Forecast, 2025-2035
- 12.4.5 Base-Year Market Share, 2025
- 12.4.6 Segment CAGR and Growth Drivers
- 12.4.7 Subsegment Market Size and Forecast
- 12.4.7.1 Paints and Coatings
- 12.4.7.2 Adhesives and Sealants
- 12.4.7.3 Paper and Packaging
- 12.4.7.4 Construction Chemicals
- 12.4.7.5 Textiles and Specialty Manufacturing
- 12.4.8 Subsegment Pricing and Adoption Trends
- 12.4.9 Leading Suppliers and Competition
- 12.4.10 Regional Demand and Opportunities
- 12.5 By Application - Market Size and Forecast, 2025-2035
- 12.5.1 Segment Definition and Scope
- 12.5.2 Historical Market Size, 2018-2025
- 12.5.3 Revenue Forecast, 2025-2035
- 12.5.4 Volume Forecast, 2025-2035
- 12.5.5 Base-Year Market Share, 2025
- 12.5.6 Segment CAGR and Growth Drivers
- 12.5.7 Subsegment Market Size and Forecast
- 12.5.7.1 Surface Film Formation
- 12.5.7.2 Substrate Bonding
- 12.5.7.3 Cementitious Modification
- 12.5.7.4 Fiber and Particle Binding
- 12.5.7.5 Barrier and Primer Treatment
- 12.5.8 Subsegment Pricing and Adoption Trends
- 12.5.9 Leading Suppliers and Competition
- 12.5.10 Regional Demand and Opportunities
- 12.6 By Customer Type - Market Size and Forecast, 2025-2035
- 12.6.1 Segment Definition and Scope
- 12.6.2 Historical Market Size, 2018-2025
- 12.6.3 Revenue Forecast, 2025-2035
- 12.6.4 Volume Forecast, 2025-2035
- 12.6.5 Base-Year Market Share, 2025
- 12.6.6 Segment CAGR and Growth Drivers
- 12.6.7 Subsegment Market Size and Forecast
- 12.6.7.1 Integrated Formulation Groups
- 12.6.7.2 Independent Formulators
- 12.6.7.3 Direct-Use Converters
- 12.6.8 Subsegment Pricing and Adoption Trends
- 12.6.9 Leading Suppliers and Competition
- 12.6.10 Regional Demand and Opportunities
- 12.7 By Country - Market Size and Forecast, 2025-2035
- 12.7.1 Segment Definition and Scope
- 12.7.2 Historical Market Size, 2018-2025
- 12.7.3 Revenue Forecast, 2025-2035
- 12.7.4 Volume Forecast, 2025-2035
- 12.7.5 Base-Year Market Share, 2025
- 12.7.6 Segment CAGR and Growth Drivers
- 12.7.7 Subsegment Market Size and Forecast
- 12.7.7.1 China
- 12.7.7.2 Japan and South Korea
- 12.7.7.3 India
- 12.7.7.4 Southeast Asia
- 12.7.7.5 Australia, New Zealand and Remaining Asia
- 12.7.8 Subsegment Pricing and Adoption Trends
- 12.7.9 Leading Suppliers and Competition
- 12.7.10 Regional Demand and Opportunities
- 12.8 Segment Growth Comparison
- 12.9 Segment Attractiveness and Priority Matrix
Chapter 13 Asia Pacific Polymer Emulsions End-Use and Application Market Outlook
- 13.1 End-Use Industry and Customer Demand Structure
- 13.2 Leading Applications and Customer Groups
- 13.3 End-Use Market Size, Share and Forecast
- 13.4 Major End-Use Industry Deep Dives
- 13.4.1 Customer Requirements and Use Cases
- 13.4.2 Demand and Replacement Cycles
- 13.4.3 Technical and Regulatory Considerations
- 13.4.4 Purchasing and Procurement Models
- 13.4.5 Leading Vendors and Distribution Channels
- 13.4.6 Forecast and Commercial Opportunities
- 13.5 Emerging Applications and Cross-Segment Demand
- 13.6 End-Use Industry Investment Priorities
Chapter 14 Asia Pacific Polymer Emulsions Geographic Market Outlook, 2025-2035
- 14.1 Regional Market Size and Country-Level Shares, 2025
- 14.2 Country Market Size Comparison, 2025
- 14.3 Country Market Forecasts, 2025-2035
- 14.4 Subregional Industrial and Demand Clusters
- 14.5 Intra-Regional Pricing and Cost Differences
- 14.6 Cross-Border Trade and Supply Networks
- 14.7 Regional Supply and Demand Balances
- 14.8 Country Opportunity Comparison and Prioritization
Note: Every listed country is covered on the structure shown under the first country.
Chapter 15 Asia Pacific Polymer Emulsions Technology, Innovation and Sustainability Outlook
- 15.1 Technology Landscape and Maturity
- 15.2 Product, Process and Service Innovation
- 15.3 AI, Automation and Digital Tools in the Industry
- 15.4 Technology Adoption and Performance Benchmarking
- 15.5 Innovation Pipeline and R&D Investment
- 15.6 Patent and Intellectual Property Trends
- 15.7 Energy Efficiency and Resource Management
- 15.8 Sustainability, Recycling and Circularity
- 15.9 Technology Roadmap, 2025-2035
- 15.10 Risks of Obsolescence and Technology Substitution
Chapter 16 Asia Pacific Polymer Emulsions Market Key Strategic Imperatives
- 16.1 Growth and Market Entry Priorities
- 16.2 High-Return Products and Segments
- 16.3 Pricing, Profitability and Cost Optimization
- 16.4 Technology Investment and Product Differentiation
- 16.5 Supply Chain Localization and Resilience
- 16.6 Distribution and Customer Acquisition
- 16.7 Partnership, Acquisition and Capacity Strategy
- 16.8 Regional Expansion Priorities
- 16.9 Short-, Medium- and Long-Term Actions
Chapter 17 Competition Outlook
- 17.1 Industry Competition Characteristics
- 17.2 Market Structure and Concentration
- 17.3 Market Share and Competitive Positioning, 2025
- 17.4 Company-Wise Revenue and Product Benchmarking
- 17.5 Production and Service Capacity Benchmarking
- 17.6 Technology, Pricing and Differentiation
- 17.7 Regional Footprint and Distribution Strength
- 17.8 Mergers, Acquisitions and Strategic Alliances
- 17.9 New Entrants and Competitive Threats
- 17.10 Porter's Five Forces and Industry Attractiveness
- 17.11 Competitive Outlook, 2025-2035
Chapter 18 Company Profiles
- 18.1 Company Coverage and Selection Criteria
- 18.2 BASF SE
- 18.2.1 Business Description
- 18.2.2 Company Ownership and Geographic Presence
- 18.2.3 Product and Service Portfolio
- 18.2.4 Manufacturing and Operating Footprint
- 18.2.5 Production Capacity and Expansion Plans
- 18.2.6 Financial Performance and Investment
- 18.2.7 Market Share and Competitive Position
- 18.2.8 Technology and Innovation Capabilities
- 18.2.9 Strategic Alliances or Partnerships
- 18.2.10 Recent Developments
- 18.2.11 Growth Strategy and Outlook
- 18.3 The Dow Chemical Company
- 18.4 Trinseo PLC
- 18.5 Wacker Chemie AG
- 18.6 DIC Corporation
- 18.7 Other Relevant Market Participants
Note: Every listed company is profiled on the structure shown under the first company. The company list is preliminary and may change based on research findings, market developments, data availability and client requirements.
Chapter 19 Disclaimer
- 19.1 Research and Forecast Disclaimer
- 19.2 Data Source and Estimation Limitations
Note: The depth of individual sections depends on data availability for this market. Volume, capacity, trade and other unit-based metrics are included where applicable.

