
Aging patients and Medicare bone tests sustain demand
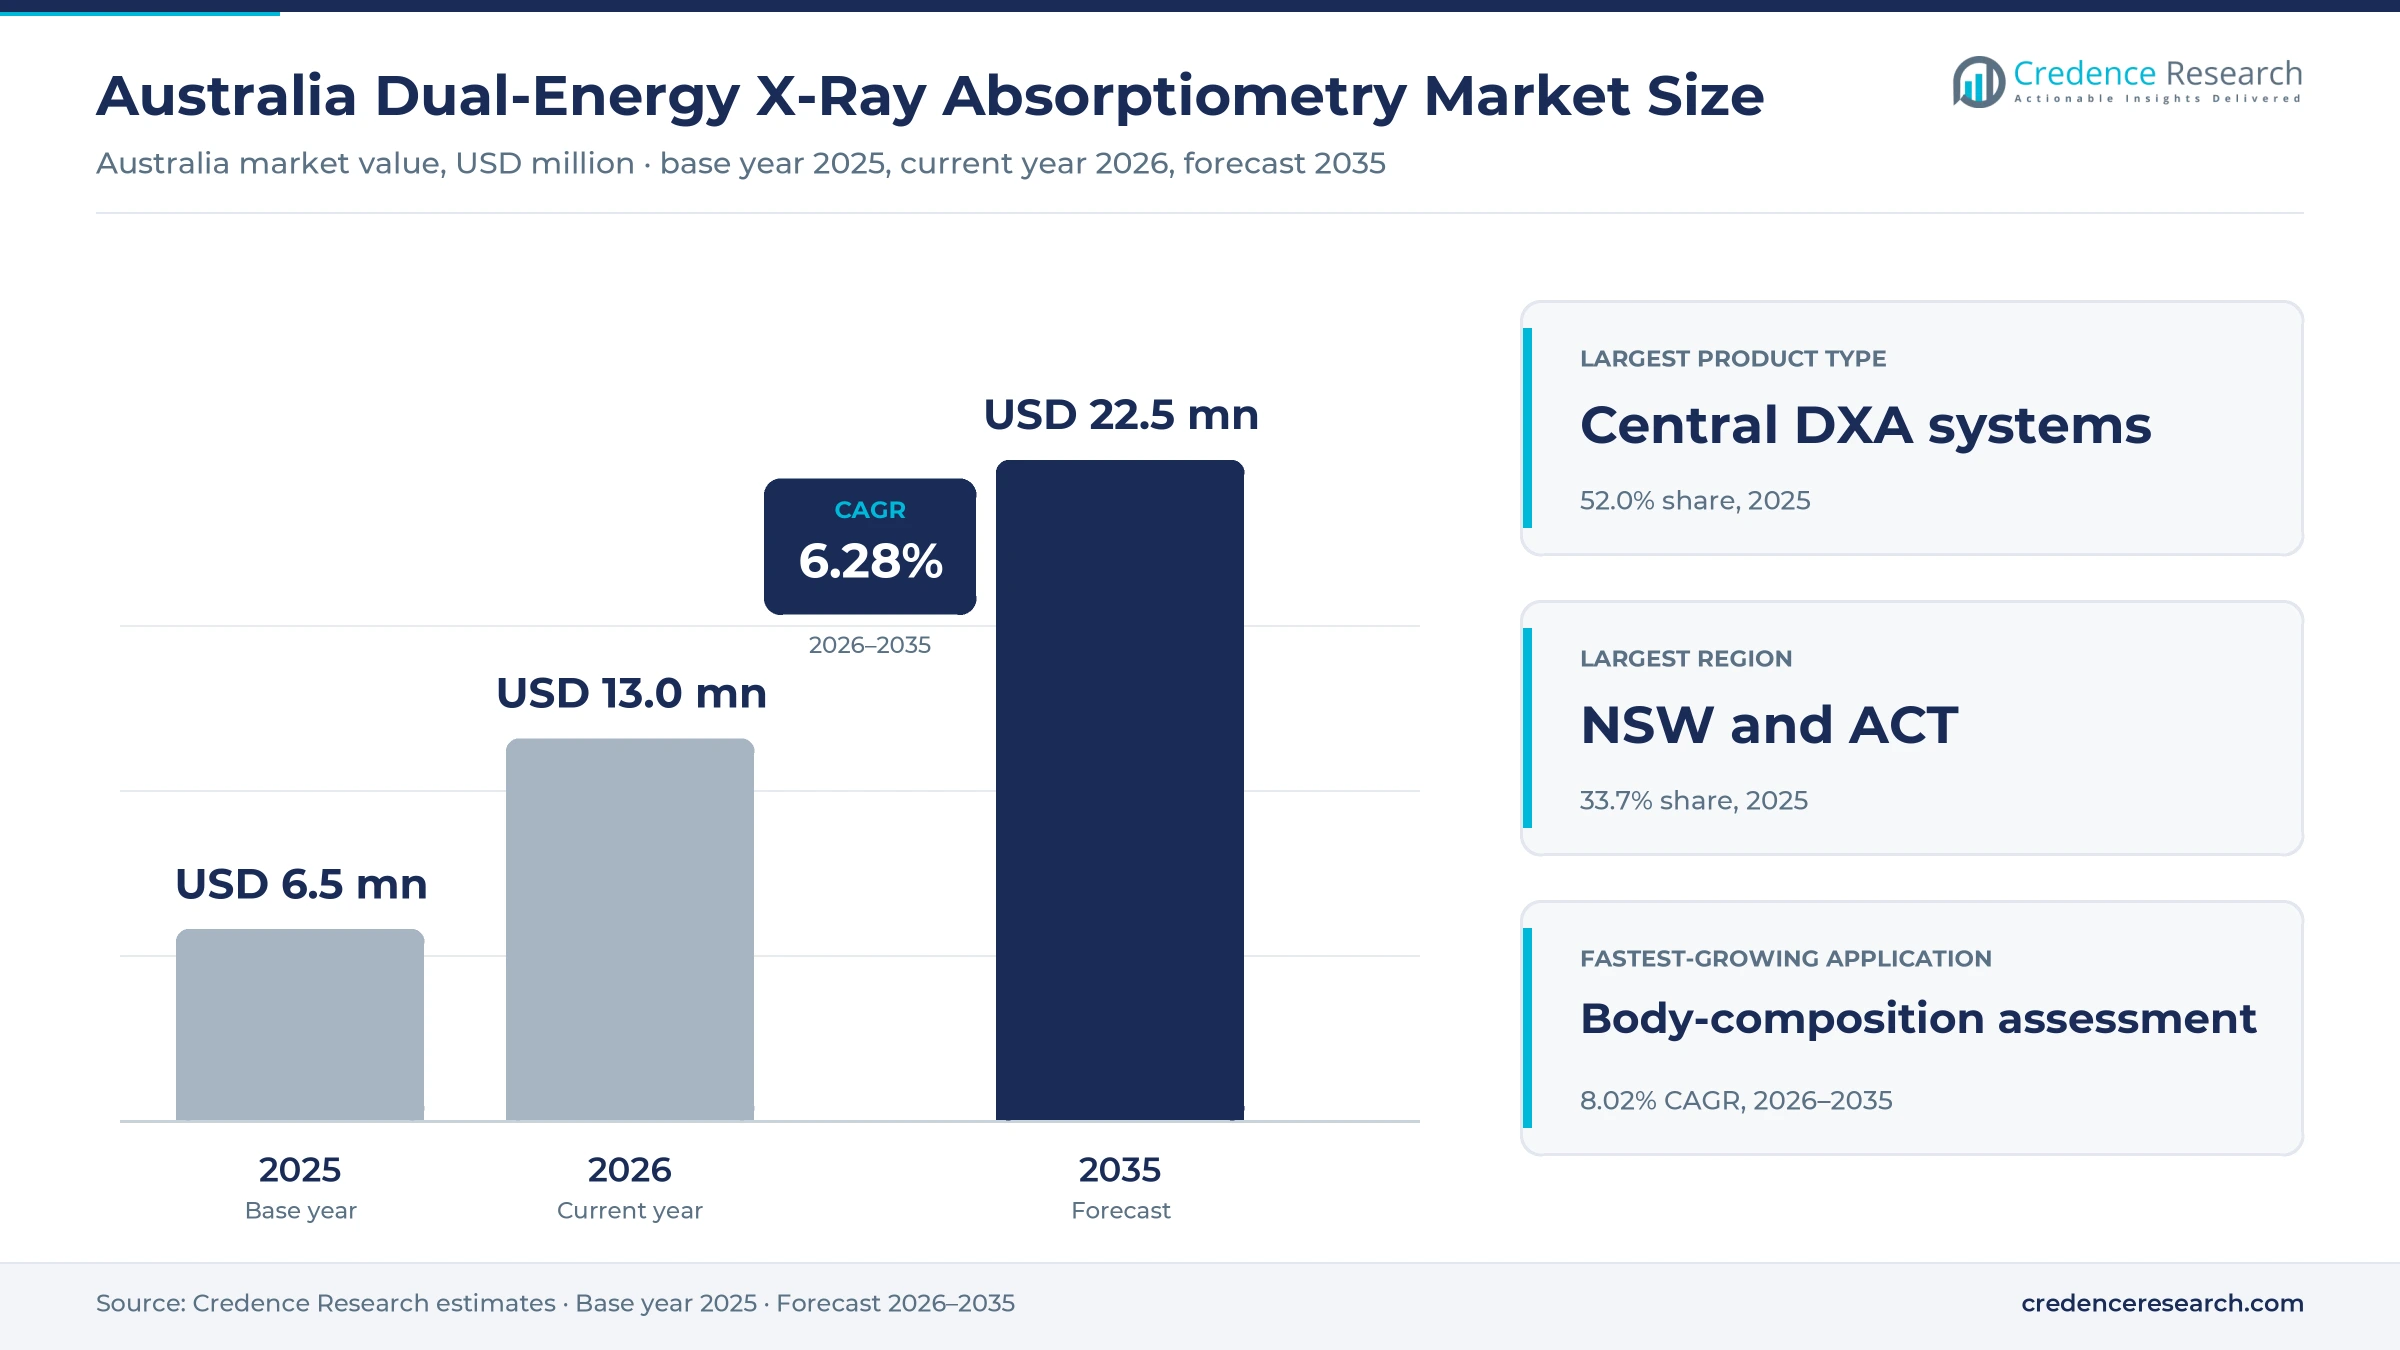
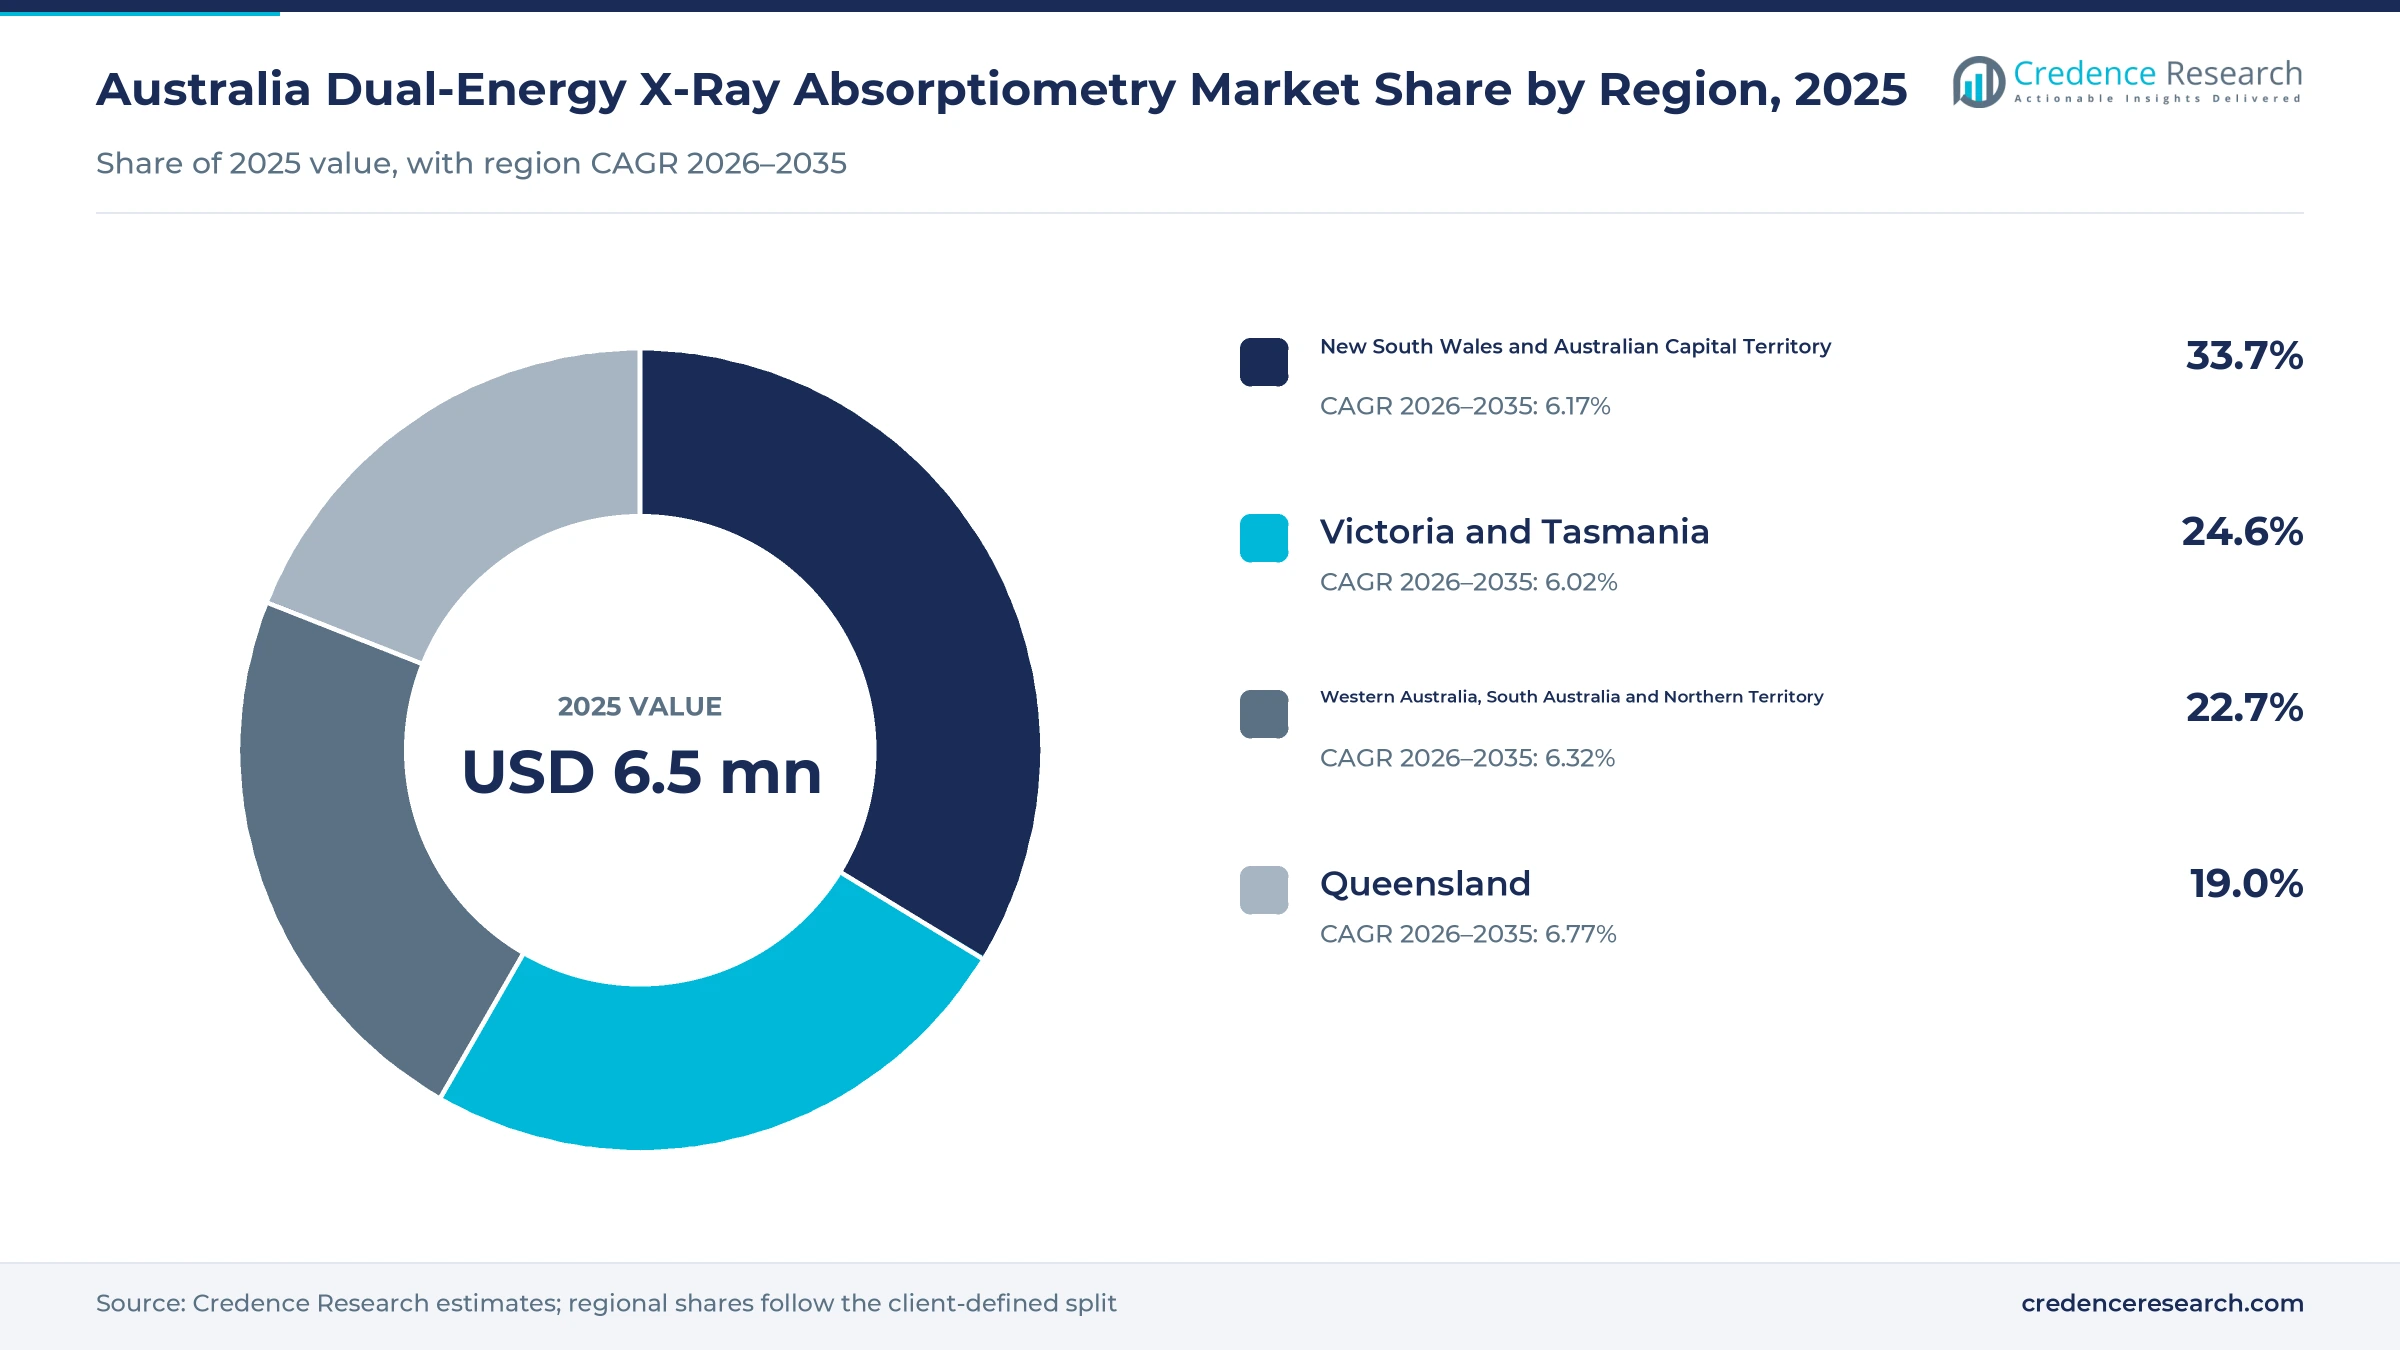
The Australia dual-energy X-ray absorptiometry market was valued at USD 6.5 million in 2025 and is projected to increase from USD 13.0 million in 2026 to USD 22.5 million by 2035, registering a CAGR of 6.28% during 2026–2035. Demand comes from radiology groups and hospitals that test older adults for osteoporosis, from specialists who monitor bone loss in patients on steroids or cancer treatment, and from sports and weight clinics that sell body-composition scans. New South Wales and the Australian Capital Territory held the largest regional share, 33.7% in 2025, because the zone has the largest population and the densest radiology networks. Queensland is the fastest-growing region at 6.77% a year, as interstate migration adds older residents. In turn, the national advisory committee declined in August 2024 to extend Medicare-funded screening to people aged 60 to 69, which keeps the over-70 group at the center of scan volumes.
Which bone density scanners, software and services does the estimate cover?
The estimate measures the value of central scanners that measure the hip and spine, peripheral scanners that measure the forearm or heel, analysis software and maintenance services. It counts purchases, rentals, licence payments and service contracts paid by radiology groups, hospitals, specialist clinics and body-composition studios across Australia.
The estimate excludes the scan fees that patients and Medicare pay, quantitative computed tomography and ultrasound bone tests. The value chain runs from scanner makers in the United States, Europe and Asia through local subsidiaries and distributors to imaging sites in every state and territory.
Australia Dual-Energy X-Ray Absorptiometry Market Insights
- The Australia dual-energy X-ray absorptiometry market was valued at USD 6.5 million in 2025 and is projected to reach USD 22.5 million by 2035, registering a CAGR of 6.28% during 2026–2035.
- New South Wales and the Australian Capital Territory held a 33.7% share of 2025 value, because the zone has the largest population.
- Central DXA systems led with a 52.0% share of 2025 value, because hip and spine scans are required for Medicare-funded diagnosis.
- Integral Diagnostics completed its merger with Capitol Health on Dec. 20, 2024, which created a larger buyer of imaging equipment.
- Body-composition assessment grows fastest at 8.02% a year during 2026–2035, as self-paying clients book scans for fat and muscle tracking.
Central systems lead as body-composition use grows fastest
Why do central scanners hold most equipment value?
Based on product type, the market is categorized into central DXA systems, peripheral DXA systems, software modules and maintenance services. Central DXA Systems led with a 52.0% share of 2025 value, because Medicare-funded diagnosis relies on hip and spine scans from full-size tables. Software Modules grow fastest at 7.71% a year, as sites add fracture-risk, vertebral and body-composition analysis to installed scanners.
How do osteoporosis tests and body scans split use?
Based on application, the market is categorized into osteoporosis assessment, secondary bone-loss monitoring, body-composition assessment and clinical research. Osteoporosis Assessment led with a 55.0% share of 2025 value, because screening of people aged 70 and over drives most Medicare-funded scans. Body-Composition Assessment grows fastest at 8.02% a year, as gyms, dietitians and athletes pay privately for fat and lean mass reports.
Why do outpatient imaging sites dominate scanner use?
Based on care setting, the market is categorized into outpatient imaging centres, hospital imaging departments, specialist medical clinics and dedicated body-composition centres. Outpatient Imaging Centres led with a 52.0% share of 2025 value, because most bone density scans are referred by general practitioners to community radiology sites. Dedicated Body-Composition Centres grow fastest at 8.28% a year, as private studios open in capital cities for self-paying clients.
How do radiology groups and public networks buy scanners?
Based on customer type, the market is categorized into corporate radiology groups, public health networks, private hospital groups and independent clinical practices. Corporate Radiology Groups led with a 48.0% share of 2025 value, because large networks run scanners across many suburban sites. Corporate Radiology Groups grow fastest at 6.64% a year, as mergers and new owners standardize equipment and service contracts across larger fleets.
| Segment Group | Leading Sub-segment | Share, 2025 | Fastest-growing Sub-segment | CAGR, 2026–2035 |
|---|---|---|---|---|
| By Product Type | Central DXA Systems | 52.0% | Software Modules | 7.71% |
| By Application | Osteoporosis Assessment | 55.0% | Body-Composition Assessment | 8.02% |
| By Care Setting | Outpatient Imaging Centres | 52.0% | Dedicated Body-Composition Centres | 8.28% |
| By Customer Type | Corporate Radiology Groups | 48.0% | Corporate Radiology Groups | 6.64% |
Request a Free Sample
Fill in your details and we'll send you a free sample report.
- Sample data tables & charts
- Research methodology
Bone-health need, fleet renewal and device rules lift demand
How does clinical bone-health assessment keep scan volumes high?
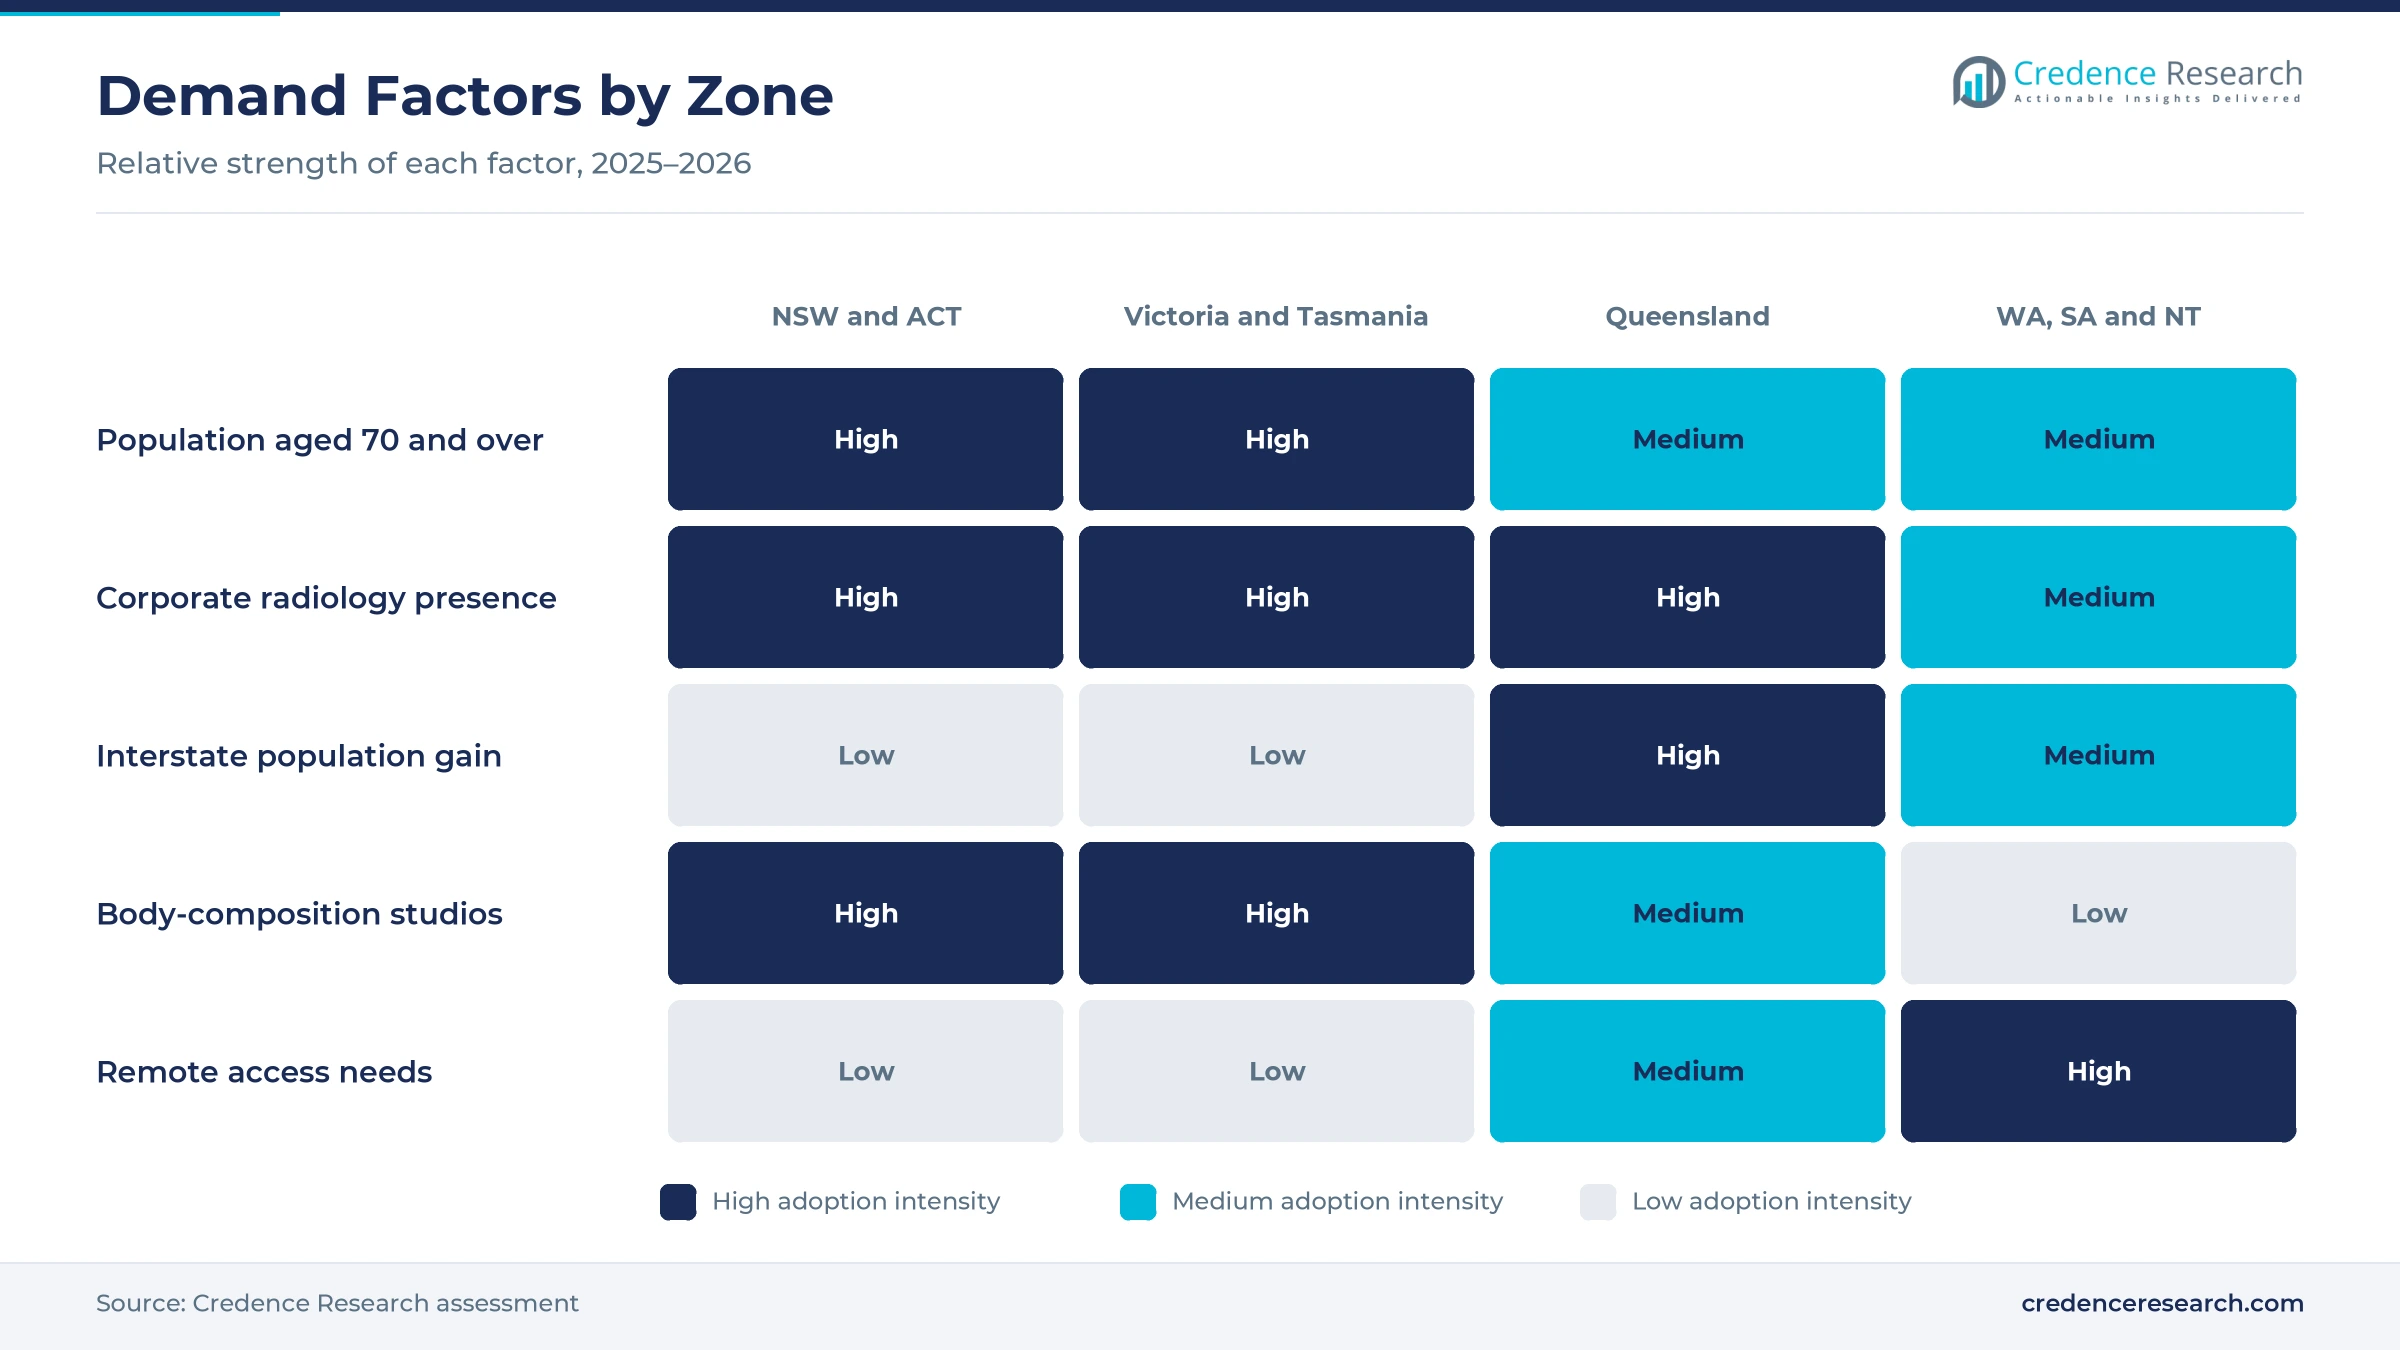
Clinical bone-health assessment keeps scan volumes high, because Medicare funds routine bone density tests for everyone aged 70 and over. Some 249,996 bone density scans were performed for this age group in 2022, and spending on the two screening items rose 29.3% in 2022-23 with about 60,000 additional services, according to the national advisory committee. Around 853,600 people, or 3.4% of the population, reported osteoporosis or osteopenia in 2022, according to the Australian Institute of Health and Welfare. In turn, osteoporosis assessment holds 55.0% of 2025 value, while demand for osteoporosis drugs depends on the same test results and treatment thresholds.
Why do replacement and service continuity sustain spending?
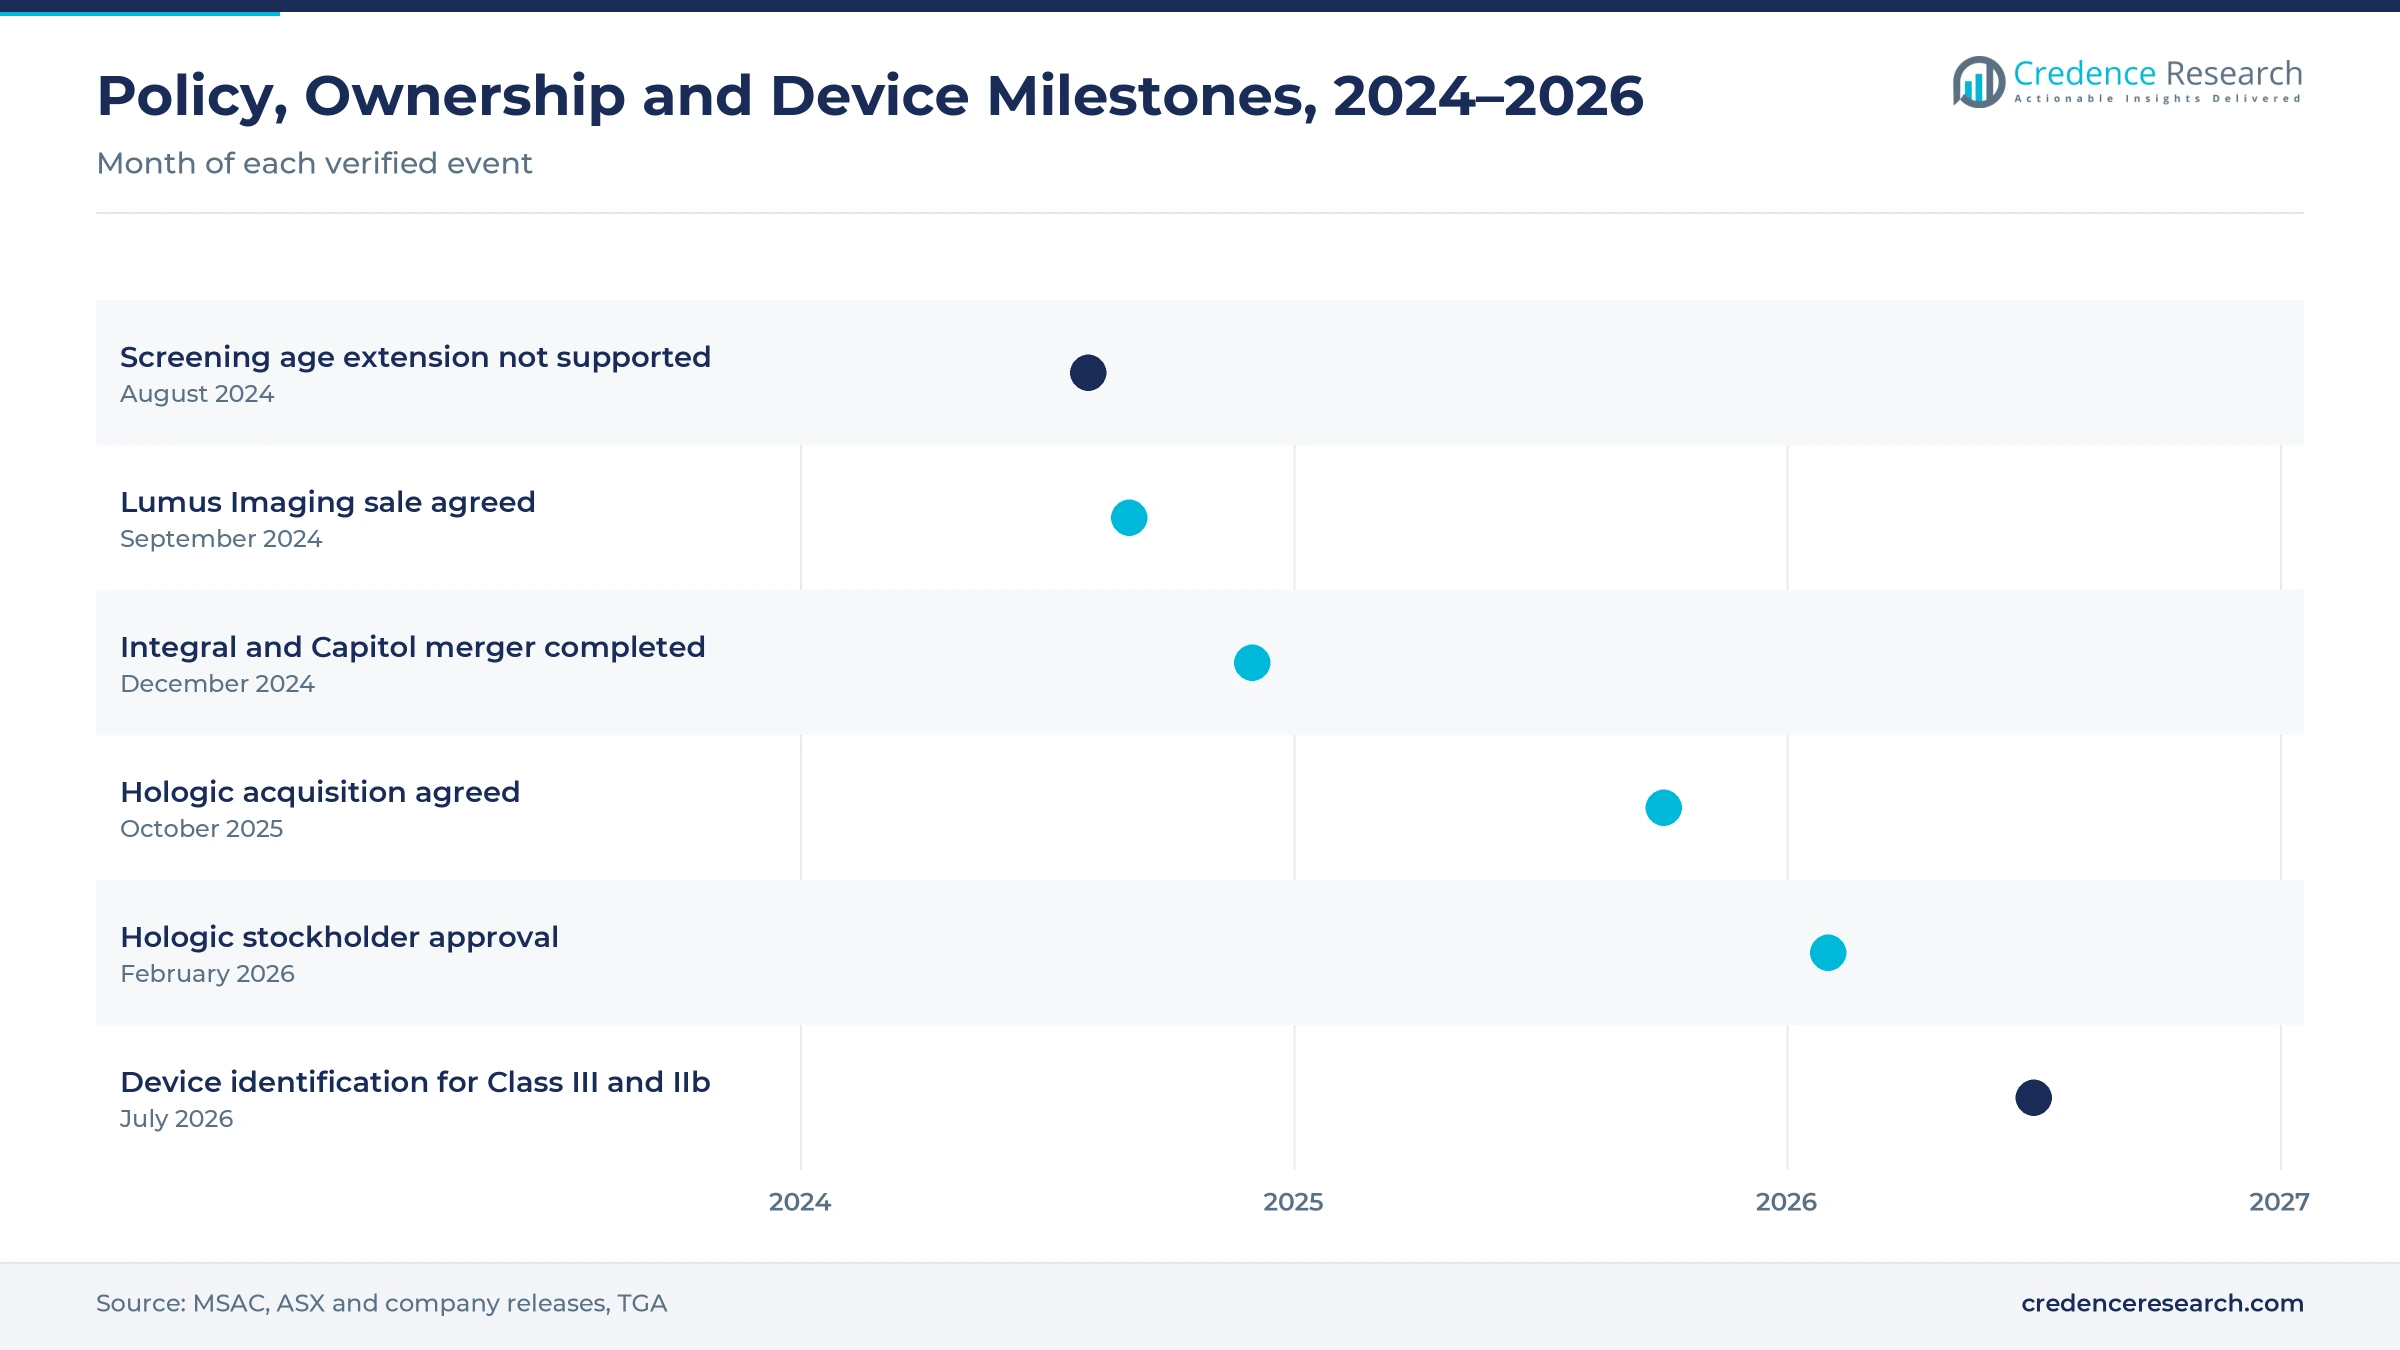
Replacement and service continuity sustain spending, because heavily used scanners need regular calibration, parts and eventual renewal. The roughly 60,000 extra screening services in 2022-23 added wear to existing tables, while the Medicare fee for items 12320 and 12322 stood at AUD 112.15 per scan in the 2024 assessment. Integral Diagnostics completed its merger with Capitol Health on Dec. 20, 2024, which put more scanners under one service and procurement team. Healius also agreed on Sept. 23, 2024, to sell Lumus Imaging to funds managed by Affinity Equity Partners. As a result, maintenance services hold a steady share, and new owners review aging fleets.
How does the Australian device framework shape purchases?
The Australian device framework shapes purchases, because every scanner must be included on the national therapeutic goods register before sale and meet state radiation licensing rules. Unique device identification becomes mandatory for Class III and Class IIb devices from July 1, 2026, under a staged rollout over five years set by risk class. Medicare rules also require scans to be performed by a specialist or a licensed person under supervision, according to the Medicare Benefits Schedule fact sheet. Repeat screening under items 12320 and 12322 is limited to every 2 or five years, depending on the T-score. In turn, buyers favor established suppliers with local registration, service staff and compliance records.
Why is body-composition testing adding a self-pay stream?
Body-composition testing adds a self-pay stream, because athletes, dietitians and older adults use scans to track fat, lean mass and muscle loss. The Australian Body Composition Study, published in May 2021, built reference ranges from adults aged 18 to 88 scanned at three commercial densitometry centers, according to a paper indexed by the National Institutes of Health. Body-composition scans are generally not covered by Medicare, so clients pay directly. GE HealthCare markets its Lunar iDXA in Australia for bone density, metabolic health, pediatric development and sarcopenia assessment. As a result, body-composition assessment grows at 8.02% a year, faster than body composition analyzers based on impedance.
Radiology consolidation and body scans reshape buying
How is the shift to larger radiology networks changing buying?
The shift to larger radiology networks is changing buying, because consolidated owners negotiate fleet-wide scanner and service contracts. Integral Diagnostics implemented its merger with Capitol Health on Dec. 20, 2024, after the competition regulator reviewed the deal from September 2024. Healius agreed in September 2024 to sell Lumus Imaging to Affinity Equity Partners, with completion expected in the first quarter of 2025. Hologic agreed on Oct. 21, 2025, to be acquired by Blackstone and TPG, and its stockholders approved the deal on Feb. 5, 2026. As a result, corporate radiology groups grow at 6.64% a year, the fastest customer rate.
Why is the rise of policy pressure on screening age notable?
The rise of policy pressure on screening age is notable, because patient groups want Medicare scans to start earlier. Some 6.2 million Australians aged over 50 lived with poor bone health in 2023, a figure projected to reach 7.7 million by 2033, according to a report covered by the Royal Australian College of General Practitioners. The national advisory committee considered extending items 12320 and 12322 to people aged 60 to 69 at its Aug. 1-2, 2024, meeting and did not support it. The base-case estimate was 230,771 extra tests in the first year. In turn, suppliers plan capacity for a possible future change while current volumes stay focused on older patients.
Can secondary bone-loss monitoring open new scan demand?
Secondary bone-loss monitoring can open new scan demand, because people on steroids, hormone therapy or other bone-damaging treatment qualify for more frequent testing. Repeat scans every 12 months remain available for conditions or treatments that cause rapid bone loss under the 2017 Medicare rules. Some 105,000 minimal trauma fracture hospitalizations occurred among people aged 45 and over in 2021-22, including 29,000 hip fractures. Falls linked to low bone density cost about AUD 1.2 billion in 2018-19, or 1.9% of total health spending. As a result, secondary bone-loss monitoring grows ahead of routine screening, and specialist clinics add scanners near oncology and endocrinology services that treat these patients.
Is there room for software upgrades on installed scanners?
Installed scanners leave room for software upgrades, because sites can add fracture-risk, vertebral and body-composition tools without buying a new table. GE HealthCare promotes trabecular bone score and atypical femur fracture analysis on its Lunar iDXA platform. The Australian Body Composition Study found that Hologic scanners are the most commonly used for soft tissue reference work, which supports software sales on that base. Screening use peaked in 2017 at 1,004 scans per 100,000 people before falling to 609 after Medicare limits. In turn, software modules grow at 7.71% a year, the fastest product rate, as sites extend the value of each installed table.
Rebate limits, staffing and capital costs slow upgrades
How do Medicare repeat limits cap scan volumes?
Medicare repeat limits cap scan volumes, because screening tests for people aged 70 and over can only be repeated every two or five years. Screening use fell sharply after the 2017 rule change limited repeat testing. As a result, sites earn less per scanner and often delay replacement by several years. Suppliers respond with rental plans, refurbished units and software upgrades that extend the working life of current tables, which keeps service revenue flowing even when new sales slow.
Why do staffing and supervision rules add cost?
Staffing and supervision rules add cost, because scans must be performed by a specialist or a licensed person under supervision and reported by a specialist. Each state also licenses radiation equipment and operators under its own laws. In turn, smaller clinics struggle to run a scanner profitably. Radiology networks respond by sharing reporting specialists across sites and training technologists centrally, which spreads fixed costs over larger scan volumes and keeps more suburban sites open.
How do capital costs limit regional access?
Capital costs limit regional access, because a central scanner, room shielding and software represent a large outlay for low-volume sites. Patients in remote areas often travel to larger towns for testing. As a result, regional hospitals keep older units in service much longer. Suppliers respond with peripheral scanners, leasing and remote service support that lower the cost of serving smaller towns, while visiting technologists help keep scanners in regular use.
Why does body-composition marketing face scrutiny?
Body-composition marketing faces scrutiny, because self-pay scans are sold to healthy clients outside Medicare rules and clinical referral pathways. Clinics must still meet radiation safety rules for every scan. In turn, some referrers question the value of repeated consumer scans. Operators respond with exercise physiologist reviews, clear dose information and limits on how often clients are scanned each year, which helps build trust with general practitioners and sports doctors.
New South Wales leads as Queensland grows fastest
| Region | Value, 2025 (USD million) | Share, 2025 | CAGR, 2026–2035 |
|---|---|---|---|
| New South Wales and Australian Capital Territory | 2.2 | 33.7% | 6.17% |
| Victoria and Tasmania | 1.6 | 24.6% | 6.02% |
| Western Australia, South Australia and Northern Territory | 1.5 | 22.7% | 6.32% |
| Queensland | 1.2 | 19.0% | 6.77% |
Why does new South Wales and the ACT hold the top share?
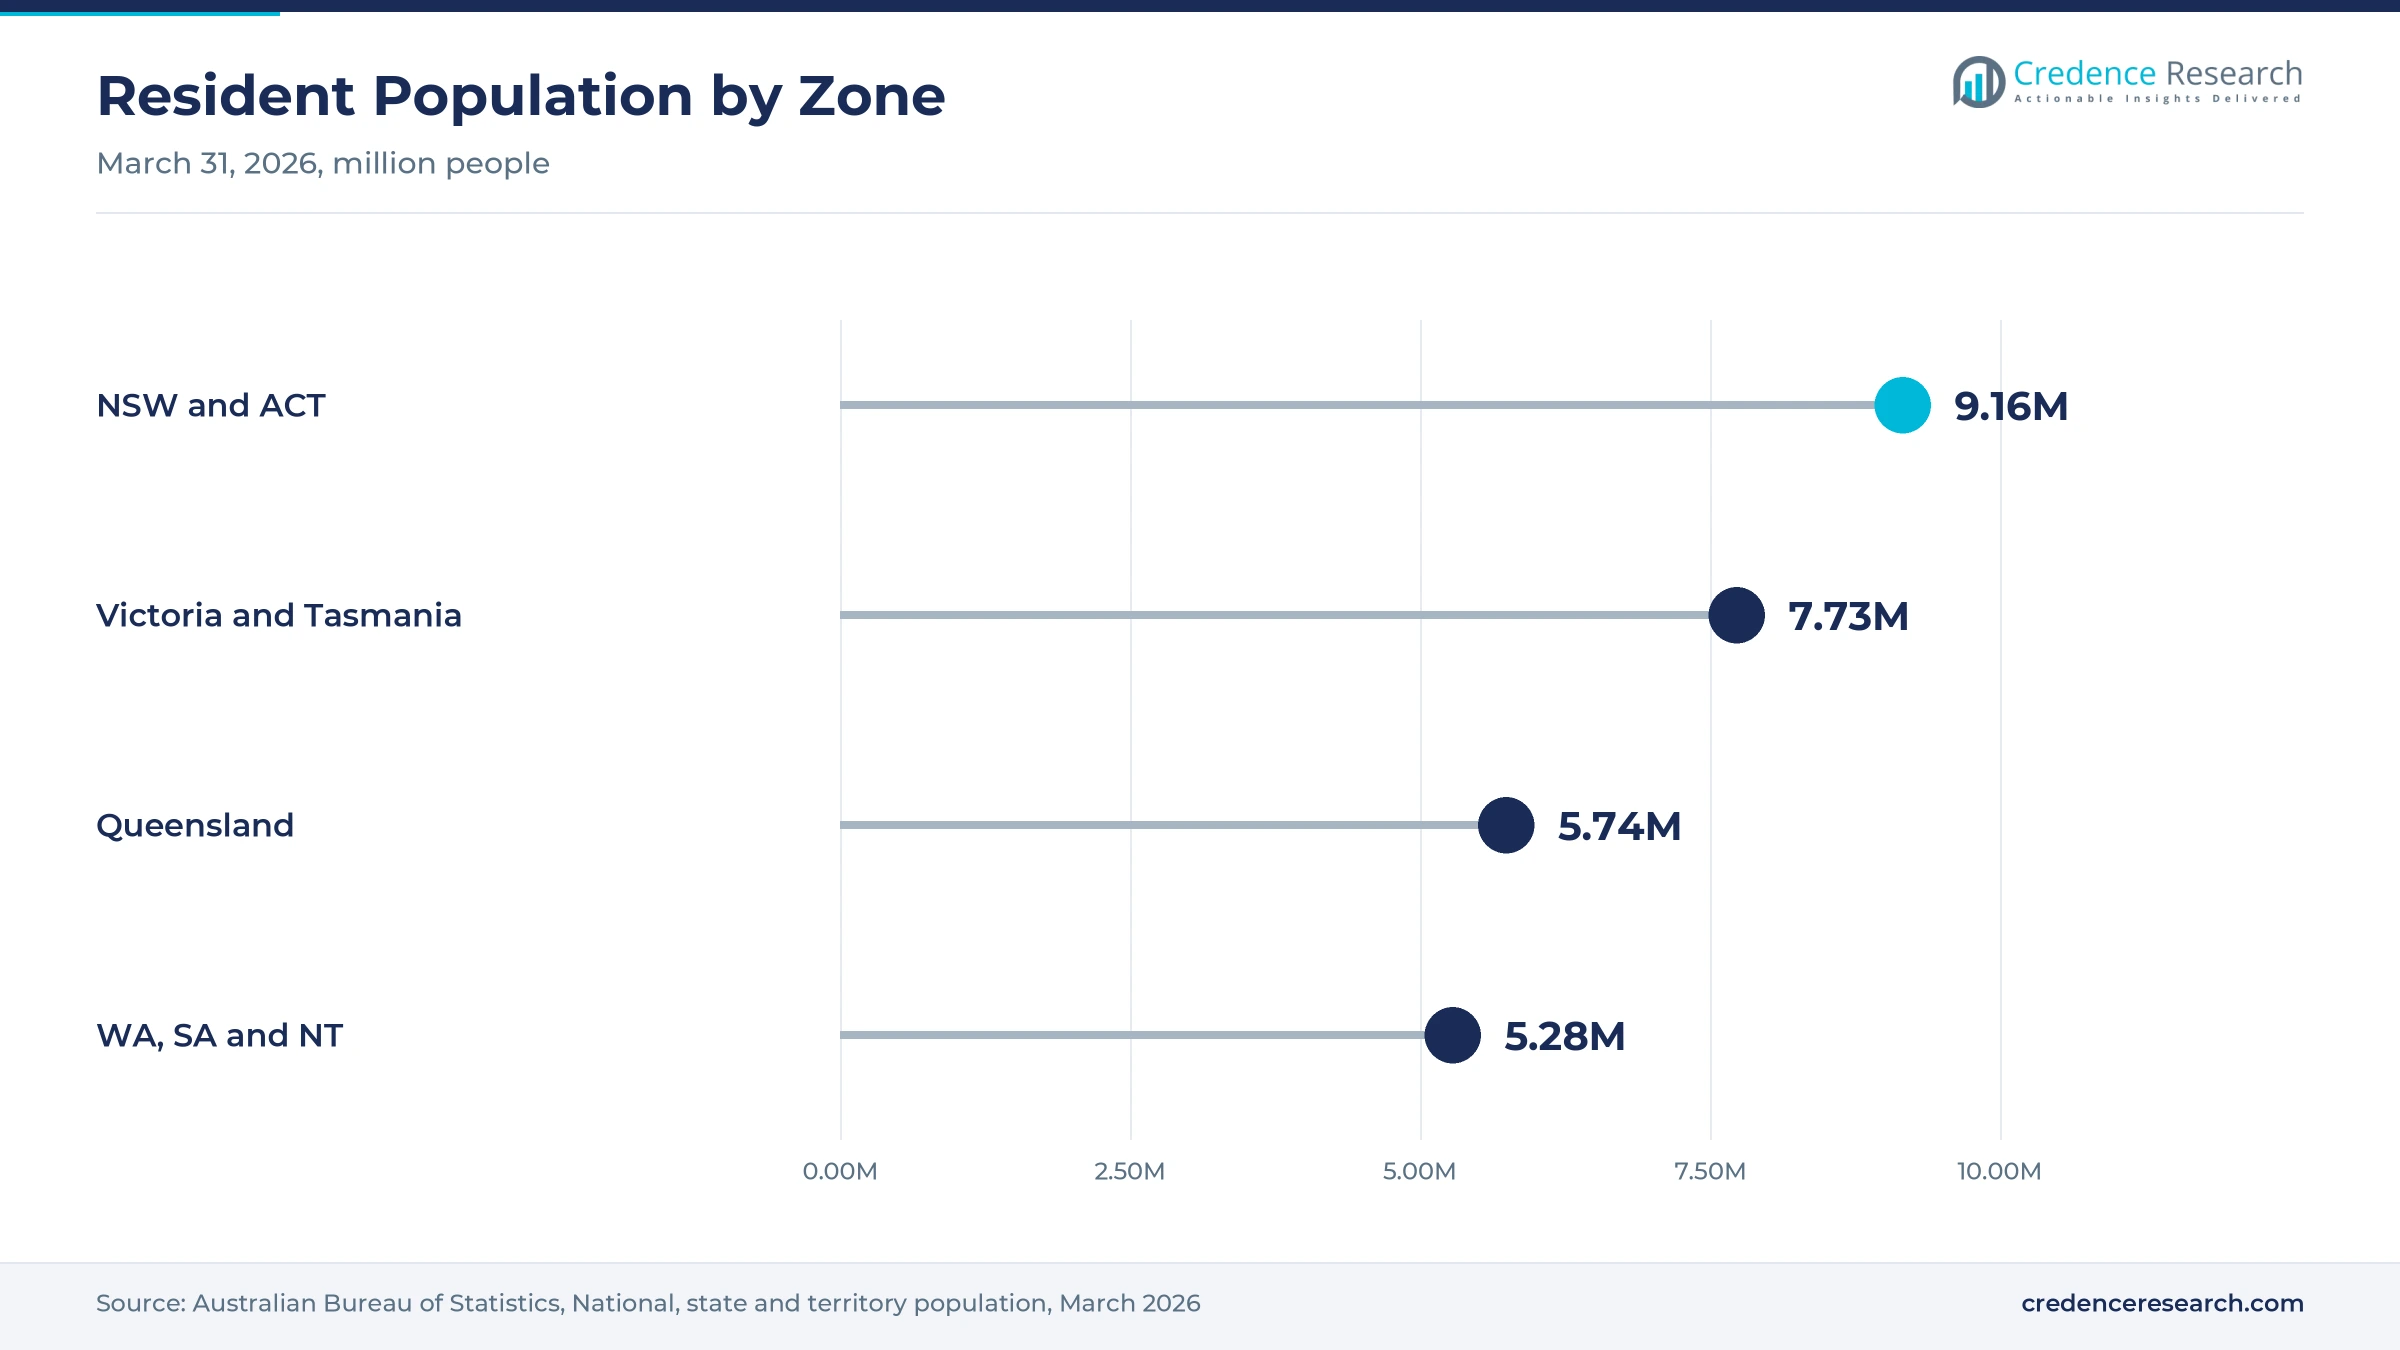
New South Wales and the Australian Capital Territory held a 33.7% share of 2025 value and grow at 6.17% a year, because the zone had about 9.16 million residents in March 2026. Sydney hosts large radiology networks, teaching hospitals and specialist bone clinics that refer patients for scans. As a result, the zone leads both replacement purchases and new body-composition studios, while Canberra adds public hospital demand.
How do Victoria and Tasmania support scanner demand?
Victoria and Tasmania held a 24.6% share of 2025 value and grow at 6.02% a year, because Melbourne has dense community radiology and hospital networks. The zone had about 7.73 million residents in March 2026, with Victoria growing 1.6% and Tasmania 0.6% over the year. In turn, Melbourne sites drive most purchases, while Tasmania relies on a small number of hospital and private sites.
Why is Queensland growing fastest?
Queensland held a 19.0% share of 2025 value and grows fastest at 6.77% a year, because it gains more people from other states than any other jurisdiction. The state added a net 14,718 interstate migrants in the year to March 2026, the largest net gain of any state. Qscan offers bone density scans at four south-east Queensland sites. As a result, new suburban clinics add scanners from the start.
What shapes demand in the western, southern and northern zone?
Western Australia, South Australia and the Northern Territory held a 22.7% share of 2025 value and grow at 6.32% a year, because the zone combines Perth and Adelaide with remote areas. Western Australia had the fastest population growth at 2.1% in the year to March 2026. As a result, city sites drive purchases while remote patients travel for scans.
Mergers, ownership changes and policy moves, 2024–2026
| Development | Status and market relevance |
|---|---|
| In August 2024, the national advisory committee did not support extending Medicare bone density screening to people aged 60 to 69. | Keeps funded screening focused on people aged 70 and over |
| In September 2024, Healius agreed to sell Lumus Imaging to funds managed by Affinity Equity Partners. | Moves a national imaging network to new ownership |
| In December 2024, Integral Diagnostics completed its merger with Capitol Health through a scheme of arrangement. | Creates a larger buyer of imaging equipment and service |
| In October 2025, Hologic agreed to be acquired by Blackstone and TPG, with stockholder approval on Feb. 5, 2026. | Changes ownership of a leading bone density scanner maker |
| In July 2026, unique device identification became mandatory for Class III and Class IIb devices in Australia. | Starts a staged five-year rollout by risk class |
Fan-beam scanners, fracture tools and software change use
- Fan-beam central scanners measure the hip and spine quickly with low dose, which supports high daily volumes at community radiology sites.
- Fracture-risk and vertebral software adds trabecular bone score, vertebral fracture and atypical femur fracture tools, which helps doctors decide on treatment.
- Body-composition analysis reports fat, lean mass and visceral fat by region, which supports sarcopenia care, sports science and weight programs alongside bone densitometers used for diagnosis.
Need a Custom Version of This Report?
Tailor the scope, geography, or segments to your exact requirements.
- Custom geography or segment scope
- Direct access to our analyst team
Global scanner makers and radiology networks shape supply
Competition is split between global scanner makers and the radiology networks that buy and operate their equipment. A national body-composition study described Hologic scanners as the most commonly used, while GE HealthCare markets its Lunar iDXA to Australian sites for bone, metabolic and sarcopenia assessment. Hologic agreed on Oct. 21, 2025, to be acquired by Blackstone and TPG. Integral Diagnostics completed its merger with Capitol Health in December 2024, while Healius agreed to sell Lumus Imaging to Affinity Equity Partners in September 2024. Qscan offers bone density scans at four south-east Queensland sites. Rivals compete on precision, scan speed, dose, software options, service response and price. Because most buyers run several sites, suppliers with national service teams and fleet contracts win more replacement orders.
Which companies supply and operate bone density scanners in Australia?
| Company | Type | Role in the market |
|---|---|---|
| Hologic | Global scanner maker | Central bone density scanners used widely for clinical and body-composition work |
| GE HealthCare | Global scanner maker | Markets Lunar iDXA for bone, metabolic and sarcopenia assessment |
| Integral Diagnostics | Radiology network | Completed its merger with Capitol Health on Dec. 20, 2024 |
| Lumus Imaging | Radiology network | Sale to Affinity Equity Partners agreed in September 2024 |
| Qscan | Radiology network | Bone density scans at four south-east Queensland sites |
Credence Research view on bone density scanning demand
Credence Research's view is that Australian demand for bone density scanners will grow steadily because the population is aging and Medicare funds screening for everyone aged 70 and over. Central systems remain the largest value pool, while software and body-composition services add the fastest growth. Radiology mergers and ownership changes are concentrating purchasing power in fewer hands. Suppliers that pair reliable service with fracture-risk software and flexible financing should gain share fastest, while repeat-scan limits will keep some older units in use longer as X-ray absorptiometry demand shifts toward monitoring.
How the national bone density scanning estimate was built
The report uses 2025 as the base year on a calendar basis, and market values come from the Credence Research model. That model combines Medicare service data from advisory committee papers, national health statistics, population estimates, regulator publications and company announcements. Segment splits and zone growth rates are Credence Research estimates, while zone shares follow the client-defined split. Sources used are official statistics, government releases, peer-reviewed studies and company releases, and no interviews or surveys were used.
Older patients and monitoring scans carry growth to 2035
Scanner and service value is expected to reach USD 22.5 million by 2035, a 6.28% CAGR during 2026–2035, as an aging population keeps screening and monitoring volumes high. Growth should come from fleet renewal at merged radiology networks, software upgrades and self-pay body-composition scans. Any future Medicare decision to fund younger patients would lift volumes sharply, while tighter rules would slow replacement. Suppliers with national service coverage are expected to gain the most, as X-ray absorptiometry stays the standard test for bone density in Australia.
Frequently Asked Questions
How big is the Australia dual-energy X-ray absorptiometry market?
Which product type leads Australian scanner value?
Which region leads the Australian market?
Who qualifies for a Medicare-funded bone density scan?
Did Medicare extend bone density screening to people in their 60s?
Which application is growing fastest?
Who are the leading companies in the Australian market?
What are the main challenges for suppliers?
Table of Content
Chapter 1 Market Segmentation
- 1.1 Segmentation Framework
- 1.1.1 Product and Service Classification
- 1.1.2 Application and End-Use Classification
- 1.1.3 Technology and Solution Classification
- 1.1.4 Customer and Distribution Channel Classification
- 1.1.5 Geographic Segmentation
- 1.1.6 Market Segment Definitions and Boundaries
- 1.2 By Product Type
- 1.2.1 Central DXA Systems
- 1.2.2 Peripheral DXA Systems
- 1.2.3 Software Modules
- 1.2.4 Maintenance Services
- 1.3 By Application
- 1.3.1 Osteoporosis Assessment
- 1.3.2 Secondary Bone-Loss Monitoring
- 1.3.3 Body-Composition Assessment
- 1.3.4 Clinical Research
- 1.4 By Care Setting
- 1.4.1 Outpatient Imaging Centres
- 1.4.2 Hospital Imaging Departments
- 1.4.3 Specialist Medical Clinics
- 1.4.4 Dedicated Body-Composition Centres
- 1.5 By Customer Type
- 1.5.1 Corporate Radiology Groups
- 1.5.2 Public Health Networks
- 1.5.3 Private Hospital Groups
- 1.5.4 Independent Clinical Practices
Chapter 2 Introduction
- 2.1 Report Objectives and Scope
- 2.2 Product Definition and Industry Terminology
- 2.3 Market Inclusions and Exclusions
- 2.4 Research Process
- 2.4.1 Primary Research and Expert Interviews
- 2.4.2 Secondary Research and Source Review
- 2.4.3 Top-Down and Bottom-Up Estimation
- 2.4.4 Data Triangulation and Verification
- 2.5 Market Size Measurement Basis
- 2.5.1 2025: USD 6.5 million → 2035: USD 22.5 million
- 2.6 Historical and Forecast Reference Periods
- 2.6.1 Historical Period: 2018-2025
- 2.6.2 Base Year: 2025
- 2.6.3 Forecast Period: 2025-2035
- 2.7 Research Assumptions and Limitations
Chapter 3 Executive Summary
- 3.1 Market Snapshot and Key Findings
- 3.2 Base-Year Market Size, 2025
- 3.3 Forecast Market Size, 2035
- 3.4 Revenue and Volume Growth Outlook
- 3.5 Key Demand and Supply Indicators
- 3.6 Leading Market Segments
- 3.7 Fastest-Growing Market Opportunities
- 3.8 Regional Performance Highlights
- 3.9 Technology and Industry Transformation
- 3.10 Competitive Landscape Summary
- 3.11 Analyst View and Strategic Implications
Chapter 4 Australia Dual-Energy X-Ray Absorptiometry Market Trends and Developments
- 4.1 Historical Industry Development, 2018-2025
- 4.2 Recent Market Trends and Developments
- 4.3 Demand and Customer Behavior Trends
- 4.4 Technology and Product Innovation
- 4.5 Artificial Intelligence, Automation and Digitalization
- 4.6 Local Manufacturing and Supply Chain Realignment
- 4.7 Industry Partnerships, Mergers and Acquisitions
- 4.8 Sustainability and Circular Economy Developments
- 4.9 Government and Private Sector Investment Trends
- 4.10 Emerging Business Models and Commercialization
- 4.11 Industry Developments and Announcements
Chapter 5 Australia Dual-Energy X-Ray Absorptiometry Market Production, Supply and Demand Analysis
- 5.1 Demand Trend and Consumption Analysis, 2018-2025
- 5.2 Demand Forecast, 2025-2035
- 5.3 Production and Output Trend, 2018-2025
- 5.4 Production and Output Forecast, 2025-2035
- 5.5 Installed Capacity and Capacity Utilization
- 5.6 Company-Wise Production Plants and Statistics
- 5.6.1 Installed Production Capacity
- 5.6.2 Actual Production
- 5.6.3 Planned Capacity and Expansion Targets
- 5.7 Supply Chain Structure and Procurement Trends
- 5.8 Supply-Demand Gap and Bottlenecks
- 5.9 Import Dependence and Sourcing Structure
- 5.10 Contract Manufacturing and Outsourcing
- 5.11 Regional Supply and Demand Concentration
Chapter 6 Australia Dual-Energy X-Ray Absorptiometry Market Pricing Analysis
- 6.1 Pricing Structure and Measurement
- 6.2 Historical Pricing Trends, 2018-2025
- 6.3 Pricing Outlook, 2025-2035
- 6.4 Average Selling Price and Unit Economics
- 6.5 Pricing by Product and Market Segment
- 6.6 Geographic Pricing Differences
- 6.7 Key Input, Energy, Labor and Logistics Costs
- 6.8 Contract Pricing and Purchasing Models
- 6.9 Pricing Sensitivity and Competitive Positioning
- 6.10 Price, Margin and Profitability Implications
Chapter 7 Australia Dual-Energy X-Ray Absorptiometry Market Dynamics
- 7.1 Market Growth Drivers
- 7.1.1 Demand-Side Drivers
- 7.1.2 Technology and Innovation Drivers
- 7.1.3 Infrastructure and Investment Drivers
- 7.1.4 Regulatory and Policy Drivers
- 7.2 Market Restraints
- 7.2.1 Cost and Affordability Constraints
- 7.2.2 Technology and Adoption Barriers
- 7.2.3 Supply Chain and Operational Constraints
- 7.3 Market Challenges
- 7.3.1 Competitive Pressure and Margin Erosion
- 7.3.2 Skills, Infrastructure and Implementation Gaps
- 7.4 Emerging Market Opportunities
- 7.5 Market Dynamics Impact and Time-Horizon Assessment
Chapter 8 Australia Dual-Energy X-Ray Absorptiometry Value Chain Analysis
- 8.1 Industry Value Chain Overview
- 8.2 Upstream Suppliers and Critical Inputs
- 8.3 Technology and Component Providers
- 8.4 Manufacturing or Service Delivery
- 8.5 Distribution, Channel Partners and Integrators
- 8.6 Downstream Applications and End Users
- 8.7 Value Addition and Profit Pools
- 8.8 Vertical Integration and Outsourcing
- 8.9 Supplier Concentration and Risk
- 8.10 Supply Chain Localization and Resilience
Chapter 9 Australia Dual-Energy X-Ray Absorptiometry Market Regulations and Policies
- 9.1 Relevant Laws, Standards and Compliance Frameworks
- 9.2 Product, Service, Safety and Quality Requirements
- 9.3 Government Policies, Incentives and Subsidies
- 9.4 Imports, Exports and Trade Barriers
- 9.5 Public Procurement and Local Content Requirements
- 9.6 Environmental and Sustainability Compliance
- 9.7 Upcoming Policy Changes and Market Implications
Chapter 10 Australia Dual-Energy X-Ray Absorptiometry Market Hotspots and Opportunities
- 10.1 Market Opportunity Mapping and Growth Hotspots
- 10.2 High-Growth Applications and Customer Groups
- 10.3 Underserved Markets and White-Space Opportunities
- 10.4 Emerging Technology and Product Opportunities
- 10.5 New Capacity and Investment Hotspots
- 10.6 Market Entry and Expansion Opportunities
- 10.7 Distribution and Partnership Opportunities
- 10.8 Near-Term and Long-Term Commercial Potential
- 10.9 Opportunity Attractiveness and Execution Risks
Chapter 11 Australia Dual-Energy X-Ray Absorptiometry Market Outlook, 2025-2035
- 11.1 Market Size and Analysis
- 11.1.1 Revenue (Market Measurement: 2025: USD 6.5 million → 2035: USD 22.5 million)
- 11.1.2 Market Volume and Quantity Sold
- 11.1.3 Historical Market Size, 2018-2025
- 11.1.4 Base-Year Market Size, 2025
- 11.2 Market Forecast, 2025-2035
- 11.2.1 Revenue Forecast to 2035
- 11.2.2 Volume Forecast to 2035
- 11.2.3 CAGR and Year-on-Year Growth
- 11.2.4 Incremental Revenue Opportunity
- 11.3 Forecast Assumptions and Scenario Analysis
- 11.3.1 Base-Case Forecast
- 11.3.2 Optimistic and Conservative Scenarios
- 11.3.3 Technology, Pricing and Policy Sensitivities
- 11.4 Market Attractiveness and Growth Outlook
Chapter 12 Australia Dual-Energy X-Ray Absorptiometry Market Segmentation and Outlook
- 12.1 Segmentation Summary and Market Shares, 2025
- 12.2 Largest and Fastest-Growing Segments
- 12.3 By Product Type - Market Size and Forecast, 2025-2035
- 12.3.1 Segment Definition and Scope
- 12.3.2 Historical Market Size, 2018-2025
- 12.3.3 Revenue Forecast, 2025-2035
- 12.3.4 Volume Forecast, 2025-2035
- 12.3.5 Base-Year Market Share, 2025
- 12.3.6 Segment CAGR and Growth Drivers
- 12.3.7 Subsegment Market Size and Forecast
- 12.3.7.1 Central DXA Systems
- 12.3.7.2 Peripheral DXA Systems
- 12.3.7.3 Software Modules
- 12.3.7.4 Maintenance Services
- 12.3.8 Subsegment Pricing and Adoption Trends
- 12.3.9 Leading Suppliers and Competition
- 12.3.10 Regional Demand and Opportunities
- 12.4 By Application - Market Size and Forecast, 2025-2035
- 12.4.1 Segment Definition and Scope
- 12.4.2 Historical Market Size, 2018-2025
- 12.4.3 Revenue Forecast, 2025-2035
- 12.4.4 Volume Forecast, 2025-2035
- 12.4.5 Base-Year Market Share, 2025
- 12.4.6 Segment CAGR and Growth Drivers
- 12.4.7 Subsegment Market Size and Forecast
- 12.4.7.1 Osteoporosis Assessment
- 12.4.7.2 Secondary Bone-Loss Monitoring
- 12.4.7.3 Body-Composition Assessment
- 12.4.7.4 Clinical Research
- 12.4.8 Subsegment Pricing and Adoption Trends
- 12.4.9 Leading Suppliers and Competition
- 12.4.10 Regional Demand and Opportunities
- 12.5 By Care Setting - Market Size and Forecast, 2025-2035
- 12.5.1 Segment Definition and Scope
- 12.5.2 Historical Market Size, 2018-2025
- 12.5.3 Revenue Forecast, 2025-2035
- 12.5.4 Volume Forecast, 2025-2035
- 12.5.5 Base-Year Market Share, 2025
- 12.5.6 Segment CAGR and Growth Drivers
- 12.5.7 Subsegment Market Size and Forecast
- 12.5.7.1 Outpatient Imaging Centres
- 12.5.7.2 Hospital Imaging Departments
- 12.5.7.3 Specialist Medical Clinics
- 12.5.7.4 Dedicated Body-Composition Centres
- 12.5.8 Subsegment Pricing and Adoption Trends
- 12.5.9 Leading Suppliers and Competition
- 12.5.10 Regional Demand and Opportunities
- 12.6 By Customer Type - Market Size and Forecast, 2025-2035
- 12.6.1 Segment Definition and Scope
- 12.6.2 Historical Market Size, 2018-2025
- 12.6.3 Revenue Forecast, 2025-2035
- 12.6.4 Volume Forecast, 2025-2035
- 12.6.5 Base-Year Market Share, 2025
- 12.6.6 Segment CAGR and Growth Drivers
- 12.6.7 Subsegment Market Size and Forecast
- 12.6.7.1 Corporate Radiology Groups
- 12.6.7.2 Public Health Networks
- 12.6.7.3 Private Hospital Groups
- 12.6.7.4 Independent Clinical Practices
- 12.6.8 Subsegment Pricing and Adoption Trends
- 12.6.9 Leading Suppliers and Competition
- 12.6.10 Regional Demand and Opportunities
- 12.7 Segment Growth Comparison
- 12.8 Segment Attractiveness and Priority Matrix
Chapter 13 Australia Dual-Energy X-Ray Absorptiometry End-Use and Application Market Outlook
- 13.1 End-Use Industry and Customer Demand Structure
- 13.2 Leading Applications and Customer Groups
- 13.3 End-Use Market Size, Share and Forecast
- 13.4 Major End-Use Industry Deep Dives
- 13.4.1 Customer Requirements and Use Cases
- 13.4.2 Demand and Replacement Cycles
- 13.4.3 Technical and Regulatory Considerations
- 13.4.4 Purchasing and Procurement Models
- 13.4.5 Leading Vendors and Distribution Channels
- 13.4.6 Forecast and Commercial Opportunities
- 13.5 Emerging Applications and Cross-Segment Demand
- 13.6 End-Use Industry Investment Priorities
Chapter 14 Australia Dual-Energy X-Ray Absorptiometry Geographic Market Outlook, 2025-2035
- 14.1 Domestic Market Distribution and Demand Clusters
- 14.2 State- or Province-Wise Market Size and Forecast, 2025-2035
- 14.3 City and Metropolitan Market Outlook
- 14.4 Industrial, Manufacturing and Commercial Clusters
- 14.5 Geographic Concentration of Key End Users
- 14.6 Local Pricing and Purchasing Differences
- 14.7 Domestic Production Facilities and Capacity Map
- 14.8 Local Infrastructure and Project Pipeline
- 14.9 State-Level Policy and Incentive Differences
- 14.10 Subnational Investment Hotspots and Opportunities
- 14.11 Distribution and Logistics Networks
- 14.12 Domestic Competitive Footprint
Chapter 15 Australia Dual-Energy X-Ray Absorptiometry Technology, Innovation and Sustainability Outlook
- 15.1 Technology Landscape and Maturity
- 15.2 Product, Process and Service Innovation
- 15.3 AI, Automation and Digital Tools in the Industry
- 15.4 Technology Adoption and Performance Benchmarking
- 15.5 Innovation Pipeline and R&D Investment
- 15.6 Patent and Intellectual Property Trends
- 15.7 Energy Efficiency and Resource Management
- 15.8 Sustainability, Recycling and Circularity
- 15.9 Technology Roadmap, 2025-2035
- 15.10 Risks of Obsolescence and Technology Substitution
Chapter 16 Australia Dual-Energy X-Ray Absorptiometry Market Key Strategic Imperatives
- 16.1 Growth and Market Entry Priorities
- 16.2 High-Return Products and Segments
- 16.3 Pricing, Profitability and Cost Optimization
- 16.4 Technology Investment and Product Differentiation
- 16.5 Supply Chain Localization and Resilience
- 16.6 Distribution and Customer Acquisition
- 16.7 Partnership, Acquisition and Capacity Strategy
- 16.8 Regional Expansion Priorities
- 16.9 Short-, Medium- and Long-Term Actions
Chapter 17 Competition Outlook
- 17.1 Industry Competition Characteristics
- 17.2 Market Structure and Concentration
- 17.3 Market Share and Competitive Positioning, 2025
- 17.4 Company-Wise Revenue and Product Benchmarking
- 17.5 Production and Service Capacity Benchmarking
- 17.6 Technology, Pricing and Differentiation
- 17.7 Regional Footprint and Distribution Strength
- 17.8 Mergers, Acquisitions and Strategic Alliances
- 17.9 New Entrants and Competitive Threats
- 17.10 Porter's Five Forces and Industry Attractiveness
- 17.11 Competitive Outlook, 2025-2035
Chapter 18 Company Profiles
- 18.1 Company Coverage and Selection Criteria
- 18.2 Hologic
- 18.2.1 Business Description
- 18.2.2 Company Ownership and Geographic Presence
- 18.2.3 Product and Service Portfolio
- 18.2.4 Manufacturing and Operating Footprint
- 18.2.5 Production Capacity and Expansion Plans
- 18.2.6 Financial Performance and Investment
- 18.2.7 Market Share and Competitive Position
- 18.2.8 Technology and Innovation Capabilities
- 18.2.9 Strategic Alliances or Partnerships
- 18.2.10 Recent Developments
- 18.2.11 Growth Strategy and Outlook
- 18.3 GE HealthCare
- 18.4 OsteoSys
- 18.5 I-MED Radiology
- 18.6 Integral Diagnostics
- 18.7 Lumus Imaging
- 18.8 Qscan
- 18.9 PRP Diagnostic Imaging
- 18.10 Vision Radiology
- 18.11 Body DEXA Fit
- 18.12 Other Relevant Market Participants
Note: Every listed company is profiled on the structure shown under the first company. The company list is preliminary and may change based on research findings, market developments, data availability and client requirements.
Chapter 19 Disclaimer
- 19.1 Research and Forecast Disclaimer
- 19.2 Data Source and Estimation Limitations
Note: The depth of individual sections depends on data availability for this market. Volume, capacity, trade and other unit-based metrics are included where applicable.

