
Industrial Algae Market Analysis
The industrial algae market includes several applications of algae. Today, algae are used as a cleaner alternative and an essential ingredient for food, cosmetics, fuel, transport, pharmaceuticals, and textile. As a result, the industrial algae market is expanding at a flourishing rate. Covid and the overall increase in health and environmental awareness are helping the global market for industrial algae reach new heights each passing second. The Global Industrial Algae market is expected to witness a CAGR of 9.03% during the forecast period. The revenue generated by the global Industrial Algae market in 2020 was over USD 5,125 million and is expected to generate revenue worth USD 10,333 million in 2027. Therefore, the incremental growth opportunity offered by the global Industrial Algae is estimated to be USD 58,311 million between 2021 and 2027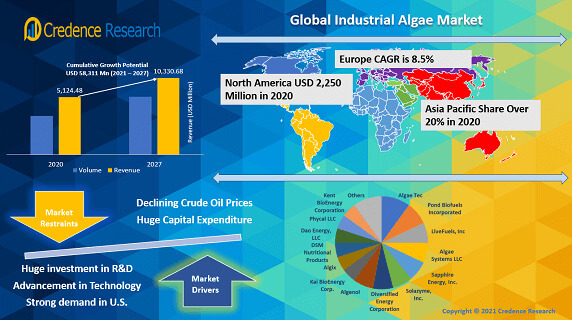
Interesting Facts about Industrial Algae Industry
- There are 40,000 plus varieties of algae found around the world
- Algae found mainly in marine and freshwater ENVIRONMENT
- Algae is capable of removing the huge amount of carbon dioxide
- Industrial algae are widely used in the preparation of food ingredients
- Industrial algae production cost is around USD 1,000 to USD 1,250
Recent Trends and Role of Covid’19
The industrial algae sector has been experiencing a steady increase over the years. Recently, it has been one of the few international markets that saw a favorable trend even amidst the uprise of Covid’19. Today, the global market for industrial algae is worth more than USD 10.3 billion and is expected to reach around $6.5 billion by 2026. The pandemic has caused heavy reliance on healthy alternatives. People prefer spending a bit more on commodities that don’t harm their well-being. The shift in the behavioral trend is encouraging manufacturers to shift towards using healthier substitutes to promote medical assurance. The increased demand for nutritious and eco-friendly commodities ensures the high potential for the future of industrial algae. As supply continues to rise, the industrial algae sector will experience a higher than forecasted growth in the years to come.Increasing attention on weight-consciousness and skincare
The industrial algae sector has been thriving for quite a few years. The first driver is the increasing attention on weight consciousness and skincare. Algae are essential highlights of dietary supplements and anti-aging and glowing skincare products. That’s why it’s no surprise that as the significance of the skincare routine continues to rise, so does the development of the industrial algae sector.Environmental protection
Moreover, environmental protection is one of the most trending concepts nowadays. Because of this, cost-efficient and green-friendly substitutes are being preferred more by the consumer side. The worldwide industrial algae market continues to rise in fame due to algae’s bio-hydrogen and biodiesel attributes. Algae-based products are effective not just for human food but for livestock and land-based crops. Marine Sector, Aviation Sector, Road Transport, DHA Production (Protein Sales), DHA Production (Pharmaceutical Applications), Bioplastics, and Others are some of the beneficiaries of industrial algae. The demand for industrial algae is mainly driven by the growing use of algae in the aforementioned industries.Technological advancements
Open Pond Cultivation Technology, Raceway Pond Cultivation Technology, Closed Photo Bioreactor Cultivation Technology, and Closed Fermenter Systems Cultivation Technology are the most essential and prominent cultivation technologies used by the manufacturers. Technological advancements are leading to better and more extensive research and development procedures. As a result, they are helping to offer cheaper and easier algae extraction and production methods. Because of that, the interest of manufacturers in using algae for their production continues to grow even more. Furthermore, demand for industrial algae continues to peak in the pharmaceutical industry. Algae are known for their antibacterial, antifungal, and therapeutic features. That’s why medical companies and research firms have started using industrial algae for manufacturing health supplements to reduce diseases and promote fitness.High Cost of Technology
Even though more algae extraction procedures continue to develop, the cost of buying and using such advanced equipment is still relatively high. And that’s the primary restraint smaller manufacturers or less-developed economies face today. So, although industrial algae are cheaper than their substitutes, their extraction is undoubtedly a costly milestone to overcome. Some of the major players who have incurred colossal R&D investment include but are not limited to Algenol, Sapphire Energy, Inc., Solazyme, Inc., Diversified Energy Corporation, DSM Nutritional Products, Dao Energy, Kai BioEnergy Corp., Algix, Algae Tec, Pond Biofuels Incorporated, LiveFuels, Inc, Algae Systems LLC, LLC, Phycal LLC, and Kent BioEnergy Corporation.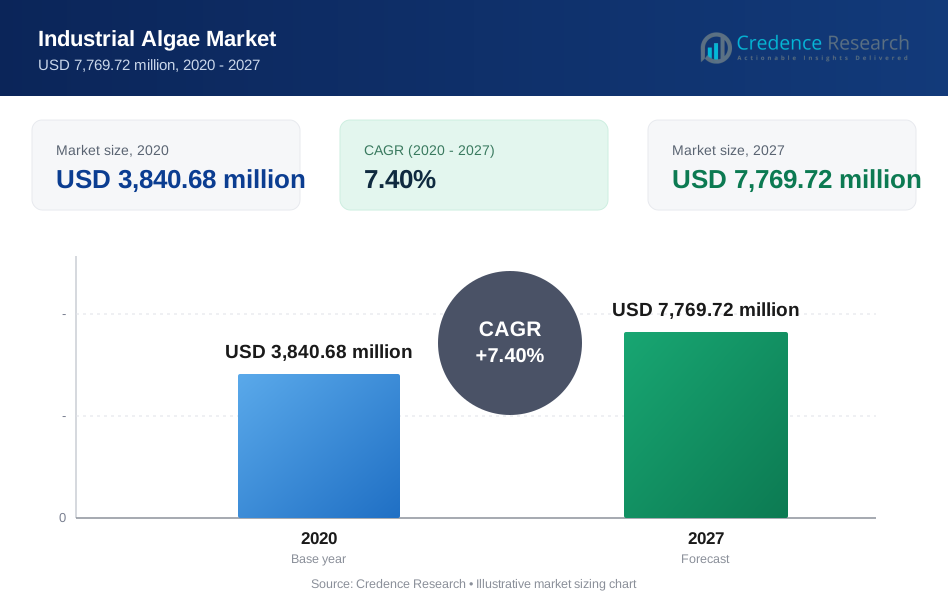
Request a Free Sample
Fill in your details and we'll send you a free sample report.
- Sample data tables & charts
- Research methodology
Need a Custom Version of This Report?
Tailor the scope, geography, or segments to your exact requirements.
- Custom geography or segment scope
- Direct access to our analyst team
Frequently Asked Questions
How COVID 19 Impacted Industrial Algae Market?
Which is the leading regional market for Industrial Algae?
What is the major growth driving factors for global Industrial Algae market?
Which is major segment in Industrial Algae market by technology?
Which is major segment in Industrial Algae market by application?
Table of Content
Chapter 1. Report Introduction
- 1.1 Report Description & Purpose
- 1.1.1 Report Title & Market Definition
- 1.1.2 Unique Selling Propositions (USP) & Key Differentiators
- 1.1.3 Value Proposition for Stakeholders
- 1.2 Research Objectives
- 1.2.1 Market Sizing Objectives (Volume & Revenue) (Volume Where Applicable)
- 1.2.2 Segmentation Objectives
- 1.2.3 Competitive Intelligence Objectives
- 1.2.4 Forecast & Scenario Objectives
- 1.3 Report Scope
- 1.3.1 Industrial Algae Scope – Segments & Subsegments Covered
- 1.3.2 Geographic Scope – Regions & Countries Covered
- 1.3.3 Historical Period, Base Year & Forecast Period (2020; forecast to 2027)
- 1.3.4 Inclusions & Exclusions
- 1.4 Industry Classification & Applicable Codes
- 1.5 Currency, Measurement Units & Valuation Basis
- 1.6 Target Stakeholders
- 1.7 Limitations & Assumptions
Chapter 2. Executive Summary
- 2.1 Global Industrial Algae Market Snapshot
- 2.1.1 Market Size – Historical (2020) & Forecast (2020-2027) (2020: USD 3,840.68 million → 2027: USD 7,769.72 million)
- 2.1.2 Volume & Revenue – Global Totals (Volume Where Applicable)
- 2.1.3 Key Market Highlights – Top Five Facts
- 2.2 Industrial Algae Market Segmentation Snapshot
- 2.2.1 Market Split by Region – 2020 vs. 2027
- 2.3 Competitive Snapshot
- 2.3.1 Top 10 Players by Revenue Share – 2020
- 2.3.2 Top 10 Players by Volume Share – 2020 (Volume Where Applicable)
- 2.3.3 Recent Strategic Developments (18-Month Summary)
- 2.4 Key Investment Highlights & Strategic Conclusions
Chapter 3. Industrial Algae Market Dynamics & Industry Analysis
- 3.1 Market Overview & Context
- 3.1.1 Industrial Algae Market Position in the Broader Industry Value Chain
- 3.1.2 Demand Structure & Purchasing Dynamics
- 3.1.3 Market Maturity & Development Stage by Region
- 3.2 Industrial Algae Market Drivers
- 3.3 Industrial Algae Market Restraints & Challenges
- 3.4 Industrial Algae Market Opportunities
- 3.5 Porter's Five Forces Analysis
- 3.5.1 Threat of New Entrants
- 3.5.2 Bargaining Power of Suppliers
- 3.5.3 Bargaining Power of Buyers
- 3.5.4 Threat of Substitutes
- 3.5.5 Competitive Rivalry – Intensity Assessment
- 3.6 Industrial Algae Value Chain Analysis
- 3.6.1 Upstream – Key Inputs, Resources & Suppliers
- 3.6.1.1 Key Input/Resource 1
- 3.6.1.2 Key Input/Resource 2
- 3.6.1.3 Key Input/Resource 3
- 3.6.2 Midstream – Core Operations & Value Creation
- 3.6.2.1 Operating Model & Process Overview
- 3.6.2.2 Key Operating Locations & Capabilities by Company
- 3.6.3 Downstream – Market Channels & End Users
- 3.6.3.1 Direct Sales & Customer Engagement Channels
- 3.6.3.2 Indirect Sales, Intermediaries & Partner Channels
- 3.6.4 Value Chain Profitability Analysis
- 3.6.1 Upstream – Key Inputs, Resources & Suppliers
- 3.7 PESTEL Analysis
- 3.7.1 Political Factors
- 3.7.2 Economic Factors
- 3.7.3 Social Factors
- 3.7.4 Technological Factors
- 3.7.5 Environmental Factors
- 3.7.6 Legal Factors
- 3.8 Industrial Algae Supply Chain Analysis
- 3.8.1 Critical Input & Resource Availability Risk Assessment
- 3.8.2 Supplier & Operational Concentration Risk (Geographic Exposure)
- 3.8.3 Supply & Service Disruption Impact Analysis
- 3.9 Regulatory & Policy Landscape
Note: The regulatory and policy landscape section covers regulations based on their applicability to the market, Industrial Algae category, geography, and scope of the study. Only regulatory frameworks with a material impact on operations, compliance, trade, sustainability, or market access are analyzed in detail.
Chapter 4. Key Investment Pockets & Opportunity Analysis
- 4.1 Industrial Algae Market Attractiveness Analysis
- 4.1.1 By Region – Investment Attractiveness Matrix (Market Size × CAGR)
- 4.2 Absolute Revenue Growth Opportunity
- 4.2.1 By Region – Absolute Revenue Growth Through 2027
- 4.3 Incremental Demand Opportunity
- 4.3.1 By Region – Incremental Demand Through 2027
- 4.3.2 Segment – Incremental Demand
- 4.4 Emerging Submarket Opportunity Deep Dive (Subject to Applicability)
- 4.5 Priority Market Opportunity Scorecards
- 4.5.1 United States
- 4.5.2 Europe
- 4.5.3 Asia
- 4.5.4 Middle East & Africa
Note: Priority market opportunity scorecards reflect the geographic scope and strategic relevance of the study. Listed markets are indicative and may be adapted to the industry.
Chapter 5. Industrial Algae Cross-Border Trade & Market Access Analysis
- 5.1 International Trade & Cross-Border Activity Overview
- 5.1.1 Global Export Value by Country (2020)
- 5.1.2 Global Export Volume by Country (2020) (Volume Where Applicable)
- 5.1.3 Global Import Value by Country (2020)
- 5.1.4 Global Import Volume by Country (2020) (Volume Where Applicable)
- 5.1.5 Net Trade Balance by Country (2020)
- 5.2 Export Analysis – Segment
- 5.2.1 Category 1 (Applicable Classification Code)
- 5.2.2 Category 2 (Applicable Classification Code)
- 5.2.3 Category 3 (Applicable Classification Code)
- 5.2.4 Category 4 (Applicable Classification Code)
- 5.2.5 Category 5 (Applicable Classification Code)
- 5.3 Import Analysis – Segment
- 5.3.1 Category 1 (Applicable Classification Code)
- 5.3.2 Category 2 (Applicable Classification Code)
- 5.3.3 Category 3 (Applicable Classification Code)
- 5.3.4 Category 4 (Applicable Classification Code)
- 5.3.5 Category 5 (Applicable Classification Code)
- 5.4 Cross-Border Pricing & Transaction Benchmarks
- 5.4.1 Export Pricing – Segment & Country
- 5.4.2 Import Pricing – Segment & Source Country
- 5.4.3 Price Trends (2020)
- 5.5 Key Cross-Border Trade & Delivery Routes
- 5.5.1 Cross-Border Trade/Delivery Route 1
- 5.5.2 Cross-Border Trade/Delivery Route 2
- 5.5.3 Cross-Border Trade/Delivery Route 3
- 5.5.4 Cross-Border Trade/Delivery Route 4
- 5.5.5 Cross-Border Trade/Delivery Route 5
- 5.6 Trade Policy & Market Access Impact Assessment
- 5.6.1 Tariff & Non-Tariff Barriers
- 5.6.2 Regional Trade & Economic Integration Frameworks
- 5.6.3 Bilateral & Multilateral Trade Agreements
- 5.6.4 Cross-Border Operating, Licensing & Localization Requirements
Note: This chapter applies where cross-border trade or delivery is relevant to Industrial Algae. Goods, services, and digital offerings are assessed using applicable classifications and transaction measures. Import-export volumes, trade balances, and route analyses are included only where meaningful to the market.
Chapter 6. Competitive Landscape & Company Benchmarking
- 6.1 Industrial Algae Market Concentration & Structure
- 6.1.1 Herfindahl-Hirschman Index (HHI) – vs. 2020
- 6.1.2 Leading, Mid-Sized & Emerging Player Structure
- 6.1.3 Global, Regional & Local Player Dynamics
- 6.2 Industrial Algae Market Share Analysis – 2020
- 6.2.1 Global Revenue Share by Company
- 6.2.2 Global Volume Share by Company (Volume Where Applicable)
- 6.2.3 Regional Revenue Share
- 6.2.4 Market Share Evolution ( vs. 2020)
- 6.2.5 Company Market Share by Key Segment
- 6.2.6 Company Market Share by Customer Group
- 6.3 Operating Scale, Capacity & Infrastructure Analysis
- 6.3.1 Global Operating Scale & Supply Capacity
- 6.3.2 Resource Utilization & Operating Efficiency
- 6.3.3 Output, Service Delivery & Activity Metrics
- 6.3.4 Operating Footprint & Infrastructure Map
- 6.3.5 Planned Operational & Capacity Expansion
- 6.4 Industrial Algae Competitive Benchmarking Matrix
- 6.4.1 Revenue, Growth, Profitability & Operating Metric Comparison
- 6.4.2 Channel Revenue Mix
- 6.4.3 Geographic Revenue Exposure
- 6.4.4 R&D Intensity
- 6.4.5 Sustainability Maturity
- 6.5 Strategic Developments in Industrial Algae (Last 24 Months)
- 6.5.1 Mergers, Acquisitions & Divestments
- 6.5.2 New Products, Services & Solutions in Industrial Algae
- 6.5.3 Operational & Infrastructure Expansions
- 6.5.4 Strategic Alliances, Joint Ventures & Partnerships
- 6.5.5 Distribution Expansion & Market Entry
- 6.5.6 Sustainability & ESG Initiatives
- 6.6 Competitive Strategy Mapping
- 6.6.1 Leader, Challenger, Follower & Niche Classification
- 6.6.2 Pricing Strategy Comparison
- 6.6.3 Channel Strategy Matrix
Note: Strategic developments are included based on their materiality and the availability of reliable information.
Chapter 7. Global Industrial Algae Market – By Sales & Delivery Channel
- 7.1 Segment Overview
- 7.1.1 Volume & Revenue Split by Channel (2020 & 2027) (Volume Where Applicable)
- 7.1.2 Channel Mix Evolution (2020-2027)
Chapter 8. Regional Market Analysis – Global Overview
- 8.1 Global Regional Overview
- 8.1.1 Regional Volume Share (Volume Where Applicable)
- 8.1.2 Regional Revenue Share
- 8.1.3 Regional Volume by Region (Volume Where Applicable)
- 8.1.4 Regional Revenue by Region
- 8.1.5 Regional Forecast Through 2027
- 8.2 Cross-Regional Segment Analysis
- 8.2.1 By Sales & Delivery Channel
- 8.2.2 By Competitive Positioning & Price Tier
Chapter 9. North America Industrial Algae Market
- 9.1 United States
- 9.2 Canada
- 9.3 Mexico
Chapter 10. Europe Industrial Algae Market
- 10.1 Germany
- 10.2 France
- 10.3 Italy
- 10.4 United Kingdom
- 10.5 Spain
- 10.6 Poland
- 10.7 Russia
- 10.8 Netherlands
- 10.9 Belgium
- 10.10 Sweden
- 10.11 Denmark
- 10.12 Norway
- 10.13 Rest of Europe
Chapter 11. Asia Pacific Industrial Algae Market
- 11.1 China
- 11.2 India
- 11.3 Japan
- 11.4 South Korea
- 11.5 Thailand
- 11.6 Indonesia
- 11.7 Vietnam
- 11.8 Malaysia
- 11.9 Australia
- 11.10 Rest of Asia Pacific
Chapter 12. Latin America Industrial Algae Market
- 12.1 Brazil
- 12.2 Argentina
- 12.3 Colombia
- 12.4 Chile
- 12.5 Rest of Latin America
Chapter 13. Middle East Industrial Algae Market
- 13.1 Saudi Arabia
- 13.2 United Arab Emirates
- 13.3 Turkey
- 13.4 Israel
- 13.5 Iran
- 13.6 Rest of the Middle East
Chapter 14. Africa Industrial Algae Market
- 14.1 South Africa
- 14.2 Egypt
- 14.3 Nigeria
- 14.4 Morocco
- 14.5 Rest of Africa
Chapter 15. Industrial Algae Company Profiles
- 15.1 [Company 01]
- 15.1.1 Company Overview
- 15.1.2 Key Management Personnel
- 15.1.3 Products & Services Portfolio
- 15.1.4 Financial Performance
- 15.1.5 Key Market Focus & Geographic Presence
- 15.1.6 Recent Developments & Strategic Initiatives
Note: The company profile list is preliminary and may change based on research findings, market developments, data availability, and client requirements.
Chapter 16. Appendices
- Appendix A – List of Abbreviations & Acronyms
- Appendix B – Industry Classification Code Reference – Full Series
- Appendix C – Supply, Output & Operating Capacity Data Tables
- Appendix D – End-Use & Demand Base Tables
- Appendix E – Demand, Adoption & Usage Assumptions
- Appendix F – Pricing & Revenue Metric Reference Tables
- Appendix G – Company Operations & Infrastructure Database
- Appendix H – Cross-Border Trade & Activity Data Tables (Where Applicable)
- Appendix I – Regulatory Summary Tables
- Appendix J – Primary Research Participant List (Anonymized)
- Appendix K – Primary Research Questionnaire Framework
- Appendix L – Data Sources & Bibliography
- Appendix M – Market Size Divergence & Source Comparison
Chapter 17. Research Methodology
- 17.1 Research Framework & Philosophy
- 17.2 Secondary Research – Sources, Hierarchy & Data Extraction
- 17.3 Data Modeling – Bottom-Up & Top-Down Market Sizing
- 17.4 Primary Research – Stakeholder Framework, LOI & Sample Sizes
- 17.5 Forecast Methodology – Regression, Scenario & Sensitivity Analysis
- 17.6 Quality Control – Four-Layer Validation Framework
- 17.7 Limitations & Standard Assumptions
- 17.8 Disclaimer
