
Aging fleet keeps workshops buying bonding products
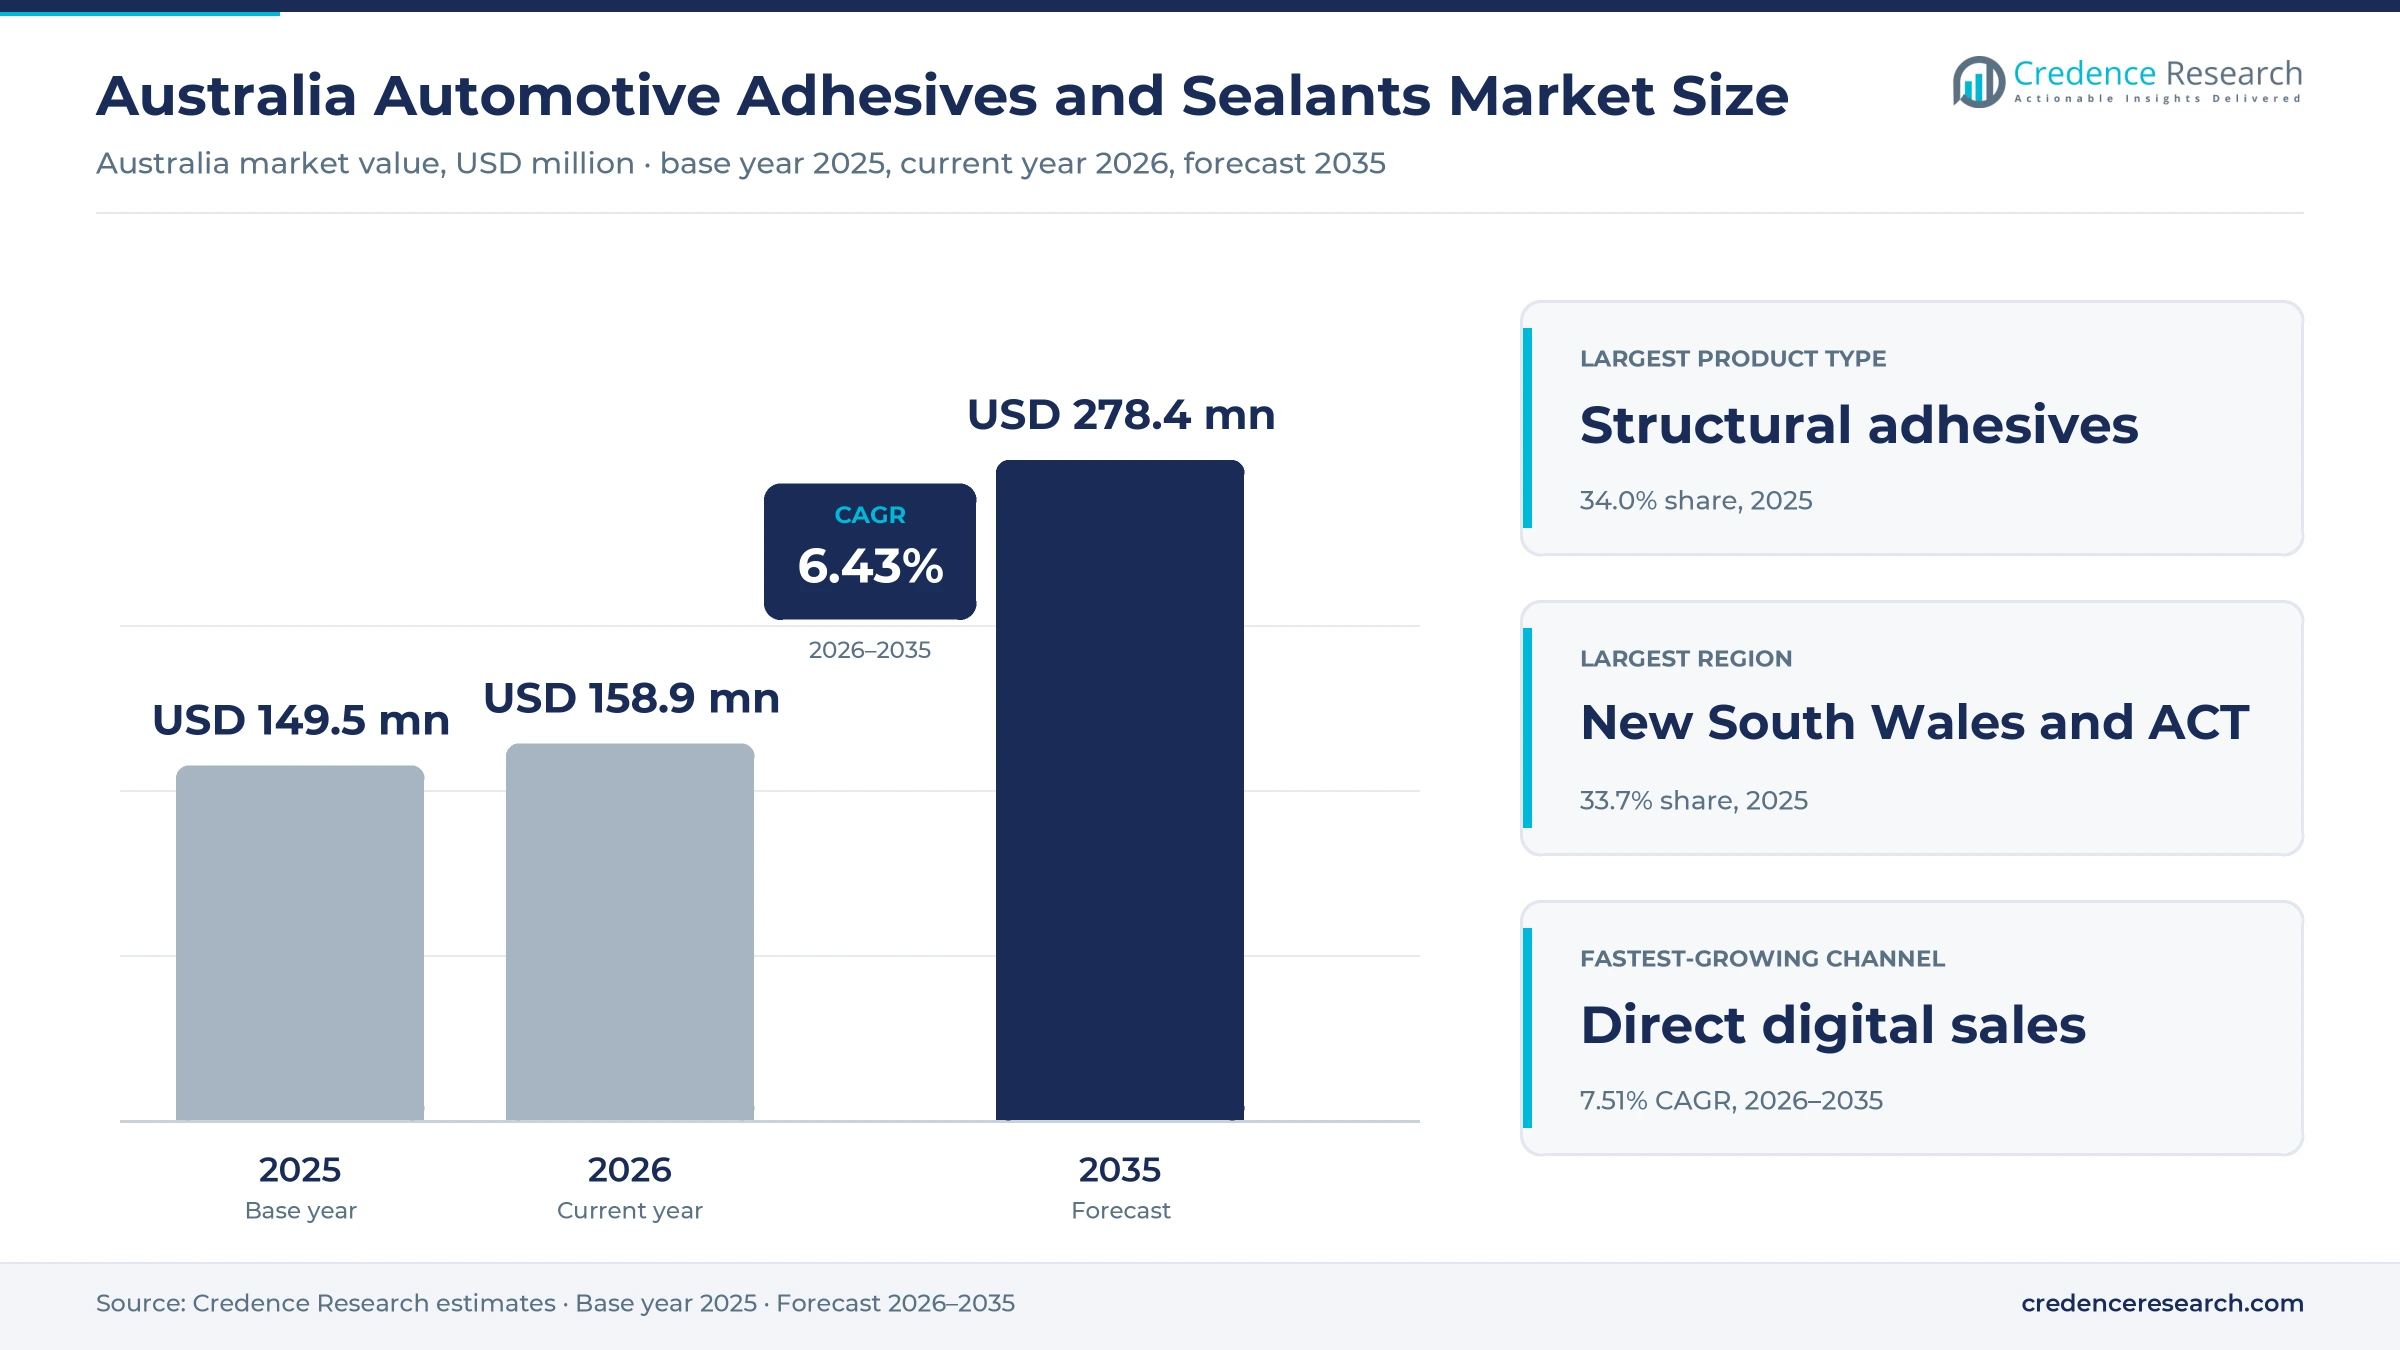
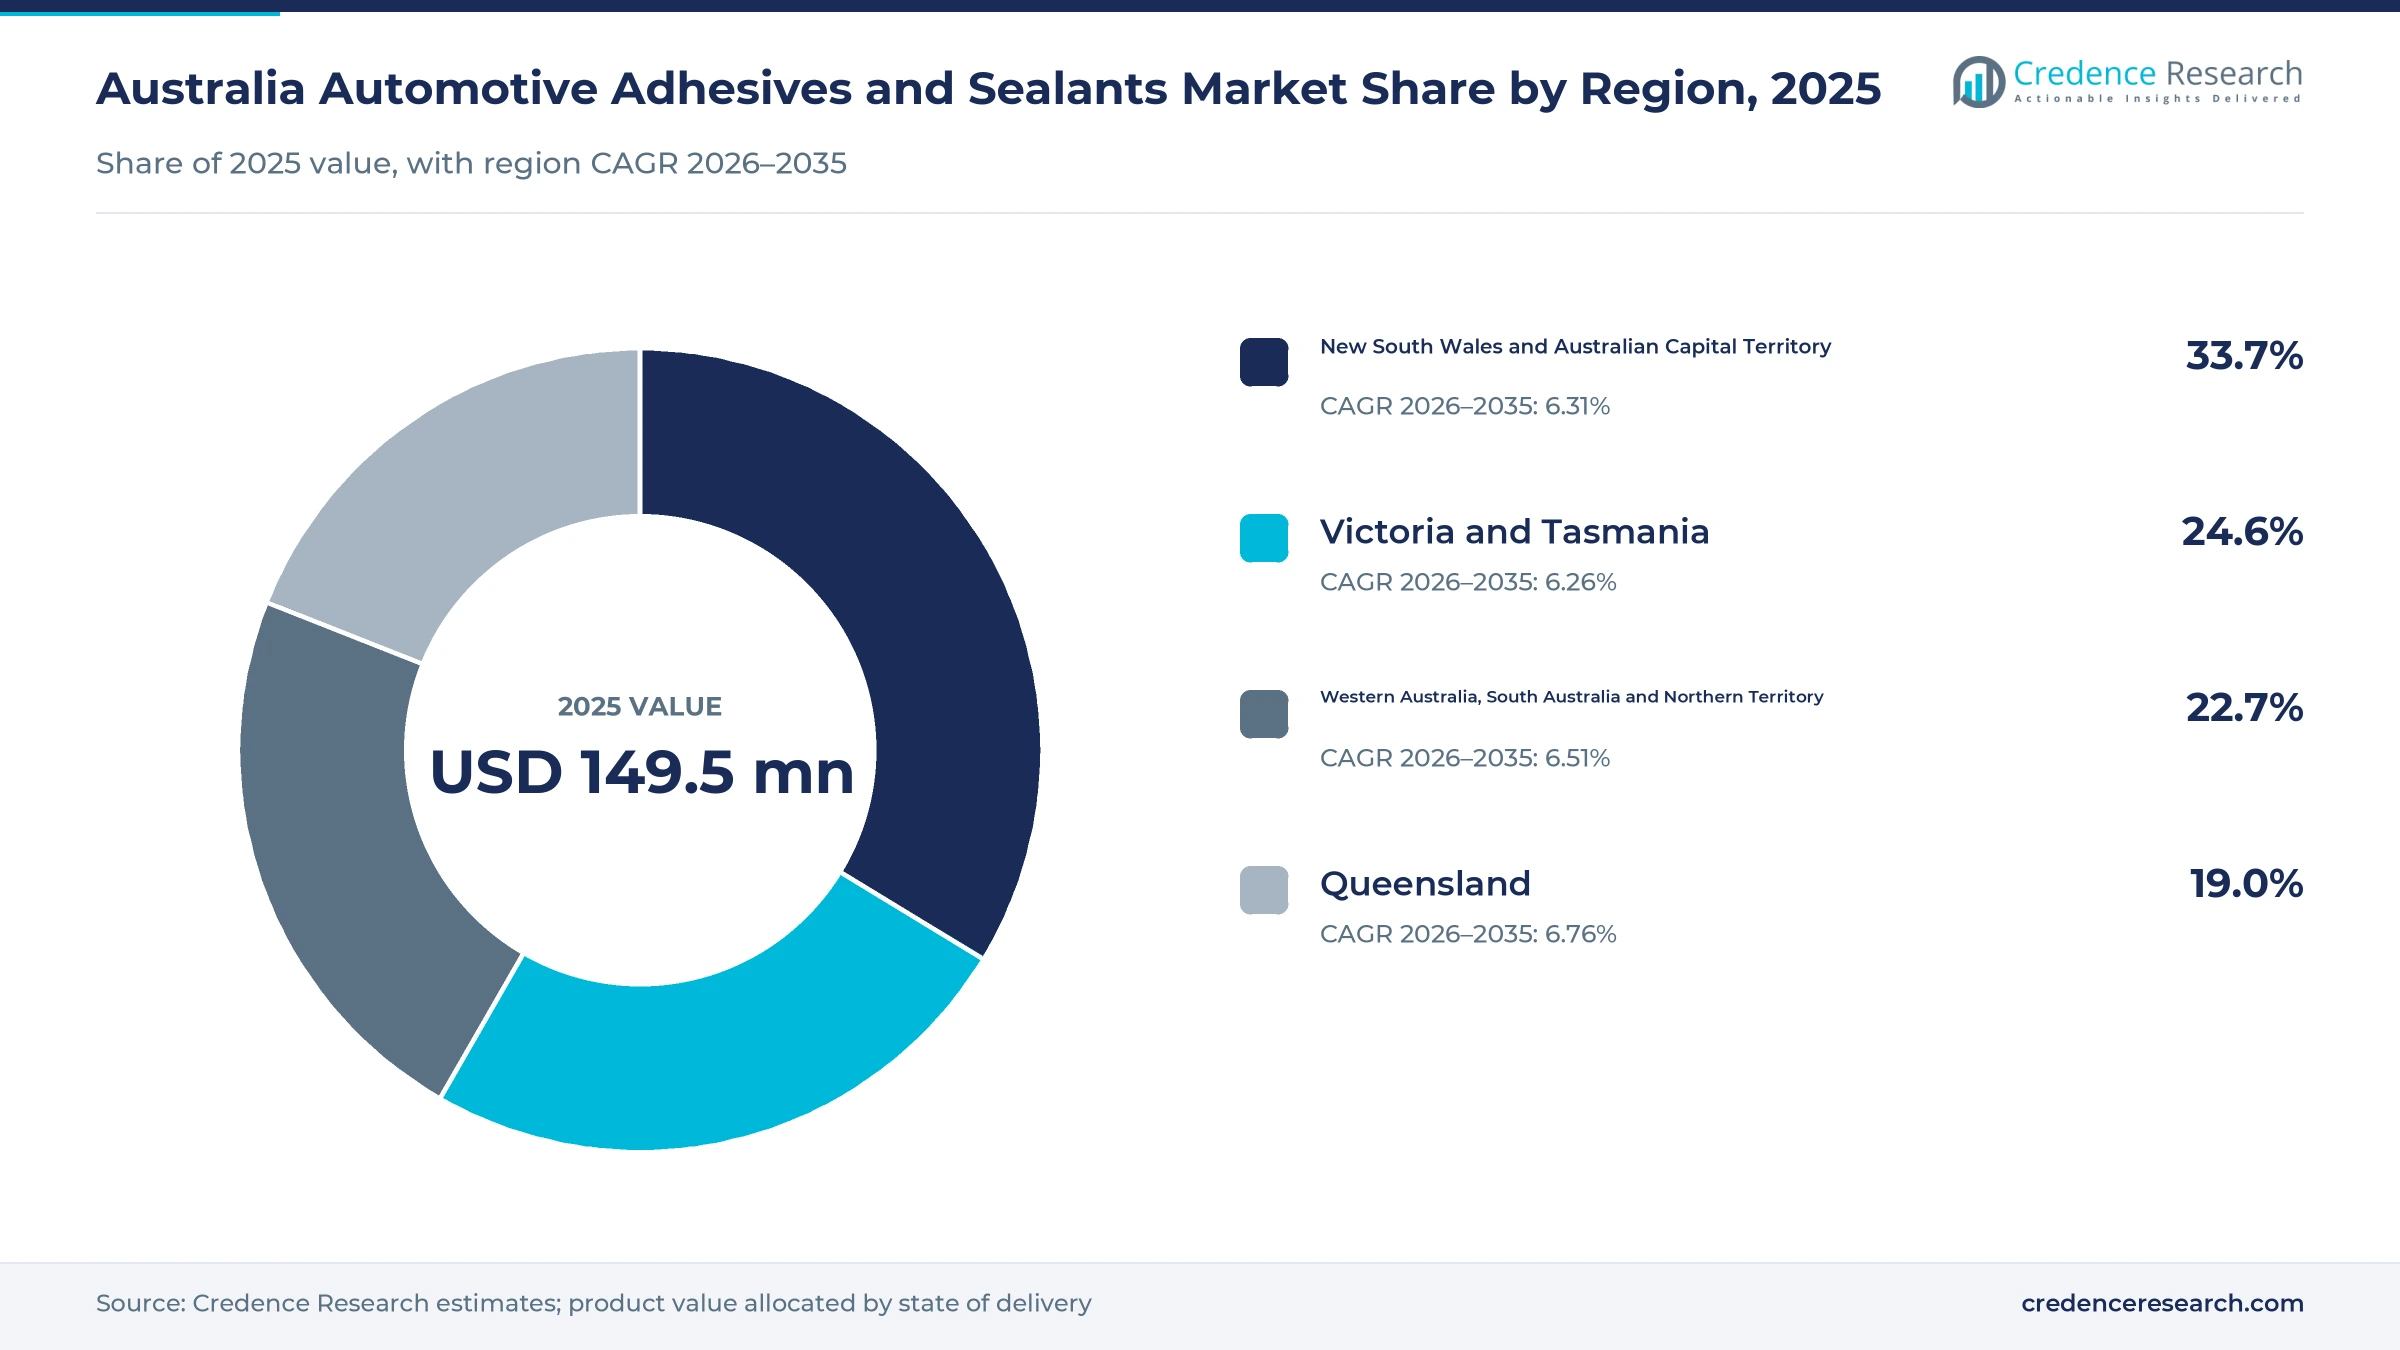
The Australia automotive adhesives and sealants market was valued at USD 149.5 million in 2025 and is projected to increase from USD 158.8 million in 2026 to USD 278.4 million by 2035, registering a CAGR of 6.43% during 2026–2035. Demand comes from collision repairers, mechanical workshops, glass fitters, fleet operators and retail buyers that use structural adhesives, seam sealers, glass urethanes and bonding tapes to repair and maintain vehicles. New South Wales and Australian Capital Territory held the largest regional share, 33.7% in 2025, because Sydney hosts the densest network of repair shops and insurers. Queensland is the fastest-growing region at 6.76% a year, as population growth adds vehicles and repair jobs. Vehicle technology is also changing, because the New Vehicle Efficiency Standard took effect in January 2025 and more hybrids and electric models now enter the fleet. As a result, workshops need more specialty bonding products for lightweight panels, batteries and sensor-equipped glass.
Which bonding products and buyers does the estimate cover?
The estimate measures the value of structural adhesives, sealing compounds, adhesive tapes and films, and specialty assembly adhesives sold in Australia for passenger cars, light commercial vehicles, trucks and buses. Values are stated at manufacturer and distributor selling prices that workshops, glass fitters, fleet operators, retailers and small vehicle assemblers pay.
The estimate excludes paints and primers sold on their own, general construction adhesives and products used in aircraft, boats or rail. The value chain runs from resin and chemical makers, mostly overseas, through local blenders, importers and trade distributors to collision shops, mechanical workshops, glass service networks and parts retailers in every state and territory.
Australia Automotive Adhesives and Sealants Market Insights
- The Australia automotive adhesives and sealants market was valued at USD 149.5 million in 2025 and is projected to reach USD 278.4 million by 2035, registering a CAGR of 6.43% during 2026–2035.
- New South Wales and Australian Capital Territory held a 33.7% share of 2025 value, because Sydney hosts the densest repair and insurer network.
- Structural adhesives led with a 34.0% share of 2025 value, because collision repairers bond panels and parts under carmaker repair procedures.
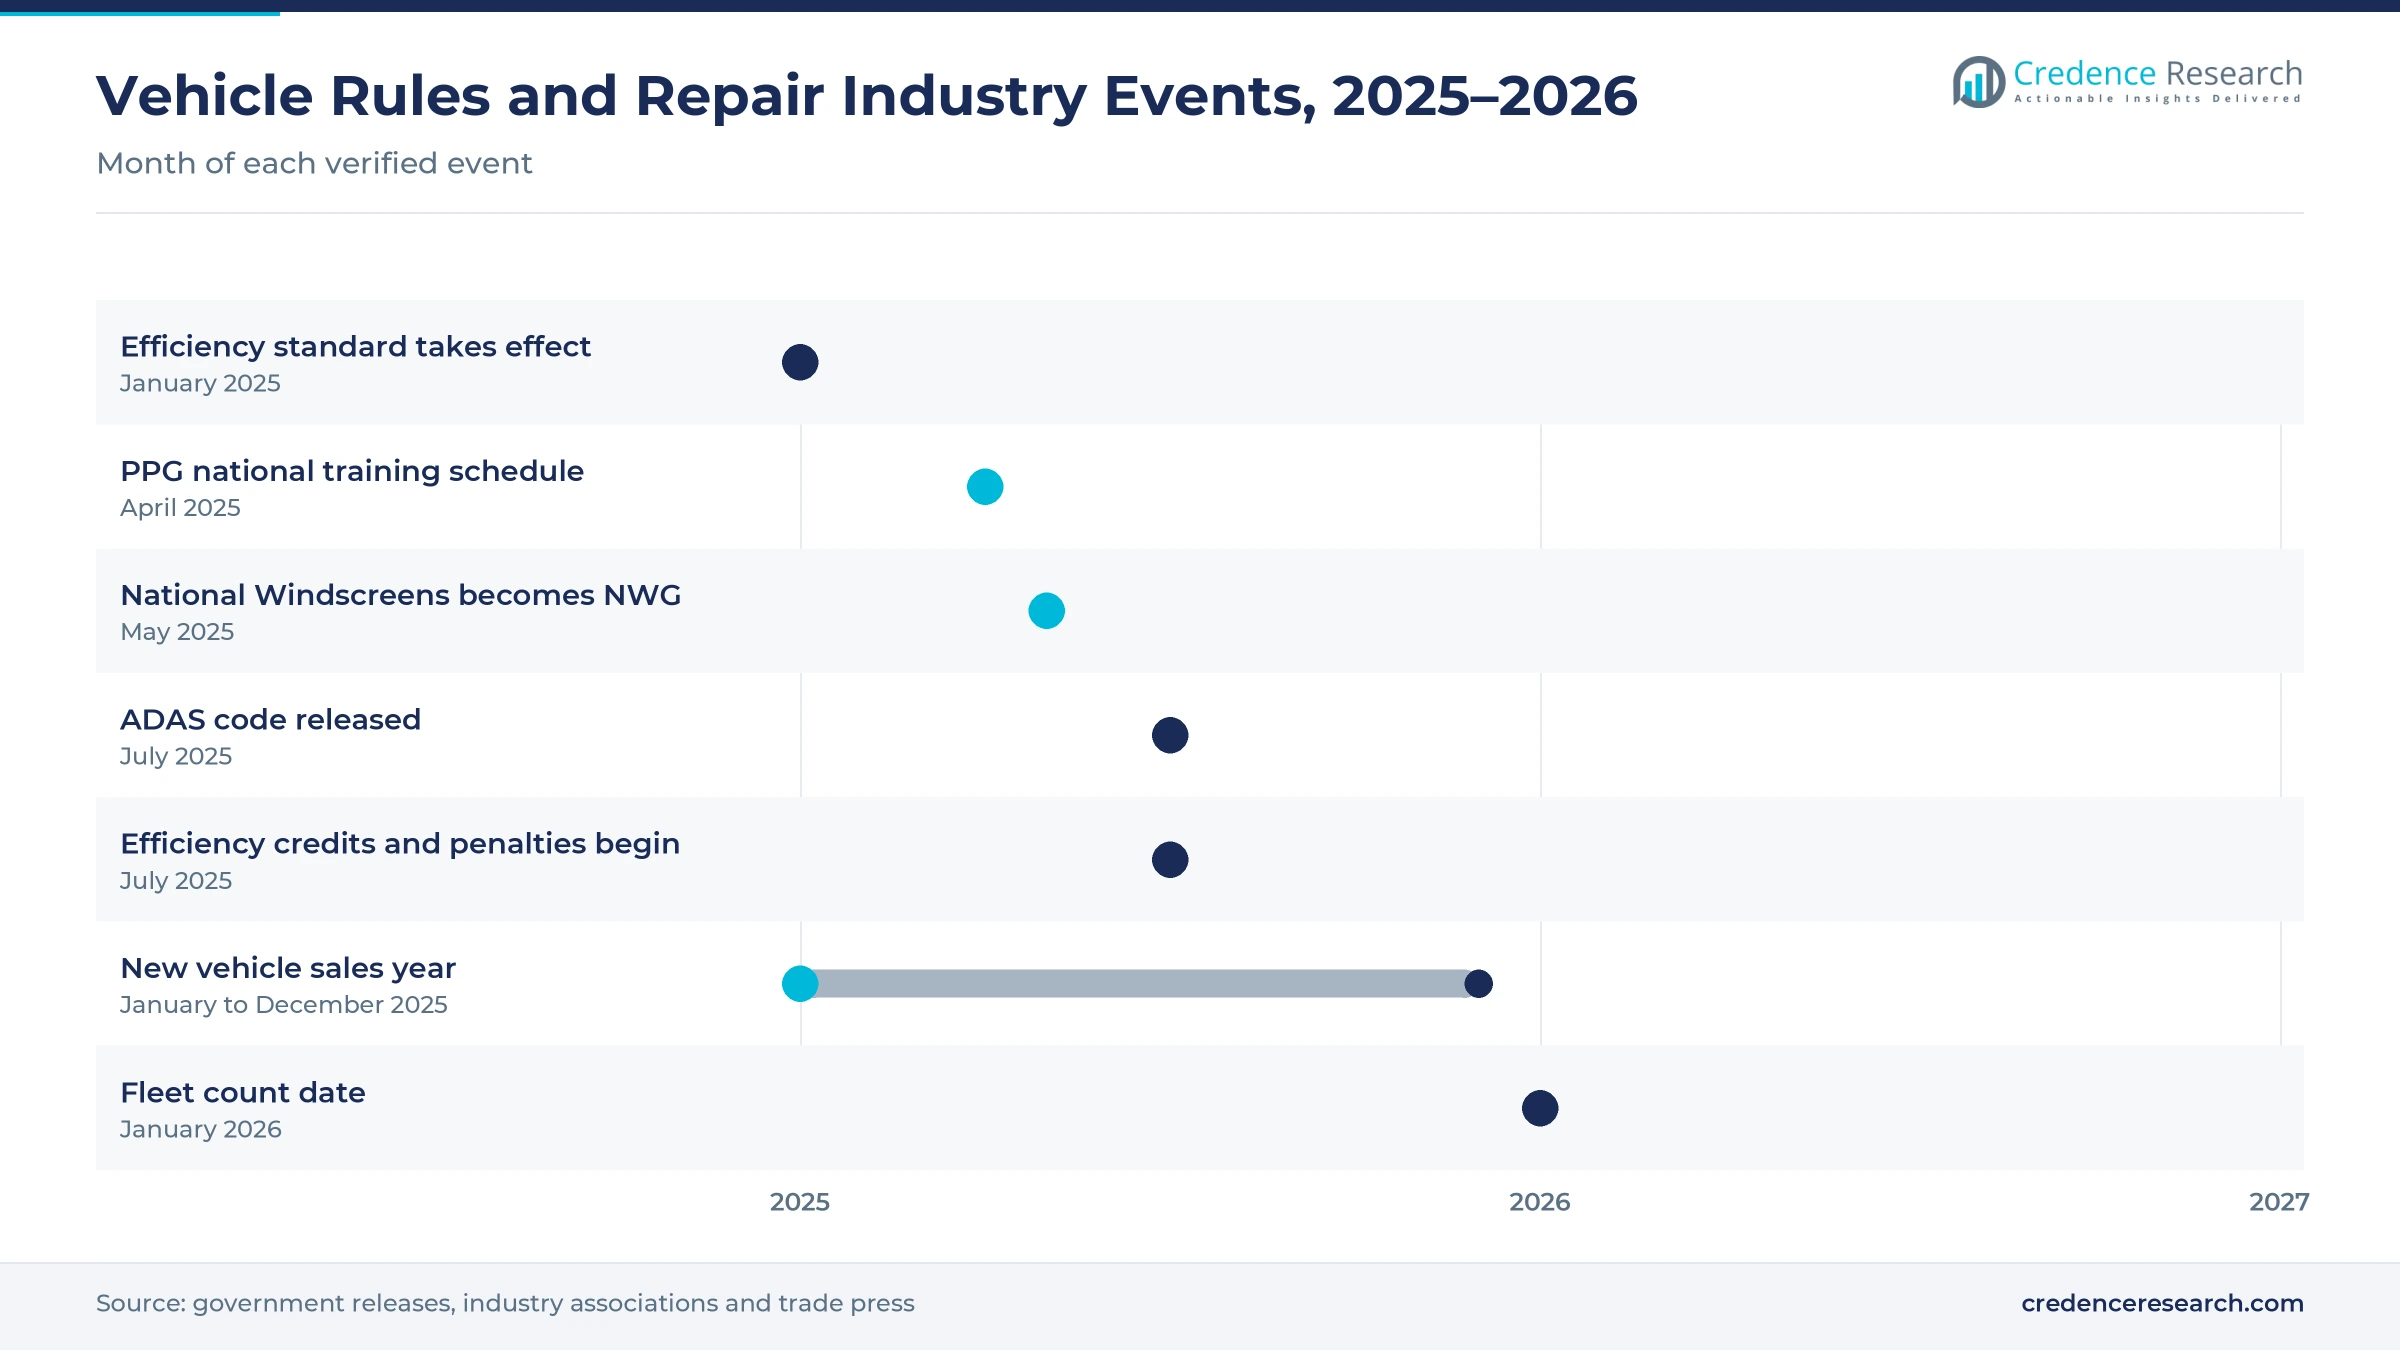
- The New Vehicle Efficiency Standard began on Jan. 1, 2025, and credits and penalties started on July 1, 2025, which speeds the arrival of electrified models.
- PPG released a national refinish training schedule in April 2025, while Fuller Australia makes adhesives and sealants at Dandenong South in Victoria.
Structural products lead as digital orders grow fastest
Why do structural adhesives lead product demand?
Based on product type, the market is categorized into structural adhesives, sealing compounds, adhesive tapes and films, and specialty assembly adhesives. Structural Adhesives led with a 34.0% share of 2025 value, because collision repairers bond panels, roofs and brackets under carmaker procedures. Structural Adhesives also grow fastest at 6.84% a year, as lightweight and electrified vehicles rely on more bonded joints.
How does body bonding and sealing dominate use?
Based on application, the market is categorized into glass bonding, body bonding and sealing, mechanical and electrical repair, and interior and trim bonding. Body Bonding and Sealing led with 33.0% of 2025 value, because every panel repair needs seam sealers and bonding products. Mechanical and Electrical Repair grows fastest at 6.92% a year, as workshops service battery packs, sensors and electronic modules.
Why does automotive repair and maintenance lead purchases?
Based on customer type, the market is categorized into automotive repair and maintenance, aftermarket retail, niche OEM assembly and fleet maintenance. Automotive Repair and Maintenance led with 52.0% of 2025 value, because collision and mechanical workshops use bonding products on most jobs. Niche OEM Assembly grows fastest at 7.01% a year, as local builders of buses, trucks and special vehicles add bonded parts.
Why does specialist distribution lead supply?
Based on sales channel, the market is categorized into direct manufacturer sales, specialist distribution, automotive retail distribution and direct digital sales. Specialist Distribution led with 41.0% of 2025 value, because trade suppliers stock approved products and provide technical advice. Direct Digital Sales grows fastest at 7.51% a year, as workshops reorder routine products through online trade accounts.
| Segment Group | Leading Sub-segment | Share, 2025 | Fastest-growing Sub-segment | CAGR, 2026–2035 |
|---|---|---|---|---|
| By Product Type | Structural Adhesives | 34.0% | Structural Adhesives | 6.84% |
| By Application | Body Bonding and Sealing | 33.0% | Mechanical and Electrical Repair | 6.92% |
| By Customer Type | Automotive Repair and Maintenance | 52.0% | Niche OEM Assembly | 7.01% |
| By Sales Channel | Specialist Distribution | 41.0% | Direct Digital Sales | 7.51% |
Request a Free Sample
Fill in your details and we'll send you a free sample report.
- Sample data tables & charts
- Research methodology
Fleet age, repair complexity and electrification lift use
How does installed fleet maintenance sustain demand?
Installed fleet maintenance sustains adhesive demand, because older vehicles need more body sealing, glass replacement and component repair each year. Australia had about 22.77 million registered motor vehicles at Jan. 31, 2026, up 2.1% from a year earlier, according to federal transport statistics. The average fleet age also rose to 11.67 years from 11.55 years, which keeps more cars in the repair cycle well beyond warranty. About 850,000 vehicles reach end of life each year, which shows how many aging cars pass through workshops before retirement. As a result, automotive repair and maintenance held 52.0% of 2025 value, as dealer and independent workshops buy sealants, structural adhesives and glass urethanes for daily jobs.
Why does repair specification complexity raise value per job?
Repair specification complexity raises value per job, because modern vehicles combine bonded panels, mixed materials and sensors mounted behind glass. The Australian Automotive Aftermarket Association introduced an ADAS Industry Code of Conduct at Autocare 2025 in July 2025, covering windscreen services, tire shops and collision repairers, according to AFMA. The code notes that about 43% of cars on Australian roads are expected to carry driver assistance systems by 2030. Autonomous emergency braking is also mandatory in all new vehicles under ADR 98/00, which places cameras and radar near bonded glass and bumpers. In turn, body bonding and sealing held 33.0% of 2025 value, while glass replacement jobs add calibration steps and approved urethanes.
How does the vehicle efficiency transition lift bonding needs?
The vehicle efficiency transition lifts bonding needs, because hybrids, plug-ins and battery electric vehicles use lightweight panels, battery packs and thermal materials. The federal government introduced the New Vehicle Efficiency Standard on Jan. 1, 2025, and manufacturers started earning credits and accruing penalties on July 1, 2025, according to the federal transport department. The standard aims to cut emissions from new passenger models by more than 60% by 2030. Battery electric vehicles reached 103,269 sales, or 8.3% of the 1,209,808 new vehicles sold in 2025, according to the Federal Chamber of Automotive Industries. As a result, mechanical and electrical repair grows fastest at 6.92% a year, as workshops service battery and electronic components.
Why do technician training and local supply support demand?
Technician training and local supply support demand, because trained repairers apply more bonding products correctly and win insurer work. PPG announced a national schedule of refinish training courses in April 2025, according to National Collision Repairer. The same report said PPG has been the largest provider of refinish training across Australia and New Zealand for decades, which links product supply with workshop skills. Fuller Australia makes adhesives, sealants and fillers in Dandenong South, employs more than 100 staff there, and runs three manufacturing locations across Australia and New Zealand. In turn, specialist distribution held 41.0% of 2025 value, as trained shops buy bonding products through trade suppliers that also stock refinish coatings.
Electrified fleets and glass service change bonding work
How is the shift toward electrified fleets changing repairs?
The shift toward electrified fleets is changing repair work, because battery packs, sensors and lightweight bodies need more structural bonding and specialty sealing. Electric and hydrogen vehicles on the register rose 42.3% to about 368,300 at Jan. 31, 2026, according to federal transport statistics. Hybrids rose 31.7% to about 846,200, while plug-in hybrids more than doubled to about 111,300 over the same year. Plug-in hybrid sales also rose 130.9% to 53,484 units in 2025, which adds more of these vehicles to future repair queues. As a result, structural adhesives grow fastest at 6.84% a year, as owners who rely on public charging networks bring newer electrified models to specialist repairers.
Why is the rise of glass and calibration services notable?
The rise of combined glass and calibration services is reshaping glass bonding, because windshield work now includes sensor checks as well as urethane bonding. National Windscreens Group rebranded as NWG in May 2025 after securing new investment, and the 38-year-old company offers auto glass replacement and ADAS calibration for collision work. About 16.4 million passenger vehicles were registered in January 2026, and each carries a windshield that may need bonded replacement. The national ADAS code, introduced in July 2025, also lists windscreen services among the businesses that must recalibrate driver assistance features. In turn, glass bonding gains value per job, as windshield replacement fitters use approved fast-cure urethanes that return calibrated vehicles to the road sooner.
Is there room to grow in Queensland repair networks?
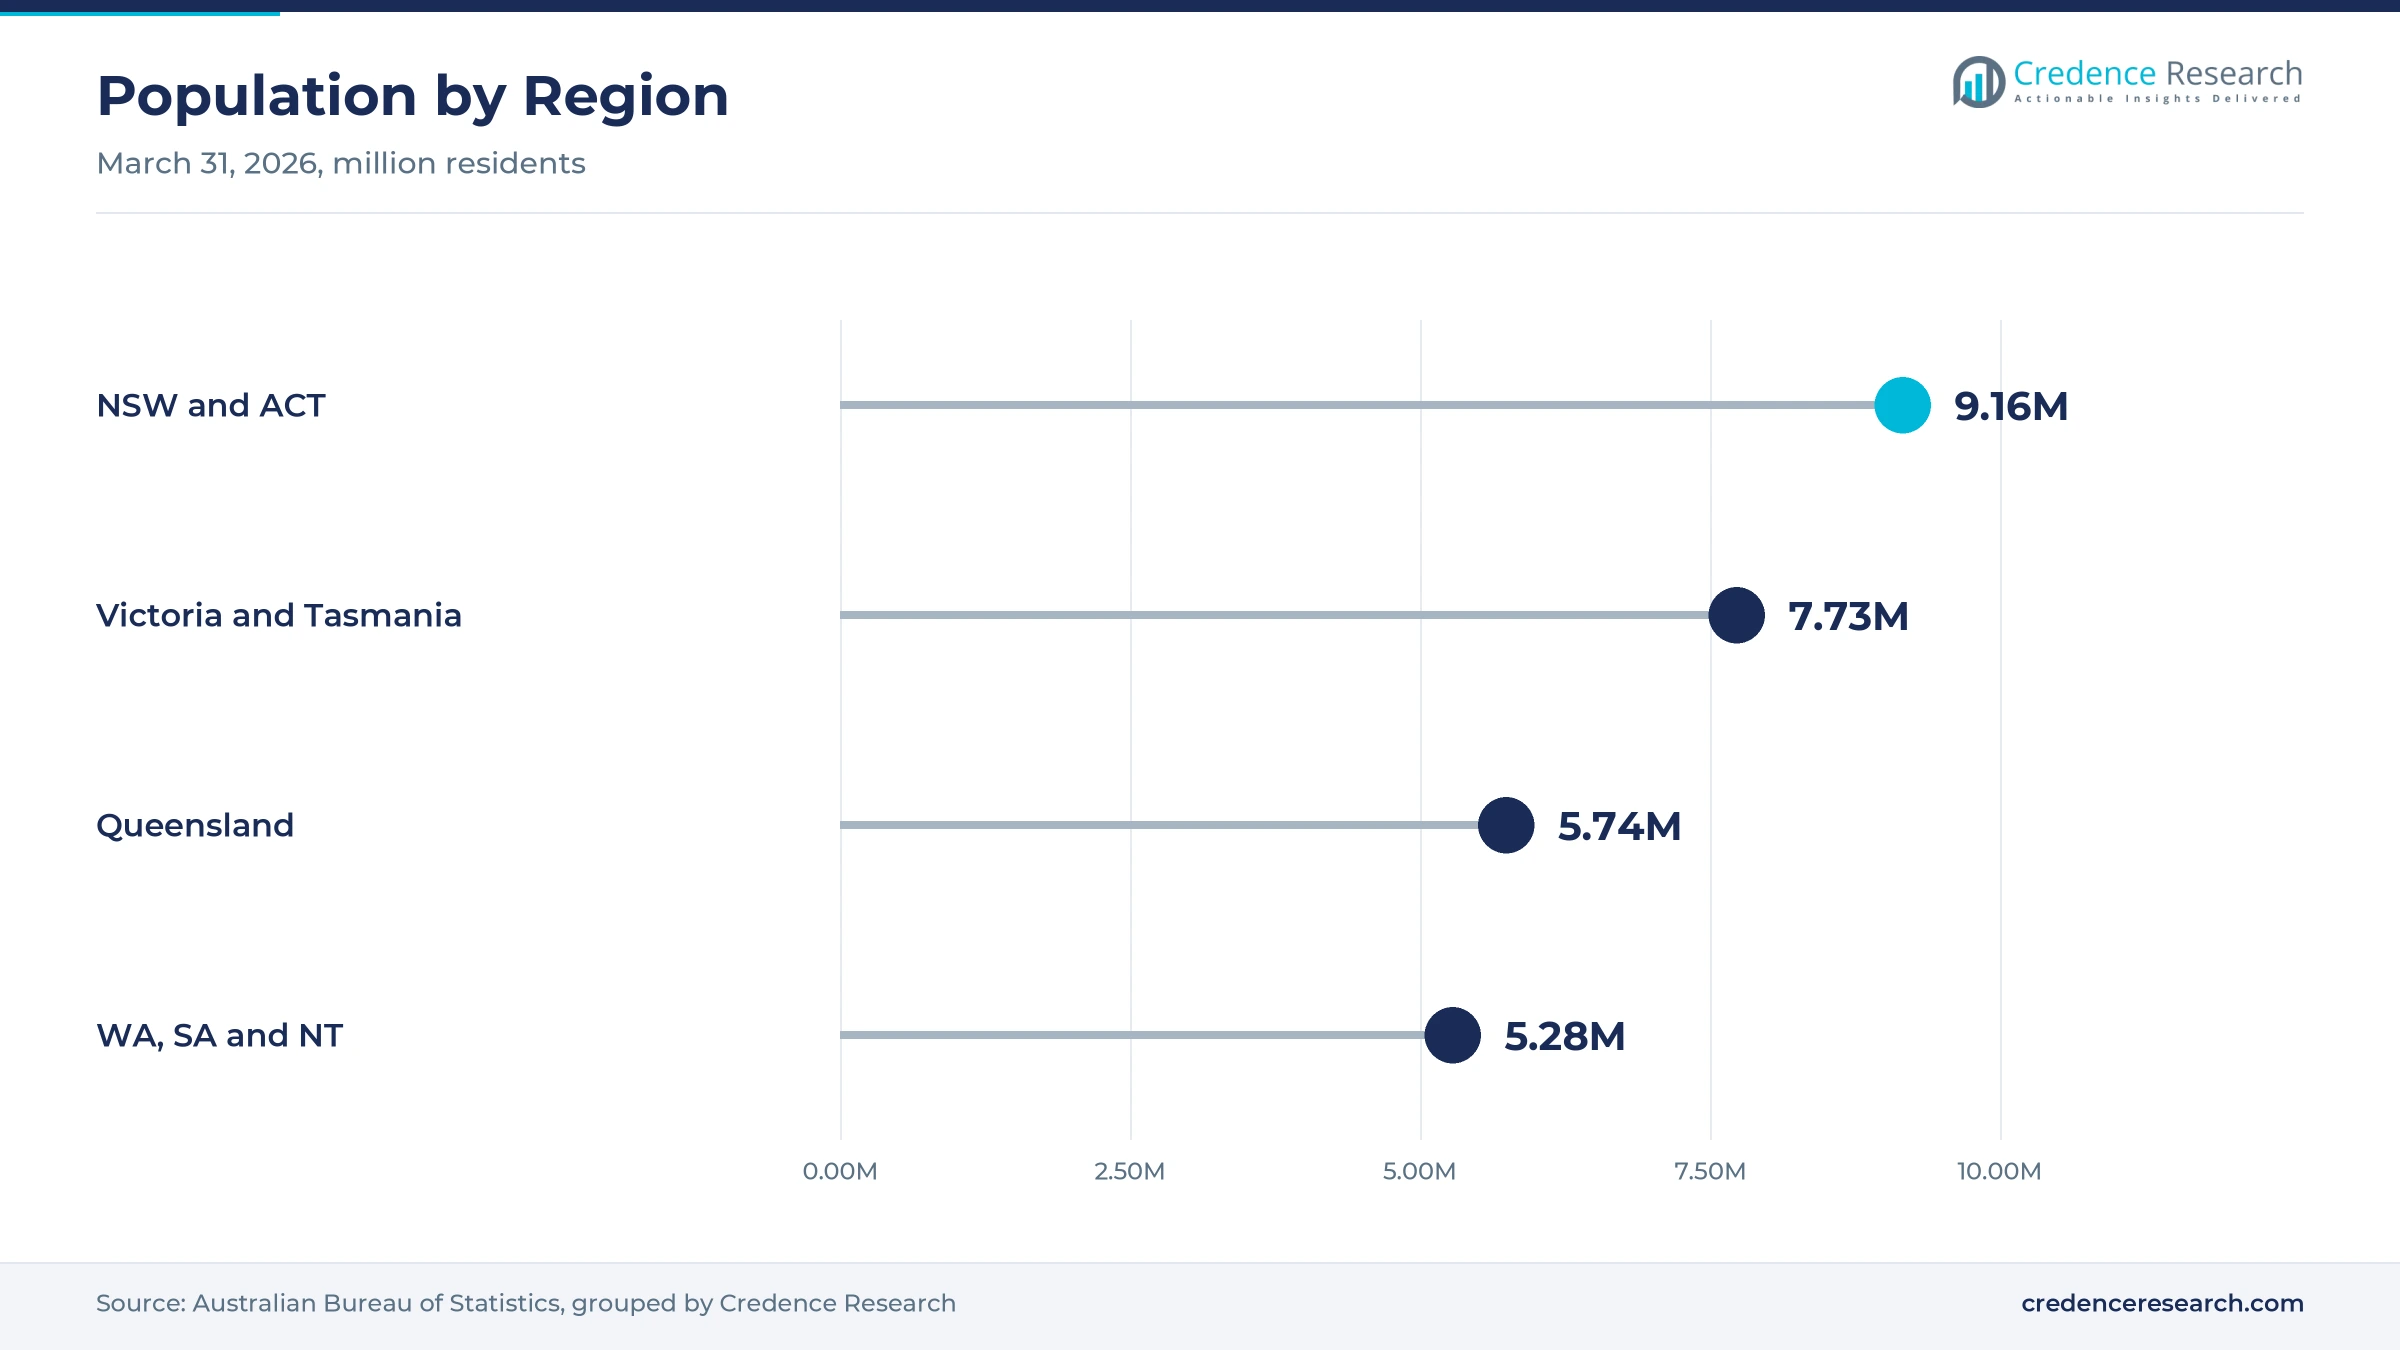
Queensland repair networks leave room to grow, because population growth adds vehicles, insurance claims and service jobs each year. Queensland added about 90,100 residents in the year to March 31, 2026, growth of 1.6%, according to the Australian Bureau of Statistics. The state had about 5.74 million residents at that date, the third-largest population in the country. The national population also grew 1.4% to about 27.92 million over the same year, which lifts demand for repair materials in growth corridors such as southeast Queensland. As a result, Queensland is the fastest-growing region, as new repair centers open to serve expanding suburbs.
Can fleet maintenance and niche assembly open new demand?
Fleet maintenance and niche assembly can open new demand, because commercial vehicles stay in service longer and local builders still assemble buses, trucks and special vehicles. Federal transport data show average ages of about 11.4 years for light commercial vehicles, 16.2 years for trucks and 13 years for buses, which keeps fleet workshops busy. The efficiency standard also aims to roughly halve emissions from new light commercial models by 2030, which brings new materials into work fleets. Manufacturing value added held about 5.3% of GDP in 2025, according to World Bank data. In turn, niche OEM assembly grows fastest at 7.01% a year, as builders bond advanced materials into bodies and cabins.
Input costs and skills gaps weigh on workshop demand
How do resin and chemical costs squeeze supplier margins?
Resin and chemical costs squeeze supplier margins, because most polyurethane, epoxy and silicone inputs are imported. Small distributors feel this most, since currency swings and freight costs change landed prices quickly. As a result, workshops sometimes delay stocking premium products or switch to cheaper alternatives. Suppliers respond with local blending, larger shipments and price review clauses. Over time, stable freight costs should ease pressure on margins.
Why do technician skills gaps slow product adoption?
Technician skills gaps slow product adoption, because structural bonding and glass urethanes need correct surface preparation and curing times. Workshops that lack trained staff may avoid newer products or apply them poorly, which raises rework and warranty risk. In turn, insurers and carmakers push repairers toward certified training. Suppliers respond with regional courses, online modules and technical support lines. Wider training should lift both product use and repair quality.
How does product approval complexity burden workshops?
Product approval complexity burdens workshops, because carmakers specify different adhesives, sealers and curing steps for each model. Independent shops must track many repair procedures and hold more product lines in stock. As a result, smaller workshops face higher inventory costs and longer job preparation. Distributors respond with approval lookup tools and bundled product kits. Clearer shared standards would make approved products easier to choose.
Why do low-cost retail products weaken value growth?
Low-cost retail products weaken value growth, because some do-it-yourself buyers choose cheaper sealants and tapes that lack carmaker approval. These products can perform poorly on glass, panels or electrical parts, which leads to repeat repairs. In turn, branded suppliers face price pressure in retail channels. Suppliers respond with clear labeling, smaller pack sizes and retailer training. Better consumer awareness should support steady demand for approved, tested products.
New South Wales and ACT lead while Queensland grows fastest
| Region | Value, 2025 (USD million) | Share, 2025 | CAGR, 2026–2035 |
|---|---|---|---|
| New South Wales and Australian Capital Territory | 50.4 | 33.7% | 6.31% |
| Victoria and Tasmania | 36.8 | 24.6% | 6.26% |
| Western Australia, South Australia and Northern Territory | 33.9 | 22.7% | 6.51% |
| Queensland | 28.4 | 19.0% | 6.76% |
Why do new South Wales and the ACT hold the largest share?
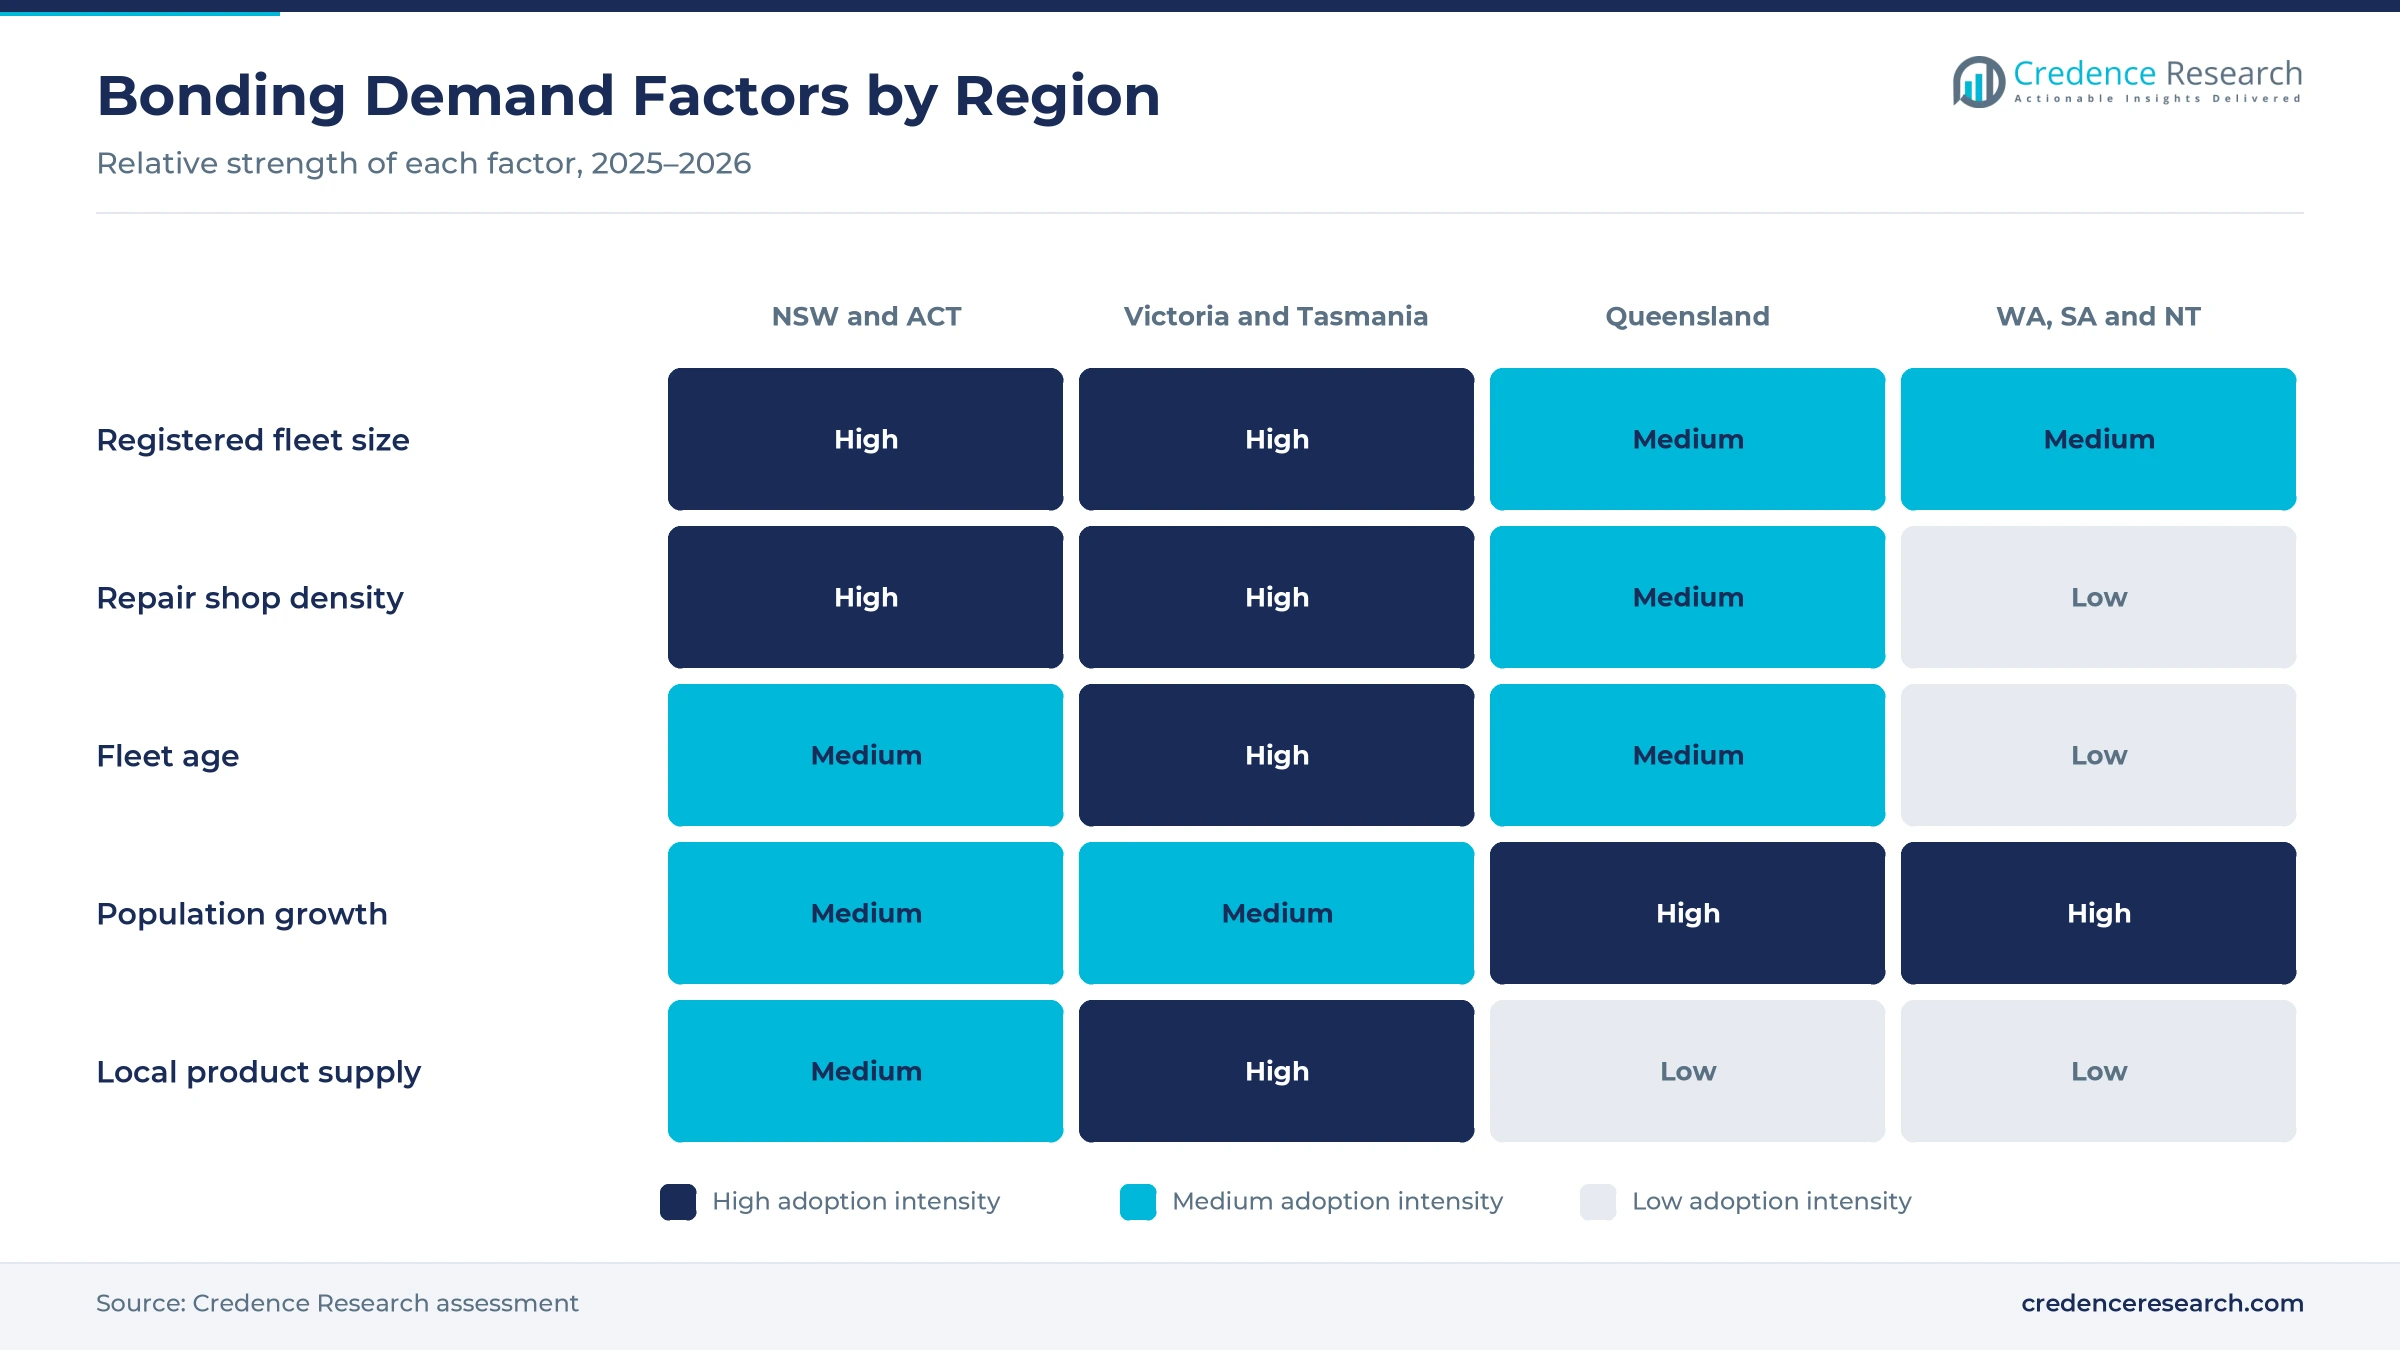
New South Wales and Australian Capital Territory held 33.7% of 2025 value and grow at 6.31% a year, because Sydney hosts the densest network of collision shops, glass fitters and insurer repair centers. New South Wales had about 8.67 million residents at March 31, 2026, while the ACT had about 490,000. As a result, the region generates the largest volume of panel and glass repair jobs in the country. Canberra also adds steady government and private fleet servicing work for local workshops.
How do Victoria and Tasmania sustain bonding demand?
Victoria and Tasmania held 24.6% of 2025 value and grow at 6.26% a year, because Melbourne hosts large repair networks and local adhesive production. Fuller Australia makes adhesives and sealants at Dandenong South, which supports supply to Victorian workshops. Victoria added about 109,500 residents in the year to March 2026, the largest increase of any state, while Tasmania has the oldest average fleet at about 13.8 years. Older vehicles in Tasmania need more seam sealing and glass work per car than newer fleets elsewhere.
Why is Queensland the fastest-growing region?
Queensland held 19.0% of 2025 value and grows fastest at 6.76% a year, because population growth adds vehicles and repair jobs across southeast Queensland. The state had about 5.74 million residents at March 31, 2026, after growing 1.6% over the year. In turn, new repair centers and glass service sites open to serve growing suburbs and regional cities. Brisbane and the Gold Coast account for much of this new repair capacity, because most new residents settle in the southeast corner of the state.
How do the western, southern and northern states add demand?
Western Australia, South Australia and Northern Territory held 22.7% of 2025 value and grow at 6.51% a year, because long distances and harsh conditions add wear to vehicles. Western Australia recorded the fastest state population growth at 2.1% in the year to March 2026, while the Northern Territory has the youngest average fleet at about 10.81 years.
Efficiency rules and repair codes marked 2025
| Development | Status and market relevance |
|---|---|
| In January 2025, the New Vehicle Efficiency Standard took effect for new passenger and light commercial vehicles in Australia. | Speeds the arrival of electrified models that need specialty bonding |
| In April 2025, PPG announced a national schedule of refinish training courses for workshops across Australia. | Builds technician skills for bonding and refinish work |
| In May 2025, National Windscreens Group rebranded as NWG after securing new investment for tools and technology. | Strengthens combined glass replacement and ADAS calibration services |
| In July 2025, the aftermarket association introduced an ADAS Industry Code of Conduct at Autocare 2025. | Sets repair steps for windscreen, tire and collision businesses |
| In July 2025, manufacturers began earning credits and accruing penalties under the efficiency standard. | Raises the commercial weight of low-emission models in the fleet |
Reactive curing and bonded glass shape product choice
- Reactive curing adhesives such as two-part epoxies and moisture-curing urethanes form strong bonds on panels and glass, which suits carmaker repair procedures.
- Physical setting products such as solvent and water-based sealers dry without chemical reaction, which keeps cost low for trim and seam work.
- Pressure-sensitive bonding tapes and films attach badges, mouldings and trim instantly, which saves time on retail and interior repairs.
- ADAS calibration checks cameras and radar after glass or bumper work, which raises demand for approved fast-cure glass urethanes.
Need a Custom Version of This Report?
Tailor the scope, geography, or segments to your exact requirements.
- Custom geography or segment scope
- Direct access to our analyst team
Suppliers compete on approvals, training and supply
Competition centers on carmaker approvals, technician training, product range and reliable supply through trade distributors. Fuller Australia makes adhesives, sealants and fillers at Dandenong South in Victoria and runs three manufacturing locations across Australia and New Zealand, which gives it local supply for workshop and retail channels. PPG Industries Australia competes through its refinish business and a national training network, and it released a new schedule of training courses for workshops in April 2025. Sika Australia targets windscreen bonding and car body repair, and Henkel Australia promotes more than 500 OEM-approved specifications for vehicle repairs. Septone supplies a range for automotive trade and retail, fleet and marine buyers. Glass service networks such as NWG are important buyers, because they combine windshield bonding with sensor calibration. Suppliers that combine approved products, training and fast delivery win the largest repair networks. Structural adhesives held 34.0% of 2025 value, so suppliers with approved structural ranges hold an advantage with large repair networks.
Companies profiled and their roles in this market
| Company | Type | Role in the market |
|---|---|---|
| Fuller Australia | Adhesive manufacturer | Makes adhesives, sealants and fillers at Dandenong South, Victoria |
| PPG Industries Australia | Refinish and coatings supplier | Runs refinish training for workshops across Australia |
| Sika Australia | Adhesive and sealant maker | Supplies windscreen bonding and car body repair products |
| Henkel Australia | Adhesive maker | Promotes more than 500 OEM-approved repair specifications |
| Septone | Automotive products brand | Serves automotive trade and retail, fleet and marine buyers |
Credence Research view on Australian vehicle bonding
Credence Research's view is that Australian demand for vehicle bonding products will grow steadily because an aging fleet keeps workshops busy and new models use more bonded parts. Structural adhesives keep the largest share and grow fastest among product types. Electrified vehicles and sensor-equipped glass add value per repair job. Queensland should grow fastest among the regions through 2035 as its population and vehicle demand rise. However, imported input costs and skills gaps will slow some adoption. Suppliers with carmaker approvals, training programs and reliable trade supply should gain share fastest.
Fleet data and repair releases anchor the bonding model
The report uses 2025 as the base year on a calendar basis, and market values come from the Credence Research model. That model combines vehicle sales and registration statistics, efficiency standard rules, population data, World Bank manufacturing data, industry codes and company releases. Segment splits and regional growth rates are Credence Research estimates, while regional shares follow the client-defined split. Sources used are official statistics, government releases, industry association releases, trade press and company releases, and no interviews or surveys were used.
Fleet repair and electrification carry growth to 2035
Sales of these bonding products are expected to reach USD 278.4 million by 2035, a 6.43% CAGR during 2026–2035, as fleet repair, sensor glass and electrified models keep demand rising. Growth should hold firm through 2030 as efficiency targets tighten and driver assistance systems spread across the fleet. After that, the pace of electric vehicle adoption and workshop skills will set demand. Faster fleet renewal would shift value toward structural products, while slower renewal would favor sealing work on older cars. Digital ordering is expected to gain the most channel share through 2035, as workshops move routine reorders online.
Frequently Asked Questions
How big is the Australia automotive adhesives and sealants market?
Which product type leads demand in Australia?
Which region leads the Australian market?
Why do repair and maintenance workshops lead purchases?
How does the efficiency standard affect bonding demand?
Which sales channel grows fastest?
Who are the leading suppliers in Australia?
What are the main challenges for suppliers?
Table of Content
Chapter 1 Market Segmentation
- 1.1 Segmentation Framework
- 1.1.1 Product and Service Classification
- 1.1.2 Application and End-Use Classification
- 1.1.3 Technology and Solution Classification
- 1.1.4 Customer and Distribution Channel Classification
- 1.1.5 Geographic Segmentation
- 1.1.6 Market Segment Definitions and Boundaries
- 1.2 By Product Type
- 1.2.1 Structural Adhesives
- 1.2.2 Sealing Compounds
- 1.2.3 Adhesive Tapes and Films
- 1.2.4 Specialty Assembly Adhesives
- 1.3 By Application
- 1.3.1 Glass Bonding
- 1.3.2 Body Bonding and Sealing
- 1.3.3 Mechanical and Electrical Repair
- 1.3.4 Interior and Trim Bonding
- 1.4 By Customer Type
- 1.4.1 Automotive Repair and Maintenance
- 1.4.2 Aftermarket Retail
- 1.4.3 Niche OEM Assembly
- 1.4.4 Fleet Maintenance
- 1.5 By Sales Channel
- 1.5.1 Direct Manufacturer Sales
- 1.5.2 Specialist Distribution
- 1.5.3 Automotive Retail Distribution
- 1.5.4 Direct Digital Sales
Chapter 2 Introduction
- 2.1 Report Objectives and Scope
- 2.2 Product Definition and Industry Terminology
- 2.3 Market Inclusions and Exclusions
- 2.4 Research Process
- 2.4.1 Primary Research and Expert Interviews
- 2.4.2 Secondary Research and Source Review
- 2.4.3 Top-Down and Bottom-Up Estimation
- 2.4.4 Data Triangulation and Verification
- 2.5 Market Size Measurement Basis
- 2.5.1 2025: USD 149.5 million → 2035: USD 278.4 million
- 2.6 Historical and Forecast Reference Periods
- 2.6.1 Historical Period: 2018-2025
- 2.6.2 Base Year: 2025
- 2.6.3 Forecast Period: 2025-2035
- 2.7 Research Assumptions and Limitations
Chapter 3 Executive Summary
- 3.1 Market Snapshot and Key Findings
- 3.2 Base-Year Market Size, 2025
- 3.3 Forecast Market Size, 2035
- 3.4 Revenue and Volume Growth Outlook
- 3.5 Key Demand and Supply Indicators
- 3.6 Leading Market Segments
- 3.7 Fastest-Growing Market Opportunities
- 3.8 Regional Performance Highlights
- 3.9 Technology and Industry Transformation
- 3.10 Competitive Landscape Summary
- 3.11 Analyst View and Strategic Implications
Chapter 4 Australia Automotive Adhesives and Sealants Market Trends and Developments
- 4.1 Historical Industry Development, 2018-2025
- 4.2 Recent Market Trends and Developments
- 4.3 Demand and Customer Behavior Trends
- 4.4 Technology and Product Innovation
- 4.5 Artificial Intelligence, Automation and Digitalization
- 4.6 Local Manufacturing and Supply Chain Realignment
- 4.7 Industry Partnerships, Mergers and Acquisitions
- 4.8 Sustainability and Circular Economy Developments
- 4.9 Government and Private Sector Investment Trends
- 4.10 Emerging Business Models and Commercialization
- 4.11 Industry Developments and Announcements
Chapter 5 Australia Automotive Adhesives and Sealants Market Production, Supply and Demand Analysis
- 5.1 Demand Trend and Consumption Analysis, 2018-2025
- 5.2 Demand Forecast, 2025-2035
- 5.3 Production and Output Trend, 2018-2025
- 5.4 Production and Output Forecast, 2025-2035
- 5.5 Installed Capacity and Capacity Utilization
- 5.6 Company-Wise Production Plants and Statistics
- 5.6.1 Installed Production Capacity
- 5.6.2 Actual Production
- 5.6.3 Planned Capacity and Expansion Targets
- 5.7 Supply Chain Structure and Procurement Trends
- 5.8 Supply-Demand Gap and Bottlenecks
- 5.9 Import Dependence and Sourcing Structure
- 5.10 Contract Manufacturing and Outsourcing
- 5.11 Regional Supply and Demand Concentration
Chapter 6 Australia Automotive Adhesives and Sealants Market Pricing Analysis
- 6.1 Pricing Structure and Measurement
- 6.2 Historical Pricing Trends, 2018-2025
- 6.3 Pricing Outlook, 2025-2035
- 6.4 Average Selling Price and Unit Economics
- 6.5 Pricing by Product and Market Segment
- 6.6 Geographic Pricing Differences
- 6.7 Key Input, Energy, Labor and Logistics Costs
- 6.8 Contract Pricing and Purchasing Models
- 6.9 Pricing Sensitivity and Competitive Positioning
- 6.10 Price, Margin and Profitability Implications
Chapter 7 Australia Automotive Adhesives and Sealants Market Dynamics
- 7.1 Market Growth Drivers
- 7.1.1 Demand-Side Drivers
- 7.1.2 Technology and Innovation Drivers
- 7.1.3 Infrastructure and Investment Drivers
- 7.1.4 Regulatory and Policy Drivers
- 7.2 Market Restraints
- 7.2.1 Cost and Affordability Constraints
- 7.2.2 Technology and Adoption Barriers
- 7.2.3 Supply Chain and Operational Constraints
- 7.3 Market Challenges
- 7.3.1 Competitive Pressure and Margin Erosion
- 7.3.2 Skills, Infrastructure and Implementation Gaps
- 7.4 Emerging Market Opportunities
- 7.5 Market Dynamics Impact and Time-Horizon Assessment
Chapter 8 Australia Automotive Adhesives and Sealants Value Chain Analysis
- 8.1 Industry Value Chain Overview
- 8.2 Upstream Suppliers and Critical Inputs
- 8.3 Technology and Component Providers
- 8.4 Manufacturing or Service Delivery
- 8.5 Distribution, Channel Partners and Integrators
- 8.6 Downstream Applications and End Users
- 8.7 Value Addition and Profit Pools
- 8.8 Vertical Integration and Outsourcing
- 8.9 Supplier Concentration and Risk
- 8.10 Supply Chain Localization and Resilience
Chapter 9 Australia Automotive Adhesives and Sealants Market Regulations and Policies
- 9.1 Relevant Laws, Standards and Compliance Frameworks
- 9.2 Product, Service, Safety and Quality Requirements
- 9.3 Government Policies, Incentives and Subsidies
- 9.4 Imports, Exports and Trade Barriers
- 9.5 Public Procurement and Local Content Requirements
- 9.6 Environmental and Sustainability Compliance
- 9.7 Upcoming Policy Changes and Market Implications
Chapter 10 Australia Automotive Adhesives and Sealants Market Hotspots and Opportunities
- 10.1 Market Opportunity Mapping and Growth Hotspots
- 10.2 High-Growth Applications and Customer Groups
- 10.3 Underserved Markets and White-Space Opportunities
- 10.4 Emerging Technology and Product Opportunities
- 10.5 New Capacity and Investment Hotspots
- 10.6 Market Entry and Expansion Opportunities
- 10.7 Distribution and Partnership Opportunities
- 10.8 Near-Term and Long-Term Commercial Potential
- 10.9 Opportunity Attractiveness and Execution Risks
Chapter 11 Australia Automotive Adhesives and Sealants Market Outlook, 2025-2035
- 11.1 Market Size and Analysis
- 11.1.1 Revenue (Market Measurement: 2025: USD 149.5 million → 2035: USD 278.4 million)
- 11.1.2 Market Volume and Quantity Sold
- 11.1.3 Historical Market Size, 2018-2025
- 11.1.4 Base-Year Market Size, 2025
- 11.2 Market Forecast, 2025-2035
- 11.2.1 Revenue Forecast to 2035
- 11.2.2 Volume Forecast to 2035
- 11.2.3 CAGR and Year-on-Year Growth
- 11.2.4 Incremental Revenue Opportunity
- 11.3 Forecast Assumptions and Scenario Analysis
- 11.3.1 Base-Case Forecast
- 11.3.2 Optimistic and Conservative Scenarios
- 11.3.3 Technology, Pricing and Policy Sensitivities
- 11.4 Market Attractiveness and Growth Outlook
Chapter 12 Australia Automotive Adhesives and Sealants Market Segmentation and Outlook
- 12.1 Segmentation Summary and Market Shares, 2025
- 12.2 Largest and Fastest-Growing Segments
- 12.3 By Product Type - Market Size and Forecast, 2025-2035
- 12.3.1 Segment Definition and Scope
- 12.3.2 Historical Market Size, 2018-2025
- 12.3.3 Revenue Forecast, 2025-2035
- 12.3.4 Volume Forecast, 2025-2035
- 12.3.5 Base-Year Market Share, 2025
- 12.3.6 Segment CAGR and Growth Drivers
- 12.3.7 Subsegment Market Size and Forecast
- 12.3.7.1 Structural Adhesives
- 12.3.7.2 Sealing Compounds
- 12.3.7.3 Adhesive Tapes and Films
- 12.3.7.4 Specialty Assembly Adhesives
- 12.3.8 Subsegment Pricing and Adoption Trends
- 12.3.9 Leading Suppliers and Competition
- 12.3.10 Regional Demand and Opportunities
- 12.4 By Application - Market Size and Forecast, 2025-2035
- 12.4.1 Segment Definition and Scope
- 12.4.2 Historical Market Size, 2018-2025
- 12.4.3 Revenue Forecast, 2025-2035
- 12.4.4 Volume Forecast, 2025-2035
- 12.4.5 Base-Year Market Share, 2025
- 12.4.6 Segment CAGR and Growth Drivers
- 12.4.7 Subsegment Market Size and Forecast
- 12.4.7.1 Glass Bonding
- 12.4.7.2 Body Bonding and Sealing
- 12.4.7.3 Mechanical and Electrical Repair
- 12.4.7.4 Interior and Trim Bonding
- 12.4.8 Subsegment Pricing and Adoption Trends
- 12.4.9 Leading Suppliers and Competition
- 12.4.10 Regional Demand and Opportunities
- 12.5 By Customer Type - Market Size and Forecast, 2025-2035
- 12.5.1 Segment Definition and Scope
- 12.5.2 Historical Market Size, 2018-2025
- 12.5.3 Revenue Forecast, 2025-2035
- 12.5.4 Volume Forecast, 2025-2035
- 12.5.5 Base-Year Market Share, 2025
- 12.5.6 Segment CAGR and Growth Drivers
- 12.5.7 Subsegment Market Size and Forecast
- 12.5.7.1 Automotive Repair and Maintenance
- 12.5.7.2 Aftermarket Retail
- 12.5.7.3 Niche OEM Assembly
- 12.5.7.4 Fleet Maintenance
- 12.5.8 Subsegment Pricing and Adoption Trends
- 12.5.9 Leading Suppliers and Competition
- 12.5.10 Regional Demand and Opportunities
- 12.6 By Sales Channel - Market Size and Forecast, 2025-2035
- 12.6.1 Segment Definition and Scope
- 12.6.2 Historical Market Size, 2018-2025
- 12.6.3 Revenue Forecast, 2025-2035
- 12.6.4 Volume Forecast, 2025-2035
- 12.6.5 Base-Year Market Share, 2025
- 12.6.6 Segment CAGR and Growth Drivers
- 12.6.7 Subsegment Market Size and Forecast
- 12.6.7.1 Direct Manufacturer Sales
- 12.6.7.2 Specialist Distribution
- 12.6.7.3 Automotive Retail Distribution
- 12.6.7.4 Direct Digital Sales
- 12.6.8 Subsegment Pricing and Adoption Trends
- 12.6.9 Leading Suppliers and Competition
- 12.6.10 Regional Demand and Opportunities
- 12.7 Segment Growth Comparison
- 12.8 Segment Attractiveness and Priority Matrix
Chapter 13 Australia Automotive Adhesives and Sealants End-Use and Application Market Outlook
- 13.1 End-Use Industry and Customer Demand Structure
- 13.2 Leading Applications and Customer Groups
- 13.3 End-Use Market Size, Share and Forecast
- 13.4 Major End-Use Industry Deep Dives
- 13.4.1 Customer Requirements and Use Cases
- 13.4.2 Demand and Replacement Cycles
- 13.4.3 Technical and Regulatory Considerations
- 13.4.4 Purchasing and Procurement Models
- 13.4.5 Leading Vendors and Distribution Channels
- 13.4.6 Forecast and Commercial Opportunities
- 13.5 Emerging Applications and Cross-Segment Demand
- 13.6 End-Use Industry Investment Priorities
Chapter 14 Australia Automotive Adhesives and Sealants Geographic Market Outlook, 2025-2035
- 14.1 Domestic Market Distribution and Demand Clusters
- 14.2 State- or Province-Wise Market Size and Forecast, 2025-2035
- 14.3 City and Metropolitan Market Outlook
- 14.4 Industrial, Manufacturing and Commercial Clusters
- 14.5 Geographic Concentration of Key End Users
- 14.6 Local Pricing and Purchasing Differences
- 14.7 Domestic Production Facilities and Capacity Map
- 14.8 Local Infrastructure and Project Pipeline
- 14.9 State-Level Policy and Incentive Differences
- 14.10 Subnational Investment Hotspots and Opportunities
- 14.11 Distribution and Logistics Networks
- 14.12 Domestic Competitive Footprint
Chapter 15 Australia Automotive Adhesives and Sealants Technology, Innovation and Sustainability Outlook
- 15.1 Technology Landscape and Maturity
- 15.2 Product, Process and Service Innovation
- 15.3 AI, Automation and Digital Tools in the Industry
- 15.4 Technology Adoption and Performance Benchmarking
- 15.5 Innovation Pipeline and R&D Investment
- 15.6 Patent and Intellectual Property Trends
- 15.7 Energy Efficiency and Resource Management
- 15.8 Sustainability, Recycling and Circularity
- 15.9 Technology Roadmap, 2025-2035
- 15.10 Risks of Obsolescence and Technology Substitution
Chapter 16 Australia Automotive Adhesives and Sealants Market Key Strategic Imperatives
- 16.1 Growth and Market Entry Priorities
- 16.2 High-Return Products and Segments
- 16.3 Pricing, Profitability and Cost Optimization
- 16.4 Technology Investment and Product Differentiation
- 16.5 Supply Chain Localization and Resilience
- 16.6 Distribution and Customer Acquisition
- 16.7 Partnership, Acquisition and Capacity Strategy
- 16.8 Regional Expansion Priorities
- 16.9 Short-, Medium- and Long-Term Actions
Chapter 17 Competition Outlook
- 17.1 Industry Competition Characteristics
- 17.2 Market Structure and Concentration
- 17.3 Market Share and Competitive Positioning, 2025
- 17.4 Company-Wise Revenue and Product Benchmarking
- 17.5 Production and Service Capacity Benchmarking
- 17.6 Technology, Pricing and Differentiation
- 17.7 Regional Footprint and Distribution Strength
- 17.8 Mergers, Acquisitions and Strategic Alliances
- 17.9 New Entrants and Competitive Threats
- 17.10 Porter's Five Forces and Industry Attractiveness
- 17.11 Competitive Outlook, 2025-2035
Chapter 18 Company Profiles
- 18.1 Company Coverage and Selection Criteria
- 18.2 Fuller Australia
- 18.2.1 Business Description
- 18.2.2 Company Ownership and Geographic Presence
- 18.2.3 Product and Service Portfolio
- 18.2.4 Manufacturing and Operating Footprint
- 18.2.5 Production Capacity and Expansion Plans
- 18.2.6 Financial Performance and Investment
- 18.2.7 Market Share and Competitive Position
- 18.2.8 Technology and Innovation Capabilities
- 18.2.9 Strategic Alliances or Partnerships
- 18.2.10 Recent Developments
- 18.2.11 Growth Strategy and Outlook
- 18.3 PPG Industries Australia
- 18.4 Sika Australia
- 18.5 Henkel Australia
- 18.6 Septone
- 18.7 Other Relevant Market Participants
Note: Every listed company is profiled on the structure shown under the first company. The company list is preliminary and may change based on research findings, market developments, data availability and client requirements.
Chapter 19 Disclaimer
- 19.1 Research and Forecast Disclaimer
- 19.2 Data Source and Estimation Limitations
Note: The depth of individual sections depends on data availability for this market. Volume, capacity, trade and other unit-based metrics are included where applicable.

