
Super capital, takeovers and IPO reform lift deal fees
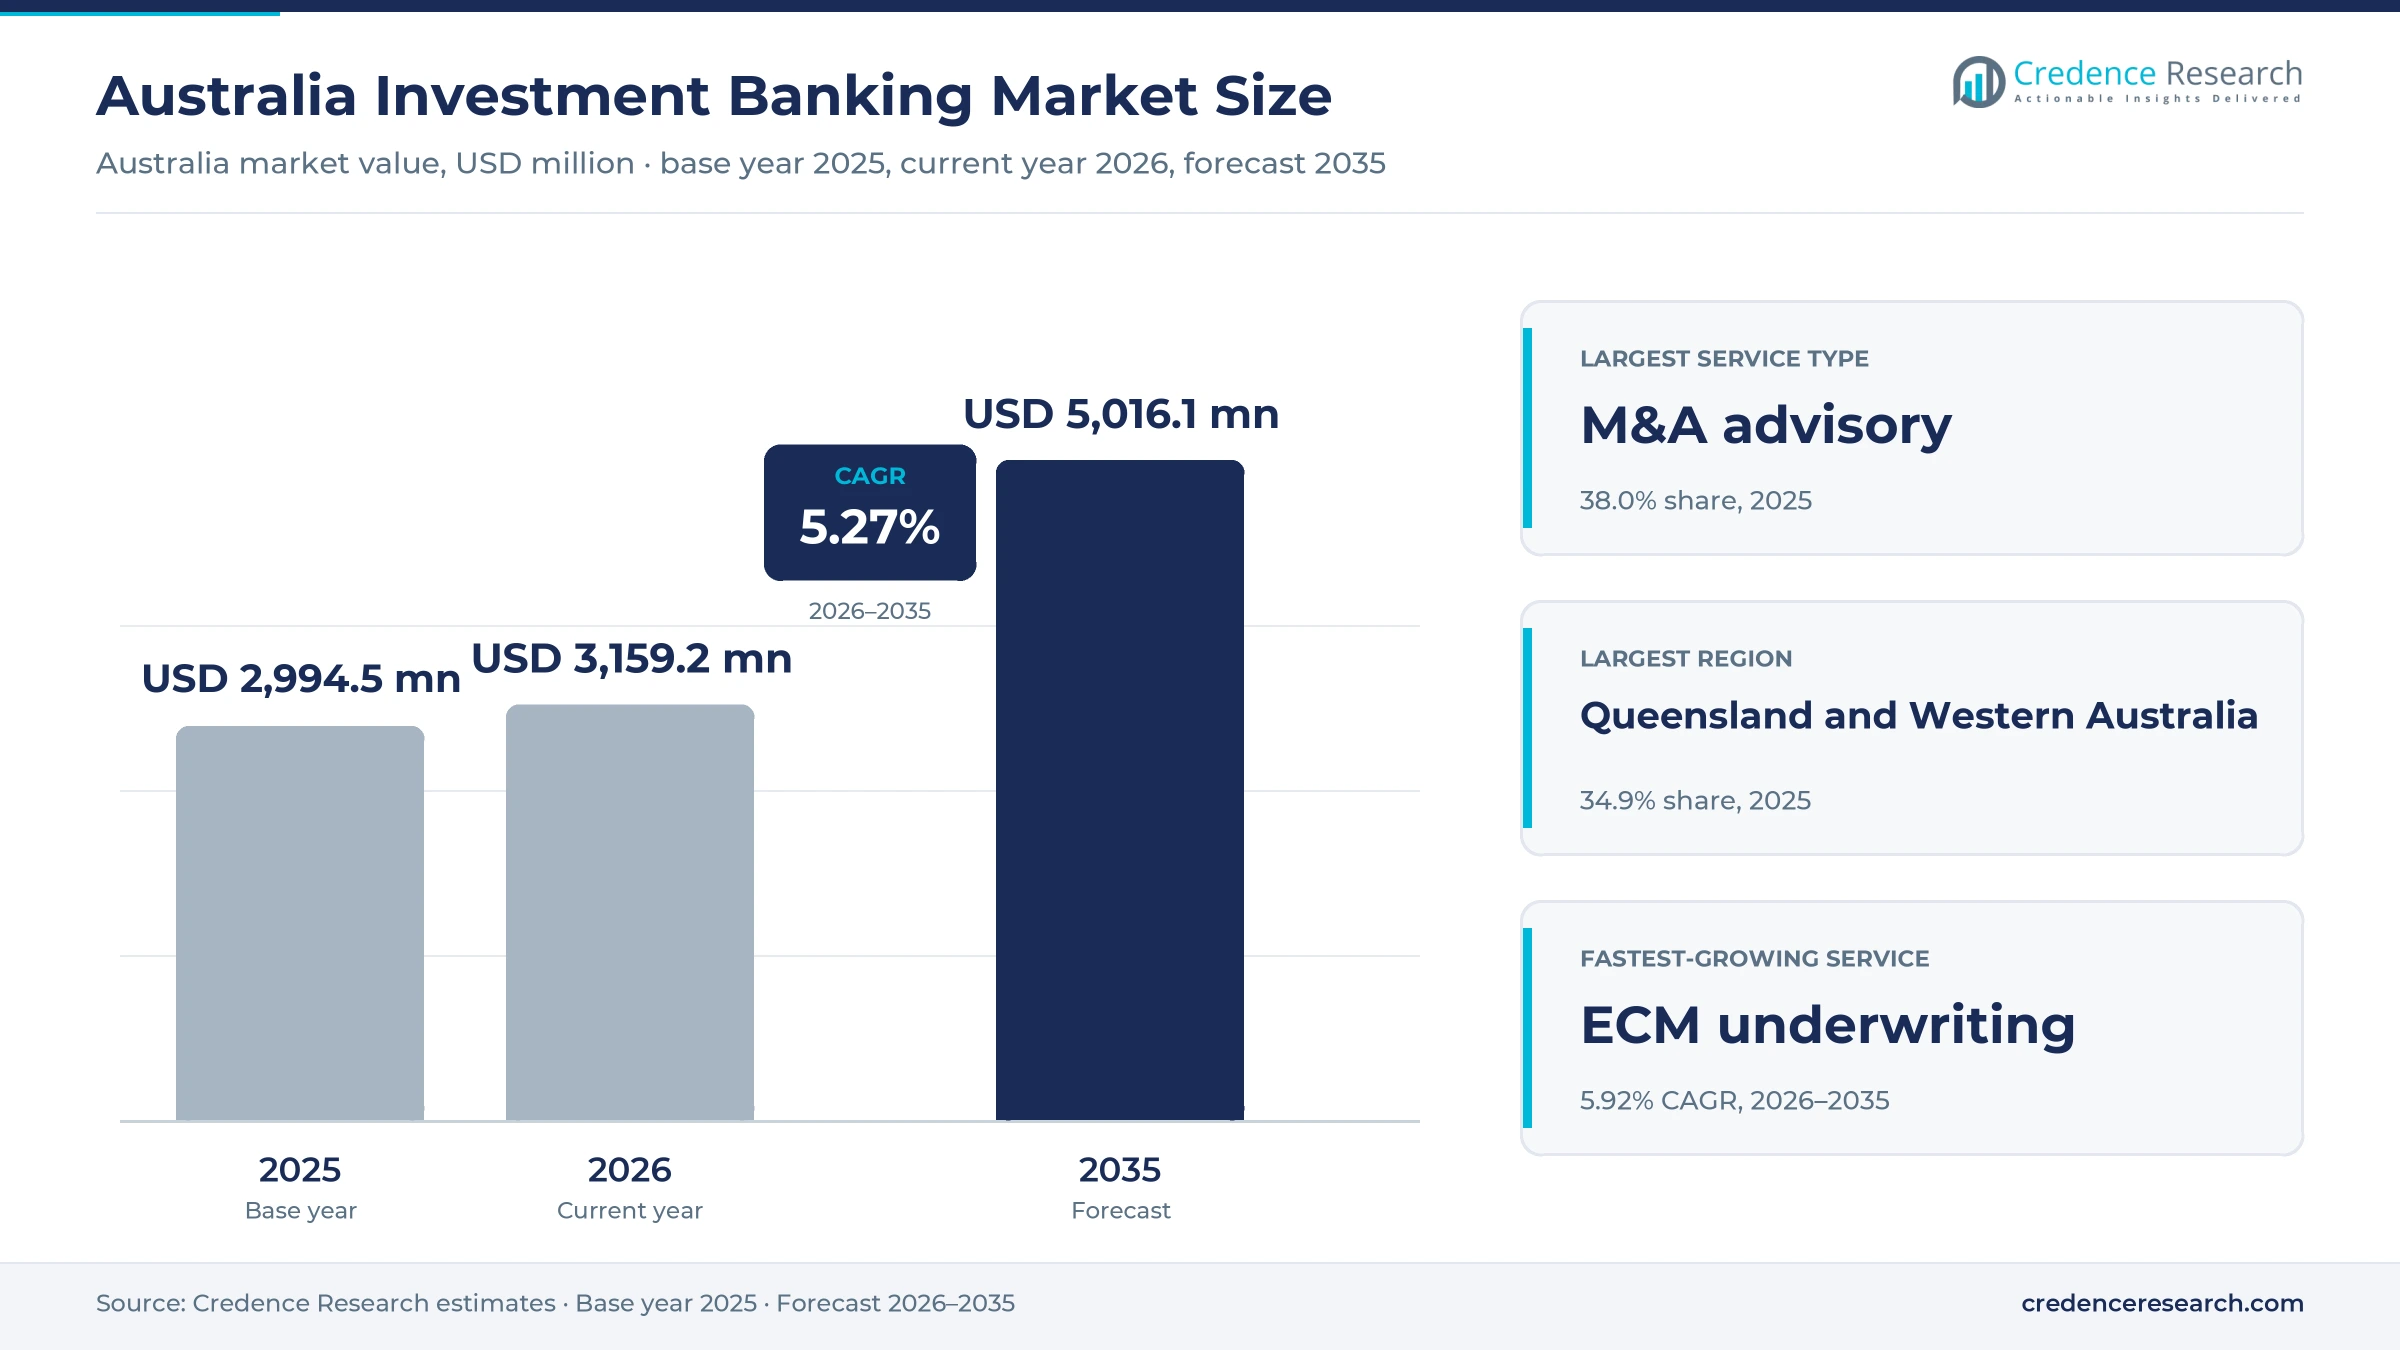
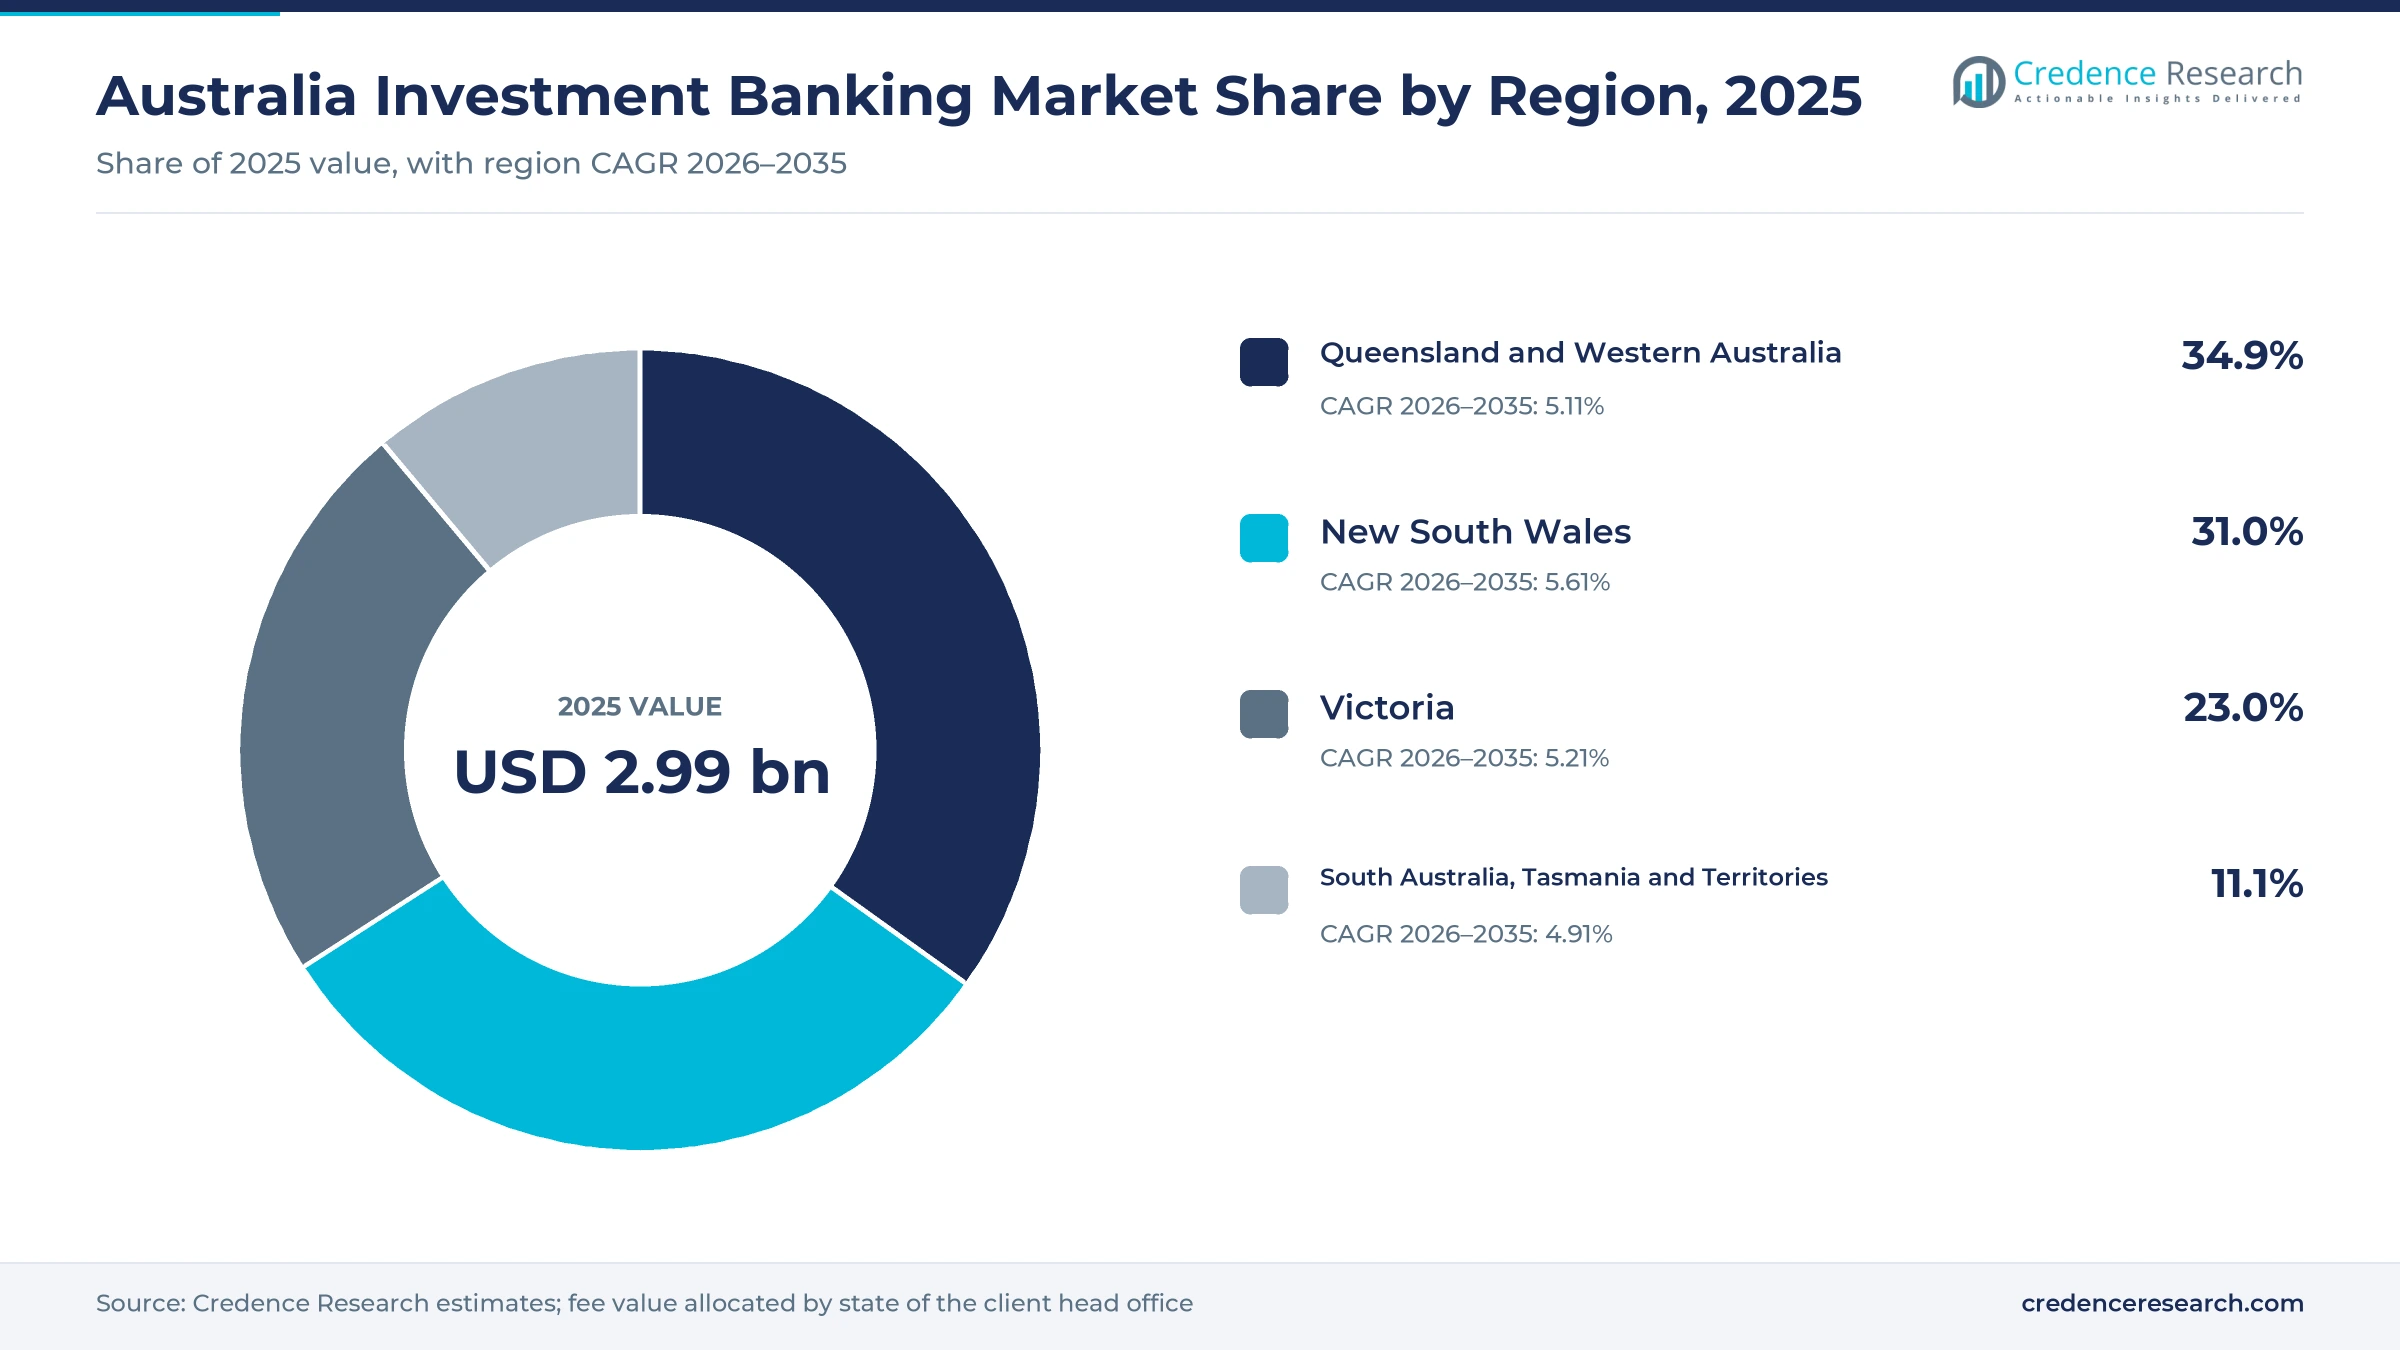
The Australia investment banking market was valued at USD 2.99 billion in 2025 and is projected to increase from USD 3.16 billion in 2026 to USD 5.02 billion by 2035, registering a CAGR of 5.27% during 2026–2035. Demand comes from listed companies that raise equity and debt, financial sponsors that buy and sell assets, superannuation funds that deploy growing pools of capital, and governments that fund infrastructure. Queensland and Western Australia held the largest regional share, 34.9% in 2025, because mining, energy and resource companies generate large takeover and capital raising mandates. New South Wales is the fastest-growing region at 5.61% a year, as Sydney concentrates sponsors, bank deal teams and listed company head offices. Superannuation assets reached about $4.4 trillion in March 2026, which keeps institutional demand for new deals high. In turn, the mandatory merger notification regime that began on Jan. 1, 2026, is changing how advisers plan deal timetables and regulatory approvals.
Which advisory and underwriting fees does the estimate cover?
The estimate measures fee value earned in Australia for mergers and acquisitions advice, equity capital markets underwriting, debt capital markets underwriting and the arrangement of syndicated loans. It counts success fees, retainer fees, underwriting fees and arrangement fees paid by corporate issuers, financial sponsors, financial institutions and government entities. Values include mandates won through direct client relationships, competitive tenders and referrals.
The estimate excludes sales and trading income, wealth management fees, research subscriptions, lending margins and balance sheet income. The value chain runs from issuers, sellers and buyers through global investment banks, domestic universal banks, diversified investment groups and independent advisory firms to institutional investors that buy the shares, bonds and loans those mandates create.
Australia Investment Banking Market Insights
- The Australia investment banking market was valued at USD 2.99 billion in 2025 and is projected to reach USD 5.02 billion by 2035, registering a CAGR of 5.27% during 2026–2035.
- Queensland and Western Australia held a 34.9% share of 2025 fee value, because resource companies generate many takeover and capital raising mandates.
- M&A advisory led with a 38.0% share of 2025 value, because takeovers, schemes and sponsor deals carry the largest single fees.
- New listings on the ASX rose to 92 in 2025 from 67 in 2024, while capital raised in new listings climbed 54% to $6.3 billion.
- A Macquarie Asset Management consortium proposed an A$11.7 billion takeover of Qube in February 2026, with Macquarie Capital and UBS among the advisers.
M&A advisory leads while equity underwriting grows fastest
Why does M&A advisory lead fee value?
Based on service type, the market is categorized into M&A advisory, ECM underwriting, DCM underwriting and syndicated loan arrangement. M&A Advisory led with a 38.0% share of 2025 value, because takeovers, schemes of arrangement and sponsor deals pay the largest single fees. ECM Underwriting grows fastest at 5.92% a year, as more companies list and listed companies return to follow-on raisings.
How do corporate issuers and sponsors split fee demand?
Based on customer type, the market is categorized into corporate issuers, financial sponsors, financial institutions and government entities. Corporate Issuers led with a 52.0% share of 2025 value, because listed companies buy most equity, debt and advisory services. Financial Sponsors grow fastest at 5.84% a year, as private equity and infrastructure funds buy and sell more Australian assets.
Why are independent advisory firms gaining share?
Based on institution type, the market is categorized into global investment banks, domestic universal banks, diversified investment groups and independent advisory firms. Global Investment Banks led with a 42.0% share of 2025 value, because they run the largest underwriting books and offshore investor networks. Independent Advisory Firms grow fastest at 6.06% a year, as boards seek conflict-free advice on takeovers.
How do success and underwriting fees shape revenue?
Based on revenue model, the market is categorized into success fees, retainer fees, underwriting fees and arrangement fees. Success Fees led with a 40.0% share of 2025 value, because most advisory mandates pay only when a deal completes. Underwriting Fees grow fastest at 5.71% a year, as listings and follow-on equity raisings lift committed underwriting work.
| Segment Group | Leading Sub-segment | Share, 2025 | Fastest-growing Sub-segment | CAGR, 2026–2035 |
|---|---|---|---|---|
| By Service Type | M&A Advisory | 38.0% | ECM Underwriting | 5.92% |
| By Customer Type | Corporate Issuers | 52.0% | Financial Sponsors | 5.84% |
| By Institution Type | Global Investment Banks | 42.0% | Independent Advisory Firms | 6.06% |
| By Revenue Model | Success Fees | 40.0% | Underwriting Fees | 5.71% |
Request a Free Sample
Fill in your details and we'll send you a free sample report.
- Sample data tables & charts
- Research methodology
Super assets, ownership change and listings drive demand
How does institutional capital deployment lift deal flow?
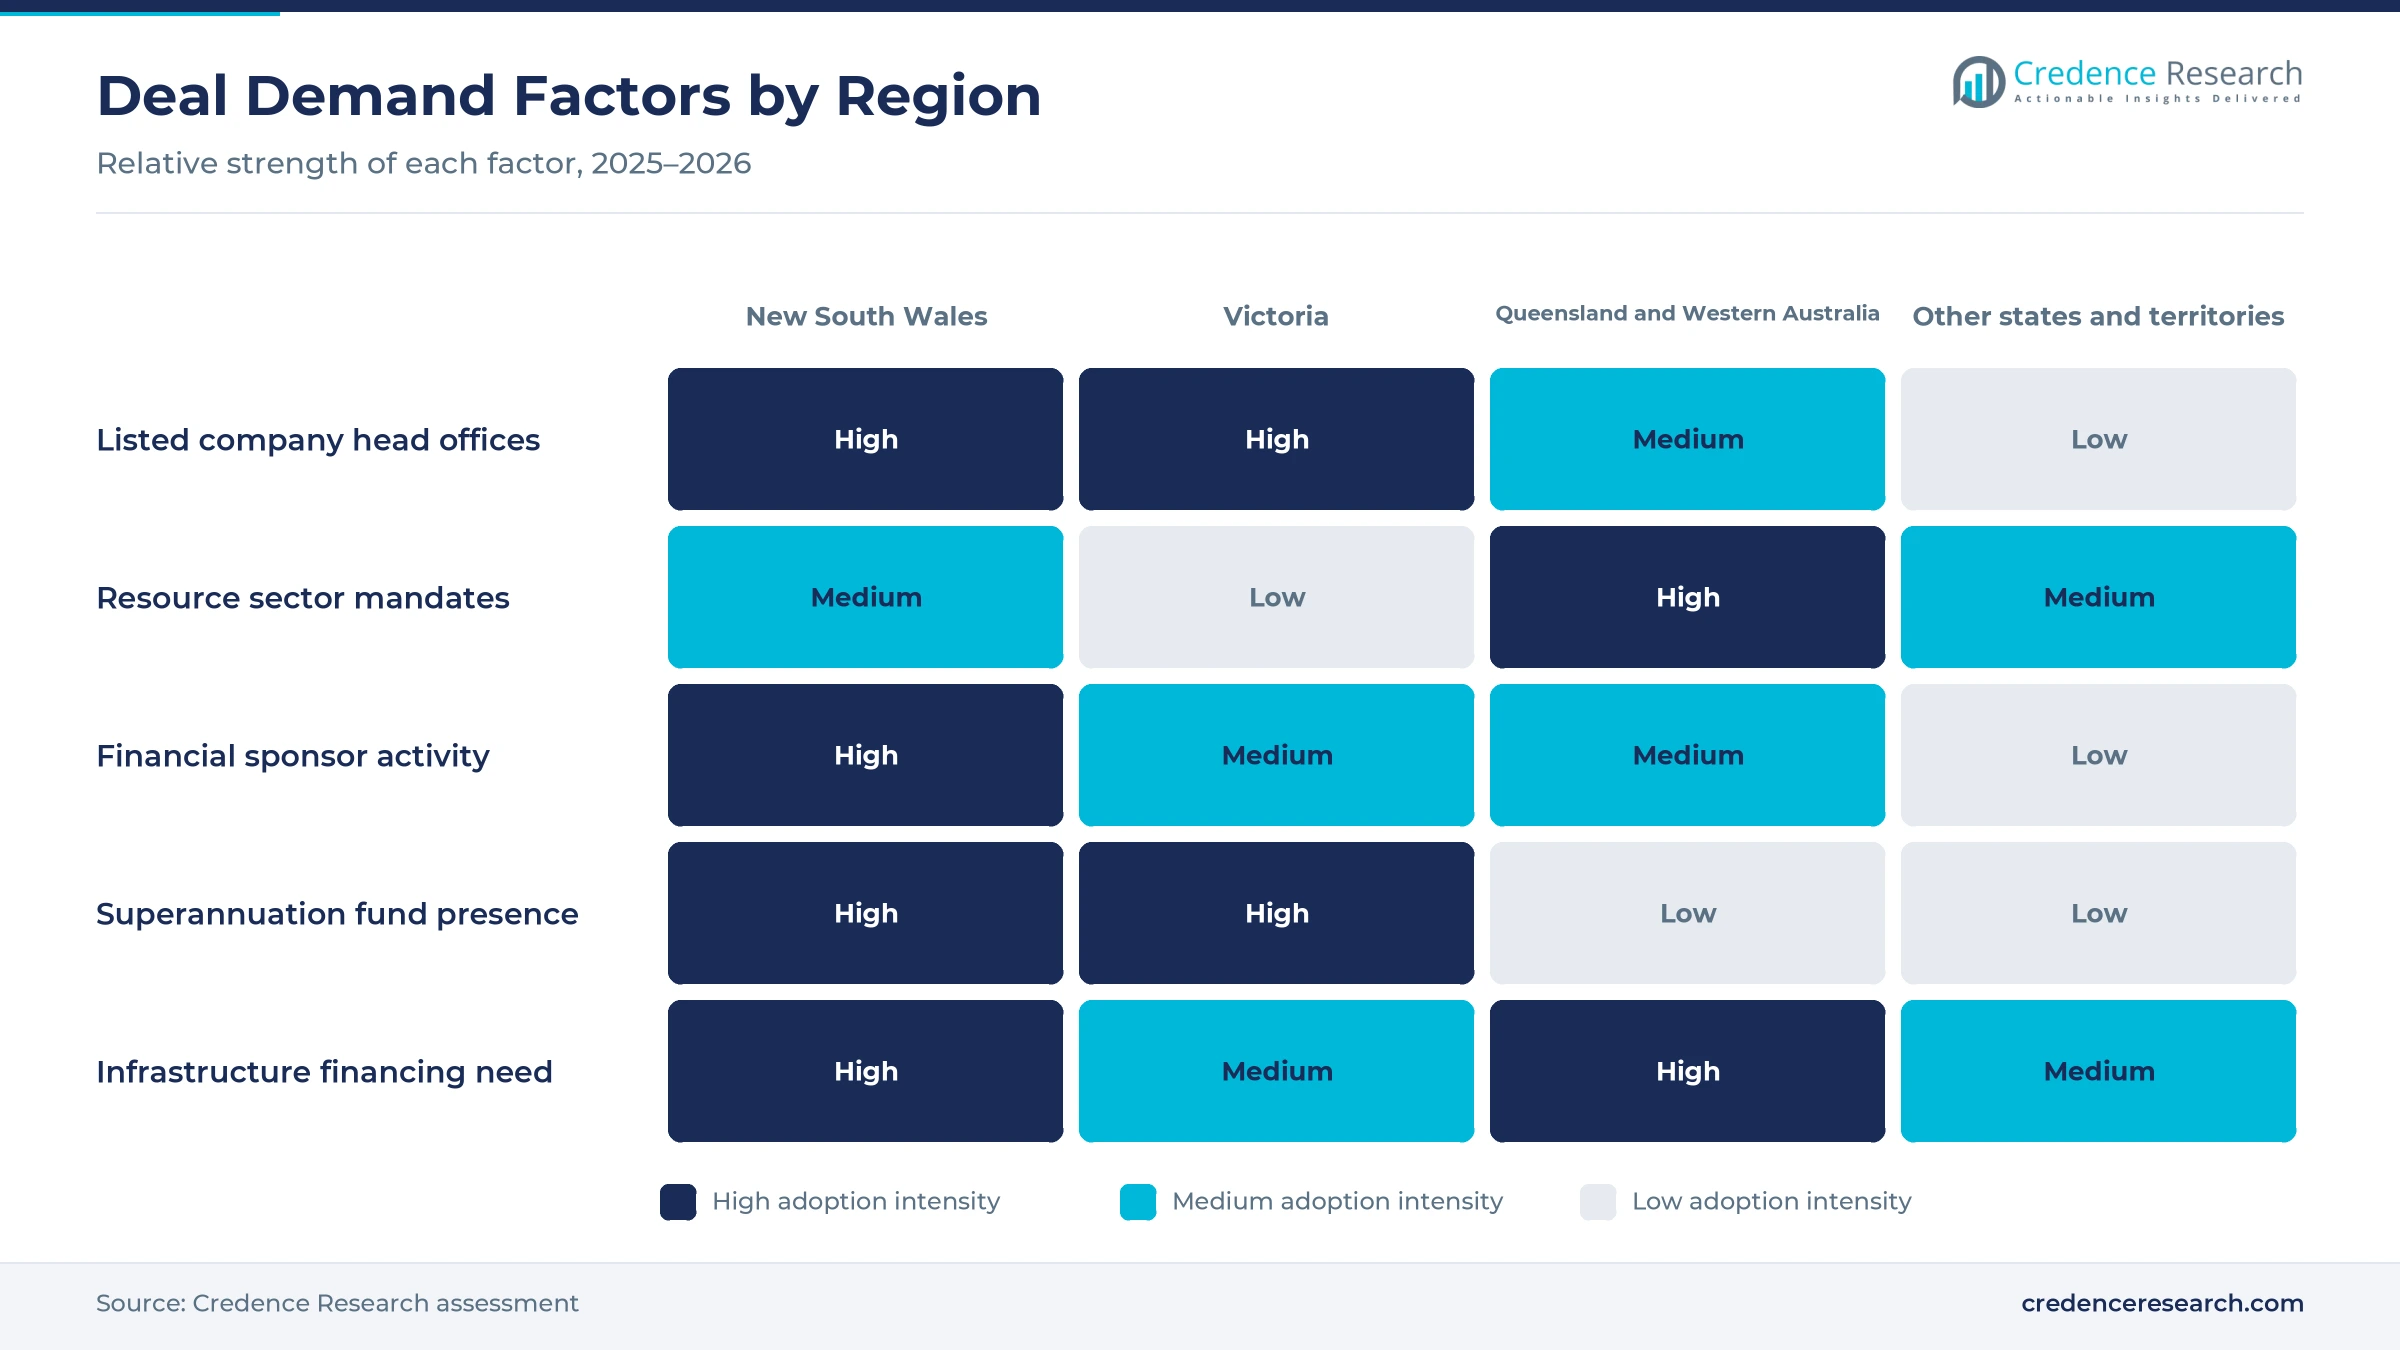
Institutional capital deployment lifts deal flow, because large funds need a steady supply of new shares, bonds and assets to invest in. Total superannuation assets reached $4,437.9 billion at March 31, 2026, up 7.9% over the year, according to the prudential regulator. The conduct regulator said in November 2025 that it expects super trustees to take a greater role in public investments and private credit. Australia's listed domestic market capitalization also rose to about 113.9% of GDP in 2025 from 98.9% in 2024, according to World Bank data. As a result, demand for equity underwriting grows, as funds back new listings, placements and cornerstone bids.
Why does domestic ownership restructuring sustain M&A?
Domestic ownership restructuring sustains M&A, because Australian buyers, sponsors and boards keep reshaping who owns listed and private assets. Australian acquirers made up nearly two-thirds of 2025 deals by number and more than 60% by value, while close to 30% of deal value involved a financial sponsor, according to law firm deal data. Of 23 ASX companies that received takeover bids announced in 2025, 15 changed control. In February 2026, a Macquarie Asset Management consortium proposed an A$11.7 billion takeover of Qube, the largest proposal since 2024. In turn, financial sponsors grow at 5.84% a year, the fastest customer rate, as funds recycle venture capital funds and infrastructure capital.
How does capital raising execution reform lift ECM work?
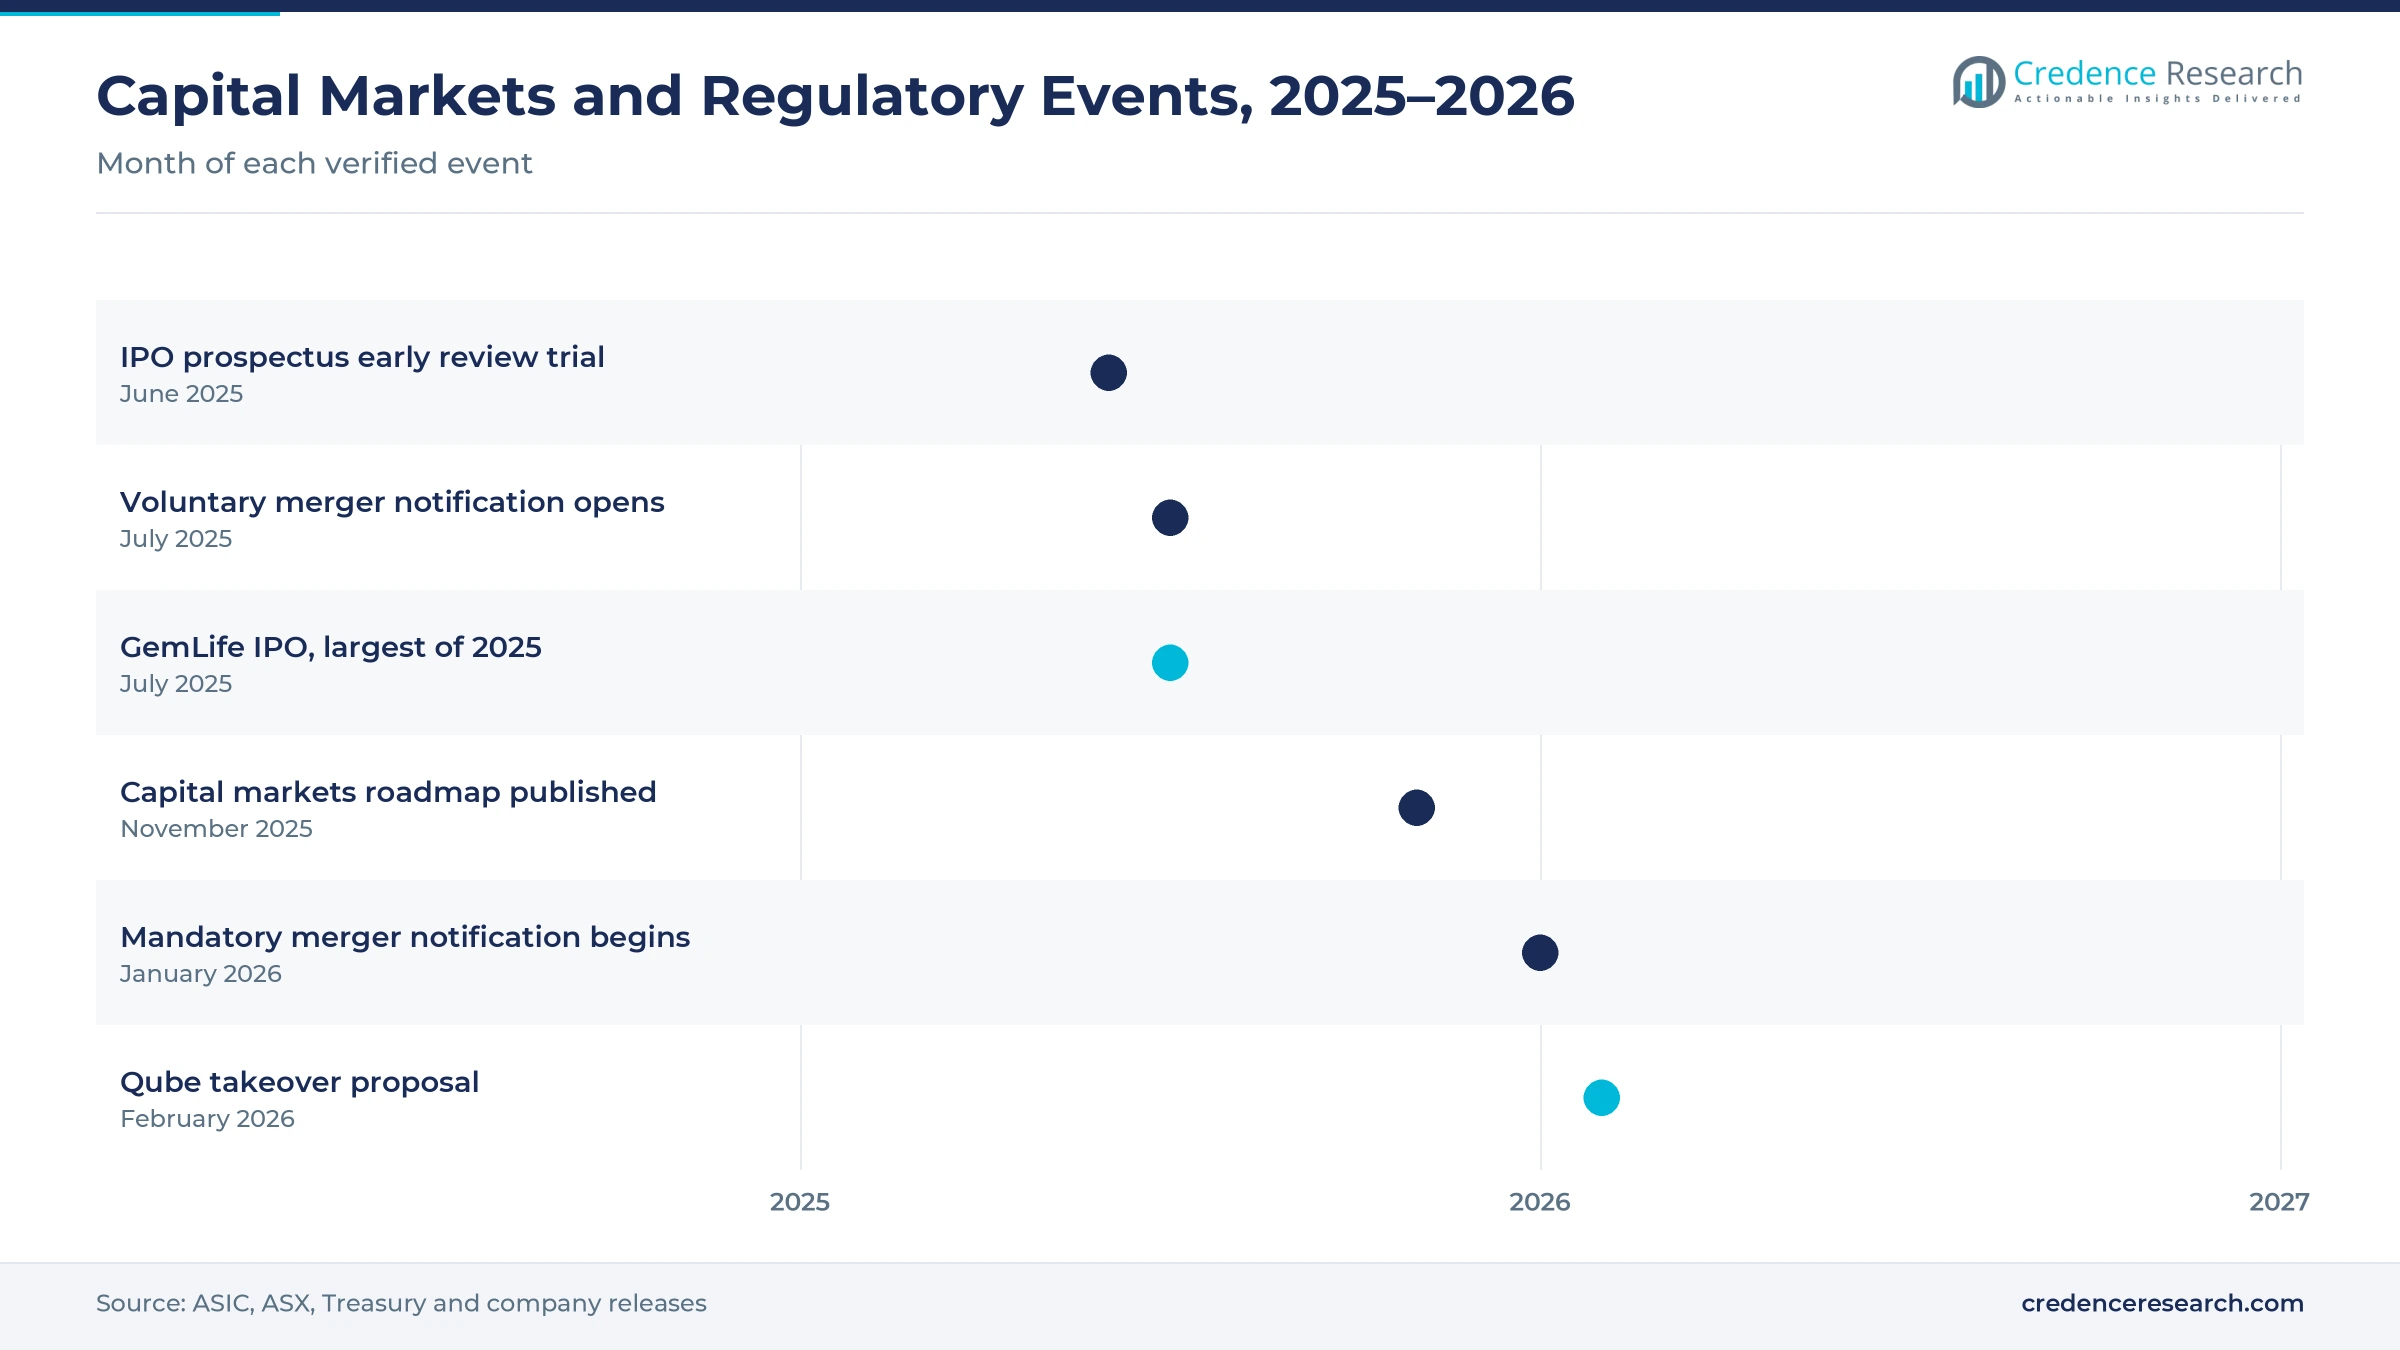
Capital raising execution reform lifts ECM work, because shorter and more certain timetables make listings easier to plan. The conduct regulator began a two-year early review trial for IPO prospectuses on June 10, 2025, for issuers with a market capitalization above $100 million, aiming to shorten timetables by up to one week. Its roadmap for public and private markets, published on Nov. 5, 2025, also backed streamlined IPOs and more foreign listings, according to the conduct regulator. New listings then rose to 92 in 2025 and raised $6.3 billion in new capital. As a result, underwriting fees grow at 5.71% a year, the fastest revenue model rate, as more IPOs reach market.
Why do offshore bond issuers widen debt underwriting?
Offshore bond issuers widen debt underwriting, because foreign borrowers now use the Australian dollar market for larger and more frequent deals. Year-to-date new bond issuance reached a record A$275 billion by late October 2025, of which Kangaroo bonds from offshore issuers made up A$62.4 billion. The average Kangaroo deal size also rose to A$474 million in 2025 from A$350 million a year earlier. In July 2026, the International Finance Corporation priced an A$1.5 billion Kangaroo bond, its largest in the market. In turn, DCM underwriting keeps a steady share of fee value, as assets under management grow and investors seek high-grade bonds.
Merger control and private credit reshape deal work
How is the shift to mandatory merger control changing deals?
The shift to mandatory merger control is changing deal timetables, because qualifying acquisitions now need clearance before they complete. Parties could notify the competition regulator voluntarily from July 1, 2025, and notification became mandatory from Jan. 1, 2026. The ASX is also consulting on limits to scrip issued by listed bidders without shareholder approval. Takeover bids announced in 2025 recorded a 79% success rate, which shows that well-planned deals still close. As a result, M&A advisory keeps a 38.0% share of 2025 value, as boards pay for regulatory planning, competition analysis and longer deal processes that make adviser work more complex and more valuable.
Why is the rise of private credit reshaping debt mandates?
The rise of private credit is reshaping debt mandates, because borrowers can now choose between bank loans, bonds and private funds. The conduct regulator described private credit as a rapidly expanding $200 billion sector in September 2025. It then committed in November 2025 to refresh funds management guidance and to keep surveillance of private credit managers. Superannuation funds are also expected to take a larger role in private credit. In turn, syndicated loan arrangement grows more slowly than other services, as some mid-market borrowers move to private lenders, while banks arrange loans that are later sold to life and general insurers and funds.
Can foreign listings open a new ECM growth path?
Foreign listings offer a new ECM growth path, because offshore companies want access to Australian superannuation capital. International listings on the ASX rose to 16 in 2025 from four in 2024. Six new listings in 2025 had a market capitalization above $1 billion, double the 2024 number. The conduct regulator also asked market operators and the government in November 2025 to consider settings that support more foreign listings. As a result, global investment banks hold a 42.0% share of 2025 value, as they bring offshore issuers and investors to Australian deals and run the largest books.
Is there room to grow conflict-free advisory work?
Conflict-free advisory work has room to grow, because boards facing takeover bids want advice separate from lending and underwriting. Close to 30% of 2025 deal value involved a financial sponsor, which often brings competing bidders and complex structures. Schemes of arrangement also remained the preferred structure for public M&A in 2025, which requires independent board advice. In addition, the A$11.7 billion Qube proposal in February 2026 used separate advisers for buyer and target. In turn, independent advisory firms grow at 6.06% a year, the fastest institution rate, as targets seek merger advice without balance sheet conflicts.
Fee pressure, deal timing and talent costs test advisers
How does fee pressure squeeze underwriting margins?
Fee pressure squeezes underwriting margins, because large issuers run competitive tenders and split mandates across several banks. As a result, each bank earns a smaller share of the gross spread on large equity and debt deals. Superannuation funds that act as cornerstone investors also negotiate harder on pricing and allocations. Banks respond by bundling lending, hedging and research coverage, and by focusing on mandates where they lead the book.
Why does deal timing risk delay success fees?
Deal timing risk delays success fees, because advisers are paid mostly when a transaction completes. Merger clearance under the mandatory regime, foreign investment approval and market volatility can push completions into later periods. In turn, a delayed or failed deal leaves banks with costs but no fee. Advisers respond with larger retainer fees, staged milestone payments and earlier regulatory planning that reduces the chance of late surprises.
How do talent costs affect smaller advisory teams?
Talent costs affect smaller advisory teams, because experienced bankers in Sydney and Melbourne are in high demand across global, domestic and independent firms. Each senior hire raises fixed costs, while fee income remains uneven from year to year. As a result, smaller firms can struggle to keep sector coverage teams. Banks respond with deferred pay, sector specialization, offshore support teams and partnerships that share deal work across regions.
Why does a shrinking listed company base limit mandates?
A shrinking listed company base limits some mandates, because takeovers and delistings remove issuers that once paid for follow-on raisings. The number of listed domestic companies fell to 1,782 in 2025 from 1,977 in 2021. In turn, fewer small and mid-cap issuers come to market each year. Banks respond by targeting private companies, sponsor exits and offshore issuers, while regulators work to simplify listings and disclosure rules.
Resource states lead while new South Wales grows fastest
| Region | Value, 2025 (USD billion) | Share, 2025 | CAGR, 2026–2035 |
|---|---|---|---|
| Queensland and Western Australia | 1.05 | 34.9% | 5.11% |
| New South Wales | 0.93 | 31.0% | 5.61% |
| Victoria | 0.69 | 23.0% | 5.21% |
| South Australia, Tasmania and Territories | 0.33 | 11.1% | 4.91% |
Why do Queensland and Western Australia hold the largest share?
Queensland and Western Australia held a 34.9% share of 2025 value and grow at 5.11% a year, because mining, energy and gold companies generate many takeover and capital raising mandates. Gold sector mega-deals in 2025 included Gold Fields' A$3.7 billion acquisition of Gold Road. Western Australia also posted the fastest state population growth at 2.1% in the year to March 2026, which supports new infrastructure financing.
How does new South Wales lead fee growth?
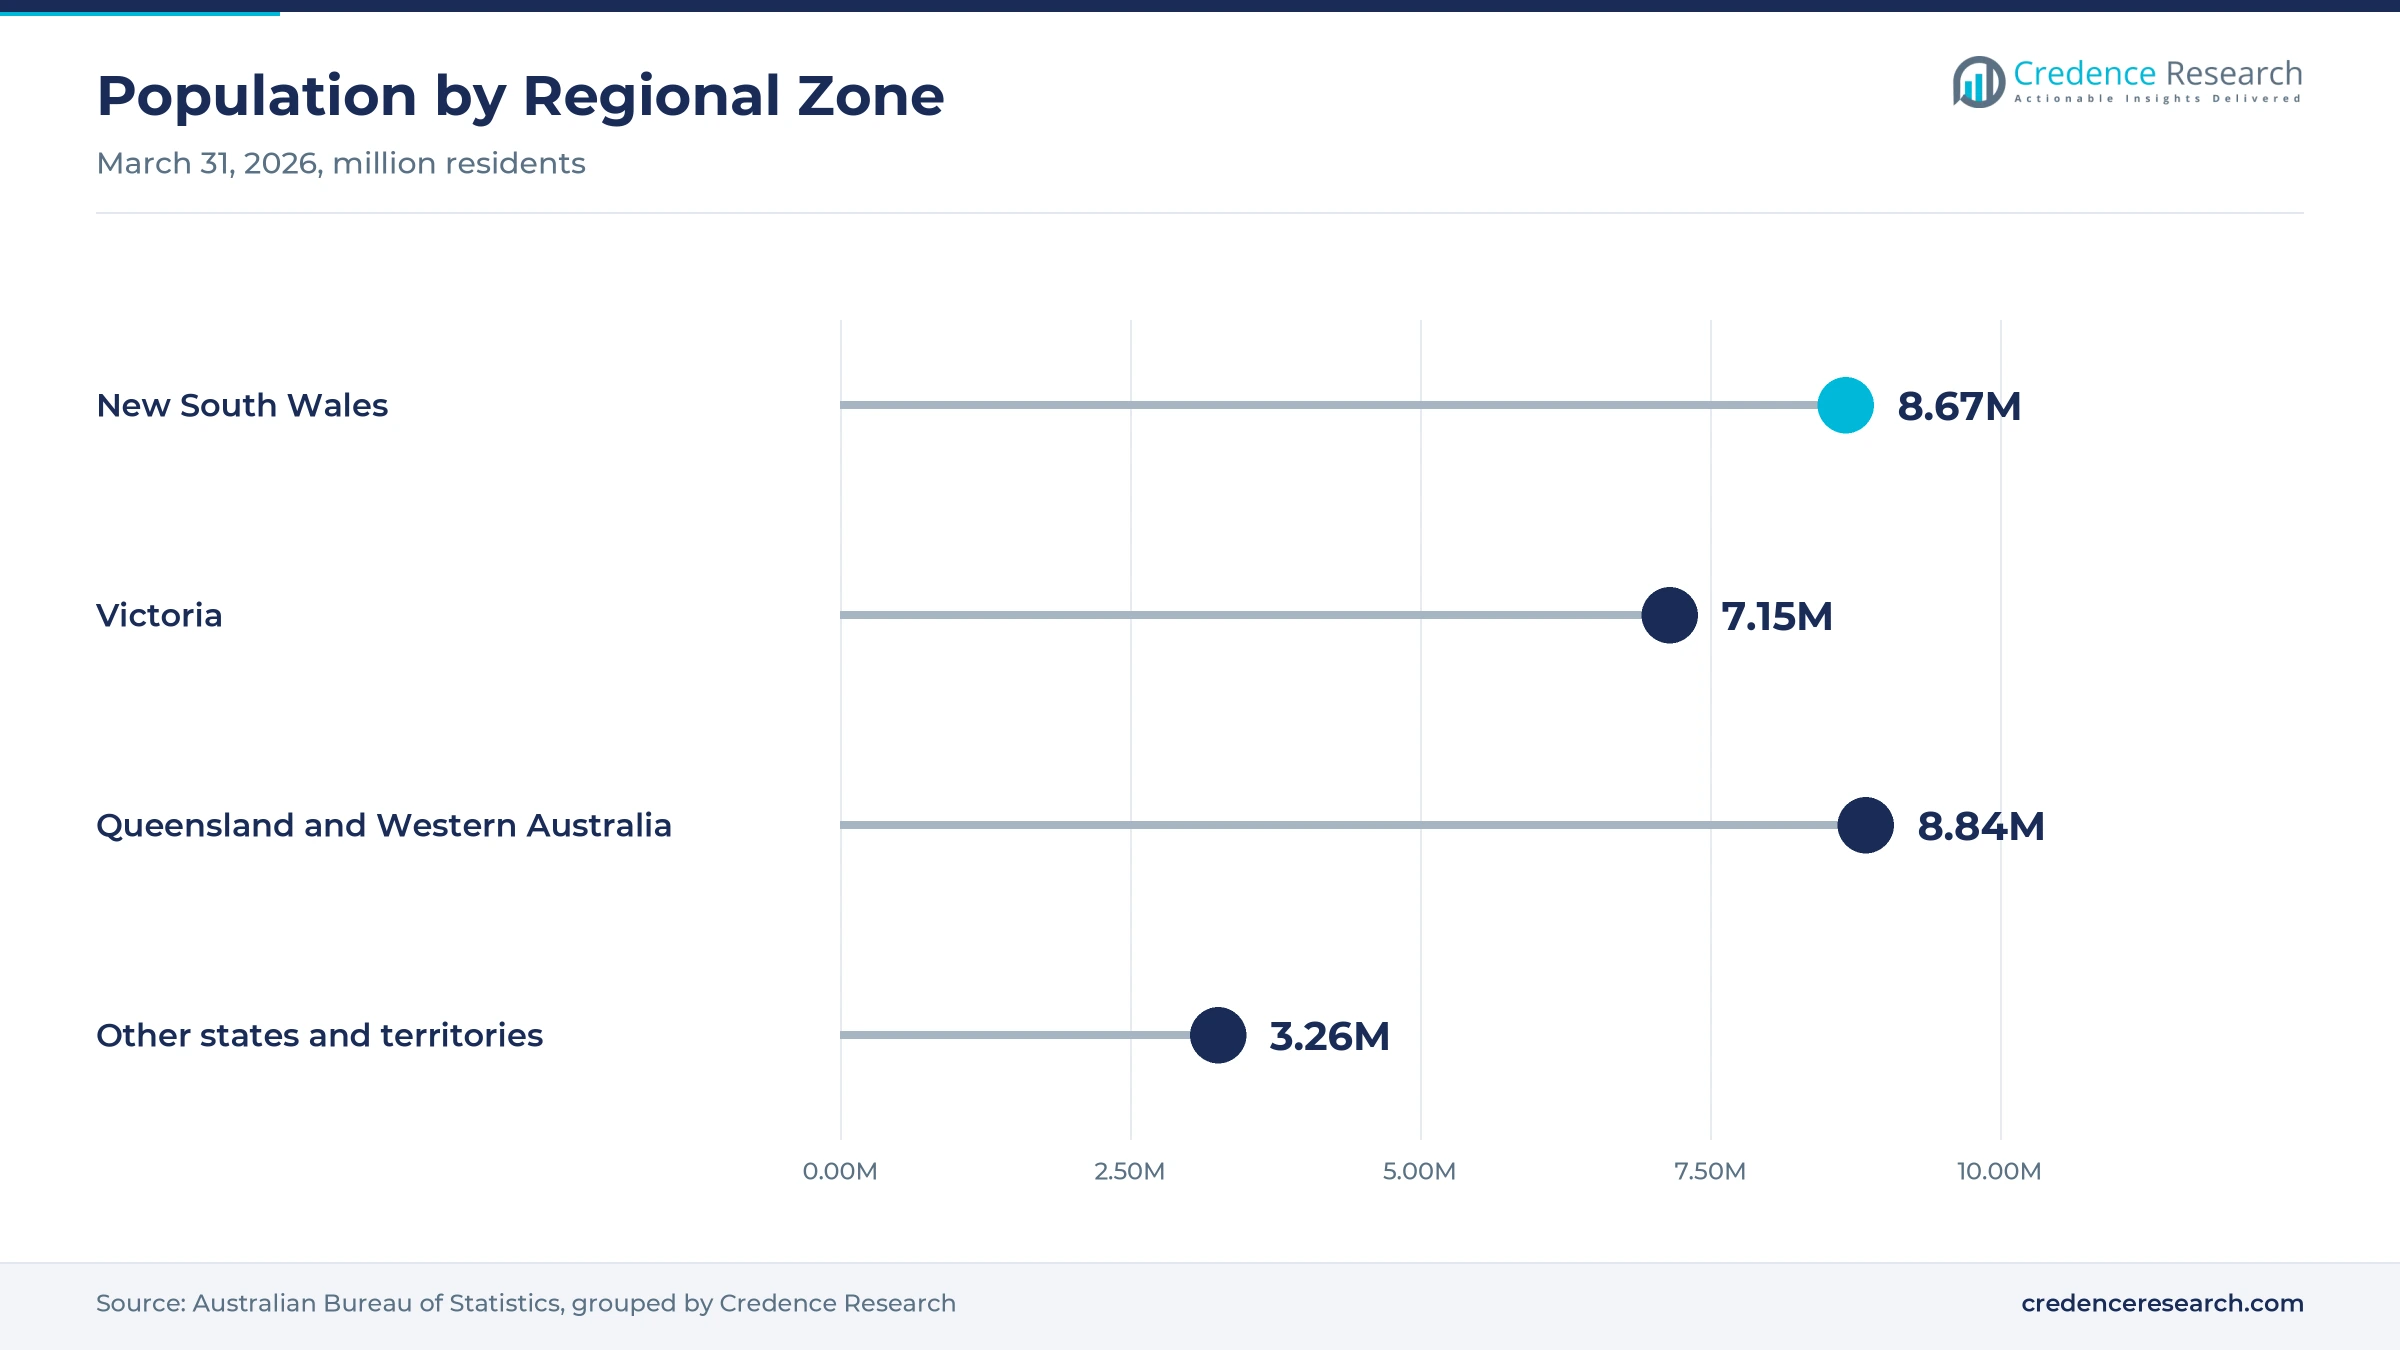
New South Wales held a 31.0% share of 2025 value and grows fastest at 5.61% a year, because Sydney concentrates bank deal teams, private equity funds and listed company head offices. The state had about 8.67 million residents at March 31, 2026, the largest of any state. As a result, sponsor-led deals, IPOs and bond issues arranged in Sydney keep growing faster than resource mandates in other zones.
How does Victoria support deal advisory demand?
Victoria held a 23.0% share of 2025 value and grows at 5.21% a year, because Melbourne hosts large superannuation funds, industrial companies and health care groups that buy advisory and underwriting services. The state added about 109,500 residents in the year to March 2026, a growth rate of 1.6%. This growth supports infrastructure, property and consumer deals that need equity and debt financing.
What drives demand in South Australia, Tasmania and the territories?
South Australia, Tasmania and the territories held 11.1% of 2025 value and grow at 4.91% a year, because these zones host fewer listed companies and sponsors. However, defense, energy and government projects still create debt and advisory mandates for banks based in Sydney and Melbourne.
IPOs, takeover bids and regulatory reform from 2025 to 2026
| Development | Status and market relevance |
|---|---|
| In June 2025, the conduct regulator started a two-year early review trial for IPO prospectuses. | Aims to shorten IPO timetables by up to one week |
| In July 2025, GemLife Communities completed the largest ASX IPO of 2025, raising $750 million. | J.P. Morgan and Morgan Stanley acted as joint lead managers |
| In June 2025, Virgin Australia raised about $685 million in its ASX IPO. | Goldman Sachs, UBS and Barrenjoey underwrote the offer |
| In January 2026, the mandatory merger notification regime came into force. | Qualifying acquisitions now need clearance before completion |
| In February 2026, a Macquarie Asset Management consortium proposed an A$11.7 billion takeover of Qube. | Macquarie Capital advised the buyers and UBS advised Qube |
Data rooms, bookbuilding and analytics change deal execution
- Virtual data rooms let buyers, sponsors and advisers review company documents online, which shortens due diligence on takeovers and sales.
- Electronic bookbuilding platforms collect investor bids for IPOs, placements and bonds in real time, which helps banks price deals faster.
- Deal analytics tools screen targets, model valuations and track comparable transactions, which helps advisers prepare pitches and fairness work.
- Digital regulatory portals handle merger notifications and foreign investment filings online, which helps advisers manage approval timetables.
Need a Custom Version of This Report?
Tailor the scope, geography, or segments to your exact requirements.
- Custom geography or segment scope
- Direct access to our analyst team
Global, domestic and independent banks compete for mandates
Competition is led by global investment banks, domestic universal banks, diversified investment groups and independent advisory firms. Macquarie Capital advised the Macquarie Asset Management consortium on its A$11.7 billion proposal for Qube in February 2026, while UBS advised Qube. Goldman Sachs and UBS underwrote the Virgin Australia IPO in June 2025 alongside Barrenjoey. Barclays expanded its Sydney investment banking team with two managing directors in January 2022 to cover debt capital markets and financial sponsors. NAB publishes client survey results that rank it as a leading corporate and institutional relationship bank. Rivals compete on sector coverage, balance sheet strength, offshore investor networks, regulatory know-how and conflict-free advice, while superannuation funds and sponsors push for lower fees and faster execution.
Companies profiled and their roles in this market
| Company | Type | Role in the market |
|---|---|---|
| Macquarie Capital | Diversified investment group | Advised buyers on the A$11.7 billion Qube proposal in February 2026 |
| UBS | Global investment bank | Advised Qube and underwrote the Virgin Australia IPO |
| Goldman Sachs | Global investment bank | Joint lead manager on the Virgin Australia IPO in June 2025 |
| Barclays | Global investment bank | Added Sydney managing directors for debt markets and sponsors |
| NAB | Domestic universal bank | Corporate and institutional bank serving large Australian companies |
Credence Research view on Australian deal advisory fees
Credence Research's view is that Australian advisory and underwriting fees will grow steadily because superannuation funds, financial sponsors and listed companies keep deploying and recycling capital. M&A advisory remains the largest service, while equity underwriting, sponsor mandates and independent advice gain share. Merger control and IPO reform are reshaping deal execution, although fee pressure and deal timing still limit returns. Banks that combine sector coverage, offshore investor reach and regulatory planning should win the largest mandates in each deal cycle.
How the Australian deal fee estimate was built
The report uses 2025 as the base year on a calendar basis, and market values come from the Credence Research model. That model combines exchange capital raising statistics, regulator releases on superannuation assets, IPO reform and private credit, merger regime announcements, World Bank market data, population statistics and company announcements on deals. Segment splits and regional growth rates are Credence Research estimates, while regional shares follow the client-defined split. Sources used are public reports, official statistics, law firm deal reviews, regulator releases and company releases, and no interviews or surveys were used.
Capital deployment and listings carry fee growth to 2035
Fee value is expected to reach USD 5.02 billion by 2035, a 5.27% CAGR during 2026–2035, as superannuation capital, sponsor activity and new listings keep demand rising. Growth should stay uneven through 2027 while advisers adjust to mandatory merger control. After that, IPOs, foreign listings and offshore bond issuers will carry more growth. Faster listing rules would lift equity underwriting, while a long market downturn would delay success fees. Banks with strong sector teams and investor networks are expected to gain the most.
Frequently Asked Questions
How big is the Australia investment banking market?
Which service leads Australian advisory and underwriting fees?
Which region leads the Australia investment banking market?
How many companies listed on the ASX in 2025?
How does merger reform affect deal advisers?
Which customer group is growing fastest?
Who are the leading investment banks in Australia?
What are the main challenges for advisers and underwriters?
Table of Content
Chapter 1 Market Segmentation
- 1.1 Segmentation Framework
- 1.1.1 Product and Service Classification
- 1.1.2 Application and End-Use Classification
- 1.1.3 Technology and Solution Classification
- 1.1.4 Customer and Distribution Channel Classification
- 1.1.5 Geographic Segmentation
- 1.1.6 Market Segment Definitions and Boundaries
- 1.2 By Service Type
- 1.2.1 M&A Advisory
- 1.2.2 ECM Underwriting
- 1.2.3 DCM Underwriting
- 1.2.4 Syndicated Loan Arrangement
- 1.3 By Customer Type
- 1.3.1 Corporate Issuers
- 1.3.2 Financial Sponsors
- 1.3.3 Financial Institutions
- 1.3.4 Government Entities
- 1.4 By Institution Type
- 1.4.1 Global Investment Banks
- 1.4.2 Domestic Universal Banks
- 1.4.3 Diversified Investment Groups
- 1.4.4 Independent Advisory Firms
- 1.5 By Revenue Model
- 1.5.1 Success Fees
- 1.5.2 Retainer Fees
- 1.5.3 Underwriting Fees
- 1.5.4 Arrangement Fees
Chapter 2 Introduction
- 2.1 Report Objectives and Scope
- 2.2 Product Definition and Industry Terminology
- 2.3 Market Inclusions and Exclusions
- 2.4 Research Process
- 2.4.1 Primary Research and Expert Interviews
- 2.4.2 Secondary Research and Source Review
- 2.4.3 Top-Down and Bottom-Up Estimation
- 2.4.4 Data Triangulation and Verification
- 2.5 Market Size Measurement Basis
- 2.5.1 2025: USD 2.99 billion → 2035: USD 5.02 billion
- 2.6 Historical and Forecast Reference Periods
- 2.6.1 Historical Period: 2018-2025
- 2.6.2 Base Year: 2025
- 2.6.3 Forecast Period: 2025-2035
- 2.7 Research Assumptions and Limitations
Chapter 3 Executive Summary
- 3.1 Market Snapshot and Key Findings
- 3.2 Base-Year Market Size, 2025
- 3.3 Forecast Market Size, 2035
- 3.4 Revenue and Volume Growth Outlook
- 3.5 Key Demand and Supply Indicators
- 3.6 Leading Market Segments
- 3.7 Fastest-Growing Market Opportunities
- 3.8 Regional Performance Highlights
- 3.9 Technology and Industry Transformation
- 3.10 Competitive Landscape Summary
- 3.11 Analyst View and Strategic Implications
Chapter 4 Australia Investment Banking Market Trends and Developments
- 4.1 Historical Industry Development, 2018-2025
- 4.2 Recent Market Trends and Developments
- 4.3 Demand and Customer Behavior Trends
- 4.4 Technology and Product Innovation
- 4.5 Artificial Intelligence, Automation and Digitalization
- 4.6 Local Manufacturing and Supply Chain Realignment
- 4.7 Industry Partnerships, Mergers and Acquisitions
- 4.8 Sustainability and Circular Economy Developments
- 4.9 Government and Private Sector Investment Trends
- 4.10 Emerging Business Models and Commercialization
- 4.11 Industry Developments and Announcements
Chapter 5 Australia Investment Banking Market Supply and Demand Analysis
- 5.1 Demand Trend and Consumption Analysis, 2018-2025
- 5.2 Demand Forecast, 2025-2035
- 5.3 Supply Chain Structure and Procurement Trends
- 5.4 Supply-Demand Gap and Bottlenecks
- 5.5 Import Dependence and Sourcing Structure
- 5.6 Regional Supply and Demand Concentration
Chapter 6 Australia Investment Banking Market Pricing Analysis
- 6.1 Pricing Structure and Measurement
- 6.2 Historical Pricing Trends, 2018-2025
- 6.3 Pricing Outlook, 2025-2035
- 6.4 Pricing by Product and Market Segment
- 6.5 Geographic Pricing Differences
- 6.6 Key Input, Energy, Labor and Logistics Costs
- 6.7 Contract Pricing and Purchasing Models
- 6.8 Pricing Sensitivity and Competitive Positioning
- 6.9 Price, Margin and Profitability Implications
Chapter 7 Australia Investment Banking Market Dynamics
- 7.1 Market Growth Drivers
- 7.1.1 Demand-Side Drivers
- 7.1.2 Technology and Innovation Drivers
- 7.1.3 Infrastructure and Investment Drivers
- 7.1.4 Regulatory and Policy Drivers
- 7.2 Market Restraints
- 7.2.1 Cost and Affordability Constraints
- 7.2.2 Technology and Adoption Barriers
- 7.2.3 Supply Chain and Operational Constraints
- 7.3 Market Challenges
- 7.3.1 Competitive Pressure and Margin Erosion
- 7.3.2 Skills, Infrastructure and Implementation Gaps
- 7.4 Emerging Market Opportunities
- 7.5 Market Dynamics Impact and Time-Horizon Assessment
Chapter 8 Australia Investment Banking Value Chain Analysis
- 8.1 Industry Value Chain Overview
- 8.2 Upstream Suppliers and Critical Inputs
- 8.3 Technology and Component Providers
- 8.4 Manufacturing or Service Delivery
- 8.5 Distribution, Channel Partners and Integrators
- 8.6 Downstream Applications and End Users
- 8.7 Value Addition and Profit Pools
- 8.8 Vertical Integration and Outsourcing
- 8.9 Supplier Concentration and Risk
- 8.10 Supply Chain Localization and Resilience
Chapter 9 Australia Investment Banking Market Regulations and Policies
- 9.1 Relevant Laws, Standards and Compliance Frameworks
- 9.2 Product, Service, Safety and Quality Requirements
- 9.3 Government Policies, Incentives and Subsidies
- 9.4 Imports, Exports and Trade Barriers
- 9.5 Public Procurement and Local Content Requirements
- 9.6 Data Protection, AI and Cybersecurity Compliance
- 9.7 Upcoming Policy Changes and Market Implications
Chapter 10 Australia Investment Banking Market Hotspots and Opportunities
- 10.1 Market Opportunity Mapping and Growth Hotspots
- 10.2 High-Growth Applications and Customer Groups
- 10.3 Underserved Markets and White-Space Opportunities
- 10.4 Emerging Technology and Product Opportunities
- 10.5 New Capacity and Investment Hotspots
- 10.6 Market Entry and Expansion Opportunities
- 10.7 Distribution and Partnership Opportunities
- 10.8 Near-Term and Long-Term Commercial Potential
- 10.9 Opportunity Attractiveness and Execution Risks
Chapter 11 Australia Investment Banking Market Outlook, 2025-2035
- 11.1 Market Size and Analysis
- 11.1.1 Revenue (Market Measurement: 2025: USD 2.99 billion → 2035: USD 5.02 billion)
- 11.1.2 Historical Market Size, 2018-2025
- 11.1.3 Base-Year Market Size, 2025
- 11.2 Market Forecast, 2025-2035
- 11.2.1 Revenue Forecast to 2035
- 11.2.2 CAGR and Year-on-Year Growth
- 11.2.3 Incremental Revenue Opportunity
- 11.3 Forecast Assumptions and Scenario Analysis
- 11.3.1 Base-Case Forecast
- 11.3.2 Optimistic and Conservative Scenarios
- 11.3.3 Technology, Pricing and Policy Sensitivities
- 11.4 Market Attractiveness and Growth Outlook
Chapter 12 Australia Investment Banking Market Segmentation and Outlook
- 12.1 Segmentation Summary and Market Shares, 2025
- 12.2 Largest and Fastest-Growing Segments
- 12.3 By Service Type - Market Size and Forecast, 2025-2035
- 12.3.1 Segment Definition and Scope
- 12.3.2 Historical Market Size, 2018-2025
- 12.3.3 Revenue Forecast, 2025-2035
- 12.3.4 Base-Year Market Share, 2025
- 12.3.5 Segment CAGR and Growth Drivers
- 12.3.6 Subsegment Market Size and Forecast
- 12.3.6.1 M&A Advisory
- 12.3.6.2 ECM Underwriting
- 12.3.6.3 DCM Underwriting
- 12.3.6.4 Syndicated Loan Arrangement
- 12.3.7 Subsegment Pricing and Adoption Trends
- 12.3.8 Leading Suppliers and Competition
- 12.3.9 Regional Demand and Opportunities
- 12.4 By Customer Type - Market Size and Forecast, 2025-2035
- 12.4.1 Segment Definition and Scope
- 12.4.2 Historical Market Size, 2018-2025
- 12.4.3 Revenue Forecast, 2025-2035
- 12.4.4 Base-Year Market Share, 2025
- 12.4.5 Segment CAGR and Growth Drivers
- 12.4.6 Subsegment Market Size and Forecast
- 12.4.6.1 Corporate Issuers
- 12.4.6.2 Financial Sponsors
- 12.4.6.3 Financial Institutions
- 12.4.6.4 Government Entities
- 12.4.7 Subsegment Pricing and Adoption Trends
- 12.4.8 Leading Suppliers and Competition
- 12.4.9 Regional Demand and Opportunities
- 12.5 By Institution Type - Market Size and Forecast, 2025-2035
- 12.5.1 Segment Definition and Scope
- 12.5.2 Historical Market Size, 2018-2025
- 12.5.3 Revenue Forecast, 2025-2035
- 12.5.4 Base-Year Market Share, 2025
- 12.5.5 Segment CAGR and Growth Drivers
- 12.5.6 Subsegment Market Size and Forecast
- 12.5.6.1 Global Investment Banks
- 12.5.6.2 Domestic Universal Banks
- 12.5.6.3 Diversified Investment Groups
- 12.5.6.4 Independent Advisory Firms
- 12.5.7 Subsegment Pricing and Adoption Trends
- 12.5.8 Leading Suppliers and Competition
- 12.5.9 Regional Demand and Opportunities
- 12.6 By Revenue Model - Market Size and Forecast, 2025-2035
- 12.6.1 Segment Definition and Scope
- 12.6.2 Historical Market Size, 2018-2025
- 12.6.3 Revenue Forecast, 2025-2035
- 12.6.4 Base-Year Market Share, 2025
- 12.6.5 Segment CAGR and Growth Drivers
- 12.6.6 Subsegment Market Size and Forecast
- 12.6.6.1 Success Fees
- 12.6.6.2 Retainer Fees
- 12.6.6.3 Underwriting Fees
- 12.6.6.4 Arrangement Fees
- 12.6.7 Subsegment Pricing and Adoption Trends
- 12.6.8 Leading Suppliers and Competition
- 12.6.9 Regional Demand and Opportunities
- 12.7 Segment Growth Comparison
- 12.8 Segment Attractiveness and Priority Matrix
Chapter 13 Australia Investment Banking End-Use and Application Market Outlook
- 13.1 End-Use Industry and Customer Demand Structure
- 13.2 Leading Applications and Customer Groups
- 13.3 End-Use Market Size, Share and Forecast
- 13.4 Major End-Use Industry Deep Dives
- 13.4.1 Customer Requirements and Use Cases
- 13.4.2 Demand and Replacement Cycles
- 13.4.3 Technical and Regulatory Considerations
- 13.4.4 Purchasing and Procurement Models
- 13.4.5 Leading Vendors and Distribution Channels
- 13.4.6 Forecast and Commercial Opportunities
- 13.5 Emerging Applications and Cross-Segment Demand
- 13.6 End-Use Industry Investment Priorities
Chapter 14 Australia Investment Banking Geographic Market Outlook, 2025-2035
- 14.1 Domestic Market Distribution and Demand Clusters
- 14.2 State- or Province-Wise Market Size and Forecast, 2025-2035
- 14.3 City and Metropolitan Market Outlook
- 14.4 Industrial, Manufacturing and Commercial Clusters
- 14.5 Geographic Concentration of Key End Users
- 14.6 Local Pricing and Purchasing Differences
- 14.7 Domestic Production Facilities and Capacity Map
- 14.8 Local Infrastructure and Project Pipeline
- 14.9 State-Level Policy and Incentive Differences
- 14.10 Subnational Investment Hotspots and Opportunities
- 14.11 Distribution and Logistics Networks
- 14.12 Domestic Competitive Footprint
Chapter 15 Australia Investment Banking Technology, Innovation and Sustainability Outlook
- 15.1 Technology Landscape and Maturity
- 15.2 Product, Process and Service Innovation
- 15.3 AI, Automation and Digital Tools in the Industry
- 15.4 Technology Adoption and Performance Benchmarking
- 15.5 Innovation Pipeline and R&D Investment
- 15.6 Energy Efficiency and Resource Management
- 15.7 Sustainability, Recycling and Circularity
- 15.8 Technology Roadmap, 2025-2035
- 15.9 Risks of Obsolescence and Technology Substitution
Chapter 16 Australia Investment Banking Market Key Strategic Imperatives
- 16.1 Growth and Market Entry Priorities
- 16.2 High-Return Products and Segments
- 16.3 Pricing, Profitability and Cost Optimization
- 16.4 Technology Investment and Product Differentiation
- 16.5 Supply Chain Localization and Resilience
- 16.6 Distribution and Customer Acquisition
- 16.7 Partnership, Acquisition and Capacity Strategy
- 16.8 Regional Expansion Priorities
- 16.9 Short-, Medium- and Long-Term Actions
Chapter 17 Competition Outlook
- 17.1 Industry Competition Characteristics
- 17.2 Market Structure and Concentration
- 17.3 Market Share and Competitive Positioning, 2025
- 17.4 Company-Wise Revenue and Product Benchmarking
- 17.5 Production and Service Capacity Benchmarking
- 17.6 Technology, Pricing and Differentiation
- 17.7 Regional Footprint and Distribution Strength
- 17.8 Mergers, Acquisitions and Strategic Alliances
- 17.9 New Entrants and Competitive Threats
- 17.10 Porter's Five Forces and Industry Attractiveness
- 17.11 Competitive Outlook, 2025-2035
Chapter 18 Company Profiles
- 18.1 Company Coverage and Selection Criteria
- 18.2 Barclays
- 18.2.1 Business Description
- 18.2.2 Company Ownership and Geographic Presence
- 18.2.3 Product and Service Portfolio
- 18.2.4 Manufacturing and Operating Footprint
- 18.2.5 Financial Performance and Investment
- 18.2.6 Market Share and Competitive Position
- 18.2.7 Technology and Innovation Capabilities
- 18.2.8 Strategic Alliances or Partnerships
- 18.2.9 Recent Developments
- 18.2.10 Growth Strategy and Outlook
- 18.3 Goldman Sachs
- 18.4 Macquarie Capital
- 18.5 UBS
- 18.6 NAB
- 18.7 Other Relevant Market Participants
Note: Every listed company is profiled on the structure shown under the first company. The company list is preliminary and may change based on research findings, market developments, data availability and client requirements.
Chapter 19 Disclaimer
- 19.1 Research and Forecast Disclaimer
- 19.2 Data Source and Estimation Limitations
Note: The depth of individual sections depends on data availability for this market. Volume, capacity, trade and other unit-based metrics are included where applicable.

