
Licensed installment credit moves into stores and big buys
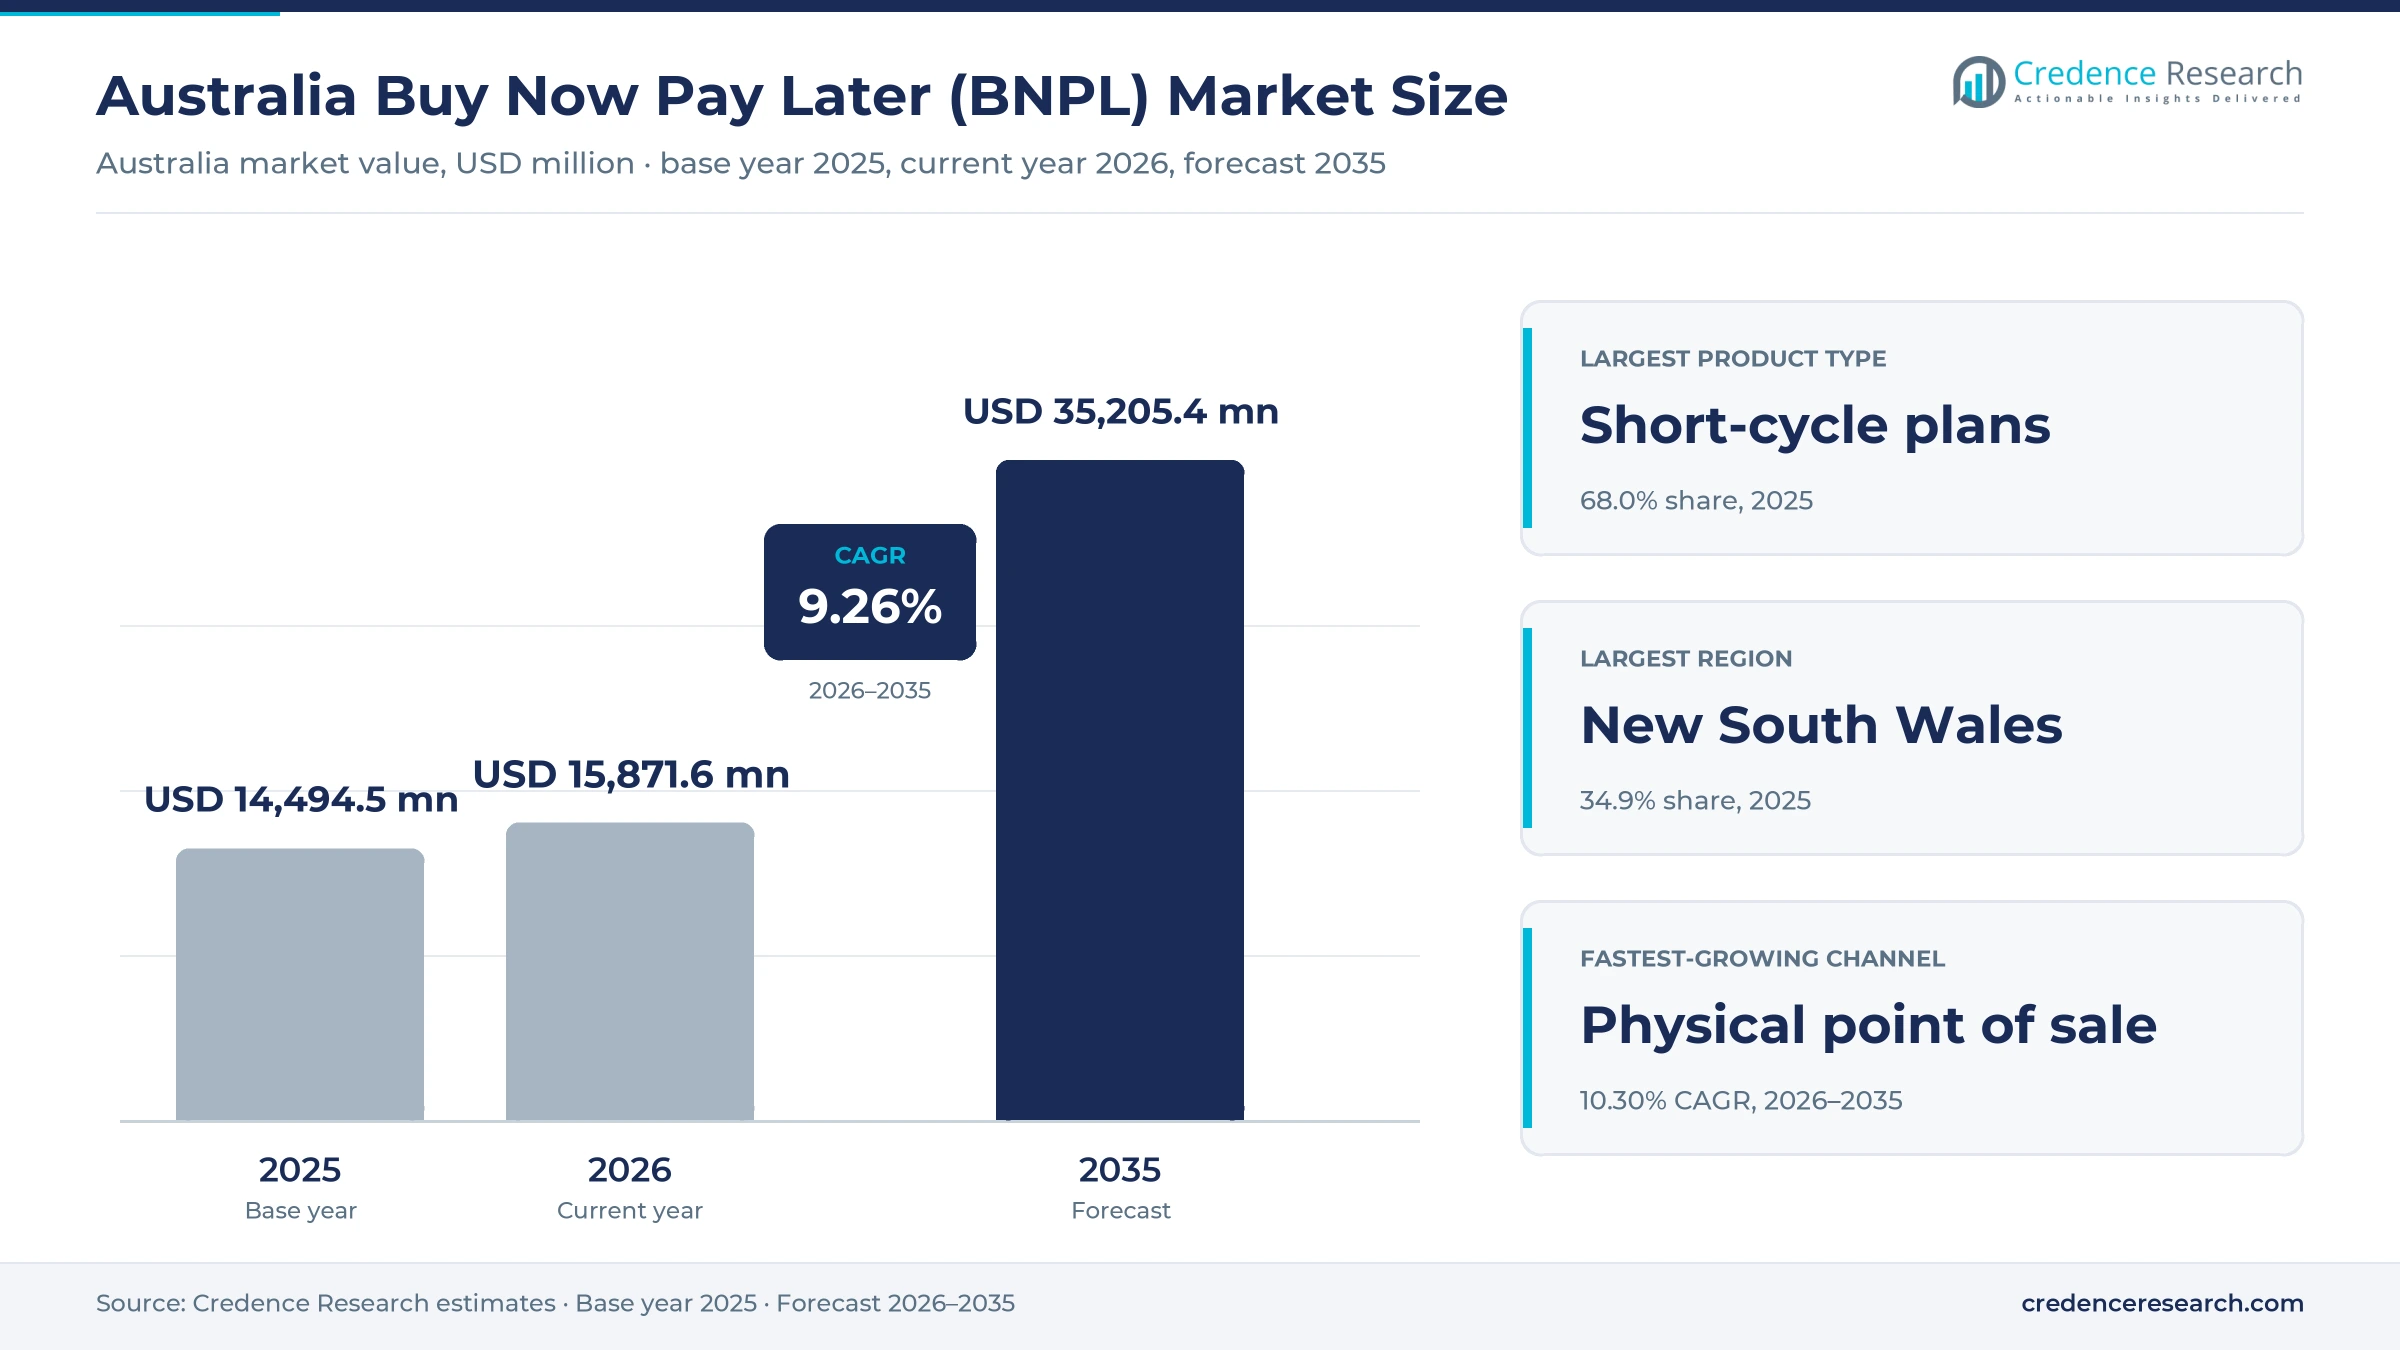
The Australia buy now pay later (BNPL) market was valued at USD 14.49 billion in 2025 and is projected to increase from USD 15.87 billion in 2026 to USD 35.21 billion by 2035, registering a CAGR of 9.26% during 2026–2035. Demand comes from shoppers who split online and in-store purchases into short installments, merchants that add installment options at checkout to lift basket sizes, and households that finance larger items over several months. New South Wales held the largest regional share, 34.9% in 2025, because Sydney concentrates retail spending, young professionals and online merchants. Western Australia and the remaining jurisdictions form the fastest-growing zone at 9.59% a year, as card-based plans reach shoppers far from metropolitan retail centers. In turn, regulation reshaped supply when every provider needed an Australian credit licence from June 10, 2025, which favors well-capitalized lenders with strong credit assessment systems.
Which installment plans and providers does the estimate cover?
The estimate measures the value of purchases financed through installment plans that Australian consumers use at online and physical merchants. It covers interest-free plans paid in four parts, medium-term plans over several months and longer plans for considered purchases such as phones, solar systems and health treatments. Values include plans offered by specialist providers, payment groups and banks through websites, apps and store terminals.
The estimate excludes credit card balances, personal loans that are not linked to a merchant checkout, and business trade credit between companies. The value chain runs from wholesale funders and warehouse lenders through licensed providers, payment networks and merchant acquirers to retailers, service businesses and households across every state and territory.
Australia Buy Now Pay Later (BNPL) Market Insights
- The Australia buy now pay later (BNPL) market was valued at USD 14.49 billion in 2025 and is projected to reach USD 35.21 billion by 2035, registering a CAGR of 9.26% during 2026–2035.
- New South Wales held a 34.9% share of 2025 value, because Sydney concentrates retail spending, online merchants and young working shoppers.
- Short-cycle installments led with a 68.0% share of 2025 value, because pay-in-four plans remain the default option at most retail checkouts.
- Every installment provider needed an Australian credit licence and membership of the complaints authority from June 10, 2025, under the 2024 reform law.
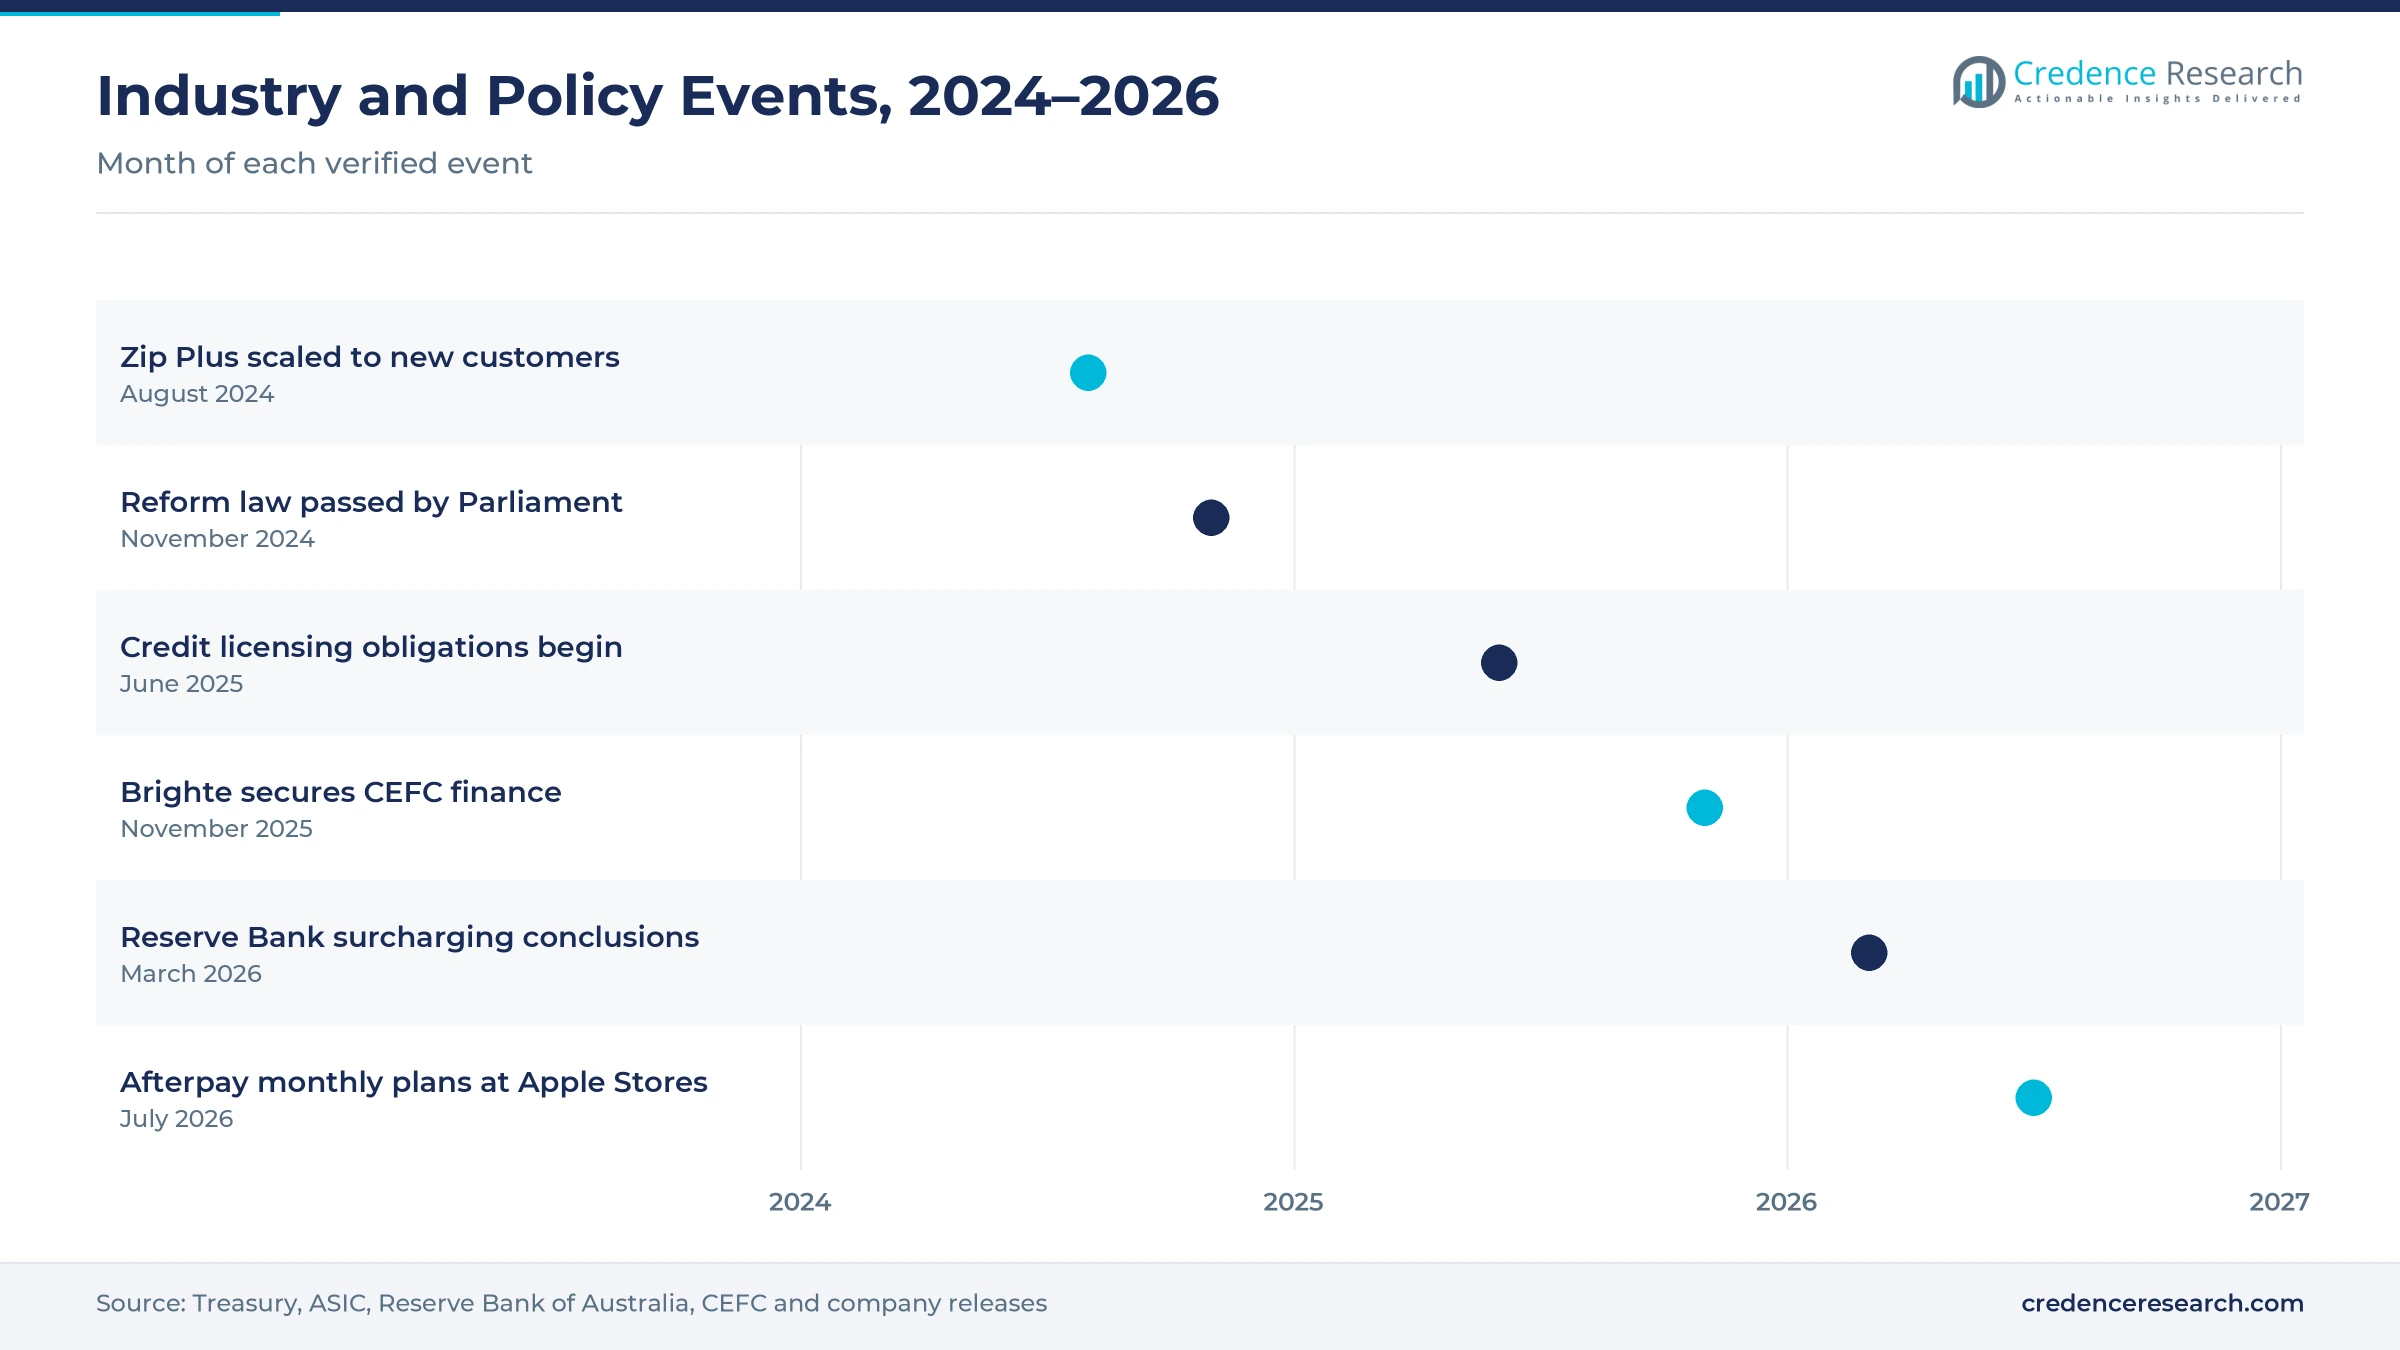
- Afterpay launched monthly plans of 6 to 24 months at Apple Stores across Australia in July 2026, with spend limits of $1,000 to $20,000.
Short-cycle plans lead while long-term plans grow fastest
Why do short-cycle plans lead product demand?
Based on product type, the market is categorized into short-cycle installments, medium-term installments and long-term installments. Short-cycle instalments led with a 68.0% share of 2025 value, because pay-in-four plans remain the default option for fashion, beauty and everyday retail. Long-term instalments grow fastest at 11.60% a year, as providers finance phones, solar systems and health treatments over longer terms.
How do age groups split installment spending?
Based on customer segment, the market is categorized into consumers aged 18-29, consumers aged 30-44, and consumers aged 45 and above. Consumers aged 30-44 led with a 40.0% share of 2025 value, because working families finance household goods, travel and school costs with installment plans. Consumers aged 45 and above grow fastest at 10.07% a year, as older households finance energy upgrades and larger purchases.
Why is physical point of sale the fastest-growing channel?
Based on distribution channel, the market is categorized into merchant website checkout, mobile application checkout and physical point of sale. Merchant website checkout led with a 44.0% share of 2025 value, because most installment plans began as online checkout options. Physical point of sale grows fastest at 10.30% a year, as shoppers tap virtual cards in phone wallets at store terminals.
How do specialists and banks share installment supply?
Based on institution type, the market is categorized into specialist non-bank providers, diversified payment groups and authorised deposit-taking institutions. Specialist non-bank providers led with a 72.0% share of 2025 value, because they built the merchant networks and apps that shoppers know. Authorised deposit-taking institutions grow fastest at 10.83% a year, as banks add installment features to the cards their customers already hold.
| Segment Group | Leading Sub-segment | Share, 2025 | Fastest-growing Sub-segment | CAGR, 2026–2035 |
|---|---|---|---|---|
| By Product Type | Short-cycle instalments | 68.0% | Long-term instalments | 11.60% |
| By Customer Segment | Consumers aged 30-44 | 40.0% | Consumers aged 45 and above | 10.07% |
| By Distribution Channel | Merchant website checkout | 44.0% | Physical point of sale | 10.30% |
| By Institution Type | Specialist non-bank providers | 72.0% | Authorised deposit-taking institutions | 10.83% |
Request a Free Sample
Fill in your details and we'll send you a free sample report.
- Sample data tables & charts
- Research methodology
Checkout reach, card access and larger purchases lift volume
How does embedded checkout distribution lift volume?
Embedded checkout distribution lifts volume, because installment buttons sit inside the websites and apps where Australians already shop. About 96.1% of Australians used the internet in 2024, according to World Bank data, which gives online checkouts near-universal reach. Zip Co reported 60,800 merchants in Australia and New Zealand at June 30, 2025, up 10.3% on the prior year. The same business processed 47.7 million transactions in fiscal 2025, an increase of 12.6%, as customers used plans more often. As a result, merchant website checkout holds a 44.0% share of 2025 value, while mobile application checkout gains share as shoppers move to digital wallets.
Why does card-enabled physical acceptance widen use?
Card-enabled physical acceptance widens use, because virtual cards let shoppers split purchases at any store that takes contactless phone payments. Afterpay's Plus card lets users tap almost anywhere that Apple Pay, Google Pay or Samsung Pay is accepted. CommBank's StepPay splits purchases of $100 or more into four parts anywhere Mastercard is accepted, both in-store and online. Cards still made up about 73% of consumer payments in 2025, according to the Reserve Bank of Australia, so card rails give installment plans broad acceptance. In turn, physical point of sale grows at 10.30% a year, the fastest channel rate, as plans reach existing store card terminals.
How does considered-purchase financing raise ticket sizes?
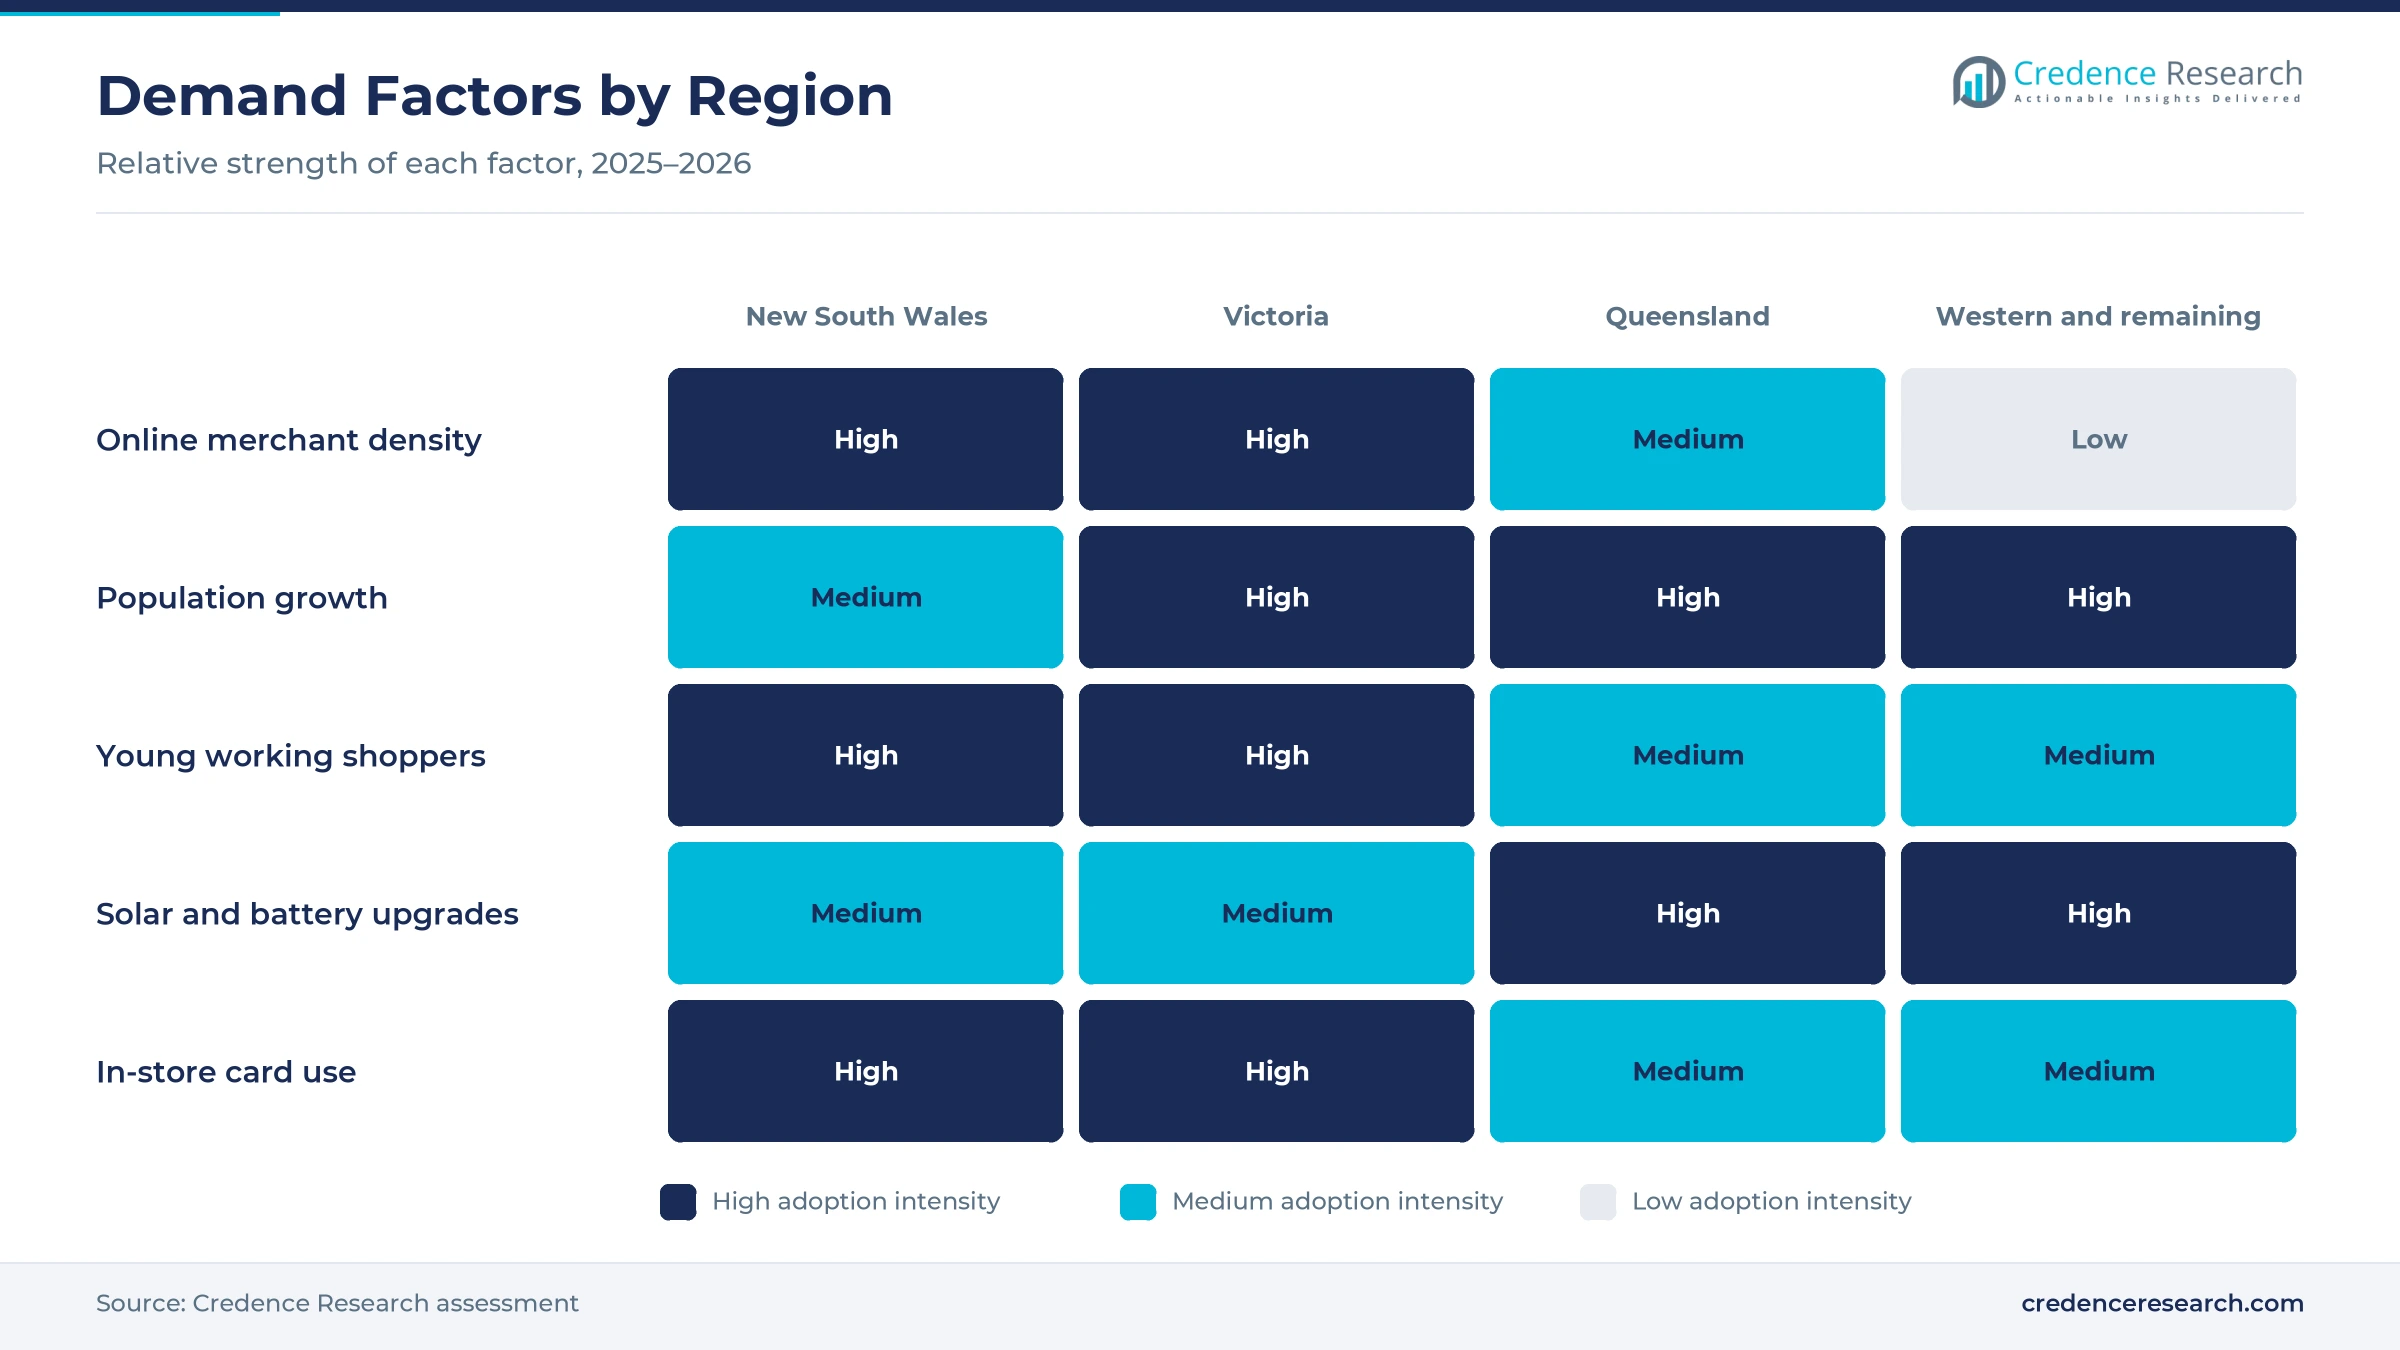
Considered-purchase financing raises ticket sizes, because providers now fund phones, solar systems and health treatments over longer terms. Afterpay launched monthly plans at Apple Stores across Australia in July 2026, with terms of 6, 12 or 24 months and limits of $1,000 to $20,000. Brighte secured up to $40 million from the Clean Energy Finance Corporation in November 2025 for green loans of $2,000 to $55,000. Humm Group also reported that growth in fiscal 2025 came from longer term verticals, namely health and solar. As a result, long-term installments grow at 11.60% a year, the fastest product rate, as larger tickets lift average plan value.
Why does licensed regulation build trust in installment credit?
Licensed regulation builds trust in installment credit, because clear rules on affordability and complaints make banks, merchants and shoppers more willing to use the products. Parliament passed the reform law on Nov. 29, 2024, when there were around 7 million active accounts, according to the Treasury ministers. From June 10, 2025, every provider needed an Australian credit licence and membership of the complaints authority, according to the Australian Securities and Investments Commission. Humm launched a regulated hybrid product in June 2025 and placed its legacy plan into runoff. In turn, authorised deposit-taking institutions grow at 10.83% a year, as licensing narrows the gap with specialist providers.
Monthly plans, bank products and energy loans widen use
How is the shift to monthly plans changing product mix?
The shift to monthly plans is changing the product mix, because shoppers want installment options for items that cost more than a typical pay-in-four limit. Afterpay's monthly plans at Apple Stores carry a standard rate of 19.99% a year, with a 0% promotional rate at Apple for a limited time. Late fees on those plans are capped at the lower of 15% of the order or $250. Zip Co scaled its Zip Plus product to new customers in August 2024 and launched a personal loan in January 2025. As a result, medium-term and long-term installments together hold a growing part of 2025 value, as providers price longer credit for larger baskets.
Why is the rise of bank installment features reshaping supply?
The rise of bank installment features is reshaping supply, because banks can offer plans inside the cards and apps their customers already use. CommBank's StepPay sets a spend limit after reviewing income, expenses and other credit inside the CommBank app. Customers can also add eligible CommBank cards to Klarna directly from the CommBank app. Zip Co active customers in Australia and New Zealand fell 6.8% to 2.04 million at June 30, 2025, which shows that specialists face tougher competition for users. In turn, diversified payment groups and banks grow faster than specialists, although specialist non-bank providers keep a 72.0% share of 2025 value.
Can energy upgrades open a larger financing pool?
Energy upgrades open a larger financing pool, because households need credit for solar panels, batteries and efficient appliances. About 193,000 batteries were installed under the Cheaper Home Batteries Program in its first six months to December 2025, according to the Clean Energy Regulator. Those batteries added 4.6 GWh of capacity, which shows the scale of household spending on home battery systems. Brighte has supported more than 200,000 Australian households with over $2 billion in sustainable finance to date. As a result, consumers aged 45 and above grow at 10.07% a year, the fastest customer rate, as homeowners finance energy upgrades.
Is there room for installments in services and health?
Installment plans have room to grow in services and health, because dental, veterinary, travel and education bills often exceed what households can pay at once. Humm Group reported that its fiscal 2025 growth came from health and solar verticals, which shows that providers are moving beyond retail goods. Humm's point-of-sale volume across its markets rose 9% to A$1,037.9 million in fiscal 2025. Zip Co transaction volume in Australia and New Zealand also rose 5.5% to A$3,749.7 million in the same year. In turn, service merchants that add installment options can win customers who would otherwise delay treatment or bookings.
Licensing costs, arrears and fee pressure test providers
How do licensing costs weigh on smaller providers?
Licensing costs weigh on smaller providers, because credit licences require compliance teams, dispute handling and affordability checks that add fixed costs. Smaller lenders must spread these costs over fewer accounts than the largest specialists. As a result, some providers may exit, sell their books or partner with larger lenders. Providers respond with automated credit checks, shared compliance services and simpler product ranges that reduce the cost of each approval.
Why do arrears and hardship pressure approval rates?
Arrears and hardship pressure approval rates, because higher living costs leave some households unable to meet fortnightly repayments on several plans at once. Providers must now assess whether credit is unsuitable before approving new limits. In turn, approval rates fall for applicants with thin or stretched credit files. Providers respond with lower starting limits, repayment reminders and hardship arrangements that keep customers paying without adding late fees.
How could payment cost reform change merchant economics?
Payment cost reform could change merchant economics, because merchants pay installment providers higher fees than they pay for most card payments. The Reserve Bank decided in March 2026 to remove card surcharging on the main networks from Oct. 1, 2026. The bank also plans to consult in mid-2026 on areas outside that review, including installment services. As a result, providers may face pressure on merchant fees, so they are adding consumer-paid monthly plans and card interchange.
Why does competition from banks squeeze specialist margins?
Competition from banks squeezes specialist margins, because banks can fund installment plans with deposits that cost less than wholesale funding. Banks also hold income and spending data on their own customers, which speeds credit decisions. In turn, specialists must spend more on merchant deals and marketing to keep users. Specialists respond with exclusive merchant partnerships, rewards programs and longer plans that banks have been slower to offer.
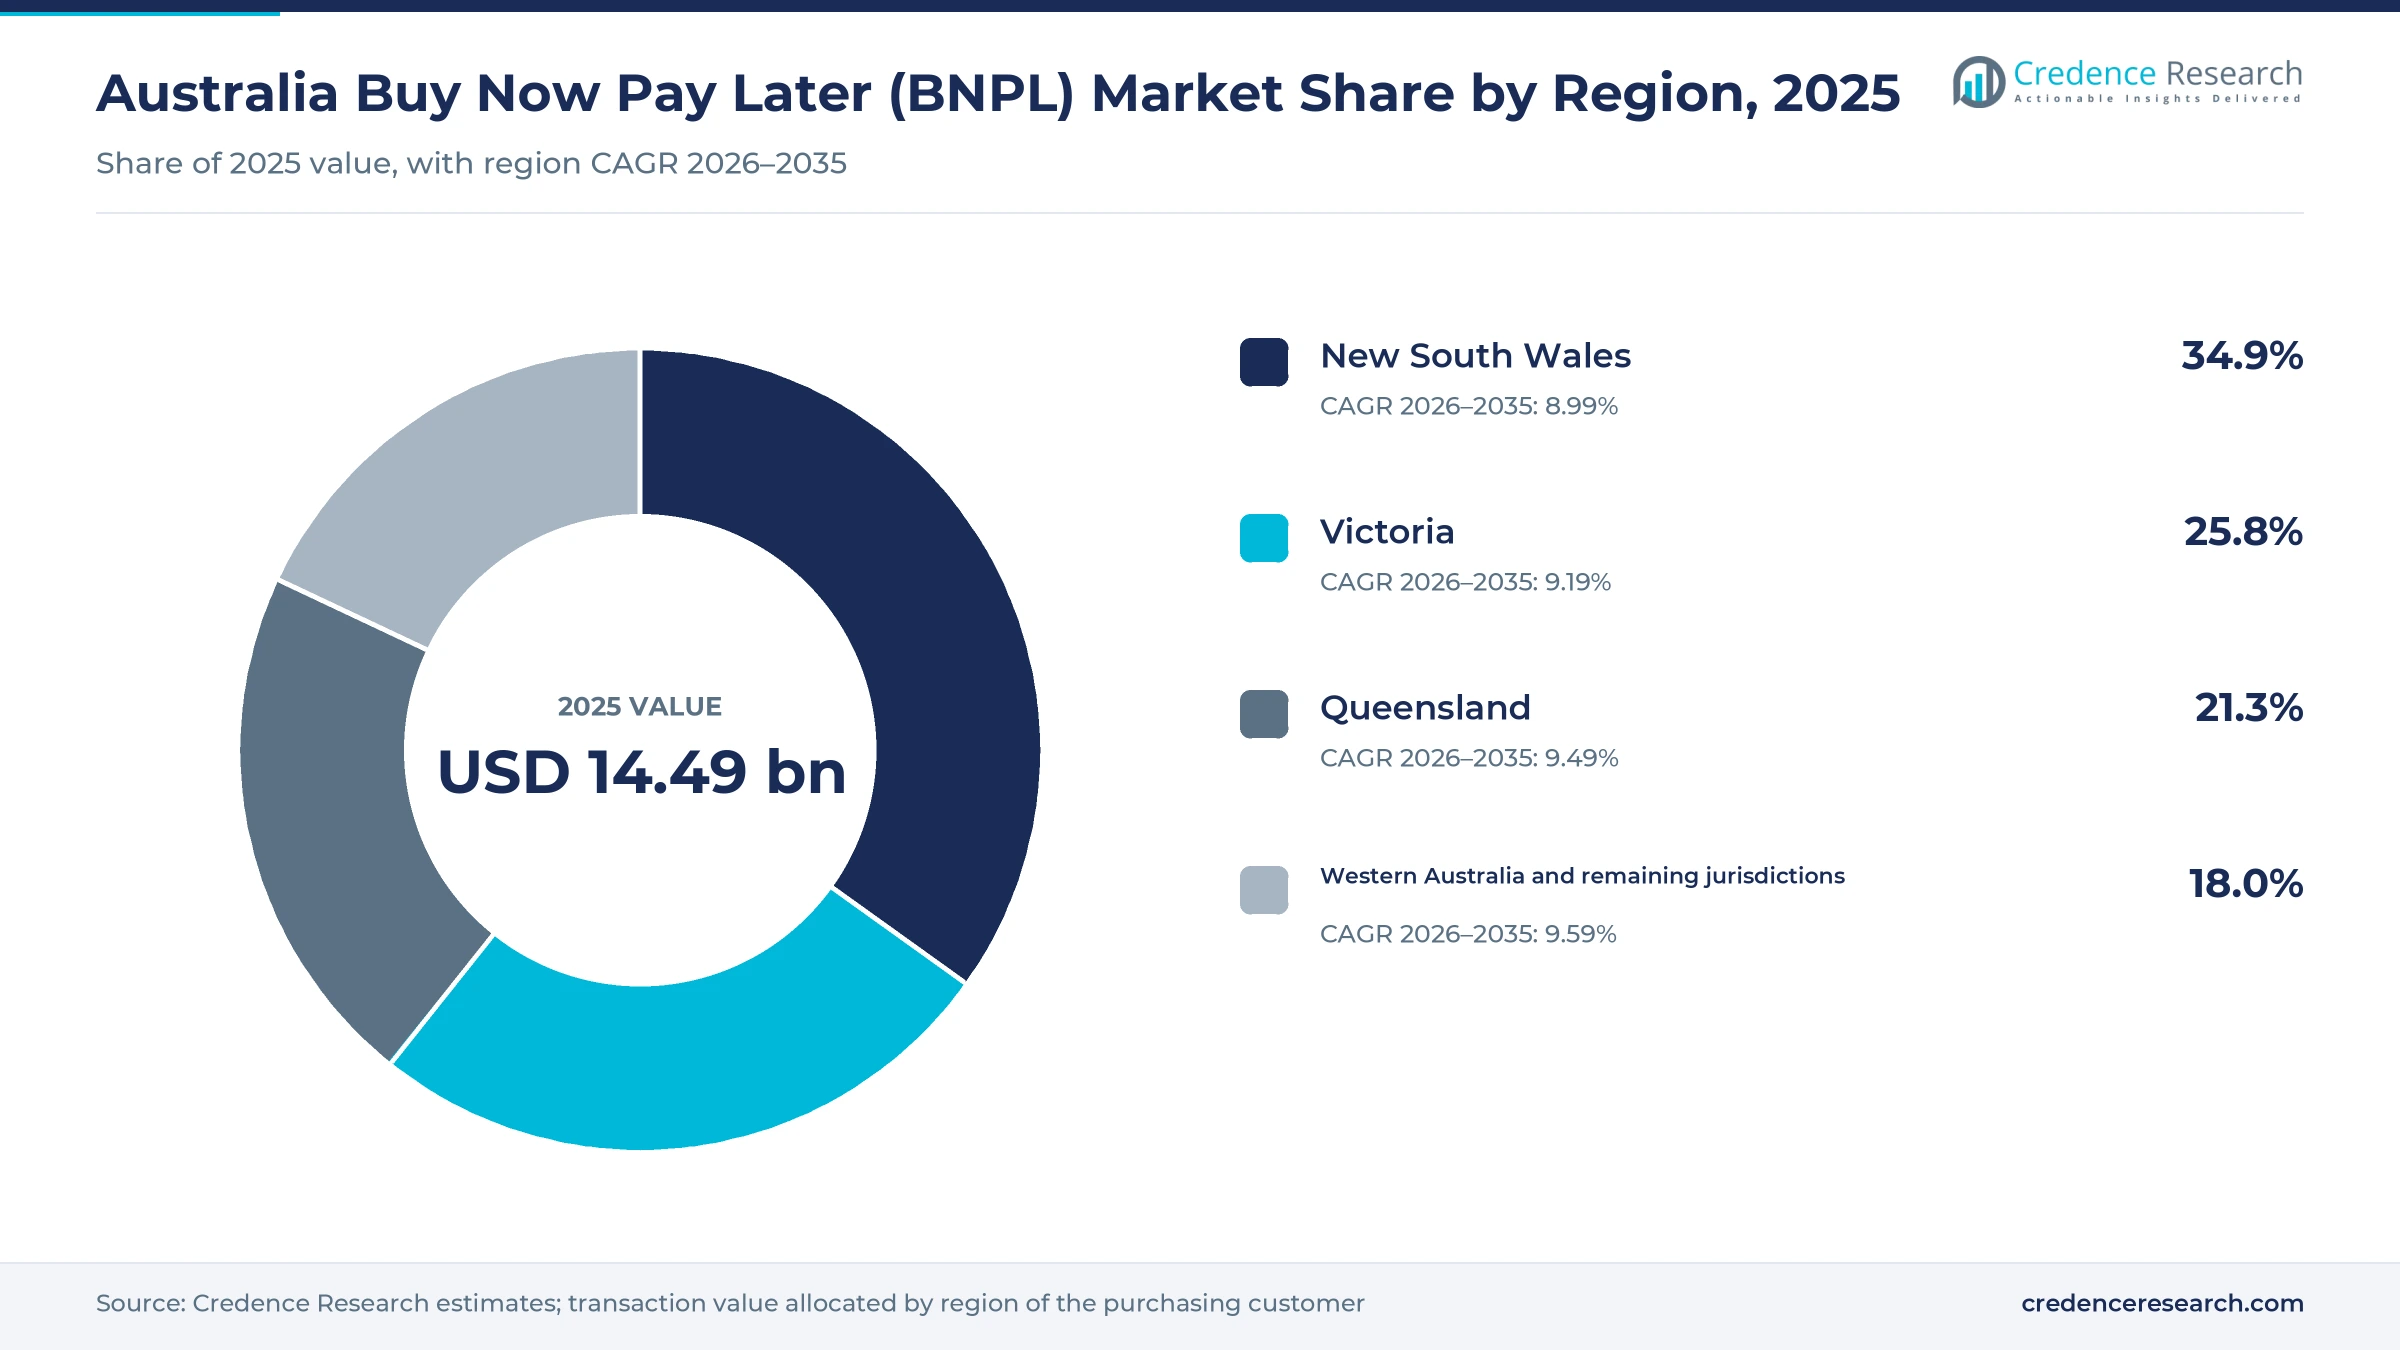
New South Wales leads while western states grow fastest
| Region | Value, 2025 (USD billion) | Share, 2025 | CAGR, 2026–2035 |
|---|---|---|---|
| New South Wales | 5.06 | 34.9% | 8.99% |
| Victoria | 3.74 | 25.8% | 9.19% |
| Queensland | 3.09 | 21.3% | 9.49% |
| Western Australia and remaining jurisdictions | 2.61 | 18.0% | 9.59% |
Why does new South Wales hold the largest share?
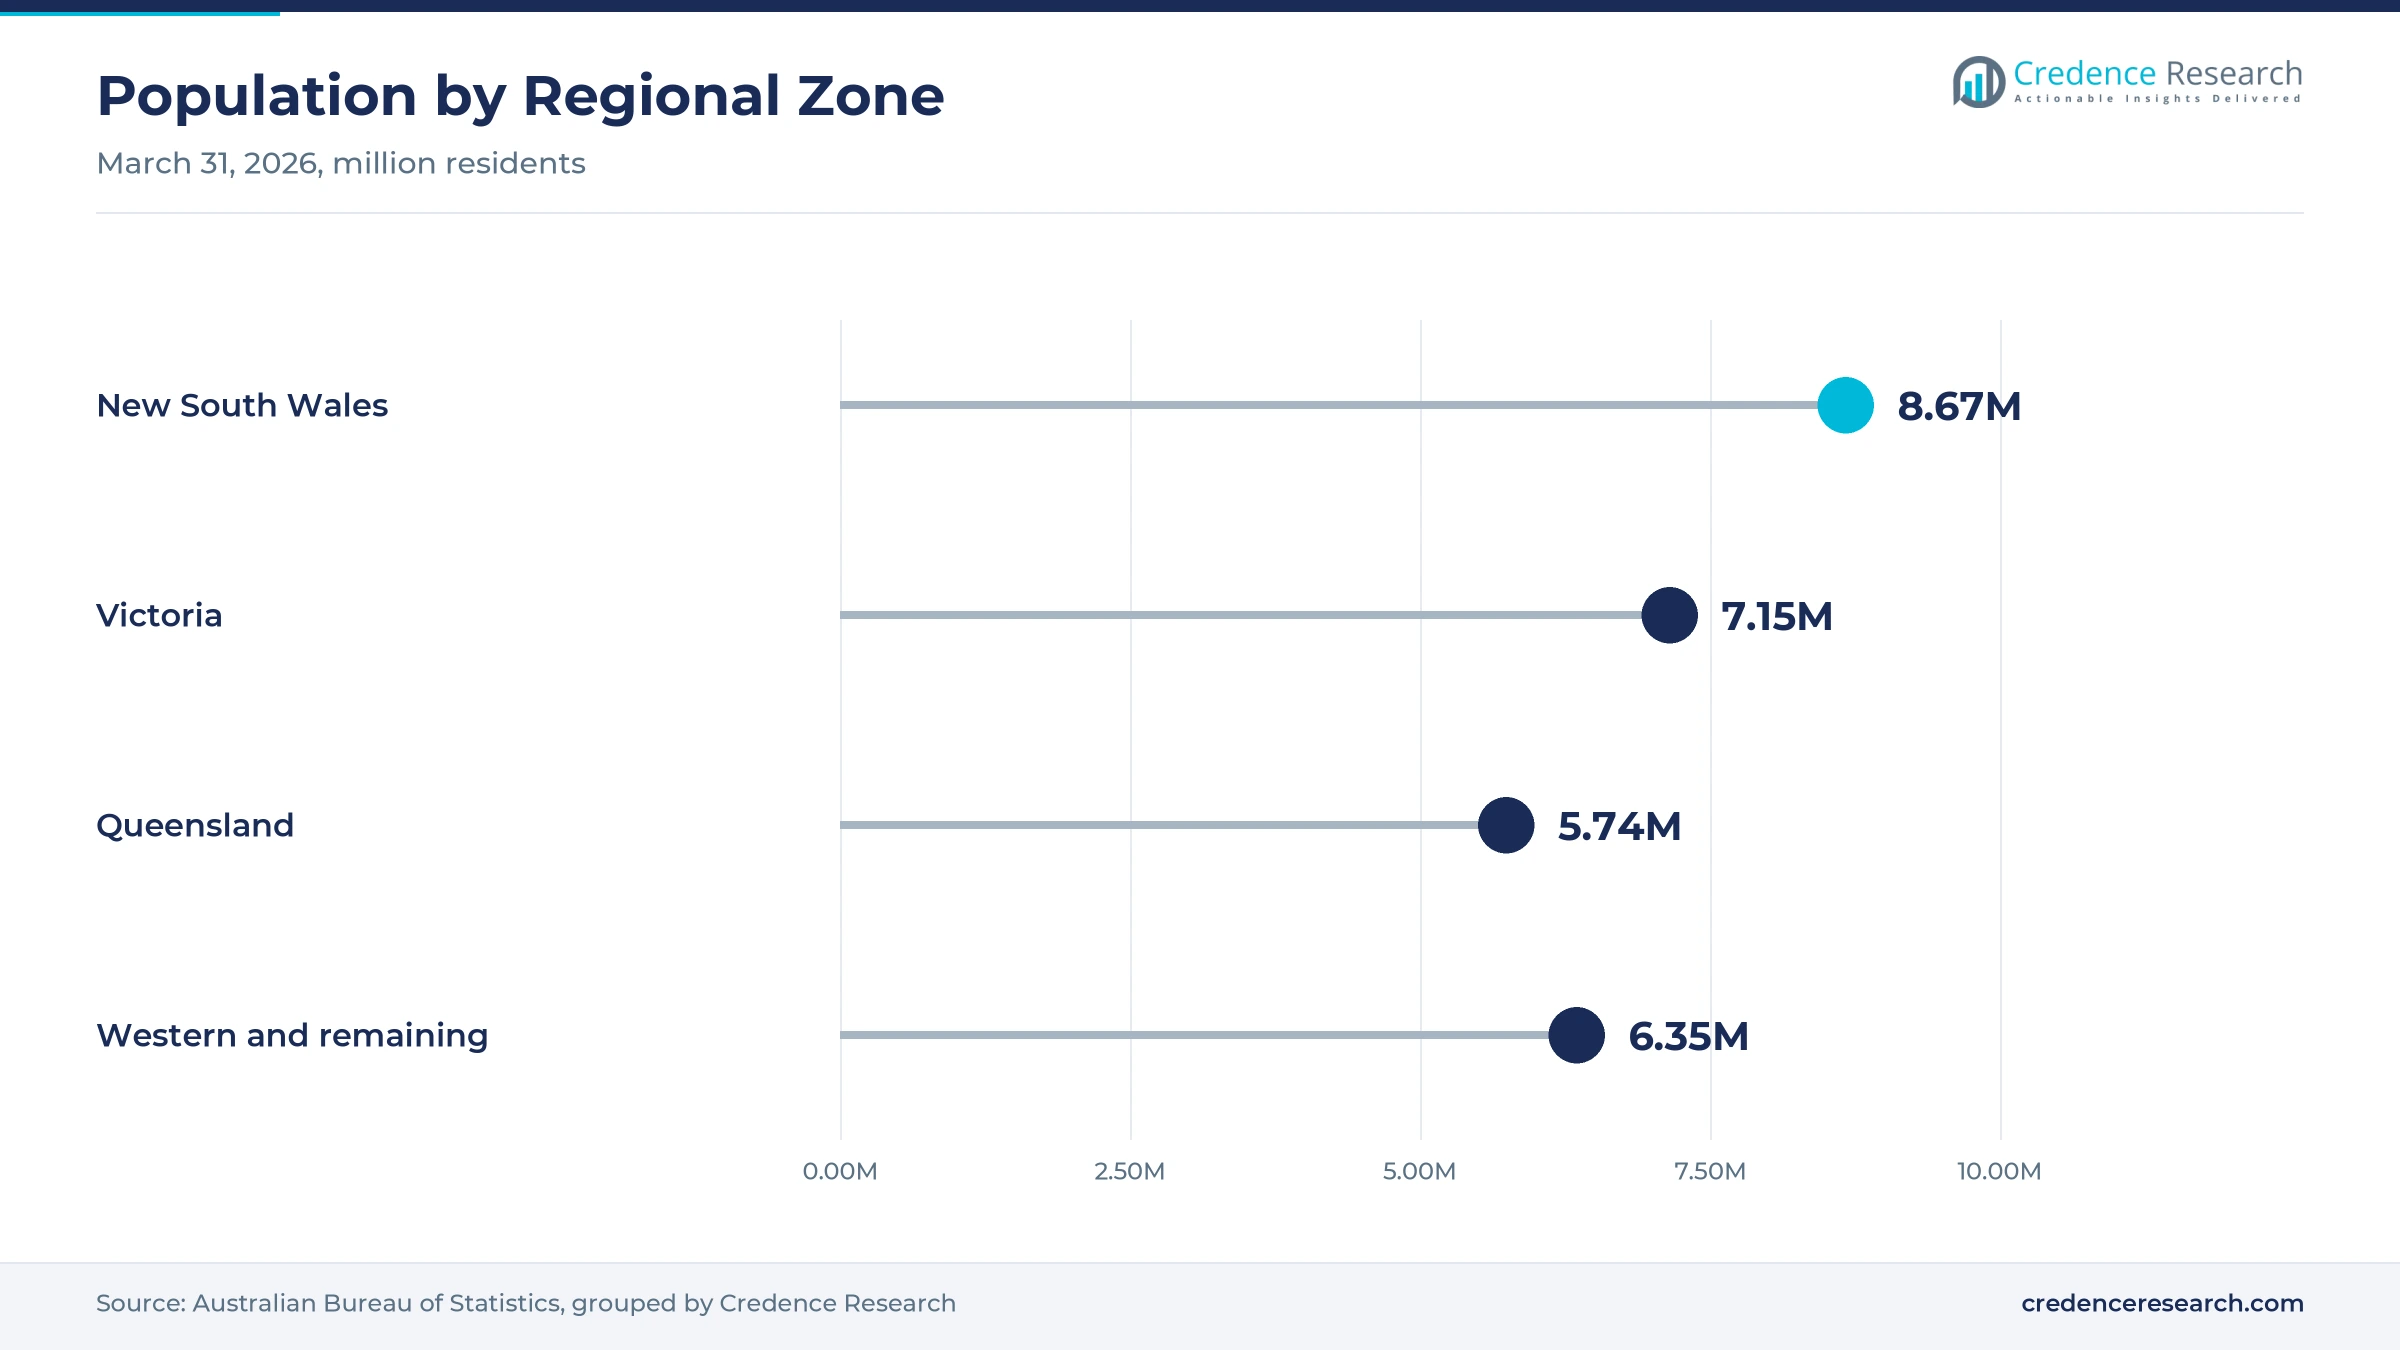
New South Wales held a 34.9% share of 2025 value and grows at 8.99% a year, because Sydney concentrates retail spending, online merchants and young working shoppers. The state had about 8.67 million residents at March 31, 2026, the largest population of any state. However, growth is slower than in other zones because population growth was lower at 1.1% over the year. Large retail centers in the state already offer installment options at most checkouts.
How does Victoria support installment growth?
Victoria held a 25.8% share of 2025 value and grows at 9.19% a year, because Melbourne has a large fashion, electronics and online retail base. The state added about 109,500 residents in the year to March 2026, a growth rate of 1.6%. This growth lifts demand for household goods, travel and services that shoppers often split into installments. Card-based plans also spread installment use across regional towns in the state.
Why does Queensland outpace the eastern average?
Queensland held a 21.3% share of 2025 value and grows at 9.49% a year, because fast population growth and strong household spending widen the shopper base. The state added about 90,100 residents in the year to March 2026, a growth rate of 1.6%. Solar and battery upgrades are also common across the state, which supports longer financing plans. Tourism and services add further installment spending in coastal regions.
Why are the western and remaining jurisdictions growing fastest?
Western Australia and the remaining jurisdictions held an 18.0% share of 2025 value and grow fastest at 9.59% a year, because card-based plans reach shoppers far from large retail centers. Western Australia had the fastest state population growth at 2.1% in the year to March 2026. South Australia, Tasmania, the Northern Territory and the Australian Capital Territory add a further base of online shoppers.
Licensing, monthly plans and new products shaped 2024-2026
| Development | Status and market relevance |
|---|---|
| In August 2024, Zip Co scaled its Zip Plus product to new customers in Australia. | Extended longer installment limits to a wider customer base |
| In November 2024, Parliament passed the Responsible Buy Now Pay Later reform law. | Brought around 7 million active accounts under credit regulation |
| In June 2025, credit licensing and complaints authority membership became mandatory for installment providers. | Raised compliance standards across all providers |
| In November 2025, Brighte secured up to $40 million from the Clean Energy Finance Corporation. | Expanded green loans for solar, batteries and efficient appliances |
| In July 2026, Afterpay launched monthly plans of 6 to 24 months at Apple Stores across Australia. | Moved installment credit into larger considered purchases |
Virtual cards, credit checks and app wallets reshape plans
- Virtual installment cards sit in phone wallets and let shoppers tap to split purchases at any contactless terminal, which removes the need for merchant integration.
- Automated affordability checks review income, expenses and credit files in minutes, which supports licensed lending rules.
- Bank app integration lets customers add cards to installment services and manage plans inside their banking app, which gives banks a direct route to existing customers.
- Merchant checkout plugins add installment options to online stores with little development work, which widens merchant reach.
Need a Custom Version of This Report?
Tailor the scope, geography, or segments to your exact requirements.
- Custom geography or segment scope
- Direct access to our analyst team
Specialists and banks compete on reach and approval quality
Competition is led by specialist providers with large merchant networks, alongside banks and payment groups that offer installment features inside existing cards and apps. Afterpay extended its reach with a tap-to-pay card and monthly plans at Apple Stores in July 2026. Zip Co grew its merchant base to 60,800 in Australia and New Zealand in fiscal 2025 and added a personal loan in January 2025. Humm Group launched a regulated hybrid product in June 2025 and focuses on health and solar purchases. CommBank offers StepPay to its own customers and links its cards to Klarna through the CommBank app. Brighte specializes in green loans for solar, batteries and home energy upgrades with support from a federal clean energy financier. Rivals compete on merchant reach, approval quality, funding cost, app experience and the range of plan lengths they can offer.
Companies profiled and their roles in this market
| Company | Type | Role in the market |
|---|---|---|
| Afterpay | Specialist provider | Launched monthly plans at Apple Stores in 2026 |
| Zip Co | Specialist provider | Served 60,800 merchants in Australia and New Zealand in 2025 |
| Humm Group | Specialist provider | Launched a regulated hybrid product in June 2025 |
| Klarna Australia | Specialist provider | Accepts eligible CommBank cards through the CommBank app |
| CommBank StepPay | Bank installment product | Splits purchases of $100 or more anywhere Mastercard is accepted |
| Brighte | Green finance specialist | Secured up to $40 million from the CEFC in 2025 |
Credence Research view on Australian installment credit
Credence Research's view is that Australian installment value will keep growing faster than retail spending because card access, larger purchases and licensed regulation widen use. Short-cycle plans remain the core of the market, while monthly plans, energy loans and in-store card use gain share. Licensing raised costs for smaller providers but made banks and large merchants more willing to adopt the products. Providers that combine merchant reach, careful credit decisions and low funding costs should gain share fastest.
How the Australian installment value estimate was built
The report uses 2025 as the base year on a calendar basis, and market values come from the Credence Research model. That model combines central bank payment survey data, government and regulator releases, population statistics, World Bank internet data, clean energy program statistics and listed-company operating disclosures. Segment splits and regional growth rates are Credence Research estimates, while regional shares follow the client-defined split. Sources used are public reports, official statistics, company releases and trade press, and no interviews or surveys were used.
Regulated growth and larger tickets carry value to 2035
Installment value is expected to reach USD 35.21 billion by 2035, a 9.26% CAGR during 2026–2035, as card access, longer plans and energy upgrades keep demand rising. Growth should stay steady through 2028 while providers adjust to licensing and payment cost reforms. After that, monthly plans, bank products and in-store card use will carry more growth as shoppers finance larger items. Tighter credit conditions would slow approvals, while lower funding costs would support growth. Providers with strong merchant networks and careful lending are expected to gain the most.
Frequently Asked Questions
How big is the Australia buy now pay later (BNPL) market?
Which product type leads Australian installment value?
Which region leads the Australia buy now pay later (BNPL) market?
When did installment providers need a credit licence in Australia?
How many active installment accounts were there in Australia?
Which distribution channel is growing fastest?
Who are the leading installment providers in Australia?
What are the main challenges for installment providers?
Table of Content
Chapter 1 Market Segmentation
- 1.1 Segmentation Framework
- 1.1.1 Product and Service Classification
- 1.1.2 Application and End-Use Classification
- 1.1.3 Technology and Solution Classification
- 1.1.4 Customer and Distribution Channel Classification
- 1.1.5 Geographic Segmentation
- 1.1.6 Market Segment Definitions and Boundaries
- 1.2 By Product Type
- 1.2.1 Short-cycle instalments
- 1.2.2 Medium-term instalments
- 1.2.3 Long-term instalments
- 1.3 By Customer Segment
- 1.3.1 Consumers aged 18-29
- 1.3.2 Consumers aged 30-44
- 1.3.3 Consumers aged 45 and above
- 1.4 By Institution Type
- 1.4.1 Specialist non-bank providers
- 1.4.2 Diversified payment groups
- 1.4.3 Authorised deposit-taking institutions
Chapter 2 Introduction
- 2.1 Report Objectives and Scope
- 2.2 Product Definition and Industry Terminology
- 2.3 Market Inclusions and Exclusions
- 2.4 Research Process
- 2.4.1 Primary Research and Expert Interviews
- 2.4.2 Secondary Research and Source Review
- 2.4.3 Top-Down and Bottom-Up Estimation
- 2.4.4 Data Triangulation and Verification
- 2.5 Market Size Measurement Basis
- 2.5.1 2025: USD 14.49 billion → 2035: USD 35.21 billion
- 2.6 Historical and Forecast Reference Periods
- 2.6.1 Historical Period: 2018-2025
- 2.6.2 Base Year: 2025
- 2.6.3 Forecast Period: 2025-2035
- 2.7 Research Assumptions and Limitations
Chapter 3 Executive Summary
- 3.1 Market Snapshot and Key Findings
- 3.2 Base-Year Market Size, 2025
- 3.3 Forecast Market Size, 2035
- 3.4 Revenue and Volume Growth Outlook
- 3.5 Key Demand and Supply Indicators
- 3.6 Leading Market Segments
- 3.7 Fastest-Growing Market Opportunities
- 3.8 Regional Performance Highlights
- 3.9 Technology and Industry Transformation
- 3.10 Competitive Landscape Summary
- 3.11 Analyst View and Strategic Implications
Chapter 4 Australia Buy Now Pay Later (BNPL) Market Trends and Developments
- 4.1 Historical Industry Development, 2018-2025
- 4.2 Recent Market Trends and Developments
- 4.3 Demand and Customer Behavior Trends
- 4.4 Technology and Product Innovation
- 4.5 Artificial Intelligence, Automation and Digitalization
- 4.6 Local Manufacturing and Supply Chain Realignment
- 4.7 Industry Partnerships, Mergers and Acquisitions
- 4.8 Sustainability and Circular Economy Developments
- 4.9 Government and Private Sector Investment Trends
- 4.10 Emerging Business Models and Commercialization
- 4.11 Industry Developments and Announcements
Chapter 5 Australia Buy Now Pay Later (BNPL) Market Supply and Demand Analysis
- 5.1 Demand Trend and Consumption Analysis, 2018-2025
- 5.2 Demand Forecast, 2025-2035
- 5.3 Supply Chain Structure and Procurement Trends
- 5.4 Supply-Demand Gap and Bottlenecks
- 5.5 Import Dependence and Sourcing Structure
- 5.6 Regional Supply and Demand Concentration
Chapter 6 Australia Buy Now Pay Later (BNPL) Market Pricing Analysis
- 6.1 Pricing Structure and Measurement
- 6.2 Historical Pricing Trends, 2018-2025
- 6.3 Pricing Outlook, 2025-2035
- 6.4 Pricing by Product and Market Segment
- 6.5 Geographic Pricing Differences
- 6.6 Key Input, Energy, Labor and Logistics Costs
- 6.7 Contract Pricing and Purchasing Models
- 6.8 Pricing Sensitivity and Competitive Positioning
- 6.9 Price, Margin and Profitability Implications
Chapter 7 Australia Buy Now Pay Later (BNPL) Market Dynamics
- 7.1 Market Growth Drivers
- 7.1.1 Demand-Side Drivers
- 7.1.2 Technology and Innovation Drivers
- 7.1.3 Infrastructure and Investment Drivers
- 7.1.4 Regulatory and Policy Drivers
- 7.2 Market Restraints
- 7.2.1 Cost and Affordability Constraints
- 7.2.2 Technology and Adoption Barriers
- 7.2.3 Supply Chain and Operational Constraints
- 7.3 Market Challenges
- 7.3.1 Competitive Pressure and Margin Erosion
- 7.3.2 Skills, Infrastructure and Implementation Gaps
- 7.4 Emerging Market Opportunities
- 7.5 Market Dynamics Impact and Time-Horizon Assessment
Chapter 8 Australia Buy Now Pay Later (BNPL) Value Chain Analysis
- 8.1 Industry Value Chain Overview
- 8.2 Upstream Suppliers and Critical Inputs
- 8.3 Technology and Component Providers
- 8.4 Manufacturing or Service Delivery
- 8.5 Distribution, Channel Partners and Integrators
- 8.6 Downstream Applications and End Users
- 8.7 Value Addition and Profit Pools
- 8.8 Vertical Integration and Outsourcing
- 8.9 Supplier Concentration and Risk
- 8.10 Supply Chain Localization and Resilience
Chapter 9 Australia Buy Now Pay Later (BNPL) Market Regulations and Policies
- 9.1 Relevant Laws, Standards and Compliance Frameworks
- 9.2 Product, Service, Safety and Quality Requirements
- 9.3 Government Policies, Incentives and Subsidies
- 9.4 Imports, Exports and Trade Barriers
- 9.5 Public Procurement and Local Content Requirements
- 9.6 Data Protection, AI and Cybersecurity Compliance
- 9.7 Upcoming Policy Changes and Market Implications
Chapter 10 Australia Buy Now Pay Later (BNPL) Market Hotspots and Opportunities
- 10.1 Market Opportunity Mapping and Growth Hotspots
- 10.2 High-Growth Applications and Customer Groups
- 10.3 Underserved Markets and White-Space Opportunities
- 10.4 Emerging Technology and Product Opportunities
- 10.5 New Capacity and Investment Hotspots
- 10.6 Market Entry and Expansion Opportunities
- 10.7 Distribution and Partnership Opportunities
- 10.8 Near-Term and Long-Term Commercial Potential
- 10.9 Opportunity Attractiveness and Execution Risks
Chapter 11 Australia Buy Now Pay Later (BNPL) Market Outlook, 2025-2035
- 11.1 Market Size and Analysis
- 11.1.1 Revenue (Market Measurement: 2025: USD 14.49 billion → 2035: USD 35.21 billion)
- 11.1.2 Historical Market Size, 2018-2025
- 11.1.3 Base-Year Market Size, 2025
- 11.2 Market Forecast, 2025-2035
- 11.2.1 Revenue Forecast to 2035
- 11.2.2 CAGR and Year-on-Year Growth
- 11.2.3 Incremental Revenue Opportunity
- 11.3 Forecast Assumptions and Scenario Analysis
- 11.3.1 Base-Case Forecast
- 11.3.2 Optimistic and Conservative Scenarios
- 11.3.3 Technology, Pricing and Policy Sensitivities
- 11.4 Market Attractiveness and Growth Outlook
Chapter 12 Australia Buy Now Pay Later (BNPL) Market Segmentation and Outlook
- 12.1 Segmentation Summary and Market Shares, 2025
- 12.2 Largest and Fastest-Growing Segments
- 12.3 By Product Type - Market Size and Forecast, 2025-2035
- 12.3.1 Segment Definition and Scope
- 12.3.2 Historical Market Size, 2018-2025
- 12.3.3 Revenue Forecast, 2025-2035
- 12.3.4 Base-Year Market Share, 2025
- 12.3.5 Segment CAGR and Growth Drivers
- 12.3.6 Subsegment Market Size and Forecast
- 12.3.6.1 Short-cycle instalments
- 12.3.6.2 Medium-term instalments
- 12.3.6.3 Long-term instalments
- 12.3.7 Subsegment Pricing and Adoption Trends
- 12.3.8 Leading Suppliers and Competition
- 12.3.9 Regional Demand and Opportunities
- 12.4 By Customer Segment - Market Size and Forecast, 2025-2035
- 12.4.1 Segment Definition and Scope
- 12.4.2 Historical Market Size, 2018-2025
- 12.4.3 Revenue Forecast, 2025-2035
- 12.4.4 Base-Year Market Share, 2025
- 12.4.5 Segment CAGR and Growth Drivers
- 12.4.6 Subsegment Market Size and Forecast
- 12.4.6.1 Consumers aged 18-29
- 12.4.6.2 Consumers aged 30-44
- 12.4.6.3 Consumers aged 45 and above
- 12.4.7 Subsegment Pricing and Adoption Trends
- 12.4.8 Leading Suppliers and Competition
- 12.4.9 Regional Demand and Opportunities
- 12.5 By Institution Type - Market Size and Forecast, 2025-2035
- 12.5.1 Segment Definition and Scope
- 12.5.2 Historical Market Size, 2018-2025
- 12.5.3 Revenue Forecast, 2025-2035
- 12.5.4 Base-Year Market Share, 2025
- 12.5.5 Segment CAGR and Growth Drivers
- 12.5.6 Subsegment Market Size and Forecast
- 12.5.6.1 Specialist non-bank providers
- 12.5.6.2 Diversified payment groups
- 12.5.6.3 Authorised deposit-taking institutions
- 12.5.7 Subsegment Pricing and Adoption Trends
- 12.5.8 Leading Suppliers and Competition
- 12.5.9 Regional Demand and Opportunities
- 12.6 Segment Growth Comparison
- 12.7 Segment Attractiveness and Priority Matrix
Chapter 13 Australia Buy Now Pay Later (BNPL) End-Use and Application Market Outlook
- 13.1 End-Use Industry and Customer Demand Structure
- 13.2 Leading Applications and Customer Groups
- 13.3 End-Use Market Size, Share and Forecast
- 13.4 Major End-Use Industry Deep Dives
- 13.4.1 Customer Requirements and Use Cases
- 13.4.2 Demand and Replacement Cycles
- 13.4.3 Technical and Regulatory Considerations
- 13.4.4 Purchasing and Procurement Models
- 13.4.5 Leading Vendors and Distribution Channels
- 13.4.6 Forecast and Commercial Opportunities
- 13.5 Emerging Applications and Cross-Segment Demand
- 13.6 End-Use Industry Investment Priorities
Chapter 14 Australia Buy Now Pay Later (BNPL) Geographic Market Outlook, 2025-2035
- 14.1 Domestic Market Distribution and Demand Clusters
- 14.2 State- or Province-Wise Market Size and Forecast, 2025-2035
- 14.3 City and Metropolitan Market Outlook
- 14.4 Industrial, Manufacturing and Commercial Clusters
- 14.5 Geographic Concentration of Key End Users
- 14.6 Local Pricing and Purchasing Differences
- 14.7 Domestic Production Facilities and Capacity Map
- 14.8 Local Infrastructure and Project Pipeline
- 14.9 State-Level Policy and Incentive Differences
- 14.10 Subnational Investment Hotspots and Opportunities
- 14.11 Distribution and Logistics Networks
- 14.12 Domestic Competitive Footprint
Chapter 15 Australia Buy Now Pay Later (BNPL) Technology, Innovation and Sustainability Outlook
- 15.1 Technology Landscape and Maturity
- 15.2 Product, Process and Service Innovation
- 15.3 AI, Automation and Digital Tools in the Industry
- 15.4 Technology Adoption and Performance Benchmarking
- 15.5 Innovation Pipeline and R&D Investment
- 15.6 Energy Efficiency and Resource Management
- 15.7 Sustainability, Recycling and Circularity
- 15.8 Technology Roadmap, 2025-2035
- 15.9 Risks of Obsolescence and Technology Substitution
Chapter 16 Australia Buy Now Pay Later (BNPL) Market Key Strategic Imperatives
- 16.1 Growth and Market Entry Priorities
- 16.2 High-Return Products and Segments
- 16.3 Pricing, Profitability and Cost Optimization
- 16.4 Technology Investment and Product Differentiation
- 16.5 Supply Chain Localization and Resilience
- 16.6 Distribution and Customer Acquisition
- 16.7 Partnership, Acquisition and Capacity Strategy
- 16.8 Regional Expansion Priorities
- 16.9 Short-, Medium- and Long-Term Actions
Chapter 17 Competition Outlook
- 17.1 Industry Competition Characteristics
- 17.2 Market Structure and Concentration
- 17.3 Market Share and Competitive Positioning, 2025
- 17.4 Company-Wise Revenue and Product Benchmarking
- 17.5 Production and Service Capacity Benchmarking
- 17.6 Technology, Pricing and Differentiation
- 17.7 Regional Footprint and Distribution Strength
- 17.8 Mergers, Acquisitions and Strategic Alliances
- 17.9 New Entrants and Competitive Threats
- 17.10 Porter's Five Forces and Industry Attractiveness
- 17.11 Competitive Outlook, 2025-2035
Chapter 18 Company Profiles
- 18.1 Company Coverage and Selection Criteria
- 18.2 Afterpay
- 18.2.1 Business Description
- 18.2.2 Company Ownership and Geographic Presence
- 18.2.3 Product and Service Portfolio
- 18.2.4 Manufacturing and Operating Footprint
- 18.2.5 Financial Performance and Investment
- 18.2.6 Market Share and Competitive Position
- 18.2.7 Technology and Innovation Capabilities
- 18.2.8 Strategic Alliances or Partnerships
- 18.2.9 Recent Developments
- 18.2.10 Growth Strategy and Outlook
- 18.3 Zip Co
- 18.4 Humm Group
- 18.5 Klarna Australia
- 18.6 PayPal Pay in 4
- 18.7 CommBank StepPay
- 18.8 Payright
- 18.9 Brighte
- 18.10 Limepay (April)
- 18.11 NAB Now Pay Later
- 18.12 Other Relevant Market Participants
Note: Every listed company is profiled on the structure shown under the first company. The company list is preliminary and may change based on research findings, market developments, data availability and client requirements.
Chapter 19 Disclaimer
- 19.1 Research and Forecast Disclaimer
- 19.2 Data Source and Estimation Limitations
Note: The depth of individual sections depends on data availability for this market. Volume, capacity, trade and other unit-based metrics are included where applicable.

