
Cancer, heart and stroke risks keep trauma cover relevant
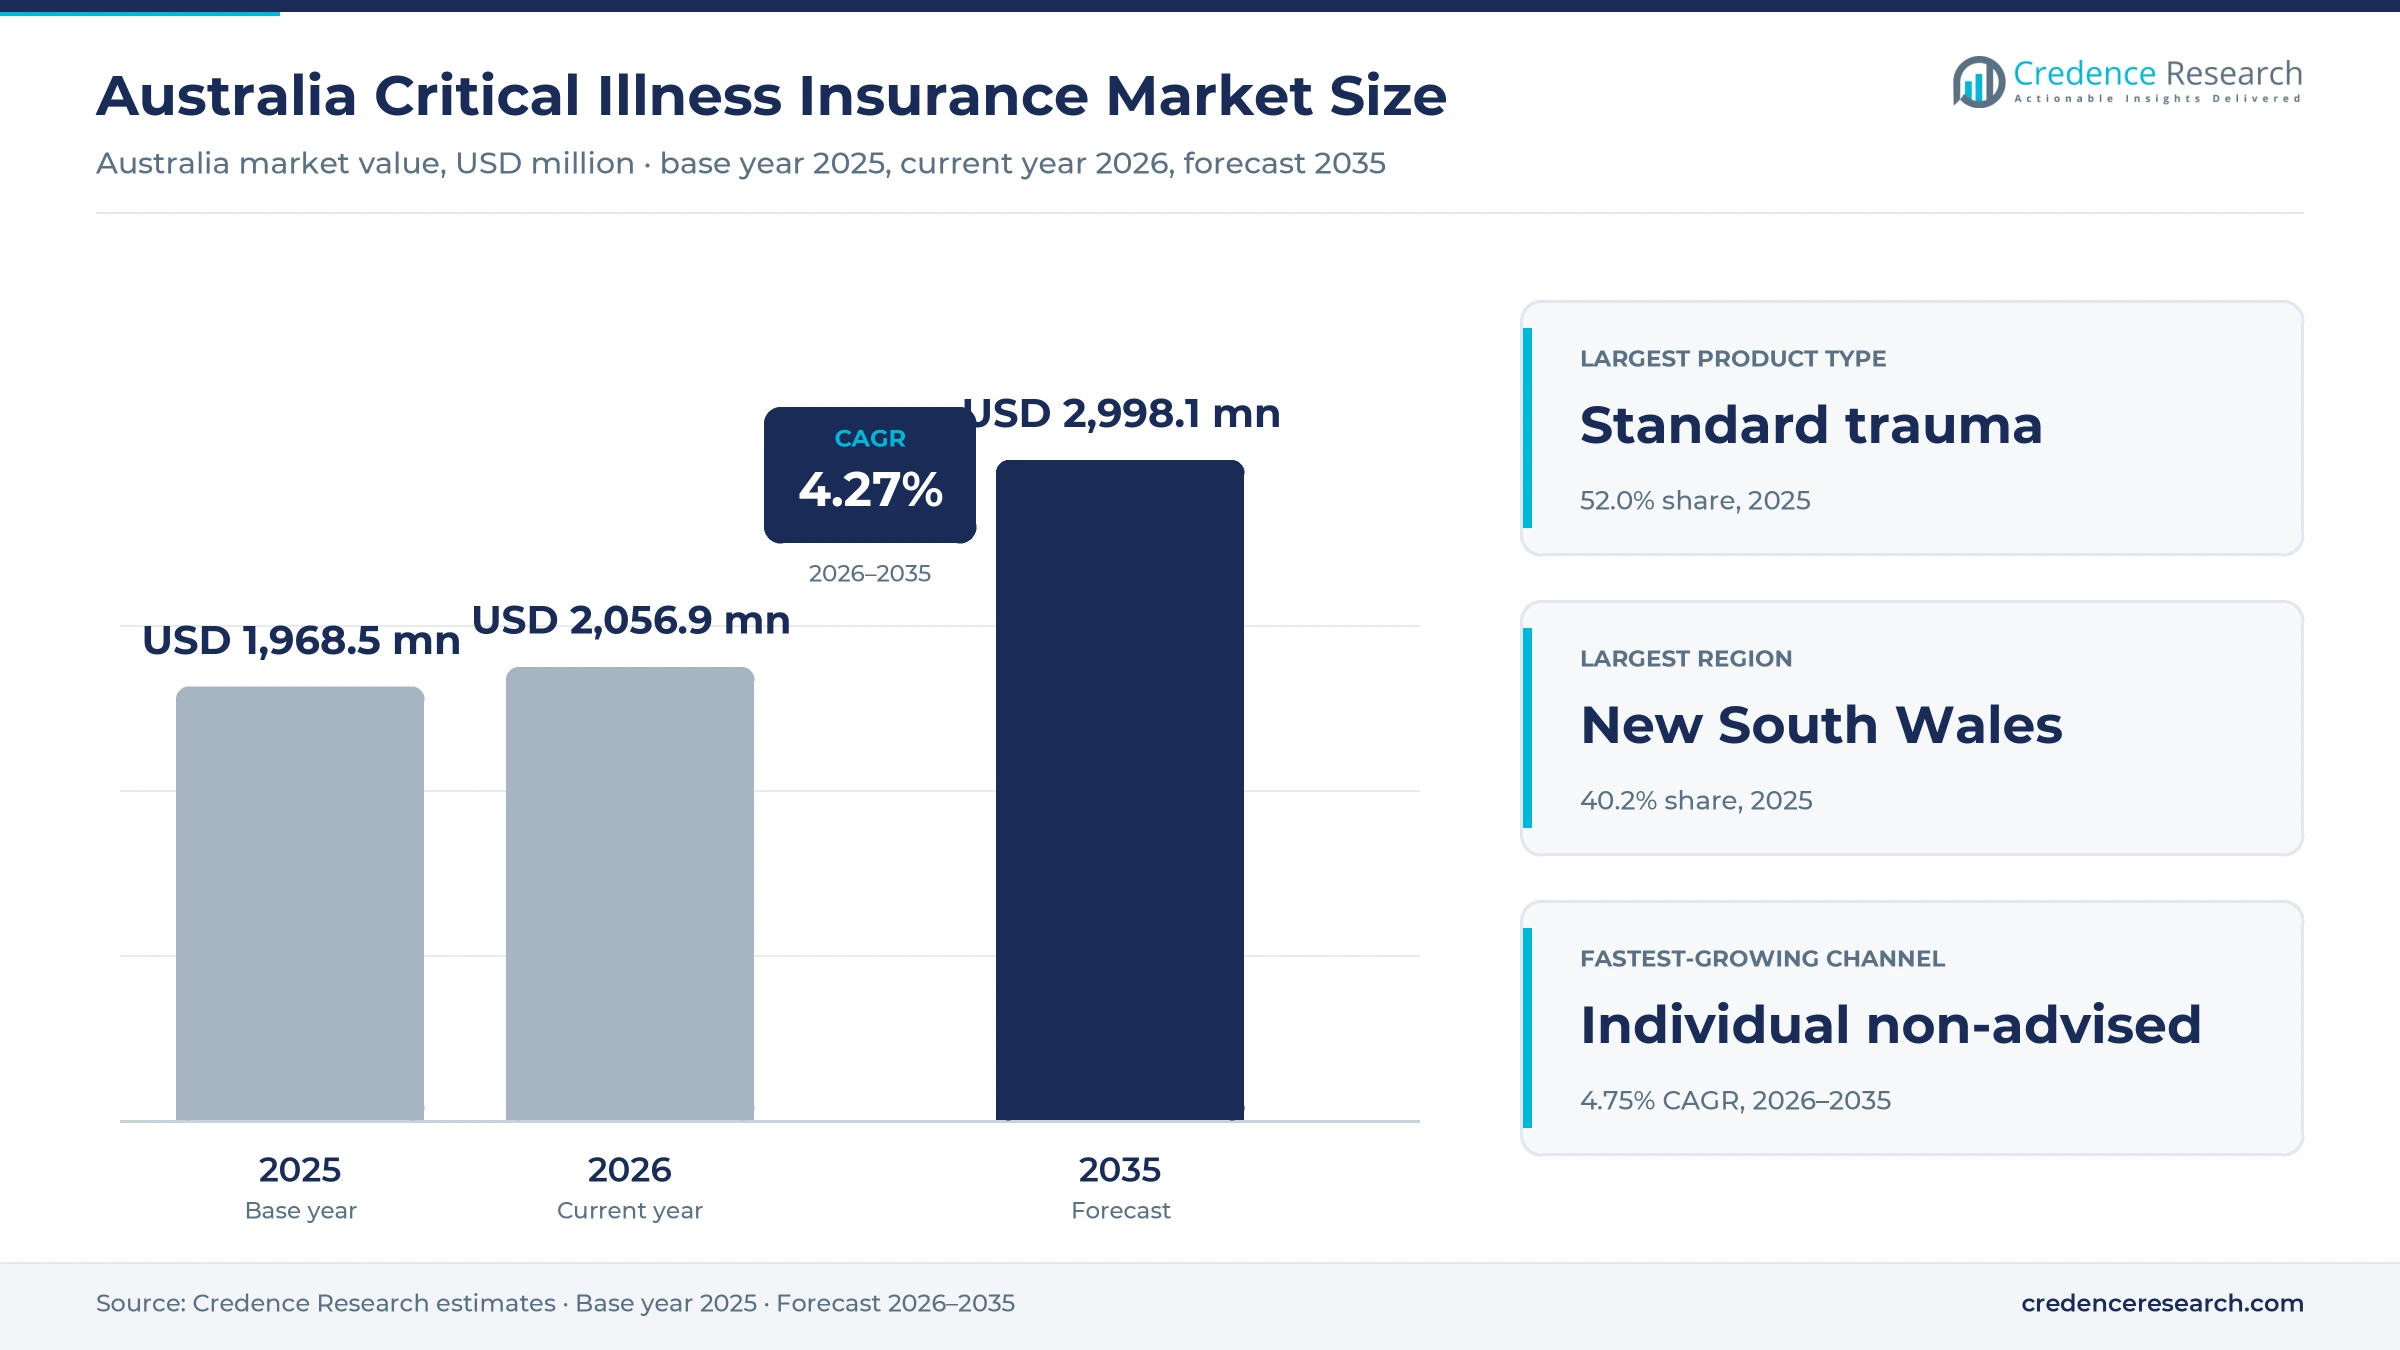
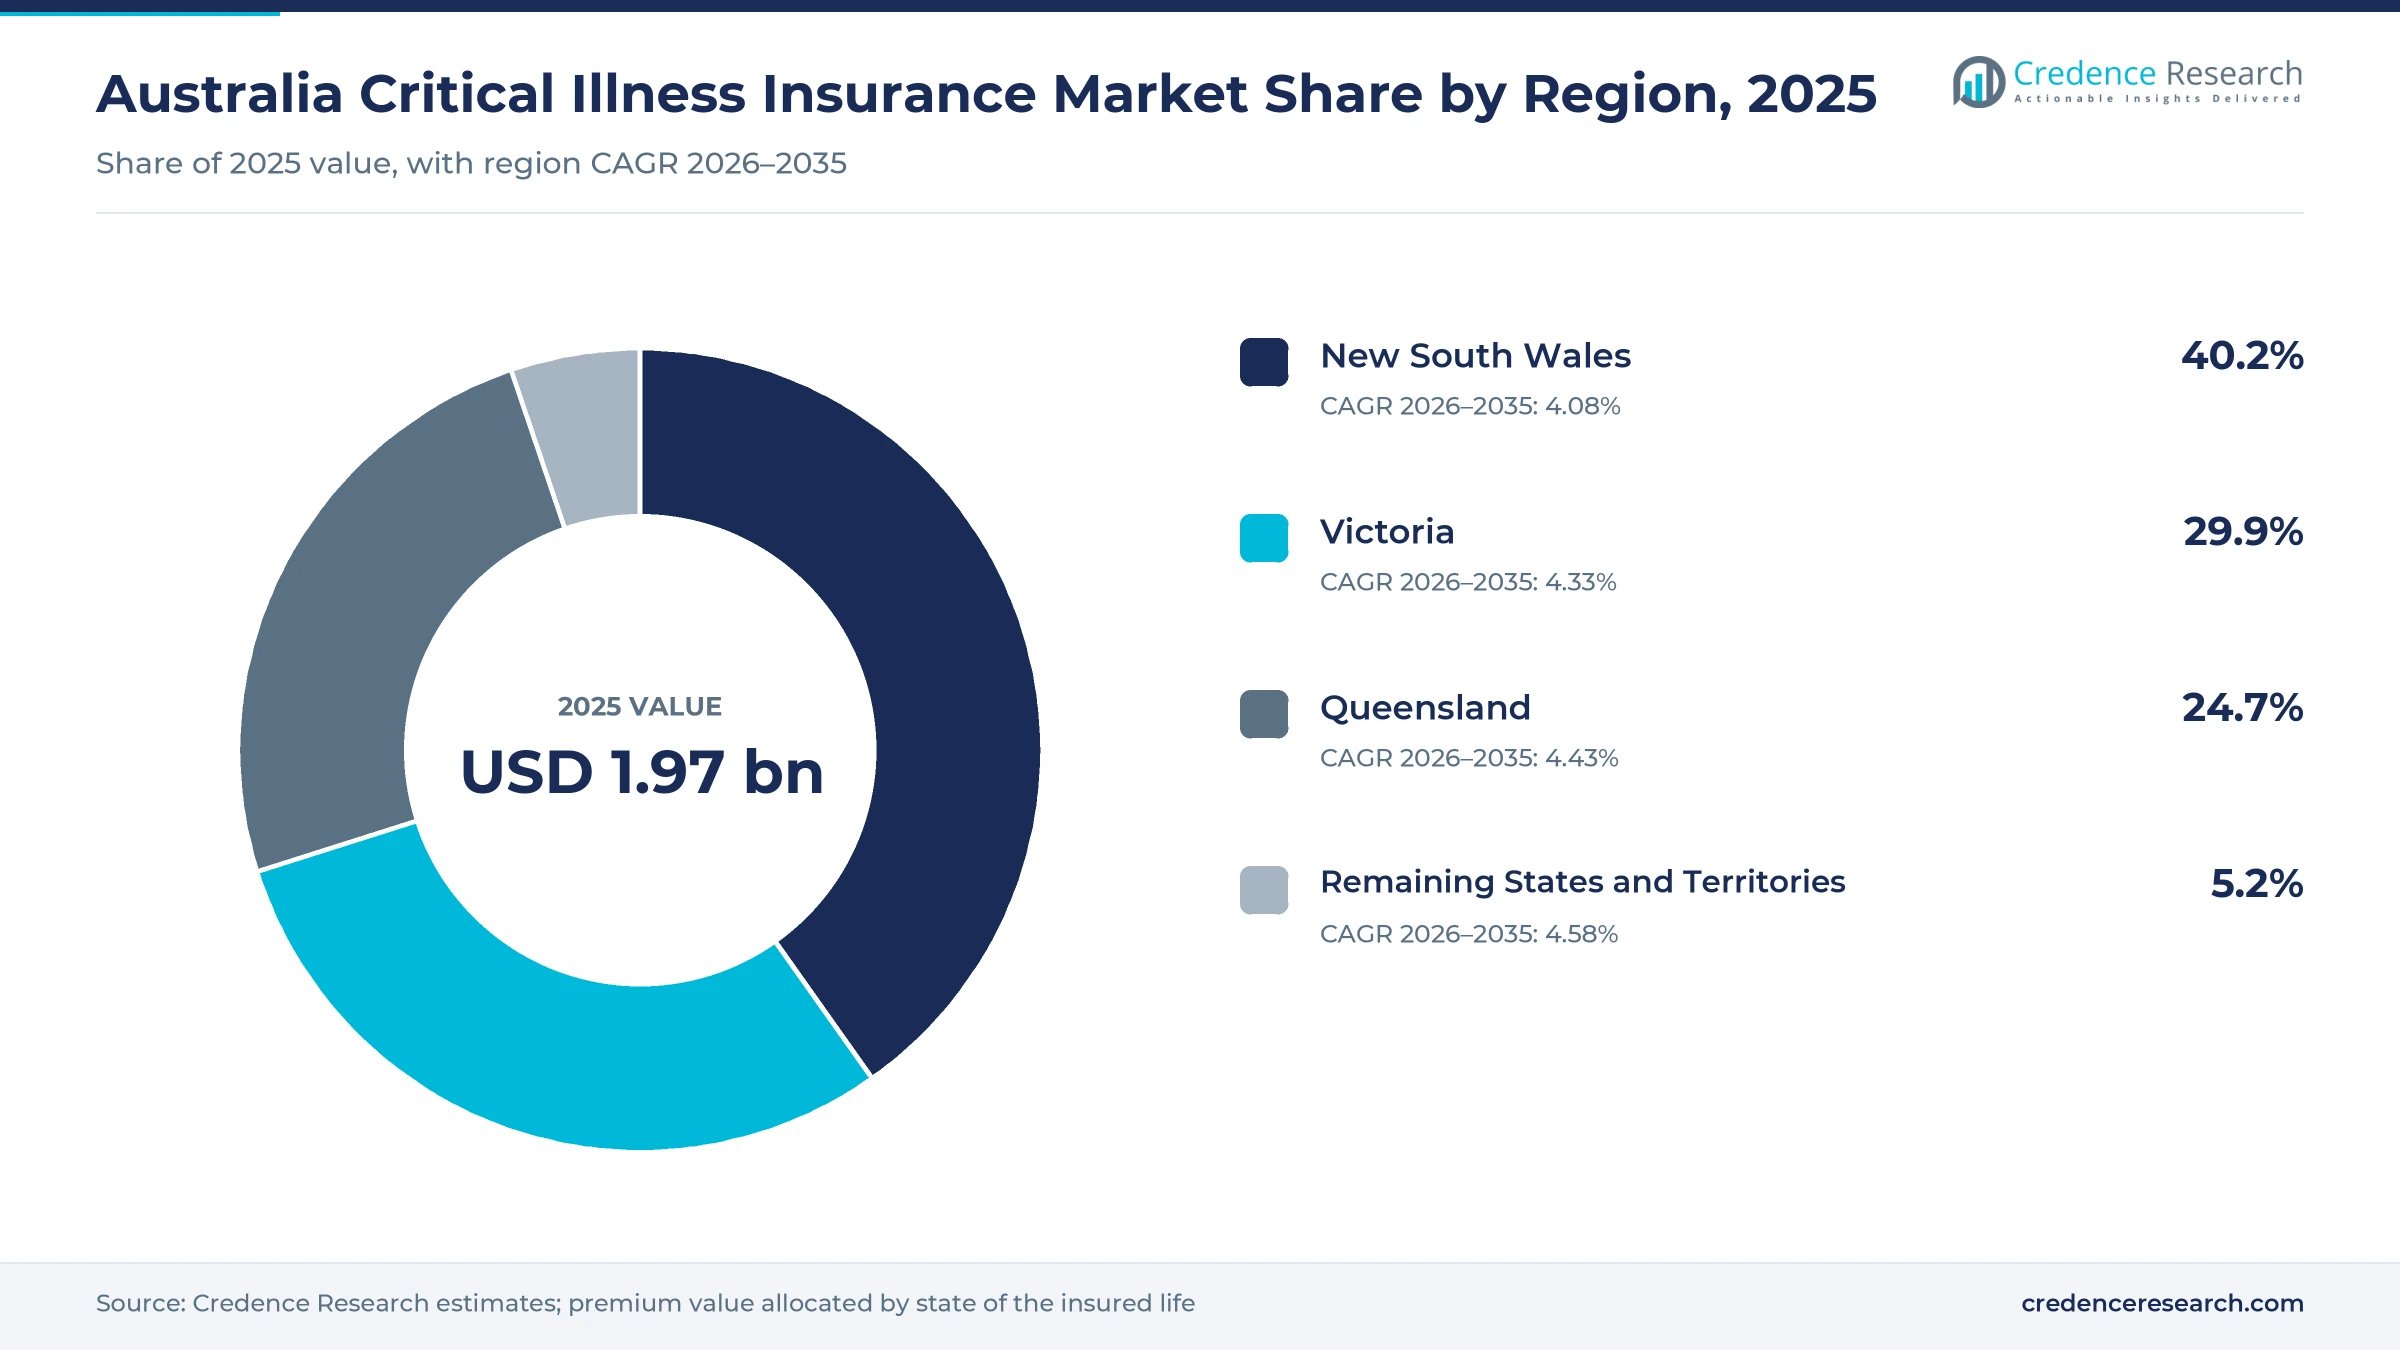
The Australia critical illness insurance market was valued at USD 1.97 billion in 2025 and is projected to increase from USD 2.06 billion in 2026 to USD 3.00 billion by 2035, registering a CAGR of 4.27% during 2026–2035. Demand comes from working households that want a lump sum after cancer, heart attack or stroke, business owners that protect partners and key staff, and employers that add trauma benefits to group plans. New South Wales held the largest regional share, 40.2% in 2025, because Sydney concentrates financial advisers, professional households and business owners. The remaining states and territories form the fastest-growing region at 4.58% a year, as Western Australia posts the quickest population growth. Around 169,500 cancer diagnoses were estimated for 2024, which keeps recovery funding needs high. In turn, regulators asked life insurers in June 2025 to relabel stepped and level premiums as variable age-stepped and variable premiums, which is reshaping how trauma cover is priced and sold.
Which trauma benefits and policies does the estimate cover?
The estimate measures the value of premiums written by Australian life insurers for trauma and critical illness benefits. It covers standalone and linked trauma policies, comprehensive trauma options with wider condition lists, and child trauma riders attached to adult policies. Values include cover bought through financial advisers, cover bought directly from insurers or online platforms, and group ordinary cover arranged by employers.
The estimate excludes death, total and permanent disability and income protection premiums, private health insurance and accident-only products sold by general insurers. The value chain runs from reinsurers and licensed life insurers through product platforms, financial advisers, direct sales teams and employers to individuals, business owners and families in every state and territory.
Australia Critical Illness Insurance Market Insights
- The Australia critical illness insurance market was valued at USD 1.97 billion in 2025 and is projected to reach USD 3.00 billion by 2035, registering a CAGR of 4.27% during 2026–2035.
- New South Wales held a 40.2% share of 2025 premium value, because Sydney concentrates advisers, business owners and higher-income households.
- Standard trauma cover led with a 52.0% share of 2025 value, because most advised and direct policies use its core list of conditions.
- Trauma claims were admitted at 88% for individual advised policies and 84% for non-advised policies in the 12 months to Dec. 31, 2025.
- MLC Life rebranded as Acenda in September 2025 ahead of its merger with Resolution Life Australasia, creating a larger rival for advised trauma business.
Standard trauma leads while child riders grow fastest
Why does standard trauma cover lead product demand?
Based on product type, the market is categorized into standard trauma cover, comprehensive trauma cover and paid child trauma riders. Standard Trauma Cover led with a 52.0% share of 2025 value, because it covers the major cancer, heart and stroke events at a lower premium. Paid Child Trauma Riders grow fastest at 4.85% a year, as parents add low-cost cover for serious childhood illness to their own policies.
How do individuals and businesses split trauma premiums?
Based on customer segment, the market is categorized into individual policyholders, business protection purchasers and employer group purchasers. Individual Policyholders led with a 72.0% share of 2025 value, because most trauma cover is bought to protect household income and savings. Employer Group Purchasers grow fastest at 4.66% a year, as employers add trauma benefits to attract and keep staff.
Why is the non-advised channel gaining ground?
Based on distribution channel, the market is categorized into individual advised, individual non-advised and group ordinary. Individual Advised led with a 62.0% share of 2025 value, because fully underwritten trauma cover is still mostly arranged through advisers. Individual Non-Advised grows fastest at 4.75% a year, as direct insurers and online quotes reach families without an adviser.
How are premium structures changing trauma pricing?
Based on revenue model, the market is categorized into variable age-stepped premiums, variable premiums and blended premium structures. Variable Age-Stepped Premiums led with a 58.0% share of 2025 value, because they keep starting premiums low for younger buyers. Blended Premium Structures grow fastest at 4.86% a year, as insurers design products that limit sudden premium jumps later in life.
| Segment Group | Leading Sub-segment | Share, 2025 | Fastest-growing Sub-segment | CAGR, 2026–2035 |
|---|---|---|---|---|
| By Product Type | Standard Trauma Cover | 52.0% | Paid Child Trauma Riders | 4.85% |
| By Customer Segment | Individual Policyholders | 72.0% | Employer Group Purchasers | 4.66% |
| By Distribution Channel | Individual Advised | 62.0% | Individual Non-Advised | 4.75% |
| By Revenue Model | Variable Age-Stepped Premiums | 58.0% | Blended Premium Structures | 4.86% |
Request a Free Sample
Fill in your details and we'll send you a free sample report.
- Sample data tables & charts
- Research methodology
Recovery costs, population and new products lift demand
How do recovery funding needs lift trauma cover demand?
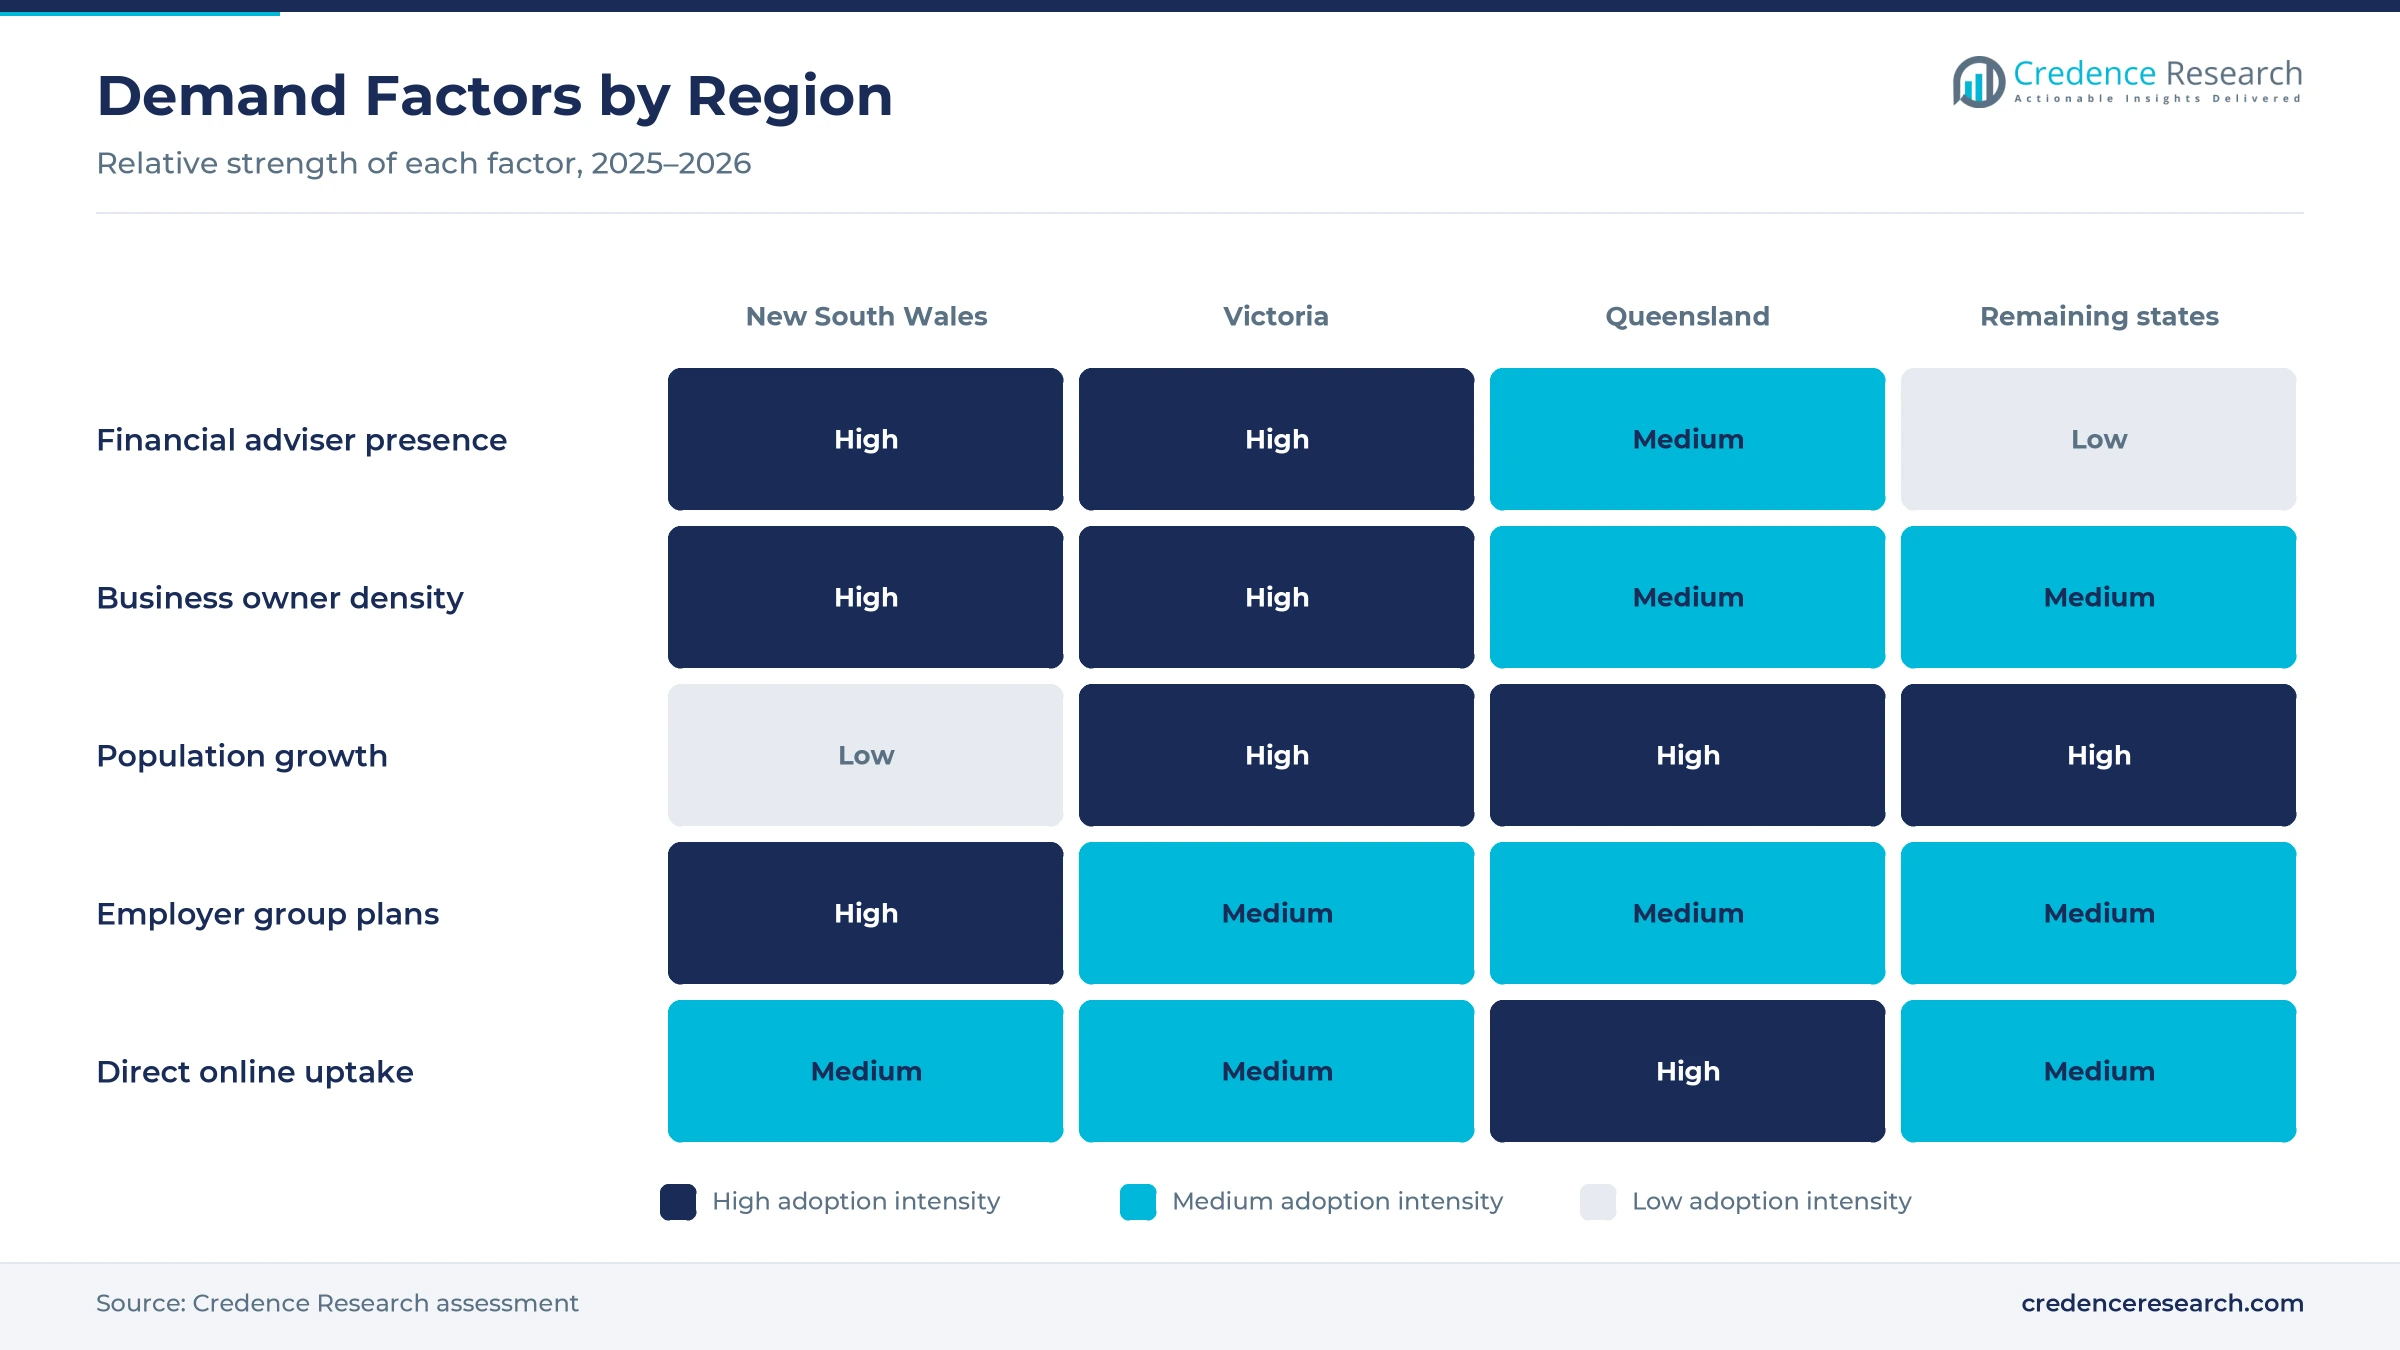
Recovery funding needs lift demand, because a lump sum helps households pay for treatment, travel and lost income after a serious diagnosis. About 169,500 cancer cases and around 52,700 cancer deaths were estimated for 2024, according to Cancer Council Australia. Almost one in two Australians will be diagnosed with cancer by age 85, while around 71% of people diagnosed in 2016-2020 survived five years. Separately, the Stroke Foundation reported that 45,785 Australians experienced a stroke in 2023, and close to half a million stroke survivors live in the community. As a result, standard trauma cover holds a 52.0% share of 2025 value, as more people survive and need funds for recovery.
Why does population and household growth widen the buyer base?
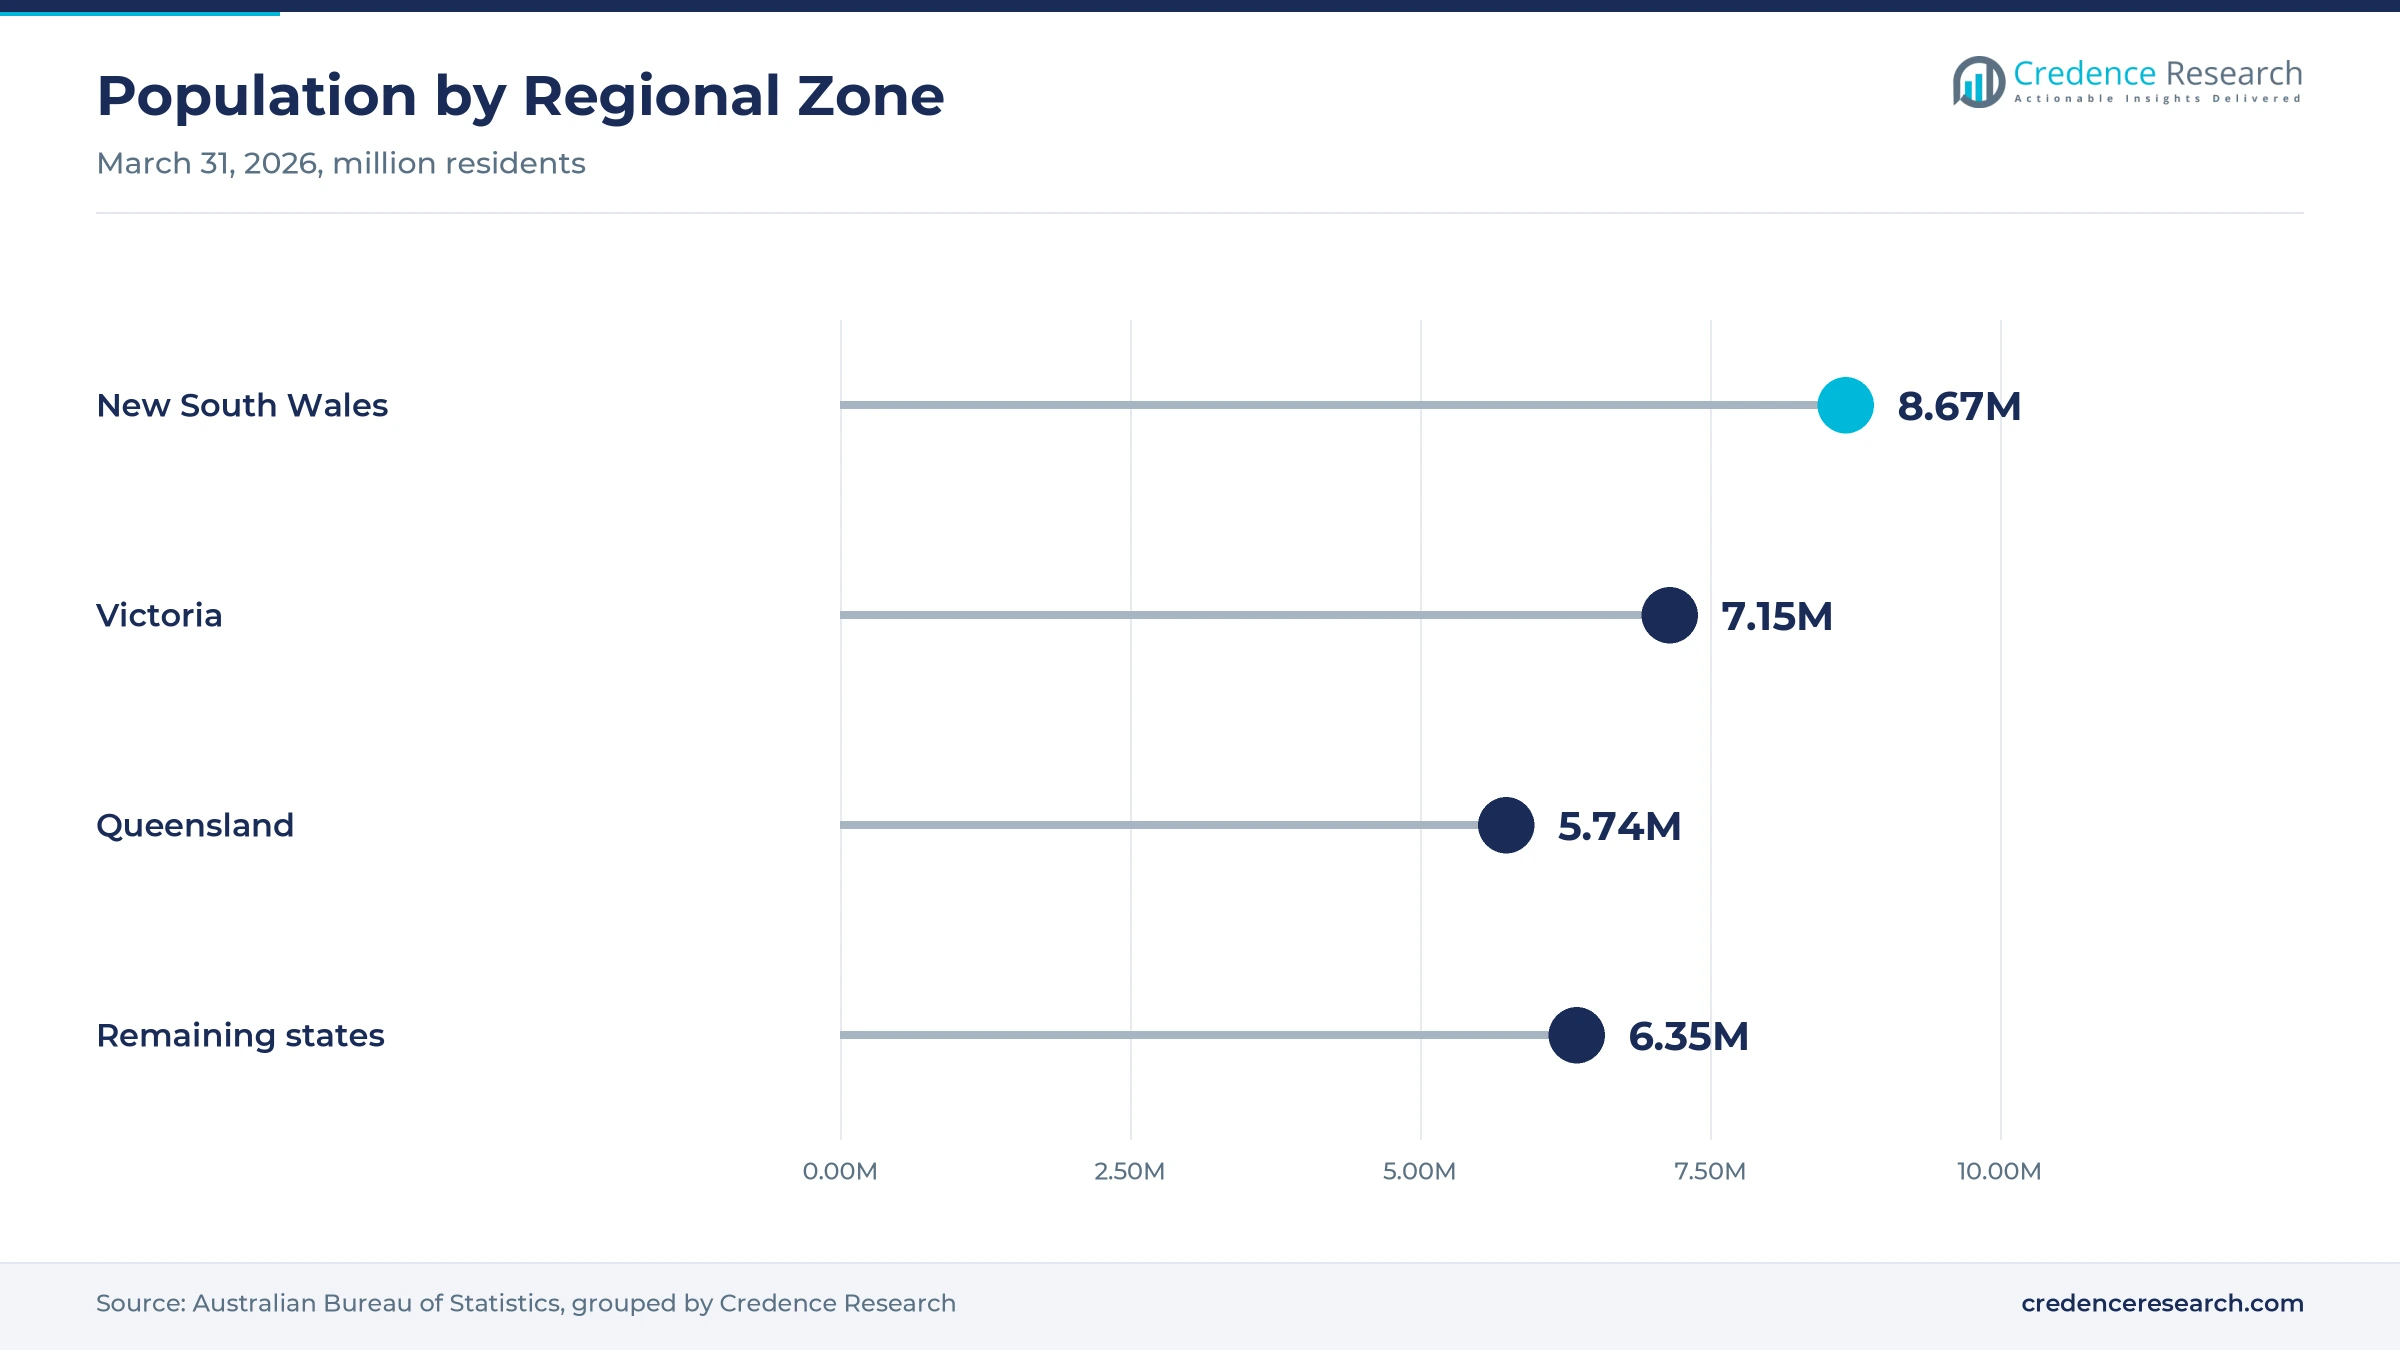
Population and household growth widens the buyer base, because each new working family needs protection for its income and mortgage. Australia's population reached about 27.9 million at March 31, 2026, after growing 1.4% over the year, according to the Australian Bureau of Statistics. Western Australia grew fastest at 2.1%, while the larger eastern states added more than 296,000 residents combined. People aged 65 and over also rose to about 18.1% of the population in 2025 from 17.4% in 2023, according to World Bank data, which keeps older policyholders renewing cover. In turn, the remaining states and territories post the fastest regional growth, led by strong Western Australian migration.
How does product and distribution innovation open new buyers?
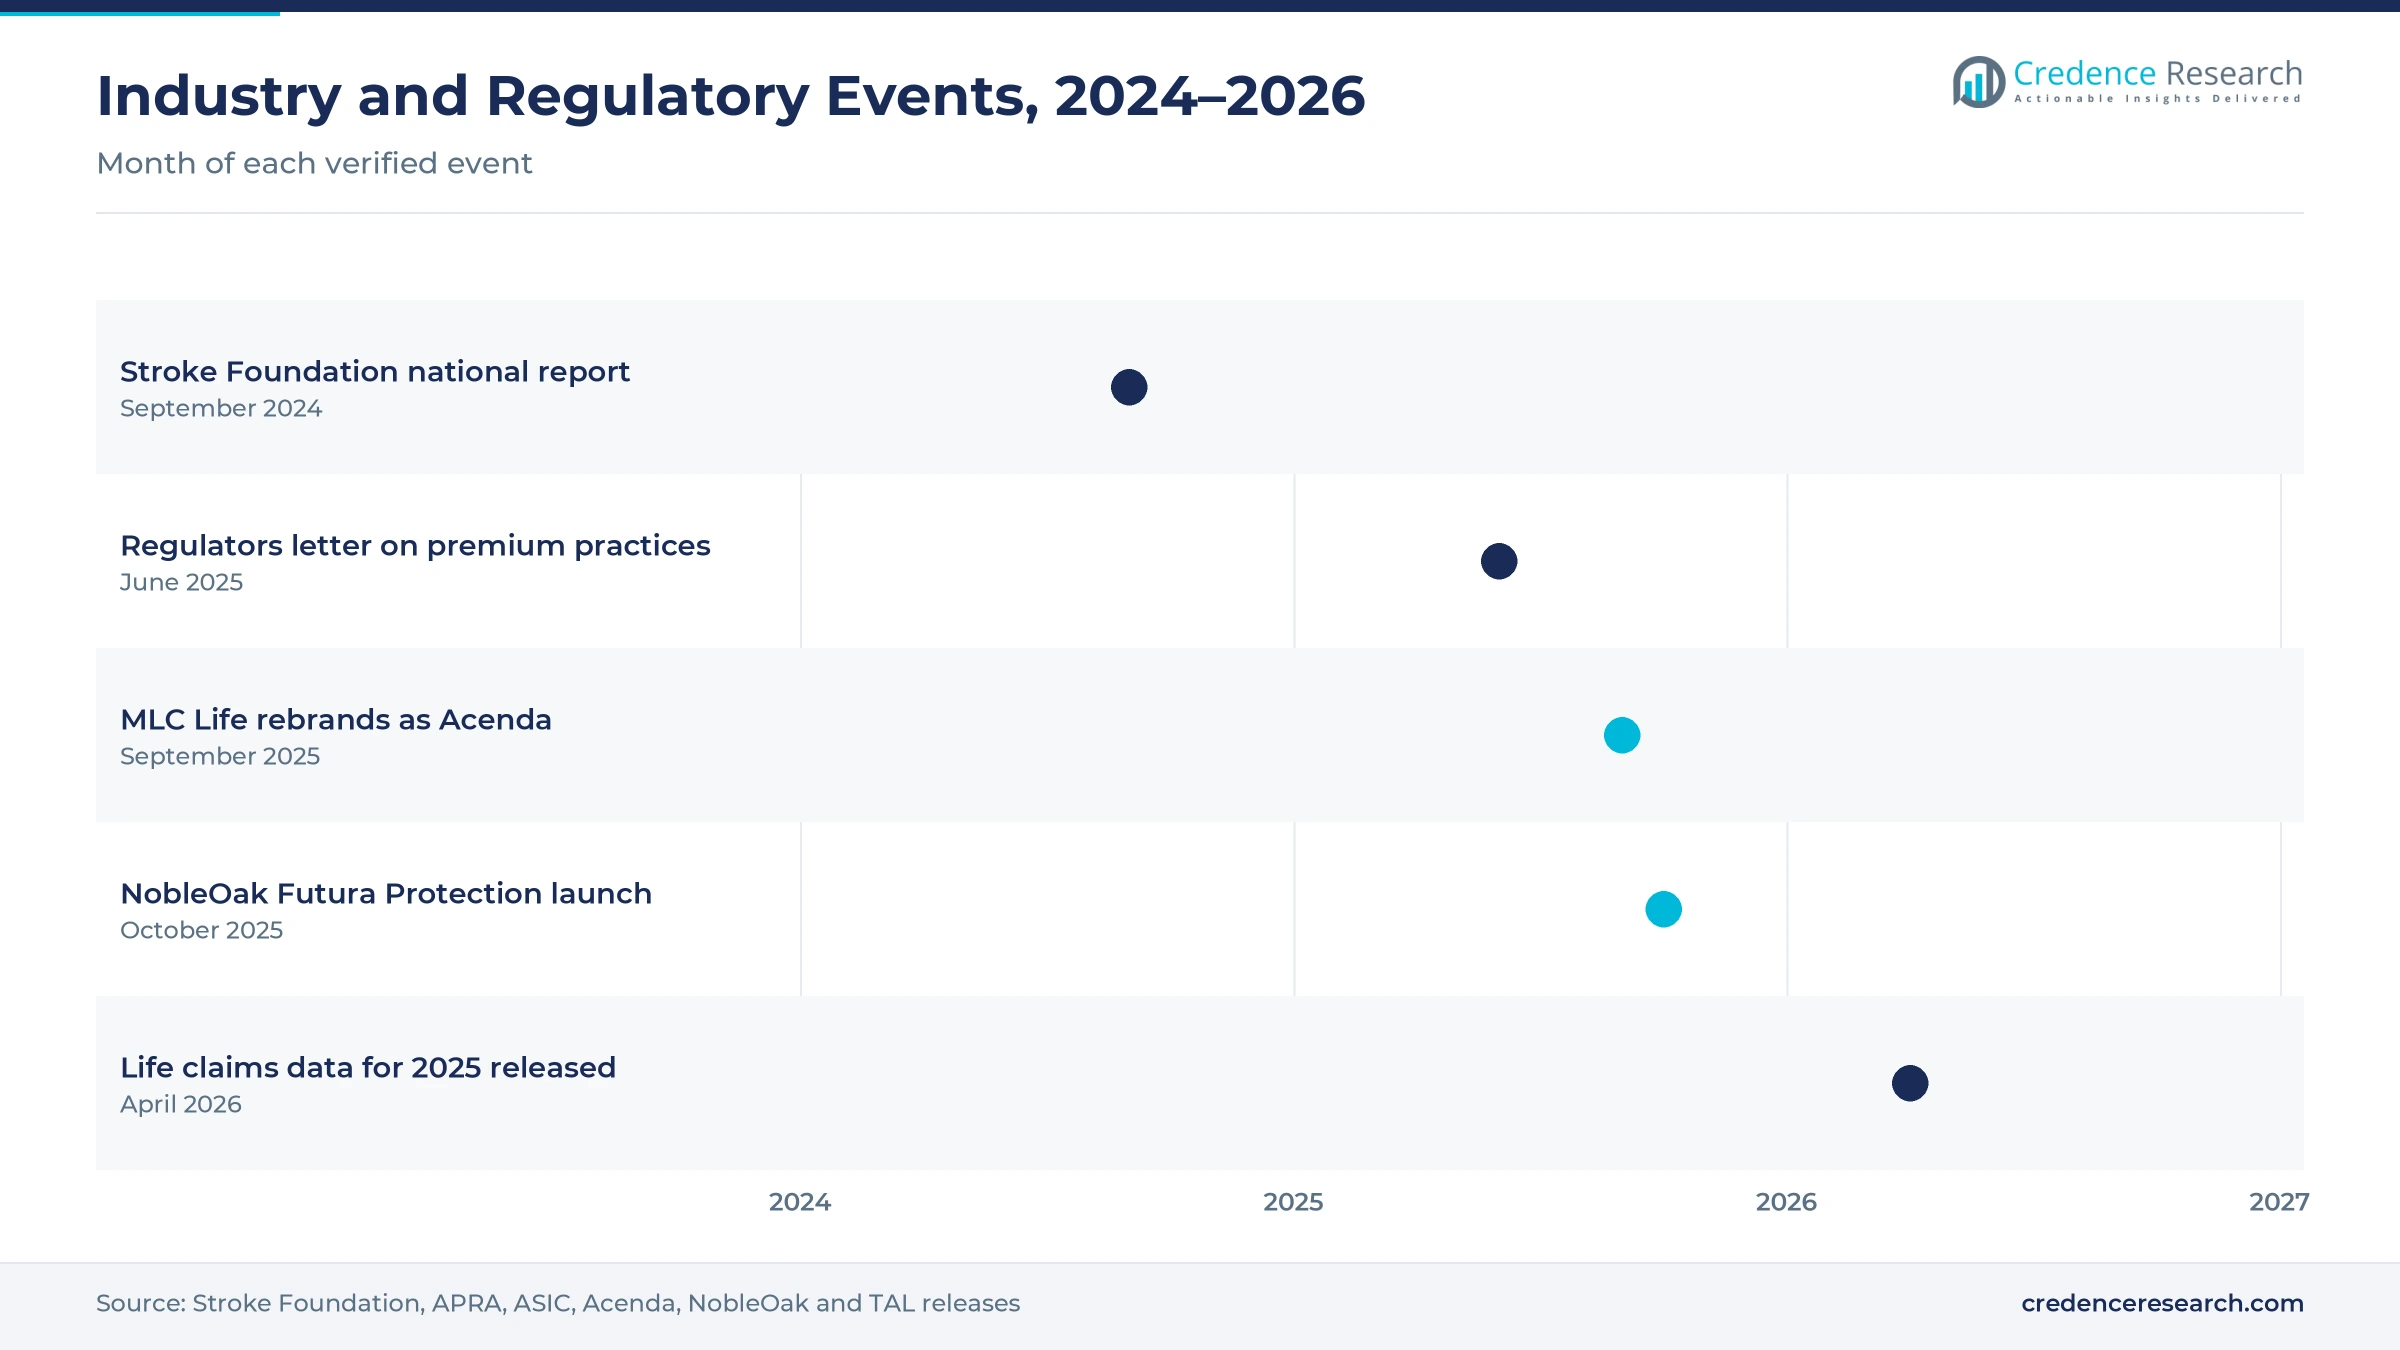
Product and distribution innovation opens new buyers, because platforms let insurers launch advised products faster and reach advisers who left retail life sales. NobleOak made Futura Protection available on Oct. 1, 2025, a new advised product built with NEOS that includes critical illness and child cover. MLC Life rebranded as Acenda in September 2025 ahead of its merger with Resolution Life Australasia, which is set to serve more than 2 million Australians. Regulators also renamed stepped and level premiums as variable age-stepped and variable premiums in June 2025. As a result, paid child trauma riders grow at 4.85% a year, the fastest product rate, as new products bundle family cover.
Why do higher claims admittance rates build buyer trust?
Higher claims admittance rates build buyer trust, because households buy trauma cover only when they expect insurers to pay. Trauma claims were admitted at 88% for individual advised policies and 84% for non-advised policies in the 12 months to Dec. 31, 2025, according to regulator claims data. Group ordinary trauma claims were admitted at 95% over the same period. In addition, 56% of trauma claims were completed within two weeks, with an average duration of 1.4 months. In turn, the individual non-advised channel grows at 4.75% a year, as clearer claims outcomes support direct sales of cancer support funding cover.
Premium reform, platforms and new owners reshape supply
How is the shift to variable premium labels changing sales?
The shift to variable premium labels is changing how trauma cover is sold, because buyers now see that premiums can rise over time. The prudential regulator and the conduct regulator wrote to life insurers on June 5, 2025, after reviewing premium increase practices first raised in December 2022 and again in December 2023. The letter replaced the stepped premium label with variable age-stepped premium and the level premium label with variable premium. It also noted that advised individual cover costs consumers about $9.4 billion a year. As a result, blended premium structures grow at 4.86% a year, the fastest pricing rate, as insurers redesign products.
Why is the rise of platform-built advised products notable?
The rise of platform-built advised products is notable, because shared technology lets smaller insurers enter advised trauma sales without building every system in house. NobleOak launched Futura Protection on Oct. 1, 2025, through the NEOS adviser platform, combining its underwriting with NEOS distribution. The product offers life, disability, critical illness, child and income protection cover in one package. Acenda also launched its new brand in September 2025 ahead of combining with Resolution Life Australasia. In turn, comprehensive trauma cover grows at a steady rate, as new products widen condition lists and advisers compare more insurers through insurtech platforms.
Can employer group trauma benefits open a new growth path?
Employer group trauma benefits offer a growth path, because group ordinary cover reaches workers who would not buy a retail policy. Group ordinary trauma claims were admitted at 95% in the 12 months to Dec. 31, 2025, the highest rate of any channel. The group ordinary claims paid ratio also reached 68%, compared with 58% for individual advised business and 44% for non-advised business. In addition, the population grew 1.4% in the year to March 2026, which adds new workers to employer plans. As a result, employer group purchasers grow at 4.66% a year, the fastest customer rate, as more firms add trauma cover to staff benefits.
Is there room to grow child trauma cover?
Child trauma cover has room to grow, because parents want funds to take time off work if a child faces a serious illness. NobleOak included child cover in its Futura Protection product launched on Oct. 1, 2025. The Stroke Foundation also reported close to half a million stroke survivors in 2024, which raises awareness of serious illness across age groups. Cancer Council Australia notes that survival exceeds 90% for some cancers, such as breast, prostate and melanoma, which extends recovery periods after breast cancer treatment. In turn, paid child trauma riders keep gaining share, as advisers add riders to existing family policies at low cost.
Premium volatility and disputes test trauma insurers
How does premium volatility push buyers to cancel cover?
Premium volatility pushes some buyers to cancel cover, because variable age-stepped premiums rise each year as policyholders age. Regulators found in June 2025 that product design fixes for premium volatility were still at an early stage. As a result, older policyholders often reduce sums insured or lapse cover in their 50s. Insurers respond with blended premium options, clearer renewal notices and the ability to switch structures.
Why do advice costs limit retail trauma sales?
Advice costs limit retail trauma sales, because fully underwritten cover still depends on advice for most buyers. Advice costs also rise when advisers must prepare detailed documents for each client. In turn, many families rely only on default cover in super, which does not include trauma benefits. Insurers respond with direct quotes, platform-built products and adviser support tools that reduce the time needed to write cover.
How do claims disputes affect trust in trauma cover?
Claims disputes affect trust, because buyers question whether medical definitions will match their diagnosis. Trauma dispute lodgements reached 61 per 100,000 lives in the individual advised segment in 2025. However, 47% of resolved disputes kept the original decision, while 4% were reversed. Insurers respond with updated definitions, clearer disclosure and faster reviews, often agreed with reinsurer partners that share the claims risk.
Why does underinsurance persist among younger households?
Underinsurance persists among younger households, because rent, mortgages and childcare costs leave little room for protection premiums. Many younger buyers also assume that public health care will cover every cost after a serious illness. As a result, they buy no trauma cover or choose very low sums insured. Insurers respond with lower entry premiums, child riders and online calculators that show income needs during recovery.
New South Wales leads while smaller states grow fastest
| Region | Value, 2025 (USD billion) | Share, 2025 | CAGR, 2026–2035 |
|---|---|---|---|
| New South Wales | 0.79 | 40.2% | 4.08% |
| Victoria | 0.59 | 29.9% | 4.33% |
| Queensland | 0.49 | 24.7% | 4.43% |
| Remaining States and Territories | 0.10 | 5.2% | 4.58% |
Why does new South Wales hold the largest share?
New South Wales held a 40.2% share of 2025 value and grows at 4.08% a year, because the state concentrates financial advisers, professional households and business owners that buy key person cover. The state had about 8.67 million residents at March 31, 2026, the largest population of any state. However, growth is slower than in other zones because its population grew only 1.1% over the year to March 2026.
How does Victoria support trauma premium growth?
Victoria held a 29.9% share of 2025 value and grows at 4.33% a year, because the state has the second-largest population and a broad base of salaried workers and small business owners. The state added about 109,500 residents in the year to March 2026, a growth rate of 1.6%. This growth lifts demand for trauma cover among new households, while Melbourne-based advisers keep advised sales strong.
Why does Queensland grow faster than the larger states?
Queensland held a 24.7% share of 2025 value and grows at 4.43% a year, because steady migration from other states keeps adding working families. The state added about 90,100 residents in the year to March 2026, a growth rate of 1.6%. As a result, demand for trauma cover rises among younger families that take on mortgages in southeast Queensland growth corridors.
What drives demand in the remaining states and territories?
The remaining states and territories held a 5.2% share of 2025 value and grow fastest at 4.58% a year, because Western Australia recorded the quickest state population growth at 2.1% in the year to March 2026. Resource sector workers and public sector employees in these zones also add to employer group and individual demand.
Rebrands, launches and premium reviews from 2024 to 2026
| Development | Status and market relevance |
|---|---|
| In September 2025, MLC Life rebranded as Acenda ahead of its merger with Resolution Life Australasia. | Positioned to serve more than 2 million Australians |
| In October 2025, NobleOak launched Futura Protection with NEOS for the advised market. | Added critical illness and child cover on the NEOS platform |
| In June 2025, the prudential and conduct regulators issued a joint letter on life premium practices. | Renamed stepped and level premiums as variable premiums |
| In April 2026, regulators published life claims data for the 12 months to Dec. 31, 2025. | Showed trauma admittance rates of 84% to 95% by channel |
| In June 2026, TAL reported paying about 57,000 customers and families in a year. | Mental health and cancer were the leading claim causes |
Digital underwriting and claims tools reshape trauma cover
- Automated underwriting engines ask health questions online and approve many applicants without medical tests, which shortens time to cover.
- Adviser quoting platforms compare trauma definitions and premiums across insurers, which helps advisers place cover quickly.
- Digital claims portals collect medical reports and track claims online, which helps insurers settle most trauma claims within weeks.
- Wellness and health programs reward healthy activity with premium discounts, which supports retention of protection cover.
Need a Custom Version of This Report?
Tailor the scope, geography, or segments to your exact requirements.
- Custom geography or segment scope
- Direct access to our analyst team
Retail life insurers compete on definitions and advice reach
Competition is led by large retail life insurers that sell trauma cover through advisers, alongside direct insurers and platform partners. TAL paid benefits to about 57,000 customers and families between April 2025 and March 2026, with mental health and cancer the leading claim causes. Acenda, formerly MLC Life, is combining with Resolution Life Australasia and expects to serve more than 2 million Australians. NobleOak expanded into advised sales with Futura Protection on the NEOS platform in October 2025. AIA Australia, Zurich Australia, MetLife Australia, ClearView Life Assurance and OnePath Life also compete for adviser and group business. Rivals compete on medical definitions, claims service, premium stability, underwriting speed and adviser support, while reinsurers shape pricing and product terms.
Companies profiled and their roles in this market
| Company | Type | Role in the market |
|---|---|---|
| TAL Life | Retail and group life insurer | Paid about 57,000 customers and families in a year to March 2026 |
| Acenda | Retail and group life insurer | Rebranded from MLC Life in September 2025 |
| Resolution Life Australasia | Life insurer | Merging with Acenda under common ownership |
| NobleOak Life | Direct and advised life insurer | Launched Futura Protection with NEOS in October 2025 |
| NEOS | Advised product platform | Distributes Futura Protection to advisers |
Credence Research view on Australian trauma protection
Credence Research's view is that Australian trauma premium value will grow steadily because more people survive cancer, heart attack and stroke and need funds for recovery. Standard trauma cover remains the core product, while child riders, employer group plans and direct sales gain share. Premium reform and platform launches are reshaping supply, although premium volatility and advice costs still limit retail growth. Insurers that keep premiums stable, pay claims quickly and reach buyers through both advisers and direct channels should gain share fastest.
How the Australian trauma premium estimate was built
The report uses 2025 as the base year on a calendar basis, and market values come from the Credence Research model. That model combines regulator life claims statistics, regulator letters on premium practices, cancer and stroke statistics, population statistics, World Bank demographic data and company announcements on products, brands and mergers. Segment splits and regional growth rates are Credence Research estimates, while regional shares follow the client-defined split. Sources used are public reports, official statistics, trade press, regulator releases and company releases, and no interviews or surveys were used.
Protection gaps and product reform carry growth to 2035
Premium value is expected to reach USD 3.00 billion by 2035, a 4.27% CAGR during 2026–2035, as recovery funding needs, population growth and new products keep demand rising. Growth should stay moderate through 2028 while insurers adjust premium structures. After that, direct sales, child riders and employer group plans will carry more growth. Lower advice costs would lift advised sales, while sharp premium increases would raise lapses. Insurers with stable pricing and fast claims service are expected to gain the most.
Frequently Asked Questions
How big is the Australia critical illness insurance market?
Which product type leads Australian trauma premium value?
Which region leads the Australia critical illness insurance market?
How often are trauma claims paid in Australia?
Why does cancer matter so much for trauma cover?
Which distribution channel is growing fastest?
Who are the leading trauma insurers in Australia?
What are the main challenges for trauma insurers?
Table of Content
Chapter 1 Market Segmentation
- 1.1 Segmentation Framework
- 1.1.1 Product and Service Classification
- 1.1.2 Application and End-Use Classification
- 1.1.3 Technology and Solution Classification
- 1.1.4 Customer and Distribution Channel Classification
- 1.1.5 Geographic Segmentation
- 1.1.6 Market Segment Definitions and Boundaries
- 1.2 By Product Type
- 1.2.1 Standard Trauma Cover
- 1.2.2 Comprehensive Trauma Cover
- 1.2.3 Paid Child Trauma Riders
- 1.3 By Customer Segment
- 1.3.1 Individual Policyholders
- 1.3.2 Business Protection Purchasers
- 1.3.3 Employer Group Purchasers
- 1.4 By Revenue Model
- 1.4.1 Variable Age-Stepped Premiums
- 1.4.2 Variable Premiums
- 1.4.3 Blended Premium Structures
Chapter 2 Introduction
- 2.1 Report Objectives and Scope
- 2.2 Product Definition and Industry Terminology
- 2.3 Market Inclusions and Exclusions
- 2.4 Research Process
- 2.4.1 Primary Research and Expert Interviews
- 2.4.2 Secondary Research and Source Review
- 2.4.3 Top-Down and Bottom-Up Estimation
- 2.4.4 Data Triangulation and Verification
- 2.5 Market Size Measurement Basis
- 2.5.1 2025: USD 1.97 billion → 2035: USD 3.00 billion
- 2.6 Historical and Forecast Reference Periods
- 2.6.1 Historical Period: 2018-2025
- 2.6.2 Base Year: 2025
- 2.6.3 Forecast Period: 2025-2035
- 2.7 Research Assumptions and Limitations
Chapter 3 Executive Summary
- 3.1 Market Snapshot and Key Findings
- 3.2 Base-Year Market Size, 2025
- 3.3 Forecast Market Size, 2035
- 3.4 Revenue and Volume Growth Outlook
- 3.5 Key Demand and Supply Indicators
- 3.6 Leading Market Segments
- 3.7 Fastest-Growing Market Opportunities
- 3.8 Regional Performance Highlights
- 3.9 Technology and Industry Transformation
- 3.10 Competitive Landscape Summary
- 3.11 Analyst View and Strategic Implications
Chapter 4 Australia Critical Illness Insurance Market Trends and Developments
- 4.1 Historical Industry Development, 2018-2025
- 4.2 Recent Market Trends and Developments
- 4.3 Demand and Customer Behavior Trends
- 4.4 Technology and Product Innovation
- 4.5 Artificial Intelligence, Automation and Digitalization
- 4.6 Local Manufacturing and Supply Chain Realignment
- 4.7 Industry Partnerships, Mergers and Acquisitions
- 4.8 Sustainability and Circular Economy Developments
- 4.9 Government and Private Sector Investment Trends
- 4.10 Emerging Business Models and Commercialization
- 4.11 Industry Developments and Announcements
Chapter 5 Australia Critical Illness Insurance Market Supply and Demand Analysis
- 5.1 Demand Trend and Consumption Analysis, 2018-2025
- 5.2 Demand Forecast, 2025-2035
- 5.3 Supply Chain Structure and Procurement Trends
- 5.4 Supply-Demand Gap and Bottlenecks
- 5.5 Import Dependence and Sourcing Structure
- 5.6 Regional Supply and Demand Concentration
Chapter 6 Australia Critical Illness Insurance Market Pricing Analysis
- 6.1 Pricing Structure and Measurement
- 6.2 Historical Pricing Trends, 2018-2025
- 6.3 Pricing Outlook, 2025-2035
- 6.4 Pricing by Product and Market Segment
- 6.5 Geographic Pricing Differences
- 6.6 Key Input, Energy, Labor and Logistics Costs
- 6.7 Contract Pricing and Purchasing Models
- 6.8 Pricing Sensitivity and Competitive Positioning
- 6.9 Price, Margin and Profitability Implications
Chapter 7 Australia Critical Illness Insurance Market Dynamics
- 7.1 Market Growth Drivers
- 7.1.1 Demand-Side Drivers
- 7.1.2 Technology and Innovation Drivers
- 7.1.3 Infrastructure and Investment Drivers
- 7.1.4 Regulatory and Policy Drivers
- 7.2 Market Restraints
- 7.2.1 Cost and Affordability Constraints
- 7.2.2 Technology and Adoption Barriers
- 7.2.3 Supply Chain and Operational Constraints
- 7.3 Market Challenges
- 7.3.1 Competitive Pressure and Margin Erosion
- 7.3.2 Skills, Infrastructure and Implementation Gaps
- 7.4 Emerging Market Opportunities
- 7.5 Market Dynamics Impact and Time-Horizon Assessment
Chapter 8 Australia Critical Illness Insurance Value Chain Analysis
- 8.1 Industry Value Chain Overview
- 8.2 Upstream Suppliers and Critical Inputs
- 8.3 Technology and Component Providers
- 8.4 Manufacturing or Service Delivery
- 8.5 Distribution, Channel Partners and Integrators
- 8.6 Downstream Applications and End Users
- 8.7 Value Addition and Profit Pools
- 8.8 Vertical Integration and Outsourcing
- 8.9 Supplier Concentration and Risk
- 8.10 Supply Chain Localization and Resilience
Chapter 9 Australia Critical Illness Insurance Market Regulations and Policies
- 9.1 Relevant Laws, Standards and Compliance Frameworks
- 9.2 Product, Service, Safety and Quality Requirements
- 9.3 Government Policies, Incentives and Subsidies
- 9.4 Imports, Exports and Trade Barriers
- 9.5 Public Procurement and Local Content Requirements
- 9.6 Data Protection, AI and Cybersecurity Compliance
- 9.7 Upcoming Policy Changes and Market Implications
Chapter 10 Australia Critical Illness Insurance Market Hotspots and Opportunities
- 10.1 Market Opportunity Mapping and Growth Hotspots
- 10.2 High-Growth Applications and Customer Groups
- 10.3 Underserved Markets and White-Space Opportunities
- 10.4 Emerging Technology and Product Opportunities
- 10.5 New Capacity and Investment Hotspots
- 10.6 Market Entry and Expansion Opportunities
- 10.7 Distribution and Partnership Opportunities
- 10.8 Near-Term and Long-Term Commercial Potential
- 10.9 Opportunity Attractiveness and Execution Risks
Chapter 11 Australia Critical Illness Insurance Market Outlook, 2025-2035
- 11.1 Market Size and Analysis
- 11.1.1 Revenue (Market Measurement: 2025: USD 1.97 billion → 2035: USD 3.00 billion)
- 11.1.2 Historical Market Size, 2018-2025
- 11.1.3 Base-Year Market Size, 2025
- 11.2 Market Forecast, 2025-2035
- 11.2.1 Revenue Forecast to 2035
- 11.2.2 CAGR and Year-on-Year Growth
- 11.2.3 Incremental Revenue Opportunity
- 11.3 Forecast Assumptions and Scenario Analysis
- 11.3.1 Base-Case Forecast
- 11.3.2 Optimistic and Conservative Scenarios
- 11.3.3 Technology, Pricing and Policy Sensitivities
- 11.4 Market Attractiveness and Growth Outlook
Chapter 12 Australia Critical Illness Insurance Market Segmentation and Outlook
- 12.1 Segmentation Summary and Market Shares, 2025
- 12.2 Largest and Fastest-Growing Segments
- 12.3 By Product Type - Market Size and Forecast, 2025-2035
- 12.3.1 Segment Definition and Scope
- 12.3.2 Historical Market Size, 2018-2025
- 12.3.3 Revenue Forecast, 2025-2035
- 12.3.4 Base-Year Market Share, 2025
- 12.3.5 Segment CAGR and Growth Drivers
- 12.3.6 Subsegment Market Size and Forecast
- 12.3.6.1 Standard Trauma Cover
- 12.3.6.2 Comprehensive Trauma Cover
- 12.3.6.3 Paid Child Trauma Riders
- 12.3.7 Subsegment Pricing and Adoption Trends
- 12.3.8 Leading Suppliers and Competition
- 12.3.9 Regional Demand and Opportunities
- 12.4 By Customer Segment - Market Size and Forecast, 2025-2035
- 12.4.1 Segment Definition and Scope
- 12.4.2 Historical Market Size, 2018-2025
- 12.4.3 Revenue Forecast, 2025-2035
- 12.4.4 Base-Year Market Share, 2025
- 12.4.5 Segment CAGR and Growth Drivers
- 12.4.6 Subsegment Market Size and Forecast
- 12.4.6.1 Individual Policyholders
- 12.4.6.2 Business Protection Purchasers
- 12.4.6.3 Employer Group Purchasers
- 12.4.7 Subsegment Pricing and Adoption Trends
- 12.4.8 Leading Suppliers and Competition
- 12.4.9 Regional Demand and Opportunities
- 12.5 By Revenue Model - Market Size and Forecast, 2025-2035
- 12.5.1 Segment Definition and Scope
- 12.5.2 Historical Market Size, 2018-2025
- 12.5.3 Revenue Forecast, 2025-2035
- 12.5.4 Base-Year Market Share, 2025
- 12.5.5 Segment CAGR and Growth Drivers
- 12.5.6 Subsegment Market Size and Forecast
- 12.5.6.1 Variable Age-Stepped Premiums
- 12.5.6.2 Variable Premiums
- 12.5.6.3 Blended Premium Structures
- 12.5.7 Subsegment Pricing and Adoption Trends
- 12.5.8 Leading Suppliers and Competition
- 12.5.9 Regional Demand and Opportunities
- 12.6 Segment Growth Comparison
- 12.7 Segment Attractiveness and Priority Matrix
Chapter 13 Australia Critical Illness Insurance End-Use and Application Market Outlook
- 13.1 End-Use Industry and Customer Demand Structure
- 13.2 Leading Applications and Customer Groups
- 13.3 End-Use Market Size, Share and Forecast
- 13.4 Major End-Use Industry Deep Dives
- 13.4.1 Customer Requirements and Use Cases
- 13.4.2 Demand and Replacement Cycles
- 13.4.3 Technical and Regulatory Considerations
- 13.4.4 Purchasing and Procurement Models
- 13.4.5 Leading Vendors and Distribution Channels
- 13.4.6 Forecast and Commercial Opportunities
- 13.5 Emerging Applications and Cross-Segment Demand
- 13.6 End-Use Industry Investment Priorities
Chapter 14 Australia Critical Illness Insurance Geographic Market Outlook, 2025-2035
- 14.1 Domestic Market Distribution and Demand Clusters
- 14.2 State- or Province-Wise Market Size and Forecast, 2025-2035
- 14.3 City and Metropolitan Market Outlook
- 14.4 Industrial, Manufacturing and Commercial Clusters
- 14.5 Geographic Concentration of Key End Users
- 14.6 Local Pricing and Purchasing Differences
- 14.7 Domestic Production Facilities and Capacity Map
- 14.8 Local Infrastructure and Project Pipeline
- 14.9 State-Level Policy and Incentive Differences
- 14.10 Subnational Investment Hotspots and Opportunities
- 14.11 Distribution and Logistics Networks
- 14.12 Domestic Competitive Footprint
Chapter 15 Australia Critical Illness Insurance Technology, Innovation and Sustainability Outlook
- 15.1 Technology Landscape and Maturity
- 15.2 Product, Process and Service Innovation
- 15.3 AI, Automation and Digital Tools in the Industry
- 15.4 Technology Adoption and Performance Benchmarking
- 15.5 Innovation Pipeline and R&D Investment
- 15.6 Energy Efficiency and Resource Management
- 15.7 Sustainability, Recycling and Circularity
- 15.8 Technology Roadmap, 2025-2035
- 15.9 Risks of Obsolescence and Technology Substitution
Chapter 16 Australia Critical Illness Insurance Market Key Strategic Imperatives
- 16.1 Growth and Market Entry Priorities
- 16.2 High-Return Products and Segments
- 16.3 Pricing, Profitability and Cost Optimization
- 16.4 Technology Investment and Product Differentiation
- 16.5 Supply Chain Localization and Resilience
- 16.6 Distribution and Customer Acquisition
- 16.7 Partnership, Acquisition and Capacity Strategy
- 16.8 Regional Expansion Priorities
- 16.9 Short-, Medium- and Long-Term Actions
Chapter 17 Competition Outlook
- 17.1 Industry Competition Characteristics
- 17.2 Market Structure and Concentration
- 17.3 Market Share and Competitive Positioning, 2025
- 17.4 Company-Wise Revenue and Product Benchmarking
- 17.5 Production and Service Capacity Benchmarking
- 17.6 Technology, Pricing and Differentiation
- 17.7 Regional Footprint and Distribution Strength
- 17.8 Mergers, Acquisitions and Strategic Alliances
- 17.9 New Entrants and Competitive Threats
- 17.10 Porter's Five Forces and Industry Attractiveness
- 17.11 Competitive Outlook, 2025-2035
Chapter 18 Company Profiles
- 18.1 Company Coverage and Selection Criteria
- 18.2 TAL Life
- 18.2.1 Business Description
- 18.2.2 Company Ownership and Geographic Presence
- 18.2.3 Product and Service Portfolio
- 18.2.4 Manufacturing and Operating Footprint
- 18.2.5 Financial Performance and Investment
- 18.2.6 Market Share and Competitive Position
- 18.2.7 Technology and Innovation Capabilities
- 18.2.8 Strategic Alliances or Partnerships
- 18.2.9 Recent Developments
- 18.2.10 Growth Strategy and Outlook
- 18.3 AIA Australia
- 18.4 Zurich Australia
- 18.5 Acenda
- 18.6 MetLife Australia
- 18.7 NobleOak Life
- 18.8 ClearView Life Assurance
- 18.9 OnePath Life
- 18.10 Resolution Life Australasia
- 18.11 NEOS
- 18.12 Other Relevant Market Participants
Note: Every listed company is profiled on the structure shown under the first company. The company list is preliminary and may change based on research findings, market developments, data availability and client requirements.
Chapter 19 Disclaimer
- 19.1 Research and Forecast Disclaimer
- 19.2 Data Source and Estimation Limitations
Note: The depth of individual sections depends on data availability for this market. Volume, capacity, trade and other unit-based metrics are included where applicable.

