
Prescribed medicinal products and hemp drive steady demand
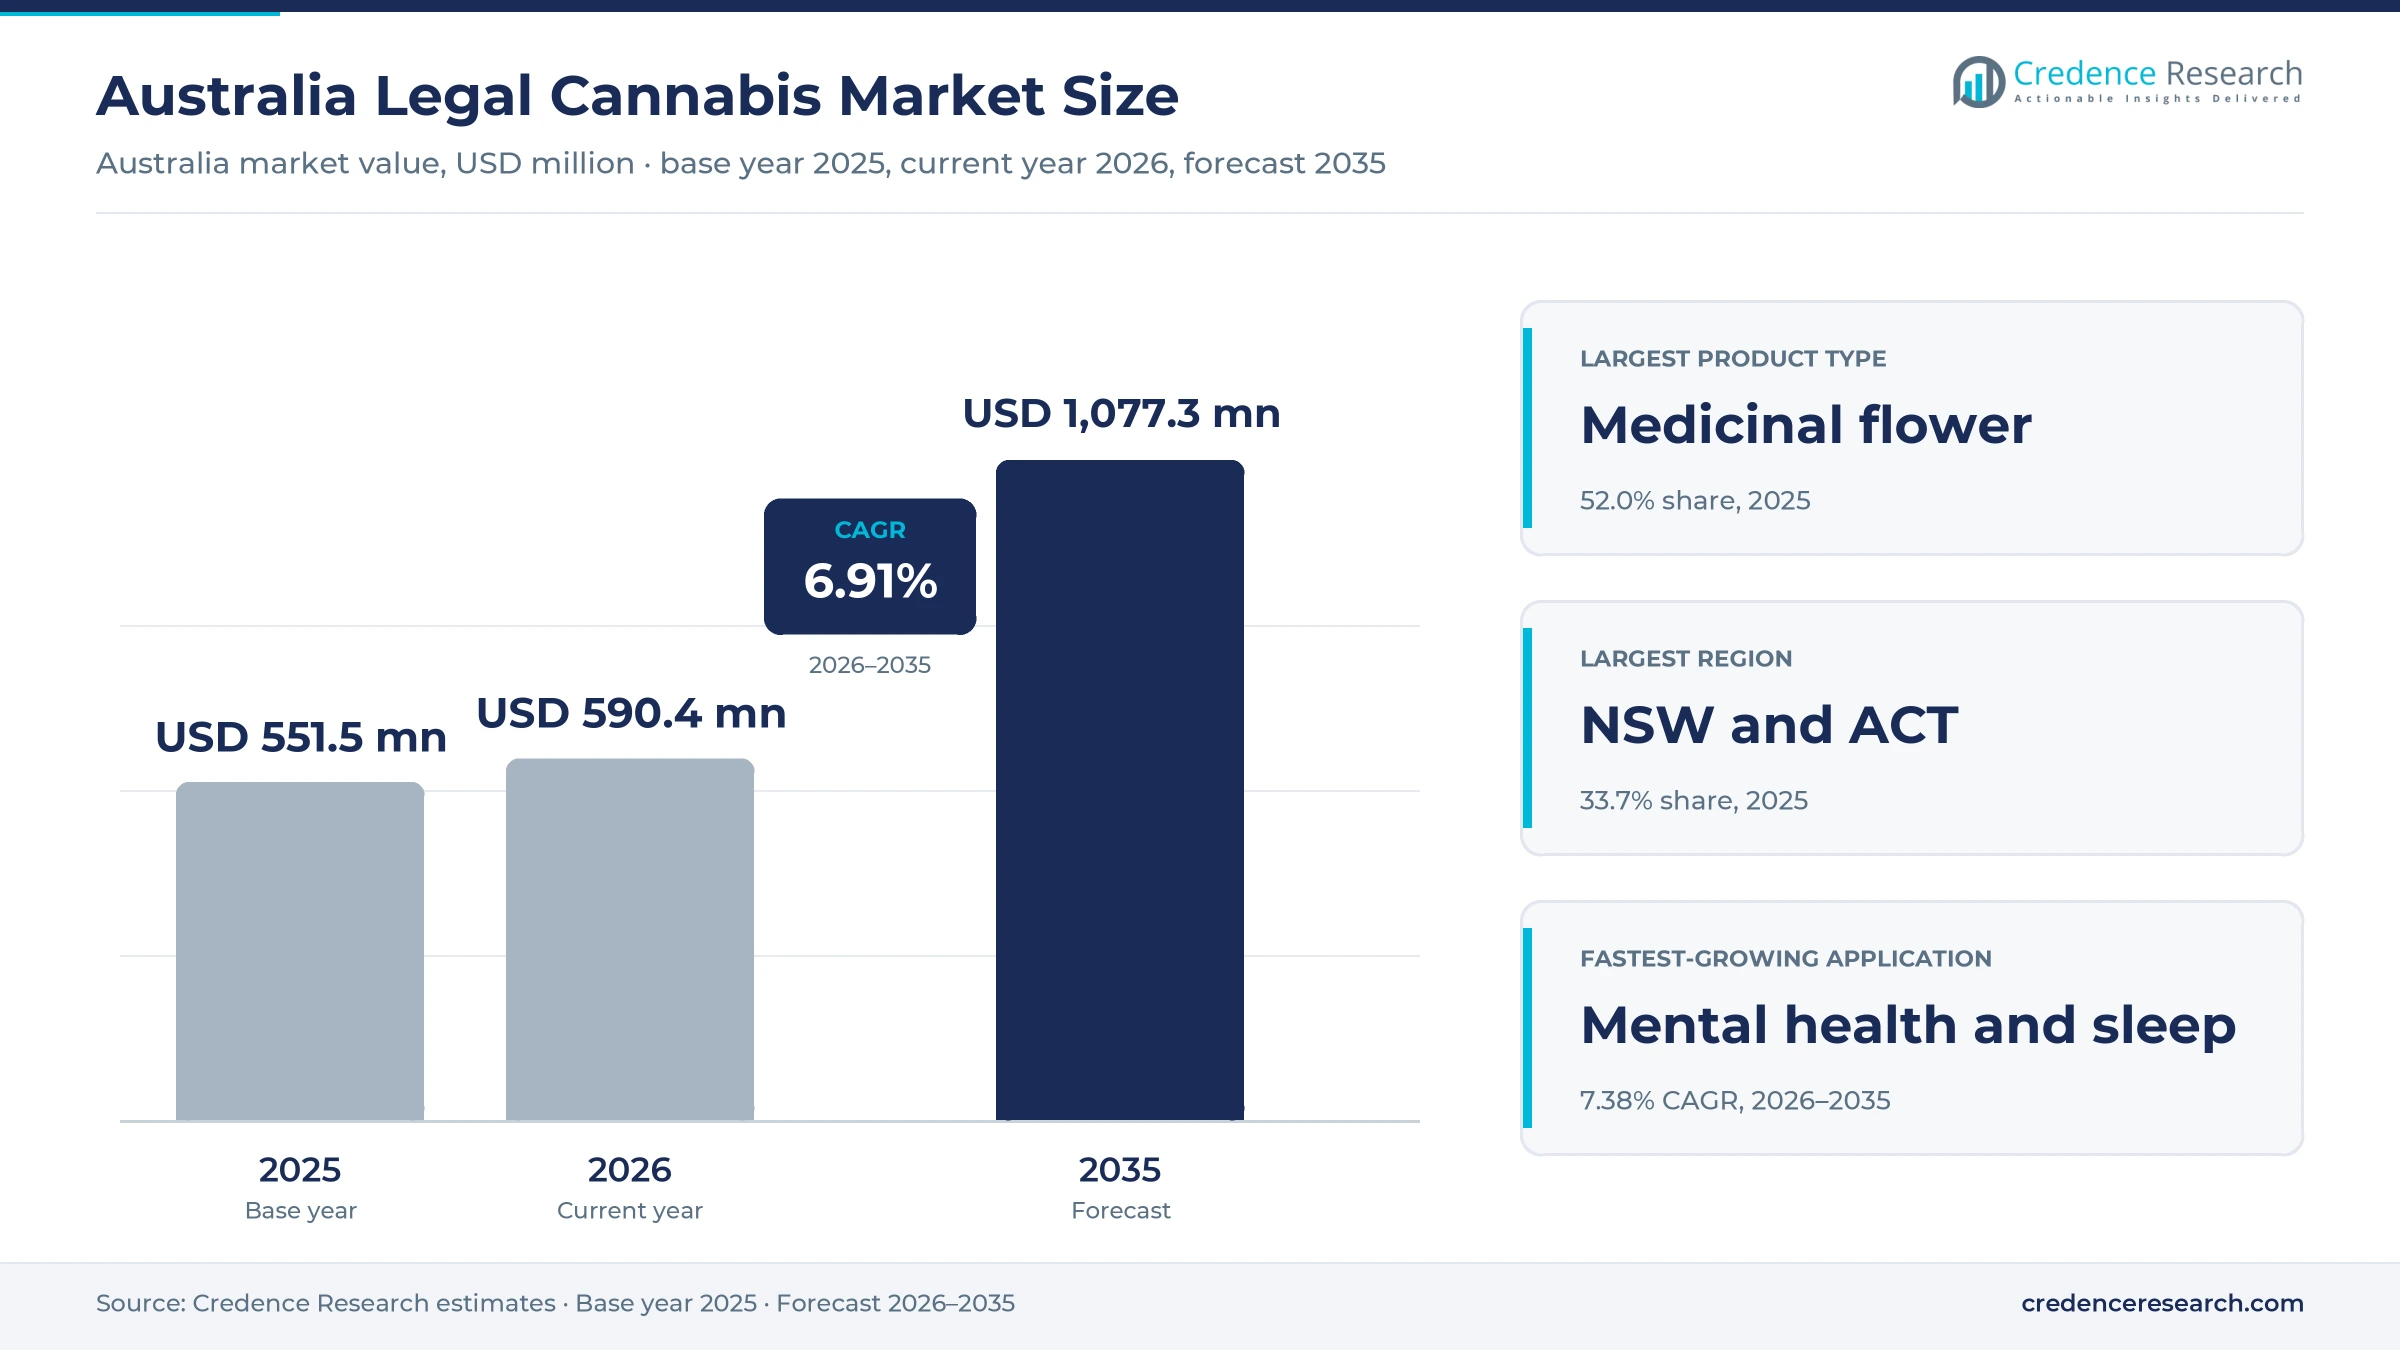
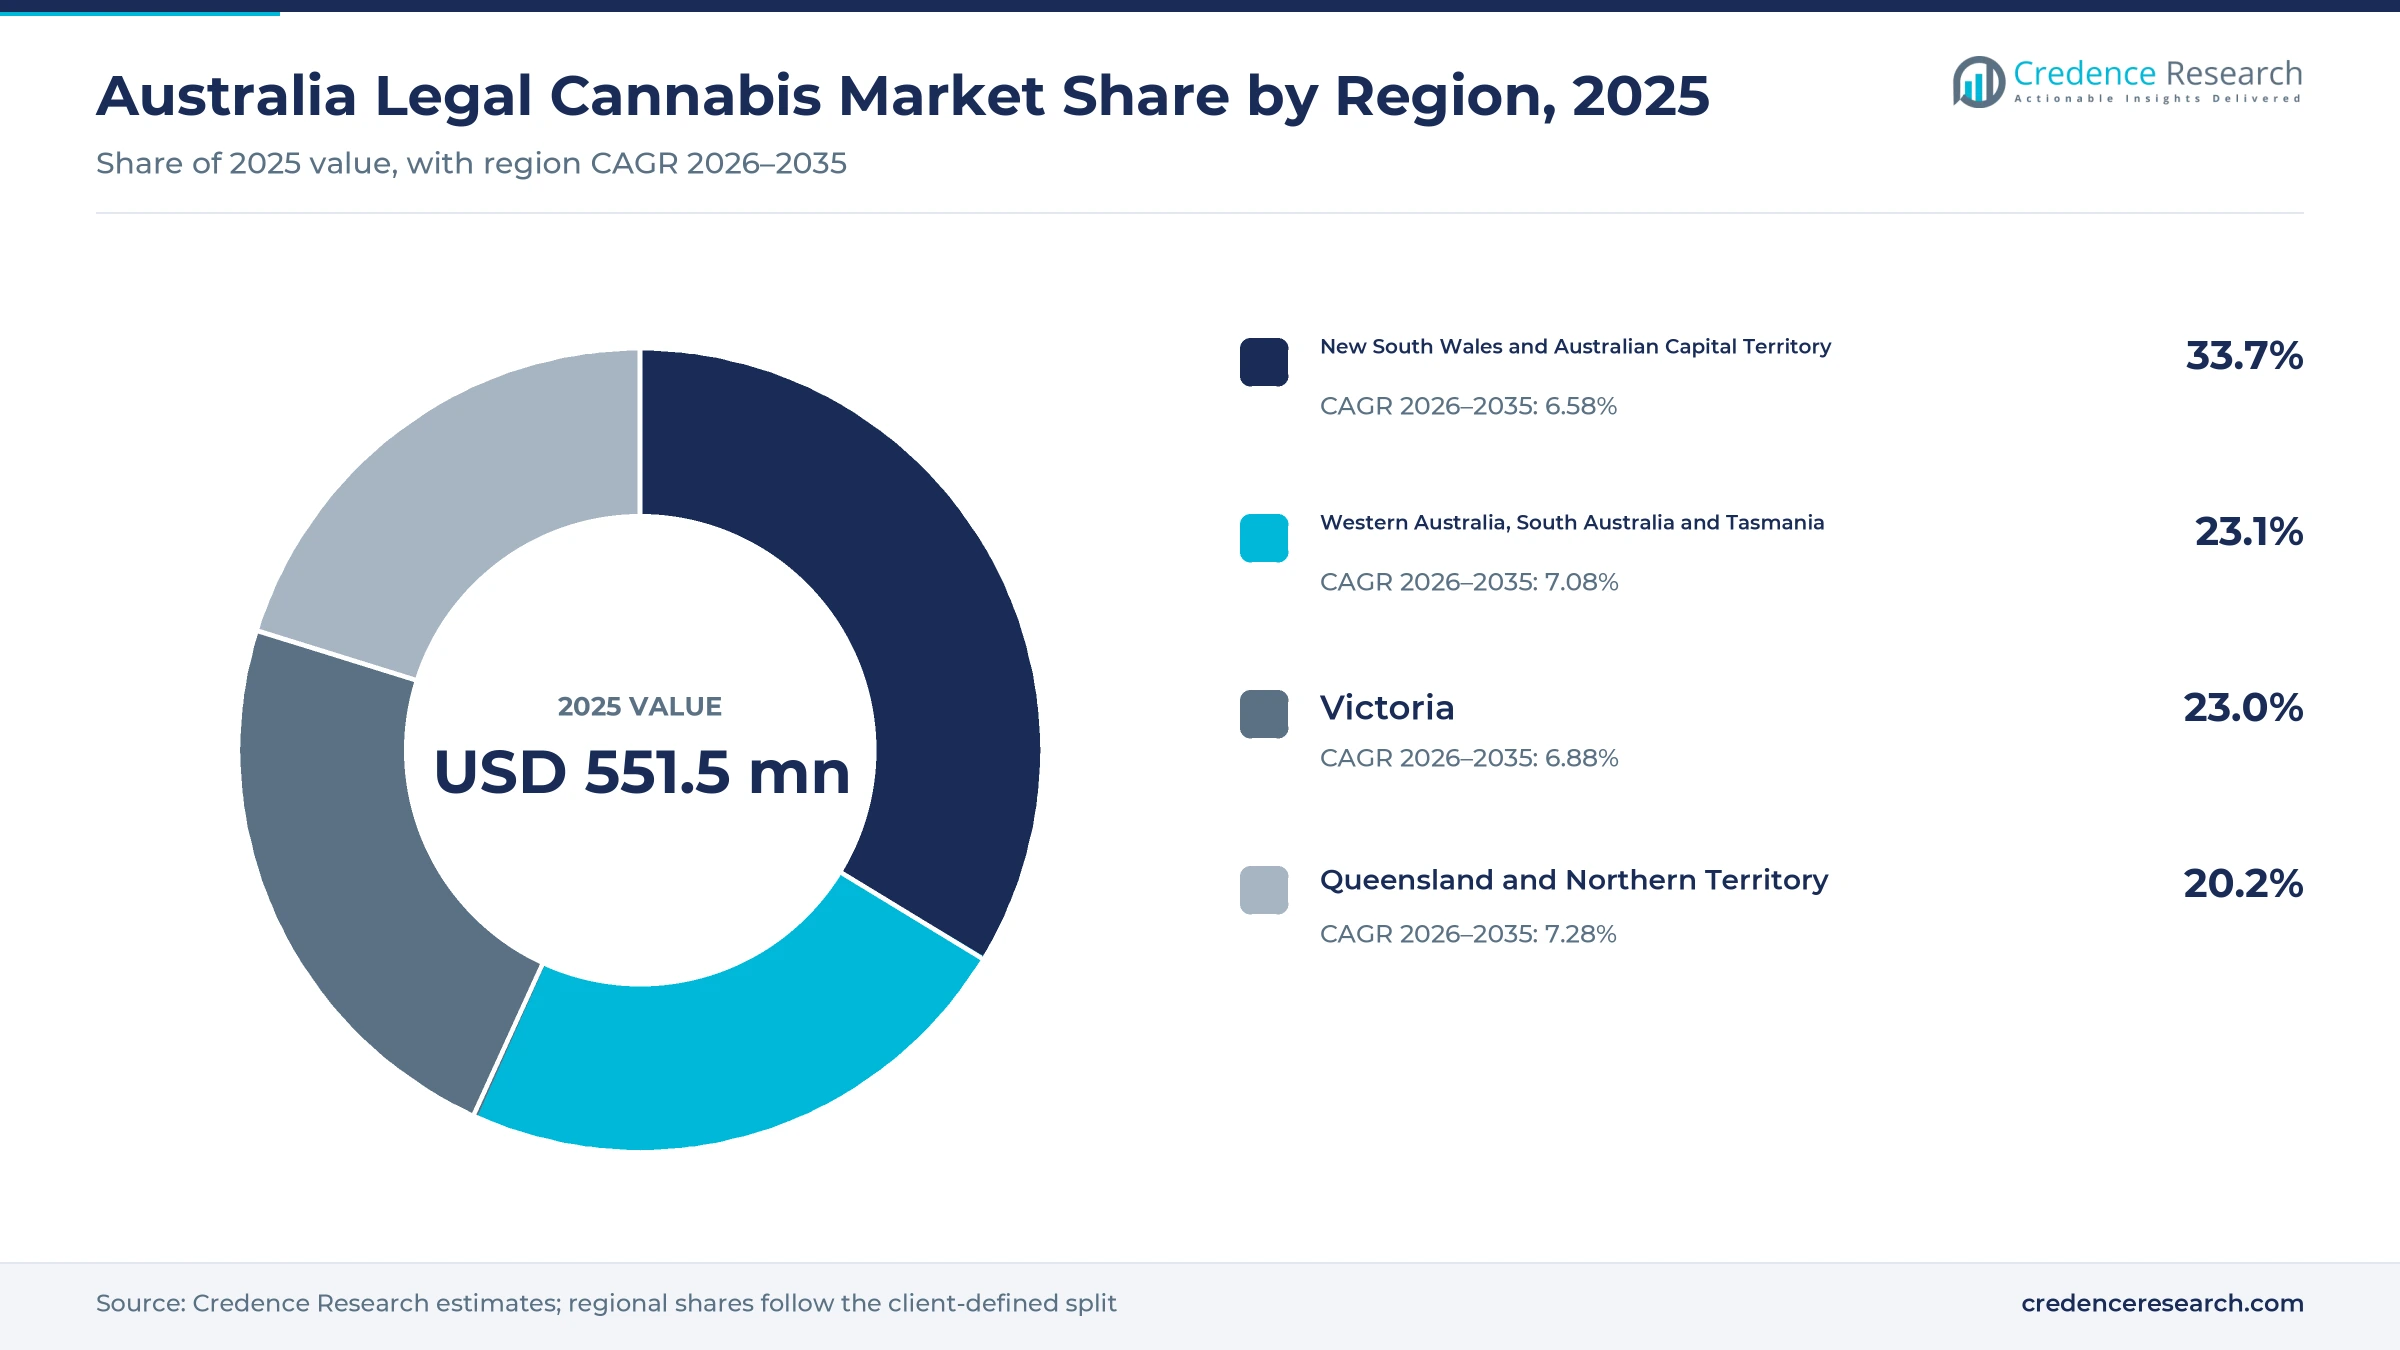
The Australia legal cannabis market was valued at USD 551.5 million in 2025 and is projected to increase from USD 590.4 million in 2026 to USD 1.08 billion by 2035, registering a CAGR of 6.91% during 2026–2035. Demand comes from adults and children prescribed unapproved medicinal products through doctors and nurse practitioners, and from buyers of hemp foods, seeds and fiber. New South Wales and Australian Capital Territory held the largest regional share, 33.7% in 2025, because the zone has the most people, prescribers and dispensing pharmacies. Queensland and Northern Territory is the fastest-growing region at 7.28% a year, as population growth adds new patients. In turn, the national medicines regulator has reviewed oversight of unapproved products, which points to tighter labeling and packaging standards for sponsors.
Which medicinal and hemp products does the estimate cover?
The estimate measures the value of legally supplied medicinal flower, oils, capsules, vaporizer cartridges and other formulations dispensed on prescription in Australia, plus licensed industrial hemp products such as hemp seed foods, oils and fiber. It counts sales through community pharmacies, specialist dispensing pharmacies and hemp retail and trade channels.
The estimate excludes illegal supply, adult-use sales, which are not legal nationally, clinic consultation fees, vaporizer devices sold on their own and exports. The value chain runs from licensed growers, importers and manufacturers through product sponsors and wholesalers to pharmacies, hemp retailers and end users.
Australia Legal Cannabis Market Insights
- The Australia legal cannabis market was valued at USD 551.5 million in 2025 and is projected to reach USD 1.08 billion by 2035, registering a CAGR of 6.91% during 2026–2035.
- New South Wales and Australian Capital Territory held a 33.7% share of 2025 value, because the zone has the most patients and pharmacies.
- Medicinal flower led product demand with a 52.0% share of 2025 value, because many patients now prefer dried flower for vaporizing.
- Category B approvals under the Special Access Scheme rose from 57,711 in 2020 to 177,762 in 2024, which shows how quickly prescribed access has expanded.
- Integrated brand platforms grow fastest among operating models at 7.40% a year during 2026–2035, as mergers join growers, brands, clinics and distribution.
Flower, pain care and pharmacy dispensing lead value
Why does medicinal flower lead product value?
Based on product type, the market is categorized into medicinal flower, medicinal formulations and industrial hemp products. Medicinal Flower led with a 52.0% share of 2025 value, because high-THC dried flower now makes up most new prescriptions. Medicinal Flower grows fastest at 7.27% a year, as sponsors launch new cultivars and patients move from oils to vaporized flower.
How do pain and mental health split demand?
Based on application, the market is categorized into pain management, mental health and sleep, neurological and supportive care, and nutrition and materials. Pain Management led with a 46.0% share of 2025 value, because chronic non-cancer pain accounts for roughly half of approvals. Mental Health and Sleep grows fastest at 7.38% a year, as more patients seek treatment for anxiety and insomnia.
Why do integrated platforms gain share?
Based on operating model, the market is categorized into integrated brand platforms, independent product sponsors and contract production networks. Integrated Brand Platforms led with a 47.0% share of 2025 value, because they control cultivation, brands, clinics and distribution. Integrated Brand Platforms grow fastest at 7.40% a year, as mergers and clinic acquisitions add scale. Contract production networks serve brands that do not own plants, which keeps them useful for new sponsors entering the market.
How do pharmacies reach prescribed patients?
Based on distribution channel, the market is categorized into community pharmacies, specialist dispensing pharmacies and hemp retail and trade. Community Pharmacies led with a 54.0% share of 2025 value, because most patients fill scripts close to home. Specialist Dispensing Pharmacies grows fastest at 7.08% a year, as online and specialist pharmacies serve telehealth patients across the country.
| Segment Group | Leading Sub-segment | Share, 2025 | Fastest-growing Sub-segment | CAGR, 2026–2035 |
|---|---|---|---|---|
| By Product Type | Medicinal Flower | 52.0% | Medicinal Flower | 7.27% |
| By Application | Pain Management | 46.0% | Mental Health and Sleep | 7.38% |
| By Operating Model | Integrated Brand Platforms | 47.0% | Integrated Brand Platforms | 7.40% |
| By Distribution Channel | Community Pharmacies | 54.0% | Specialist Dispensing Pharmacies | 7.08% |
Request a Free Sample
Fill in your details and we'll send you a free sample report.
- Sample data tables & charts
- Research methodology
Prescriptions, quality rules and hemp investment lift sales
How does compliant prescription access support repeat demand?
Compliant prescription access supports repeat demand, because patients with an approval return for refills every month. Category B approvals under the Special Access Scheme rose from 57,711 in 2020 to 177,762 in 2024, according to a review of the regulatory process, which tripled the yearly flow of new approvals. Vitura Health also reported more than 375,000 consultations in fiscal 2025, with over 4,800 pharmacies and 2,700 doctors registered on its Canview platform. The company completed its acquisition of Candor Medical in February 2025, adding about 15,000 active clinic patients. As a result, community pharmacies hold 54.0% of 2025 value, and scripts flow through the wider retail pharmacy network.
Why do equivalent quality rules favor capable manufacturers?
Equivalent quality rules favor capable manufacturers, because domestic and imported products must meet the same national standards for medicinal products. ECS Botanics holds a national licence to manufacture GMP-certified products that are equivalent to PIC/S standards. Cannatrek operates one of the largest AU-GMP certified manufacturing facilities in Australia, according to the merged group's July 2026 presentation. More than 1,000 medicinal products are supplied in Australia, so buyers can compare quality across brands. Cannatrek also brought nine proprietary brands and 72 products into the merged group. In turn, sponsors with certified plants win contract work and pharmacy listings, while smaller importers face higher testing and compliance costs.
How does hemp processing investment widen demand?
Hemp processing investment widens demand, because new decorticating plants turn hemp stalks into fiber for building, textiles and packaging. Australian hemp plantings rose to 3,266 hectares in 2023-24, up from 1,493 hectares a year earlier, according to industry crop data. New South Wales planted about 2,000 hectares, above its earlier peak of 1,900 hectares. The country now has 11 decorticating facilities, compared with two five years earlier, after A$52 million of investment over three years. A further A$195 million of investment is expected over the next two years. As a result, industrial hemp products grow alongside medicinal sales, and growers also supply seed for hemp-based foods sold in supermarkets.
Why does an aging population raise pain treatment demand?
An aging population raises pain treatment demand, because chronic pain becomes more common with age. Australians aged 65 and over made up 18.1% of the population in 2025, up from 17.4% in 2023, according to the World Bank. About one in five Australians aged 45 and over live with chronic pain, based on national health data. Roughly half of medicinal approvals are for chronic pain not caused by cancer, which makes pain the largest single reason that doctors seek approval. In turn, pain management holds 46.0% of 2025 value, and older patients who cannot tolerate opioids keep asking doctors about plant-based options.
High-potency flower and consolidation reshape supply
How is the shift to high-potency flower changing supply?
The shift to high-potency flower is changing supply, because many patients now prefer vaporized dried flower over oils. High-potency THC products made up more than half of approvals in 2025, according to addiction researchers. ECS Botanics launched Gelonoidz #20, its first Australian-grown Terphogz flower, on June 22, 2026, with a 23% THC label claim and about 2.8% total terpenes. The company grows it under mixed light at Murrabit West in northwest Victoria and expects up to three Terphogz cultivars during fiscal 2027. As a result, medicinal flower grows fastest at 7.27% a year, and growers compete on genetics, potency and terpene profiles.
Why is the rise of integrated platforms notable?
The rise of integrated platforms is notable, because companies now join growing, brands, clinics and distribution under one owner. Little Green Pharma and Cannatrek completed their merger on June 1, 2026, creating LGP Cannatrek Group. The combined group holds 13 brands and 105 products, built from four LGP brands with 33 products and nine Cannatrek brands with 72 products. It also runs the MyQuest and MyEden clinics and the Greenship distribution business. Vitura Health also gained a patient base of nearly 30,000 through the Releaf assets of its Flora Holdings joint venture. In turn, integrated brand platforms grow fastest at 7.40% a year.
Can export markets open new demand for local producers?
Export markets can open new demand for local producers, because European medical programs are growing faster than Australian supply needs. LGP Cannatrek Group has exports or distribution agreements in more than 11 countries, including Germany, France, the U.K., Italy and Poland. Germany had nearly 900,000 medical patients, and the U.K. is expected to pass 140,000 patients by the end of 2026, according to the same presentation. The group also runs a Danish facility with 21,500 square meters of cultivation space. As a result, Australian growers with GMP plants can sell surplus flower abroad, which supports local capacity even when domestic prices fall.
Is there room to grow as quality standards tighten?
Compliant sponsors have room to grow as quality standards tighten, because stricter rules push weaker products out of the market. The national regulator received 790 submissions on its review of unapproved products and published its response on Feb. 20, 2026. That response points to education, clearer labeling, mandatory warnings and child-resistant closures for domestic and imported products. Health practitioner regulators also issued prescribing guidance on July 9, 2025, after finding that eight practitioners each wrote more than 10,000 scripts in six months, according to the Nursing and Midwifery Board of Australia. In turn, sponsors with clear labeling and clinical support can win pharmacy and prescriber trust.
Prescribing scrutiny, price pressure and evidence gaps weigh
How does prescribing scrutiny slow patient growth?
Prescribing scrutiny slows patient growth, because regulators now watch high-volume telehealth prescribing more closely. As a result, some clinics may cut short consultations and single-question assessments, which reduces new approvals. Companies respond with longer consultations, better records and clinical education, which keeps prescribers compliant while patients still reach treatment through telehealth and face-to-face clinics across the country. Many patients also fill scripts through online pharmacy services that check each prescription.
Why does price competition squeeze margins?
Price competition squeezes margins, because more than 1,000 products and hundreds of brands compete for the same patients. In turn, flower prices fall as growers and importers fight for pharmacy shelf space and prescriber attention. Companies respond with mergers, value ranges and premium cultivars, which help them hold patients across price tiers and spread fixed plant costs over larger volumes each year. Smaller sponsors without their own plants feel this pressure most.
How do evidence gaps limit prescriber uptake?
Evidence gaps limit prescriber uptake, because many products lack the large trials that support registered medicines. As a result, many doctors still decline to prescribe, and pain specialists urge caution with high-THC flower. Sponsors respond with observational studies, patient registries and clinical trials, which build the data that prescribers, payers and regulators need before supporting wider use in routine care. Such evidence will take years to build, so uptake by cautious prescribers will rise only slowly.
Why do hemp licensing costs slow farm uptake?
Hemp licensing costs slow farm uptake, because each state sets its own licence fees, testing rules and inspection charges. In turn, small growers face higher costs per hectare than large farms with processing contracts. Growers respond by forming cooperatives and signing supply deals with decorticating plants, which spread licensing and testing costs and give them a reliable buyer before planting each season. State governments have also reviewed licensing rules to make hemp farming simpler for new growers.
New South Wales and ACT lead as Queensland and NT rise
| Region | Value, 2025 (USD million) | Share, 2025 | CAGR, 2026–2035 |
|---|---|---|---|
| New South Wales and Australian Capital Territory | 185.9 | 33.7% | 6.58% |
| Western Australia, South Australia and Tasmania | 127.4 | 23.1% | 7.08% |
| Victoria | 126.8 | 23.0% | 6.88% |
| Queensland and Northern Territory | 111.4 | 20.2% | 7.28% |
Why do new South Wales and the ACT hold the top share?
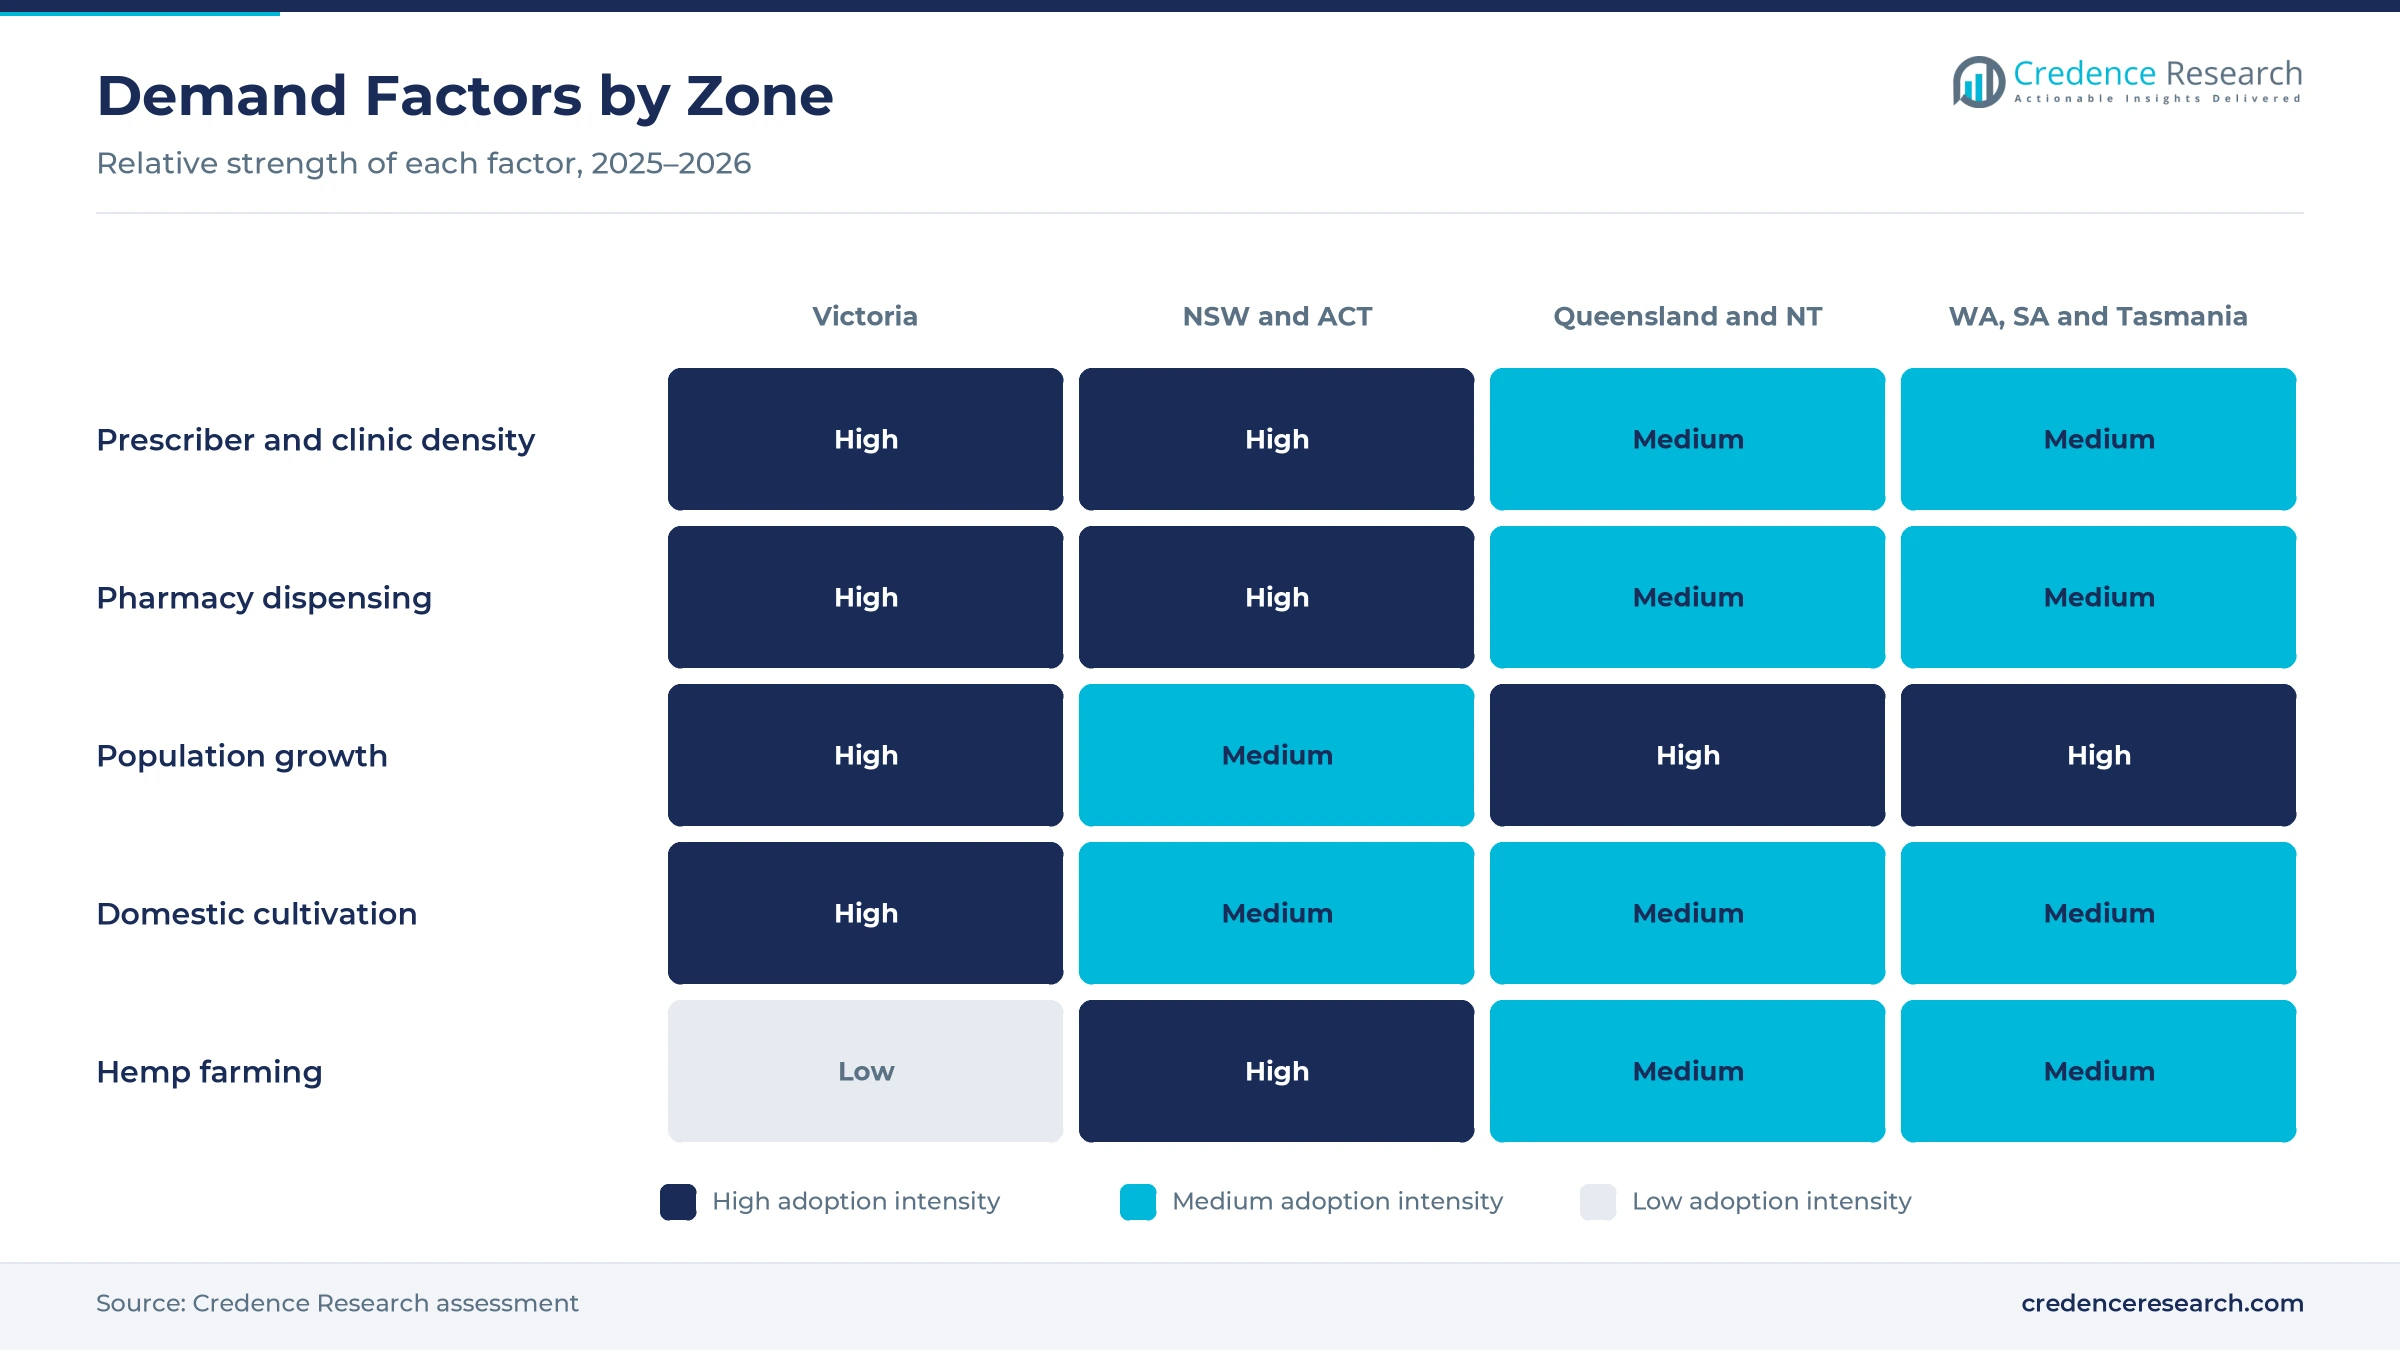
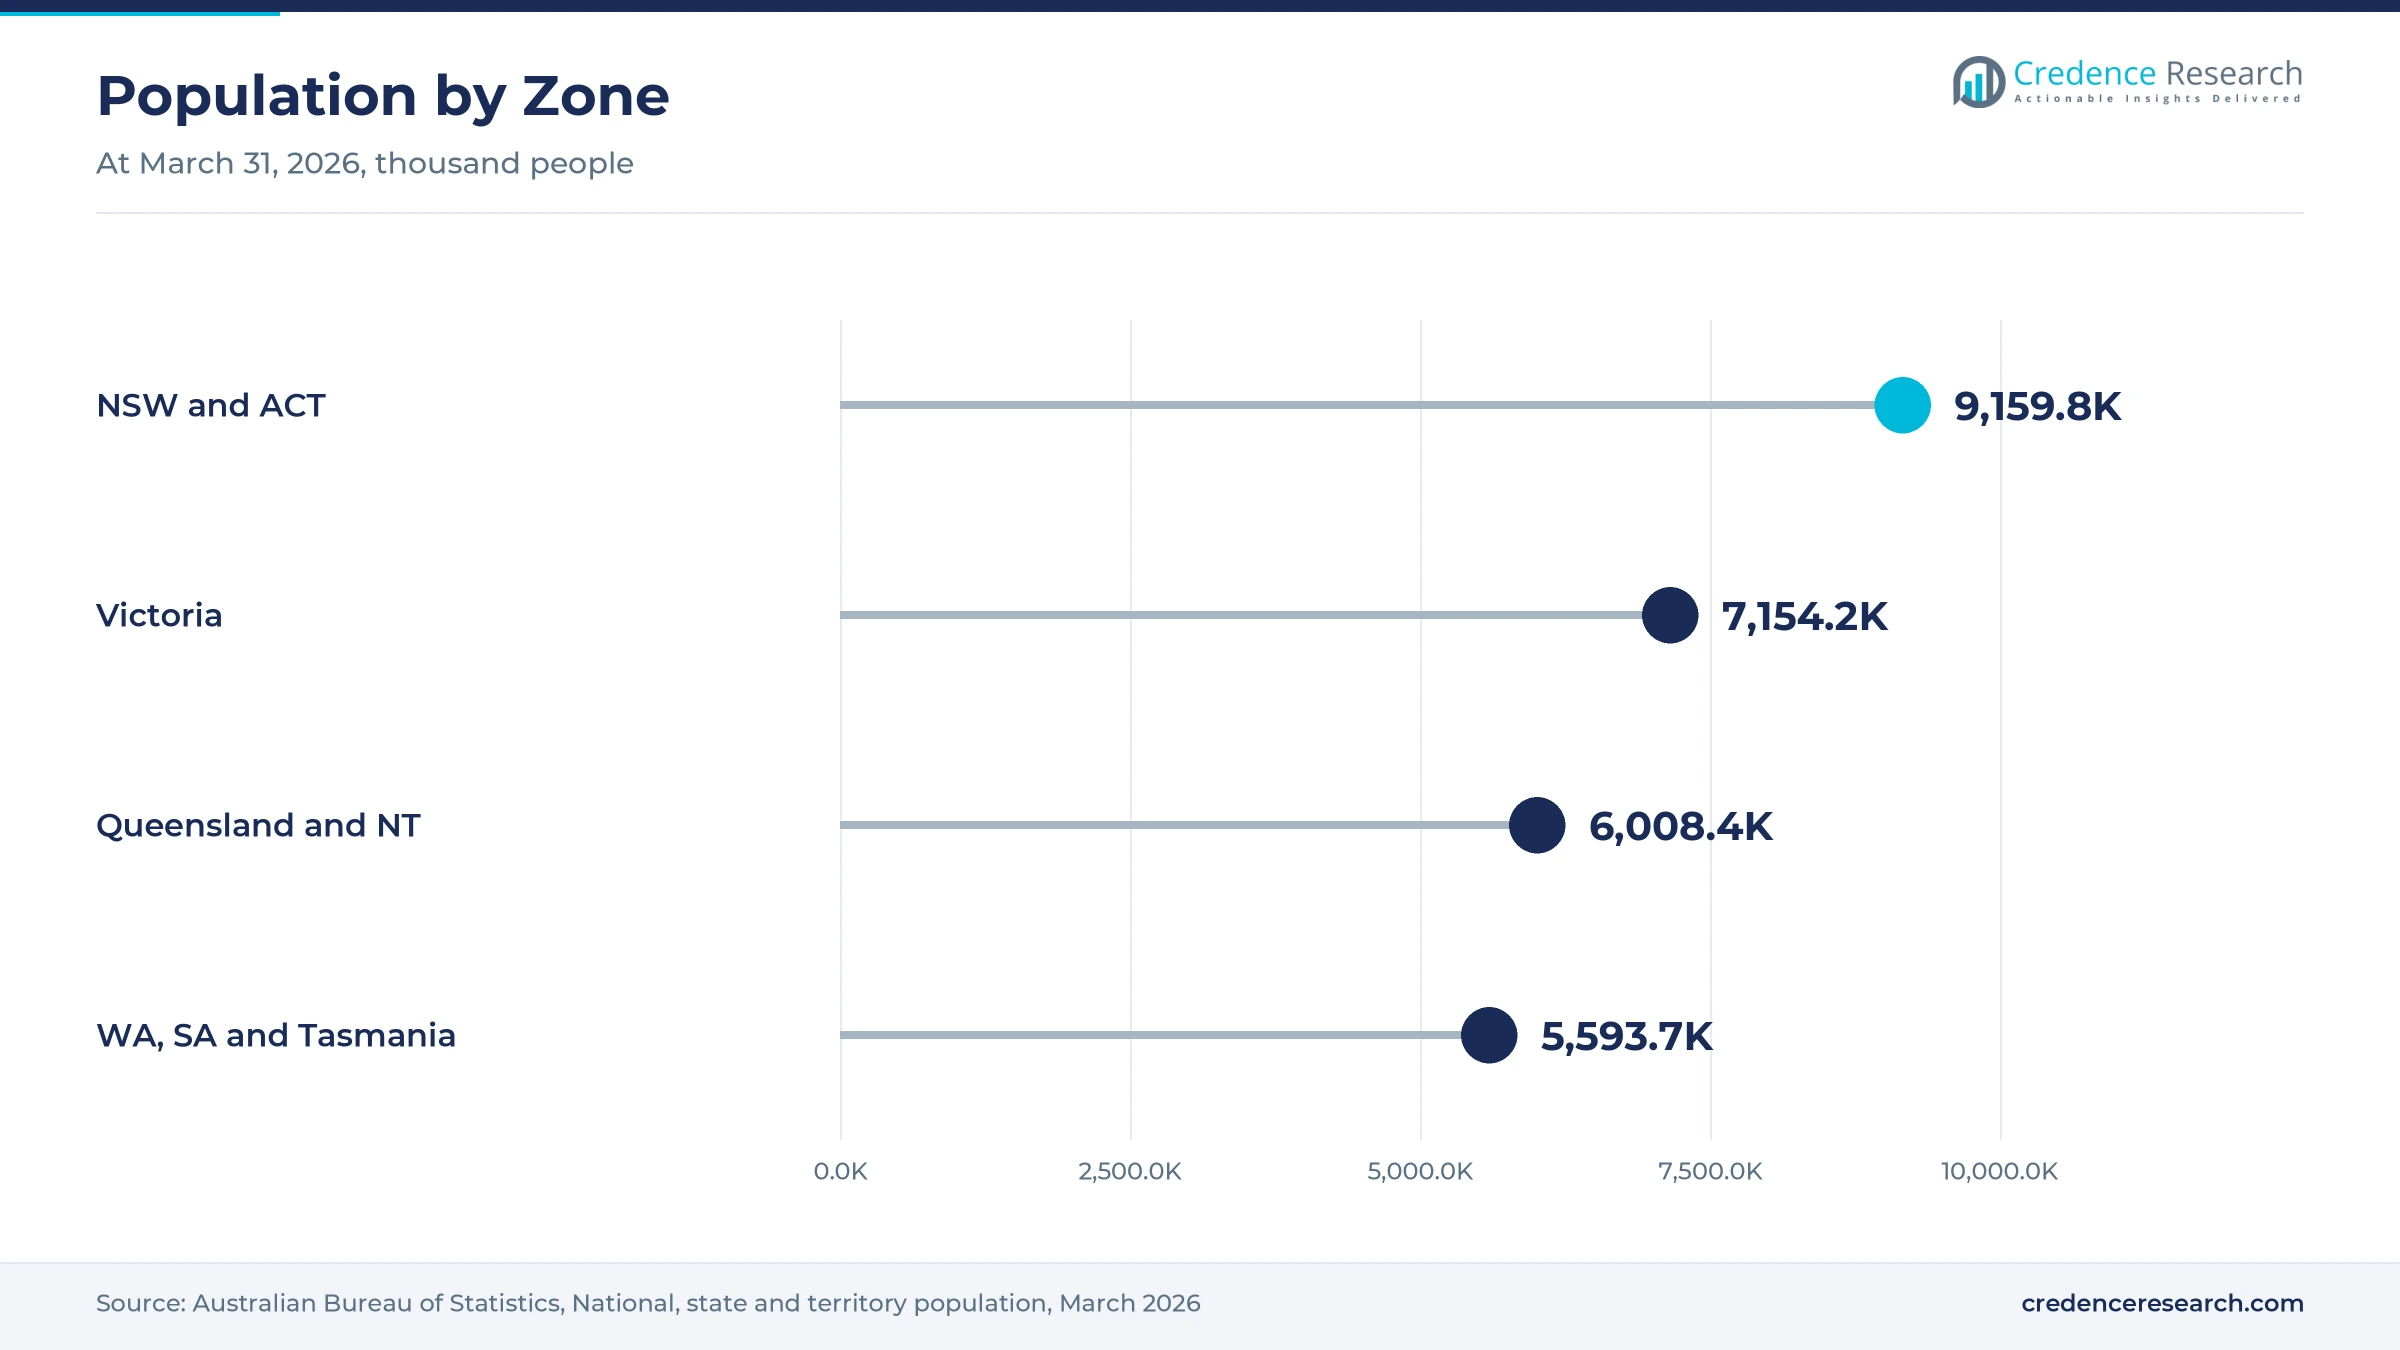
New South Wales and Australian Capital Territory held a 33.7% share of 2025 value and grow at 6.58% a year, because the zone had 9.16 million people in March 2026. Sydney hosts many telehealth clinics, specialist pharmacies and wholesalers, which keeps prescribing and dispensing activity high. New South Wales also planted about 2,000 hectares of hemp in 2023-24, the most of any state, and those crops feed industrial hemp processing for fiber and seed. As a result, the zone leads both medicinal and hemp demand.
How does Victoria support demand?
Victoria held a 23.0% share of 2025 value and grows at 6.88% a year, because Melbourne has a dense network of clinics, pharmacies and distribution centers. The state had 7.15 million people in March 2026 and grew 1.6% in a year. Victoria also hosts domestic cultivation, including mixed-light flower production in the northwest of the state. As a result, Victorian growers and sponsors supply patients both within the state and across the country.
Why are the western and southern states important?
Western Australia, South Australia and Tasmania held a 23.1% share of 2025 value and grow at 7.08% a year, because Western Australia had the fastest population growth of any state, at 2.1%. Perth also hosts craft indoor cultivation, while Tasmania has a long history of licensed hemp and poppy farming. In turn, the zone adds both prescribed patients and hemp supply as its population and farm licensing grow.
Why are Queensland and the Northern Territory growing fastest?
Queensland and Northern Territory held a 20.2% share of 2025 value and grow fastest at 7.28% a year, because Queensland grew 1.6% to 5.74 million people in the year to March 2026. Population growth in south-east Queensland adds new patients and pharmacies each year, and the state licenses hemp growers for seed and fiber.
Regulatory reviews, mergers and launches, 2025–2026
| Development | Status and market relevance |
|---|---|
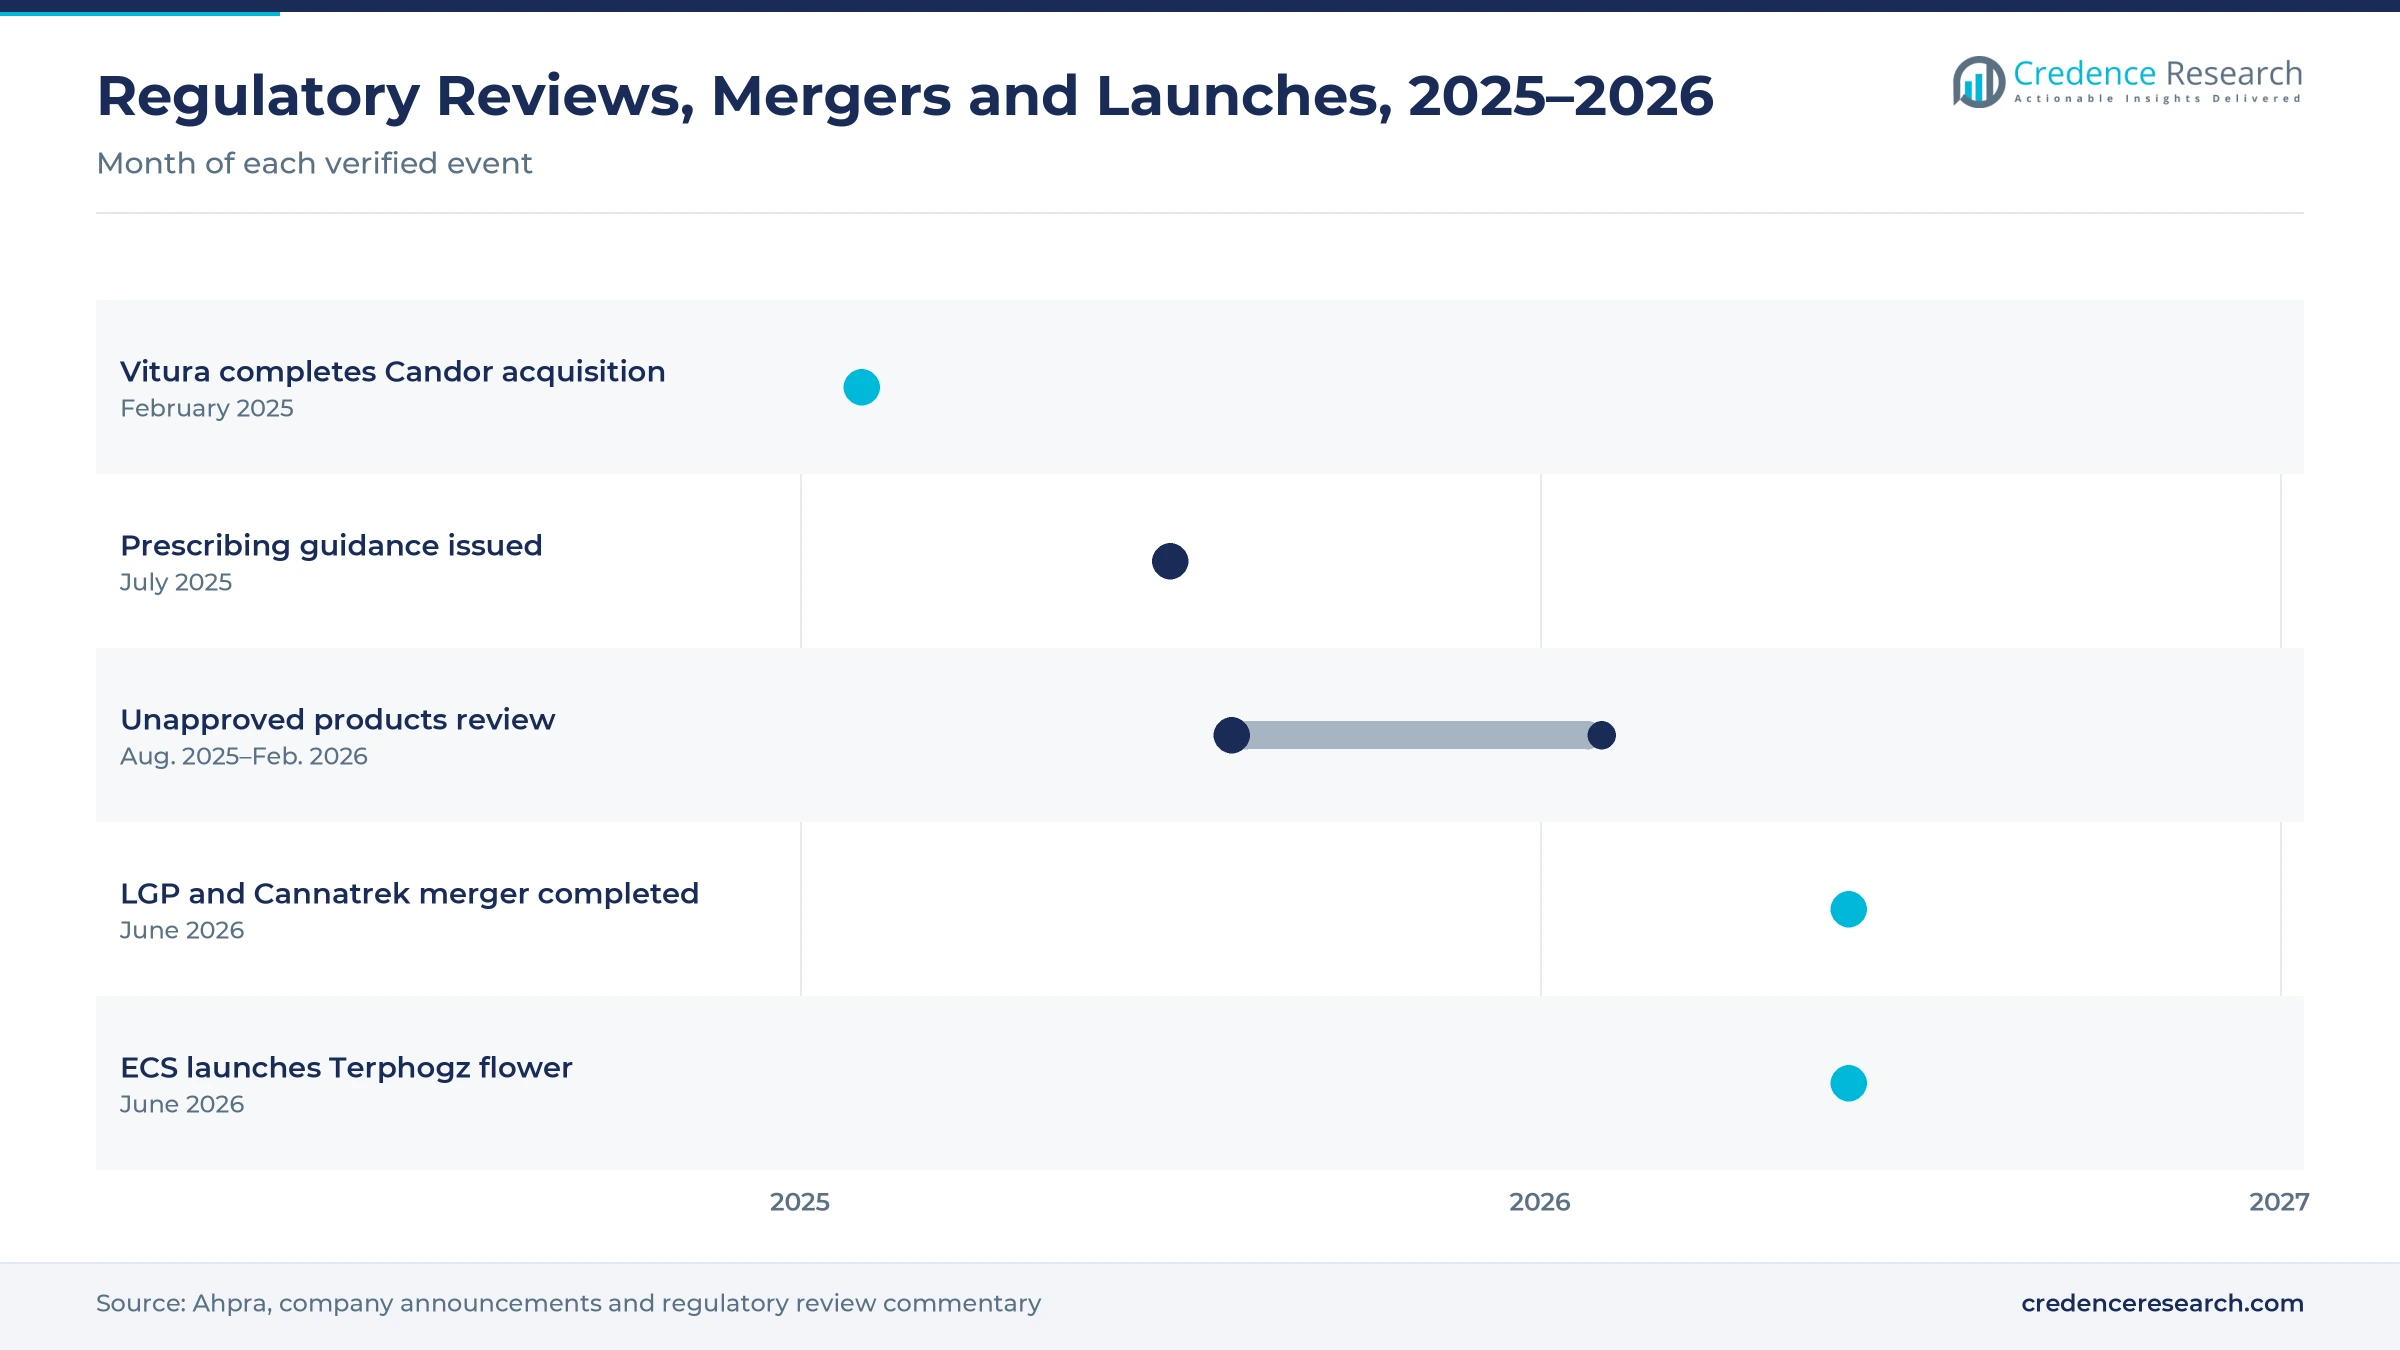
| In February 2025, Vitura Health completed its acquisition of Candor Medical, adding about 15,000 active clinic patients. | Expands clinic-led prescribing |
| In July 2025, Ahpra and the National Boards issued guidance on medicinal cannabis prescribing to target unsafe practice. | Raises prescriber compliance |
| In February 2026, the national regulator published its response to the review of unapproved medicinal cannabis products. | Points to tighter labeling and packaging |
| In June 2026, Little Green Pharma and Cannatrek completed their merger, forming LGP Cannatrek Group with 105 products. | Creates a larger integrated platform |
| In June 2026, ECS Botanics launched Gelonoidz #20, its first Australian-grown Terphogz flower. | Commercial sales began June 22, 2026 |
Indoor growing, GMP extraction and hemp processing advance
- Indoor and mixed-light cultivation controls light, temperature and humidity, which gives growers consistent THC and terpene levels in each harvest. Growers use it to produce premium flower for pharmacy shelves.
- GMP extraction and formulation turns flower into oils, capsules and cartridges with tested doses, which lets sponsors meet national manufacturing standards and supply export markets.
- Hemp decortication separates hemp stalks into long fiber and woody hurd, which opens markets in building materials, textiles and packaging for growers. Australia now has 11 decorticating facilities.
Need a Custom Version of This Report?
Tailor the scope, geography, or segments to your exact requirements.
- Custom geography or segment scope
- Direct access to our analyst team
Integrated platforms compete with independent sponsors
Competition is led by integrated platforms that combine cultivation, brands, clinics and distribution, alongside independent sponsors that import or contract their products. LGP Cannatrek Group formed in June 2026 and holds 13 brands and 105 products, with MyQuest and MyEden clinics and the Greenship distribution business. Vitura Health runs the Canview platform, which links over 4,800 pharmacies and 2,700 doctors, and lists about 600 products from roughly 70 brands. ECS Botanics grows flower in northwest Victoria and holds a national GMP manufacturing licence. Montu, founded in 2019, runs the Alternaleaf patient service for Australian patients. Rivals compete on product range, potency, price, clinic reach and supply reliability. Because prices are falling, scale and certified manufacturing matter more each year.
Which companies supply Australian patients?
| Company | Type | Role in the market |
|---|---|---|
| Little Green Pharma | Integrated producer | Merged with Cannatrek in June 2026 to form LGP Cannatrek Group |
| Cannatrek | Integrated producer | AU-GMP certified manufacturing and nine proprietary brands |
| Vitura Health | Platform and clinics | Canview platform, Candor Medical and other clinics |
| ECS Botanics | Grower and manufacturer | Mixed-light flower and GMP-certified manufacturing in Victoria |
| Montu Group | Patient platform | Alternaleaf patient service founded in 2019 |
Credence Research view on medicinal and hemp demand
Credence Research's view is that the Australia legal cannabis market will keep growing because prescribed patients refill every month and new patients still join through telehealth clinics. Medicinal flower remains the largest value pool, while integrated platforms gain share through mergers. Tighter quality and prescribing rules will remove weaker products and clinics. Sponsors with certified plants, clear labeling, clinical support and export options should gain the most, while price competition keeps margins tight for smaller sponsors.
How the national medicinal and hemp estimate was built
The report uses 2025 as the base year on a calendar basis, and market values come from the Credence Research model. That model combines Special Access Scheme approval data, regulatory review documents, practitioner guidance, population statistics, hemp crop data and listed company disclosures. Segment splits and zone growth rates are Credence Research estimates, while zone shares follow the client-defined split. Sources used are official statistics, government and regulator publications, industry crop data and company filings, and no interviews or surveys were used.
Quality standards and exports carry growth to 2035
The Australia legal cannabis market is expected to reach USD 1.08 billion by 2035, a 6.91% CAGR during 2026–2035, as more patients use prescribed products for pain, sleep and mental health. Growth should be strongest in flower, mental health and integrated platforms, because patients prefer vaporized flower and companies keep consolidating. Hemp fiber and food add a smaller but steady stream of demand. Tighter rules may slow new approvals for a time, while exports could lift domestic production.
Frequently Asked Questions
How big is the Australia legal cannabis market?
Which product type leads Australian value?
Which region leads the Australian market?
How fast have medicinal approvals grown in Australia?
What changed in regulation during 2025 and 2026?
How large is the Australian hemp crop?
Who are the leading companies in the Australian market?
What are the main challenges for suppliers?
Table of Content
Chapter 1 Market Segmentation
- 1.1 Segmentation Framework
- 1.1.1 Product and Service Classification
- 1.1.2 Application and End-Use Classification
- 1.1.3 Technology and Solution Classification
- 1.1.4 Customer and Distribution Channel Classification
- 1.1.5 Geographic Segmentation
- 1.1.6 Market Segment Definitions and Boundaries
- 1.2 By Product Type
- 1.2.1 Medicinal Flower
- 1.2.2 Medicinal Formulations
- 1.2.3 Industrial Hemp Products
- 1.3 By Application
- 1.3.1 Pain Management
- 1.3.2 Mental Health and Sleep
- 1.3.3 Neurological and Supportive Care
- 1.3.4 Nutrition and Materials
- 1.4 By Operating Model
- 1.4.1 Integrated Brand Platforms
- 1.4.2 Independent Product Sponsors
- 1.4.3 Contract Production Networks
Chapter 2 Introduction
- 2.1 Report Objectives and Scope
- 2.2 Product Definition and Industry Terminology
- 2.3 Market Inclusions and Exclusions
- 2.4 Research Process
- 2.4.1 Primary Research and Expert Interviews
- 2.4.2 Secondary Research and Source Review
- 2.4.3 Top-Down and Bottom-Up Estimation
- 2.4.4 Data Triangulation and Verification
- 2.5 Market Size Measurement Basis
- 2.5.1 2025: USD 551.5 million → 2035: USD 1.08 billion
- 2.6 Historical and Forecast Reference Periods
- 2.6.1 Historical Period: 2018-2025
- 2.6.2 Base Year: 2025
- 2.6.3 Forecast Period: 2025-2035
- 2.7 Research Assumptions and Limitations
Chapter 3 Executive Summary
- 3.1 Market Snapshot and Key Findings
- 3.2 Base-Year Market Size, 2025
- 3.3 Forecast Market Size, 2035
- 3.4 Revenue and Volume Growth Outlook
- 3.5 Key Demand and Supply Indicators
- 3.6 Leading Market Segments
- 3.7 Fastest-Growing Market Opportunities
- 3.8 Regional Performance Highlights
- 3.9 Technology and Industry Transformation
- 3.10 Competitive Landscape Summary
- 3.11 Analyst View and Strategic Implications
Chapter 4 Australia Legal Cannabis Market Trends and Developments
- 4.1 Historical Industry Development, 2018-2025
- 4.2 Recent Market Trends and Developments
- 4.3 Demand and Customer Behavior Trends
- 4.4 Technology and Product Innovation
- 4.5 Artificial Intelligence, Automation and Digitalization
- 4.6 Local Manufacturing and Supply Chain Realignment
- 4.7 Industry Partnerships, Mergers and Acquisitions
- 4.8 Sustainability and Circular Economy Developments
- 4.9 Government and Private Sector Investment Trends
- 4.10 Emerging Business Models and Commercialization
- 4.11 Industry Developments and Announcements
Chapter 5 Australia Legal Cannabis Market Production, Supply and Demand Analysis
- 5.1 Demand Trend and Consumption Analysis, 2018-2025
- 5.2 Demand Forecast, 2025-2035
- 5.3 Production and Output Trend, 2018-2025
- 5.4 Production and Output Forecast, 2025-2035
- 5.5 Installed Capacity and Capacity Utilization
- 5.6 Company-Wise Production Plants and Statistics
- 5.6.1 Installed Production Capacity
- 5.6.2 Actual Production
- 5.6.3 Planned Capacity and Expansion Targets
- 5.7 Supply Chain Structure and Procurement Trends
- 5.8 Supply-Demand Gap and Bottlenecks
- 5.9 Import Dependence and Sourcing Structure
- 5.10 Contract Manufacturing and Outsourcing
- 5.11 Regional Supply and Demand Concentration
Chapter 6 Australia Legal Cannabis Market Pricing Analysis
- 6.1 Pricing Structure and Measurement
- 6.2 Historical Pricing Trends, 2018-2025
- 6.3 Pricing Outlook, 2025-2035
- 6.4 Average Selling Price and Unit Economics
- 6.5 Pricing by Product and Market Segment
- 6.6 Geographic Pricing Differences
- 6.7 Key Input, Energy, Labor and Logistics Costs
- 6.8 Contract Pricing and Purchasing Models
- 6.9 Pricing Sensitivity and Competitive Positioning
- 6.10 Price, Margin and Profitability Implications
Chapter 7 Australia Legal Cannabis Market Dynamics
- 7.1 Market Growth Drivers
- 7.1.1 Demand-Side Drivers
- 7.1.2 Technology and Innovation Drivers
- 7.1.3 Infrastructure and Investment Drivers
- 7.1.4 Regulatory and Policy Drivers
- 7.2 Market Restraints
- 7.2.1 Cost and Affordability Constraints
- 7.2.2 Technology and Adoption Barriers
- 7.2.3 Supply Chain and Operational Constraints
- 7.3 Market Challenges
- 7.3.1 Competitive Pressure and Margin Erosion
- 7.3.2 Skills, Infrastructure and Implementation Gaps
- 7.4 Emerging Market Opportunities
- 7.5 Market Dynamics Impact and Time-Horizon Assessment
Chapter 8 Australia Legal Cannabis Value Chain Analysis
- 8.1 Industry Value Chain Overview
- 8.2 Upstream Suppliers and Critical Inputs
- 8.3 Technology and Component Providers
- 8.4 Manufacturing or Service Delivery
- 8.5 Distribution, Channel Partners and Integrators
- 8.6 Downstream Applications and End Users
- 8.7 Value Addition and Profit Pools
- 8.8 Vertical Integration and Outsourcing
- 8.9 Supplier Concentration and Risk
- 8.10 Supply Chain Localization and Resilience
Chapter 9 Australia Legal Cannabis Market Regulations and Policies
- 9.1 Relevant Laws, Standards and Compliance Frameworks
- 9.2 Product, Service, Safety and Quality Requirements
- 9.3 Government Policies, Incentives and Subsidies
- 9.4 Imports, Exports and Trade Barriers
- 9.5 Public Procurement and Local Content Requirements
- 9.6 Environmental and Sustainability Compliance
- 9.7 Upcoming Policy Changes and Market Implications
Chapter 10 Australia Legal Cannabis Market Hotspots and Opportunities
- 10.1 Market Opportunity Mapping and Growth Hotspots
- 10.2 High-Growth Applications and Customer Groups
- 10.3 Underserved Markets and White-Space Opportunities
- 10.4 Emerging Technology and Product Opportunities
- 10.5 New Capacity and Investment Hotspots
- 10.6 Market Entry and Expansion Opportunities
- 10.7 Distribution and Partnership Opportunities
- 10.8 Near-Term and Long-Term Commercial Potential
- 10.9 Opportunity Attractiveness and Execution Risks
Chapter 11 Australia Legal Cannabis Market Outlook, 2025-2035
- 11.1 Market Size and Analysis
- 11.1.1 Revenue (Market Measurement: 2025: USD 551.5 million → 2035: USD 1.08 billion)
- 11.1.2 Market Volume and Quantity Sold
- 11.1.3 Historical Market Size, 2018-2025
- 11.1.4 Base-Year Market Size, 2025
- 11.2 Market Forecast, 2025-2035
- 11.2.1 Revenue Forecast to 2035
- 11.2.2 Volume Forecast to 2035
- 11.2.3 CAGR and Year-on-Year Growth
- 11.2.4 Incremental Revenue Opportunity
- 11.3 Forecast Assumptions and Scenario Analysis
- 11.3.1 Base-Case Forecast
- 11.3.2 Optimistic and Conservative Scenarios
- 11.3.3 Technology, Pricing and Policy Sensitivities
- 11.4 Market Attractiveness and Growth Outlook
Chapter 12 Australia Legal Cannabis Market Segmentation and Outlook
- 12.1 Segmentation Summary and Market Shares, 2025
- 12.2 Largest and Fastest-Growing Segments
- 12.3 By Product Type - Market Size and Forecast, 2025-2035
- 12.3.1 Segment Definition and Scope
- 12.3.2 Historical Market Size, 2018-2025
- 12.3.3 Revenue Forecast, 2025-2035
- 12.3.4 Volume Forecast, 2025-2035
- 12.3.5 Base-Year Market Share, 2025
- 12.3.6 Segment CAGR and Growth Drivers
- 12.3.7 Subsegment Market Size and Forecast
- 12.3.7.1 Medicinal Flower
- 12.3.7.2 Medicinal Formulations
- 12.3.7.3 Industrial Hemp Products
- 12.3.8 Subsegment Pricing and Adoption Trends
- 12.3.9 Leading Suppliers and Competition
- 12.3.10 Regional Demand and Opportunities
- 12.4 By Application - Market Size and Forecast, 2025-2035
- 12.4.1 Segment Definition and Scope
- 12.4.2 Historical Market Size, 2018-2025
- 12.4.3 Revenue Forecast, 2025-2035
- 12.4.4 Volume Forecast, 2025-2035
- 12.4.5 Base-Year Market Share, 2025
- 12.4.6 Segment CAGR and Growth Drivers
- 12.4.7 Subsegment Market Size and Forecast
- 12.4.7.1 Pain Management
- 12.4.7.2 Mental Health and Sleep
- 12.4.7.3 Neurological and Supportive Care
- 12.4.7.4 Nutrition and Materials
- 12.4.8 Subsegment Pricing and Adoption Trends
- 12.4.9 Leading Suppliers and Competition
- 12.4.10 Regional Demand and Opportunities
- 12.5 By Operating Model - Market Size and Forecast, 2025-2035
- 12.5.1 Segment Definition and Scope
- 12.5.2 Historical Market Size, 2018-2025
- 12.5.3 Revenue Forecast, 2025-2035
- 12.5.4 Volume Forecast, 2025-2035
- 12.5.5 Base-Year Market Share, 2025
- 12.5.6 Segment CAGR and Growth Drivers
- 12.5.7 Subsegment Market Size and Forecast
- 12.5.7.1 Integrated Brand Platforms
- 12.5.7.2 Independent Product Sponsors
- 12.5.7.3 Contract Production Networks
- 12.5.8 Subsegment Pricing and Adoption Trends
- 12.5.9 Leading Suppliers and Competition
- 12.5.10 Regional Demand and Opportunities
- 12.6 Segment Growth Comparison
- 12.7 Segment Attractiveness and Priority Matrix
Chapter 13 Australia Legal Cannabis End-Use and Application Market Outlook
- 13.1 End-Use Industry and Customer Demand Structure
- 13.2 Leading Applications and Customer Groups
- 13.3 End-Use Market Size, Share and Forecast
- 13.4 Major End-Use Industry Deep Dives
- 13.4.1 Customer Requirements and Use Cases
- 13.4.2 Demand and Replacement Cycles
- 13.4.3 Technical and Regulatory Considerations
- 13.4.4 Purchasing and Procurement Models
- 13.4.5 Leading Vendors and Distribution Channels
- 13.4.6 Forecast and Commercial Opportunities
- 13.5 Emerging Applications and Cross-Segment Demand
- 13.6 End-Use Industry Investment Priorities
Chapter 14 Australia Legal Cannabis Geographic Market Outlook, 2025-2035
- 14.1 Domestic Market Distribution and Demand Clusters
- 14.2 State- or Province-Wise Market Size and Forecast, 2025-2035
- 14.3 City and Metropolitan Market Outlook
- 14.4 Industrial, Manufacturing and Commercial Clusters
- 14.5 Geographic Concentration of Key End Users
- 14.6 Local Pricing and Purchasing Differences
- 14.7 Domestic Production Facilities and Capacity Map
- 14.8 Local Infrastructure and Project Pipeline
- 14.9 State-Level Policy and Incentive Differences
- 14.10 Subnational Investment Hotspots and Opportunities
- 14.11 Distribution and Logistics Networks
- 14.12 Domestic Competitive Footprint
Chapter 15 Australia Legal Cannabis Technology, Innovation and Sustainability Outlook
- 15.1 Technology Landscape and Maturity
- 15.2 Product, Process and Service Innovation
- 15.3 AI, Automation and Digital Tools in the Industry
- 15.4 Technology Adoption and Performance Benchmarking
- 15.5 Innovation Pipeline and R&D Investment
- 15.6 Patent and Intellectual Property Trends
- 15.7 Energy Efficiency and Resource Management
- 15.8 Sustainability, Recycling and Circularity
- 15.9 Technology Roadmap, 2025-2035
- 15.10 Risks of Obsolescence and Technology Substitution
Chapter 16 Australia Legal Cannabis Market Key Strategic Imperatives
- 16.1 Growth and Market Entry Priorities
- 16.2 High-Return Products and Segments
- 16.3 Pricing, Profitability and Cost Optimization
- 16.4 Technology Investment and Product Differentiation
- 16.5 Supply Chain Localization and Resilience
- 16.6 Distribution and Customer Acquisition
- 16.7 Partnership, Acquisition and Capacity Strategy
- 16.8 Regional Expansion Priorities
- 16.9 Short-, Medium- and Long-Term Actions
Chapter 17 Competition Outlook
- 17.1 Industry Competition Characteristics
- 17.2 Market Structure and Concentration
- 17.3 Market Share and Competitive Positioning, 2025
- 17.4 Company-Wise Revenue and Product Benchmarking
- 17.5 Production and Service Capacity Benchmarking
- 17.6 Technology, Pricing and Differentiation
- 17.7 Regional Footprint and Distribution Strength
- 17.8 Mergers, Acquisitions and Strategic Alliances
- 17.9 New Entrants and Competitive Threats
- 17.10 Porter's Five Forces and Industry Attractiveness
- 17.11 Competitive Outlook, 2025-2035
Chapter 18 Company Profiles
- 18.1 Company Coverage and Selection Criteria
- 18.2 Montu Group
- 18.2.1 Business Description
- 18.2.2 Company Ownership and Geographic Presence
- 18.2.3 Product and Service Portfolio
- 18.2.4 Manufacturing and Operating Footprint
- 18.2.5 Production Capacity and Expansion Plans
- 18.2.6 Financial Performance and Investment
- 18.2.7 Market Share and Competitive Position
- 18.2.8 Technology and Innovation Capabilities
- 18.2.9 Strategic Alliances or Partnerships
- 18.2.10 Recent Developments
- 18.2.11 Growth Strategy and Outlook
- 18.3 Vitura Health
- 18.4 Cannatrek
- 18.5 Little Green Pharma
- 18.6 Cann Group
- 18.7 ECS Botanics
- 18.8 Althea Group
- 18.9 MedReleaf Australia
- 18.10 Tasmanian Botanics
- 18.11 Hemp Foods Australia
- 18.12 Other Relevant Market Participants
Note: Every listed company is profiled on the structure shown under the first company. The company list is preliminary and may change based on research findings, market developments, data availability and client requirements.
Chapter 19 Disclaimer
- 19.1 Research and Forecast Disclaimer
- 19.2 Data Source and Estimation Limitations
Note: The depth of individual sections depends on data availability for this market. Volume, capacity, trade and other unit-based metrics are included where applicable.

