
Untreated diarrhea episodes and rehydration gaps shape care
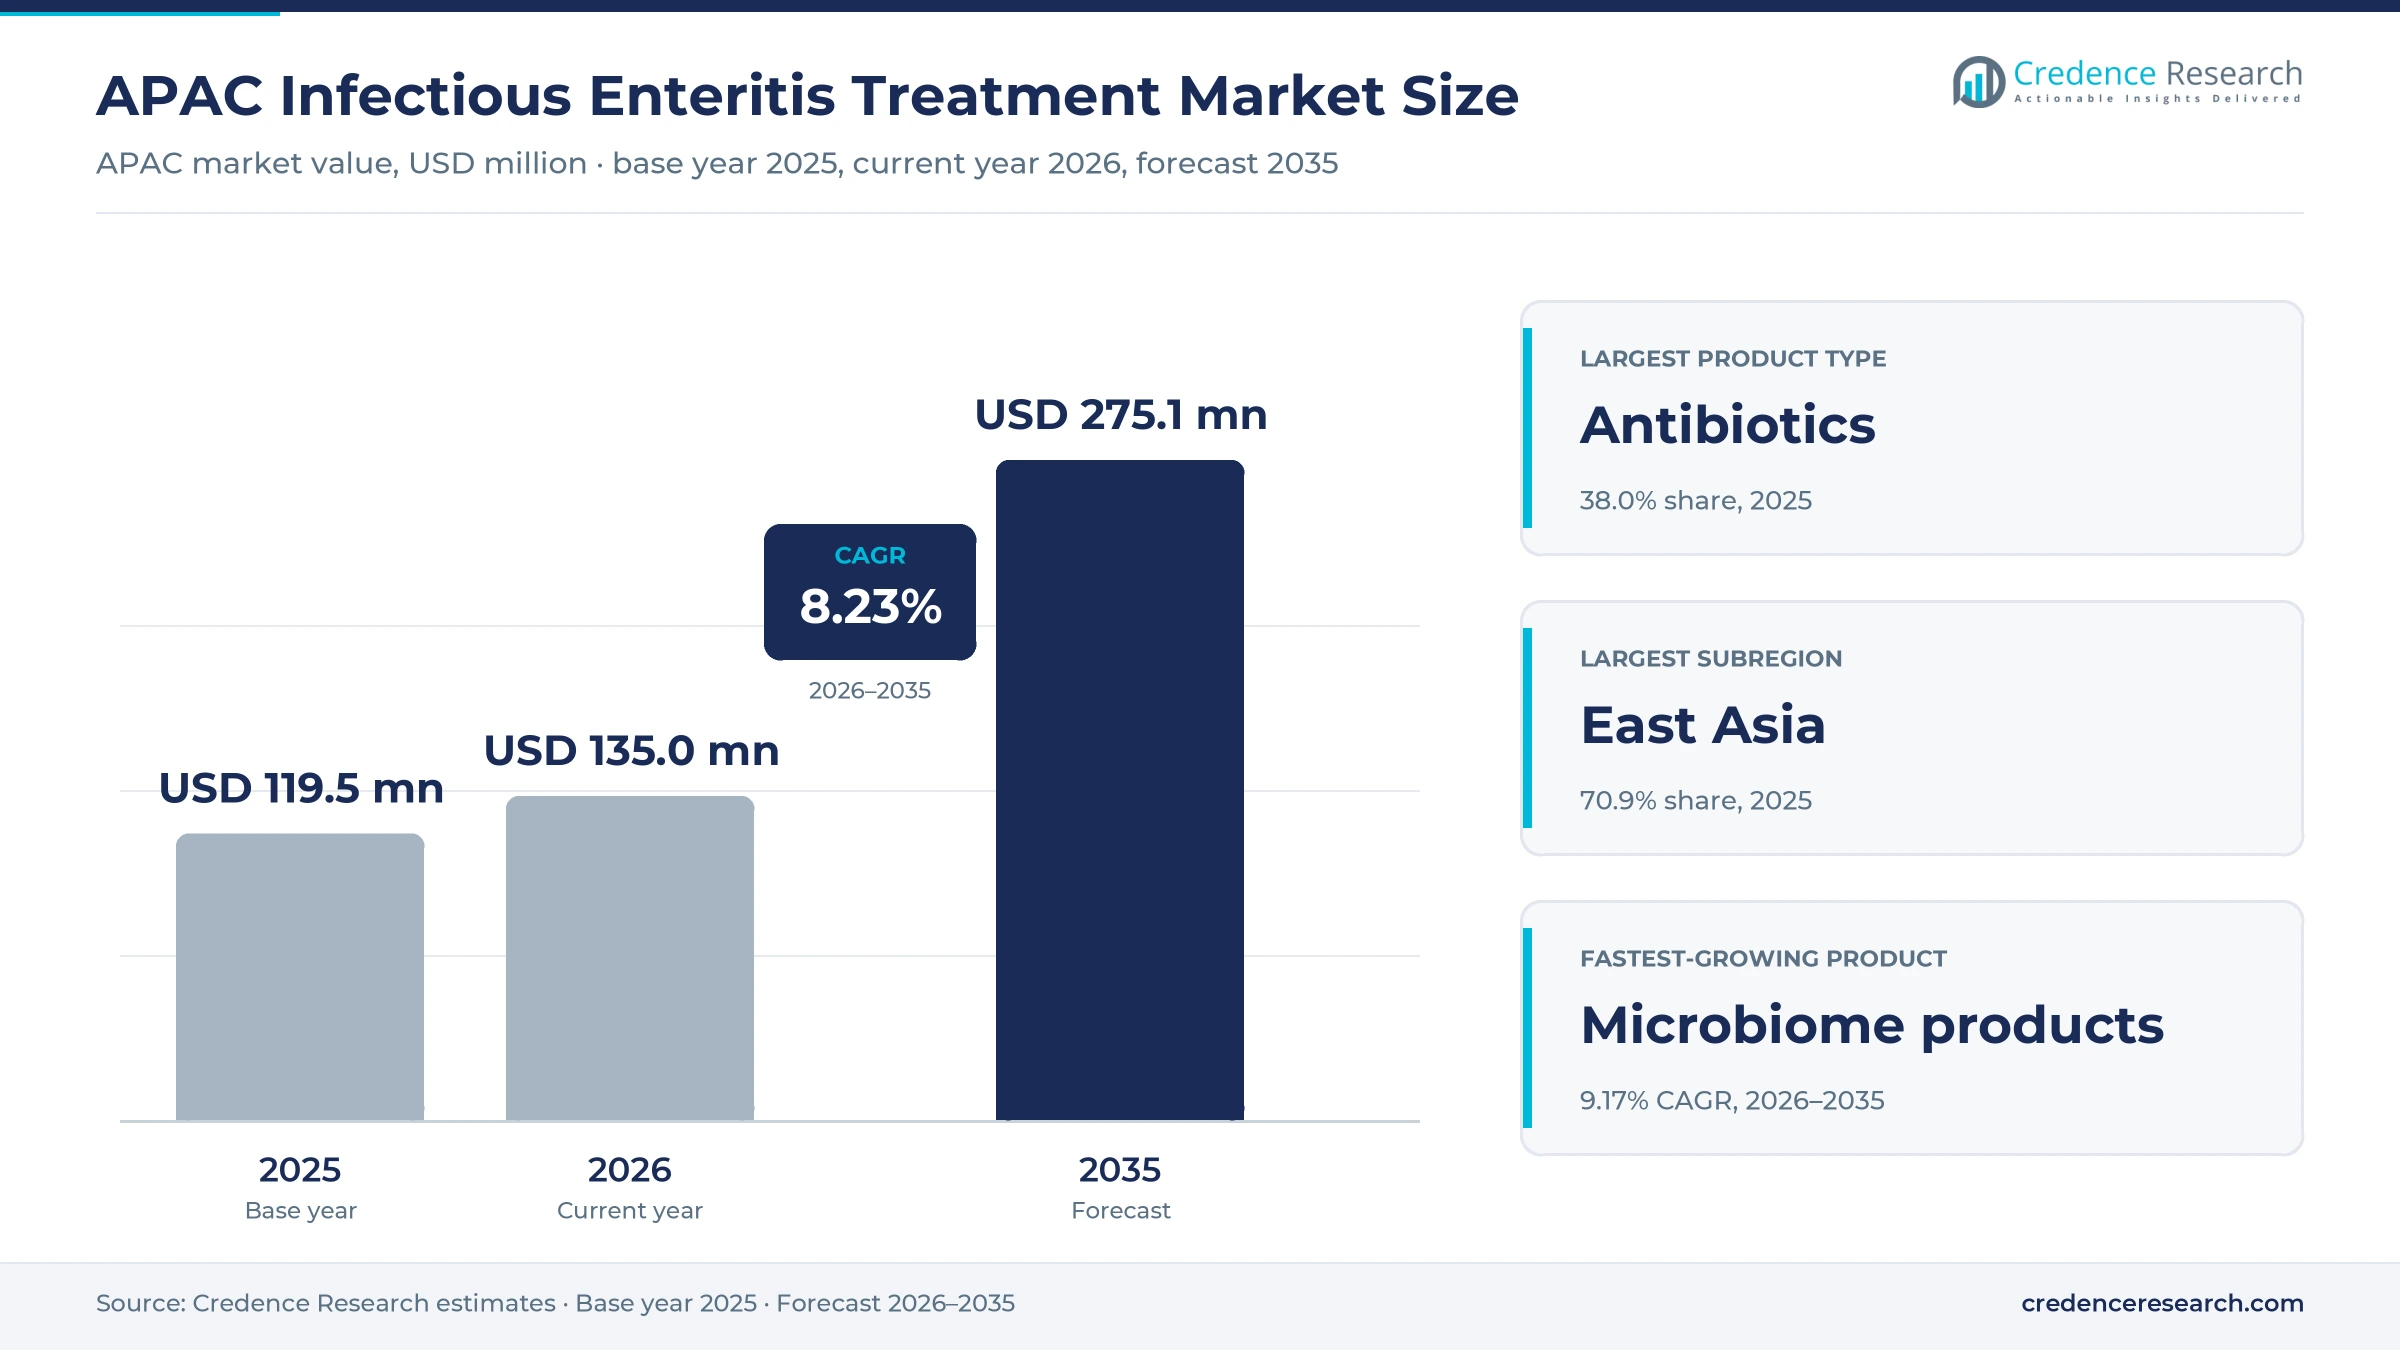
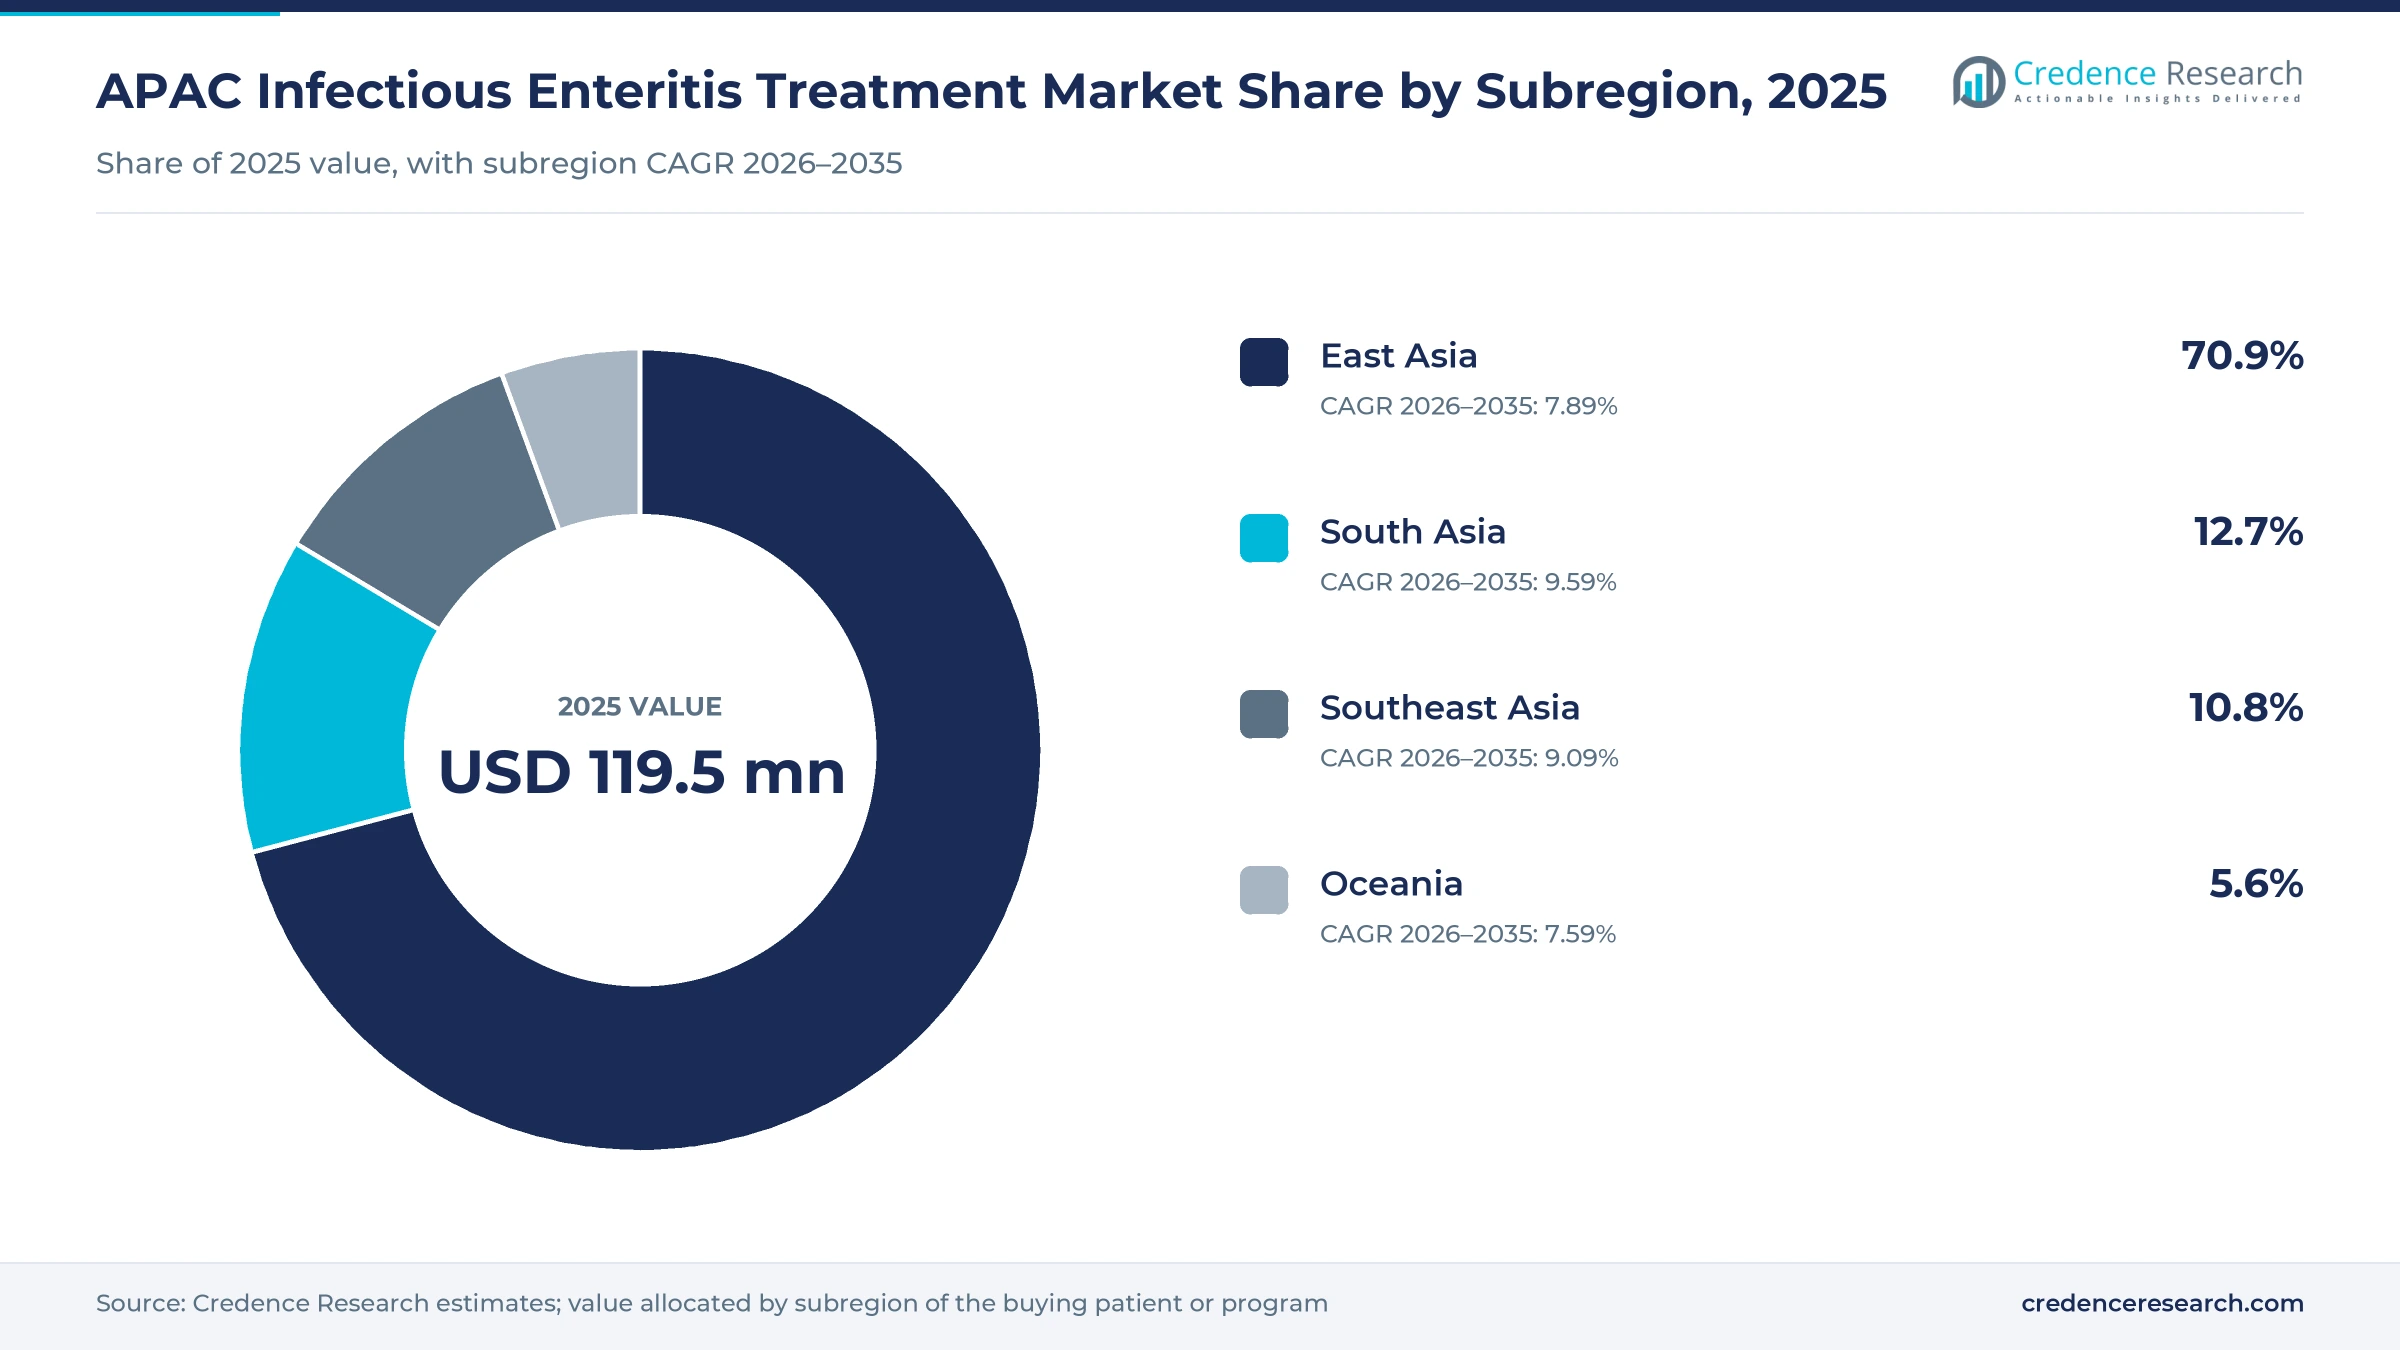
The APAC infectious enteritis treatment market was valued at USD 119.5 million in 2025 and is projected to increase from USD 135.0 million in 2026 to USD 275.1 million by 2035, registering a CAGR of 8.23% during 2026–2035. Demand comes from the large number of childhood diarrhea episodes across the region, hospital use of antibiotics for bacterial cases and public programs that hand out oral rehydration salts and zinc. East Asia held the largest subregional share, 70.9% in 2025, because China reports a high volume of notified diarrheal infections and pays higher prices for branded products. South Asia is the fastest-growing subregion at 9.59% a year, as national campaigns move more untreated cases into clinics and pharmacies. Southeast Asia and Oceania add demand through probiotic use and specialist microbiota therapy. India also tightened labeling rules in October 2025, so only products that match the WHO formula can carry the ORS name.
Which products and care settings does the regional estimate cover?
The estimate measures spending on antibiotics, oral rehydration products, probiotics and microbiome therapeutics, and antiparasitic and adjunctive products used to treat infectious enteritis in the Asia-Pacific region. It covers hospital inpatient care, ambulatory clinics and community and home care. Values are measured at the first point of sale to hospitals, pharmacies, online sellers and public health programs.
The estimate excludes vaccines, water and sanitation spending and sports or electrolyte drinks that do not meet a medical rehydration formula. The value chain runs from active ingredient and probiotic strain suppliers through generic and branded drug makers, distributors and wholesalers to hospital pharmacies, retail chains, online pharmacies and government procurement agencies across East Asia, South Asia, Southeast Asia and Oceania.
APAC Infectious Enteritis Treatment Market Insights
- The APAC infectious enteritis treatment market was valued at USD 119.5 million in 2025 and is projected to reach USD 275.1 million by 2035, registering a CAGR of 8.23% during 2026–2035.
- East Asia held a 70.9% share of 2025 value, because China reports a high volume of notified diarrheal infections each month.
- Antibiotics led product demand with a 38.0% share of 2025 value, because hospitals treat bacterial cases with oral and injectable drugs.
- India withdrew earlier permissions for drinks to use the ORS name on Oct. 14, 2025, which favors products that follow the WHO formula.
- Biocodex opened a subsidiary in Ho Chi Minh City on April 4, 2025, which widens access to its probiotic yeast strain in Southeast Asia.
Antibiotics lead while microbiome products grow fastest
Why do antibiotics lead product demand?
Based on product type, the market is categorized into antibiotics, oral rehydration products, probiotics and microbiome therapeutics, and antiparasitic and adjunctive products. Antibiotics led with a 38.0% share of 2025 value, because hospitals treat confirmed and suspected bacterial cases with oral and injectable drugs. Probiotics and Microbiome Therapeutics grow fastest at 9.17% a year, as clinicians add probiotic strains to rehydration care.
How does bacterial infection shape disease area demand?
Based on disease area, the market is categorized into bacterial enteritis, viral enteritis, parasitic enteritis and mixed or undetermined infectious enteritis. Bacterial Enteritis led with a 40.0% share of 2025 value, because these cases need antibiotics as well as fluids. Viral Enteritis grows fastest at 8.70% a year, as rehydration and probiotic products serve the many viral cases in young children.
Why do pediatric patients lead end user demand?
Based on end user, the market is categorized into pediatric patients, adult patients and geriatric patients. Pediatric Patients led with a 46.0% share of 2025 value, because children under five have the most diarrhea episodes and receive rehydration salts and zinc through public programs. Geriatric Patients grow fastest at 8.79% a year, as aging populations face higher dehydration risk and longer hospital stays.
How do retail pharmacies shape distribution?
Based on distribution channel, the market is categorized into hospital pharmacies, retail and community pharmacies, online pharmacies and public health programs. Retail and Community Pharmacies led with a 42.0% share of 2025 value, because families buy rehydration salts and probiotics near home. Online Pharmacies grow fastest at 11.09% a year, as urban buyers order over-the-counter products online.
| Segment Group | Leading Sub-segment | Share, 2025 | Fastest-growing Sub-segment | CAGR, 2026–2035 |
|---|---|---|---|---|
| By Product Type | Antibiotics | 38.0% | Probiotics and Microbiome Therapeutics | 9.17% |
| By Disease Area | Bacterial Enteritis | 40.0% | Viral Enteritis | 8.70% |
| By End User | Pediatric Patients | 46.0% | Geriatric Patients | 8.79% |
| By Distribution Channel | Retail and Community Pharmacies | 42.0% | Online Pharmacies | 11.09% |
Request a Free Sample
Fill in your details and we'll send you a free sample report.
- Sample data tables & charts
- Research methodology
Care conversion, rehydration supply and microbiota pathways
How does converting untreated episodes lift care demand?
Converting untreated episodes into appropriate care lifts demand, because many children with diarrhea still receive no rehydration or medicine. There are nearly 1.7 billion cases of childhood diarrheal disease each year, and about 525,000 children under five die from it, according to the World Health Organization. Only 60.6% of Indian children under five with diarrhea received oral rehydration salts in 2021, according to national survey data. The makers of ORSL launched an initiative on Feb. 18, 2025, to reach about 5 million children in Uttar Pradesh and Bihar over two years. As a result, pediatric patients hold a 46.0% share of 2025 value, the largest end user share.
Why does essential rehydration availability widen access?
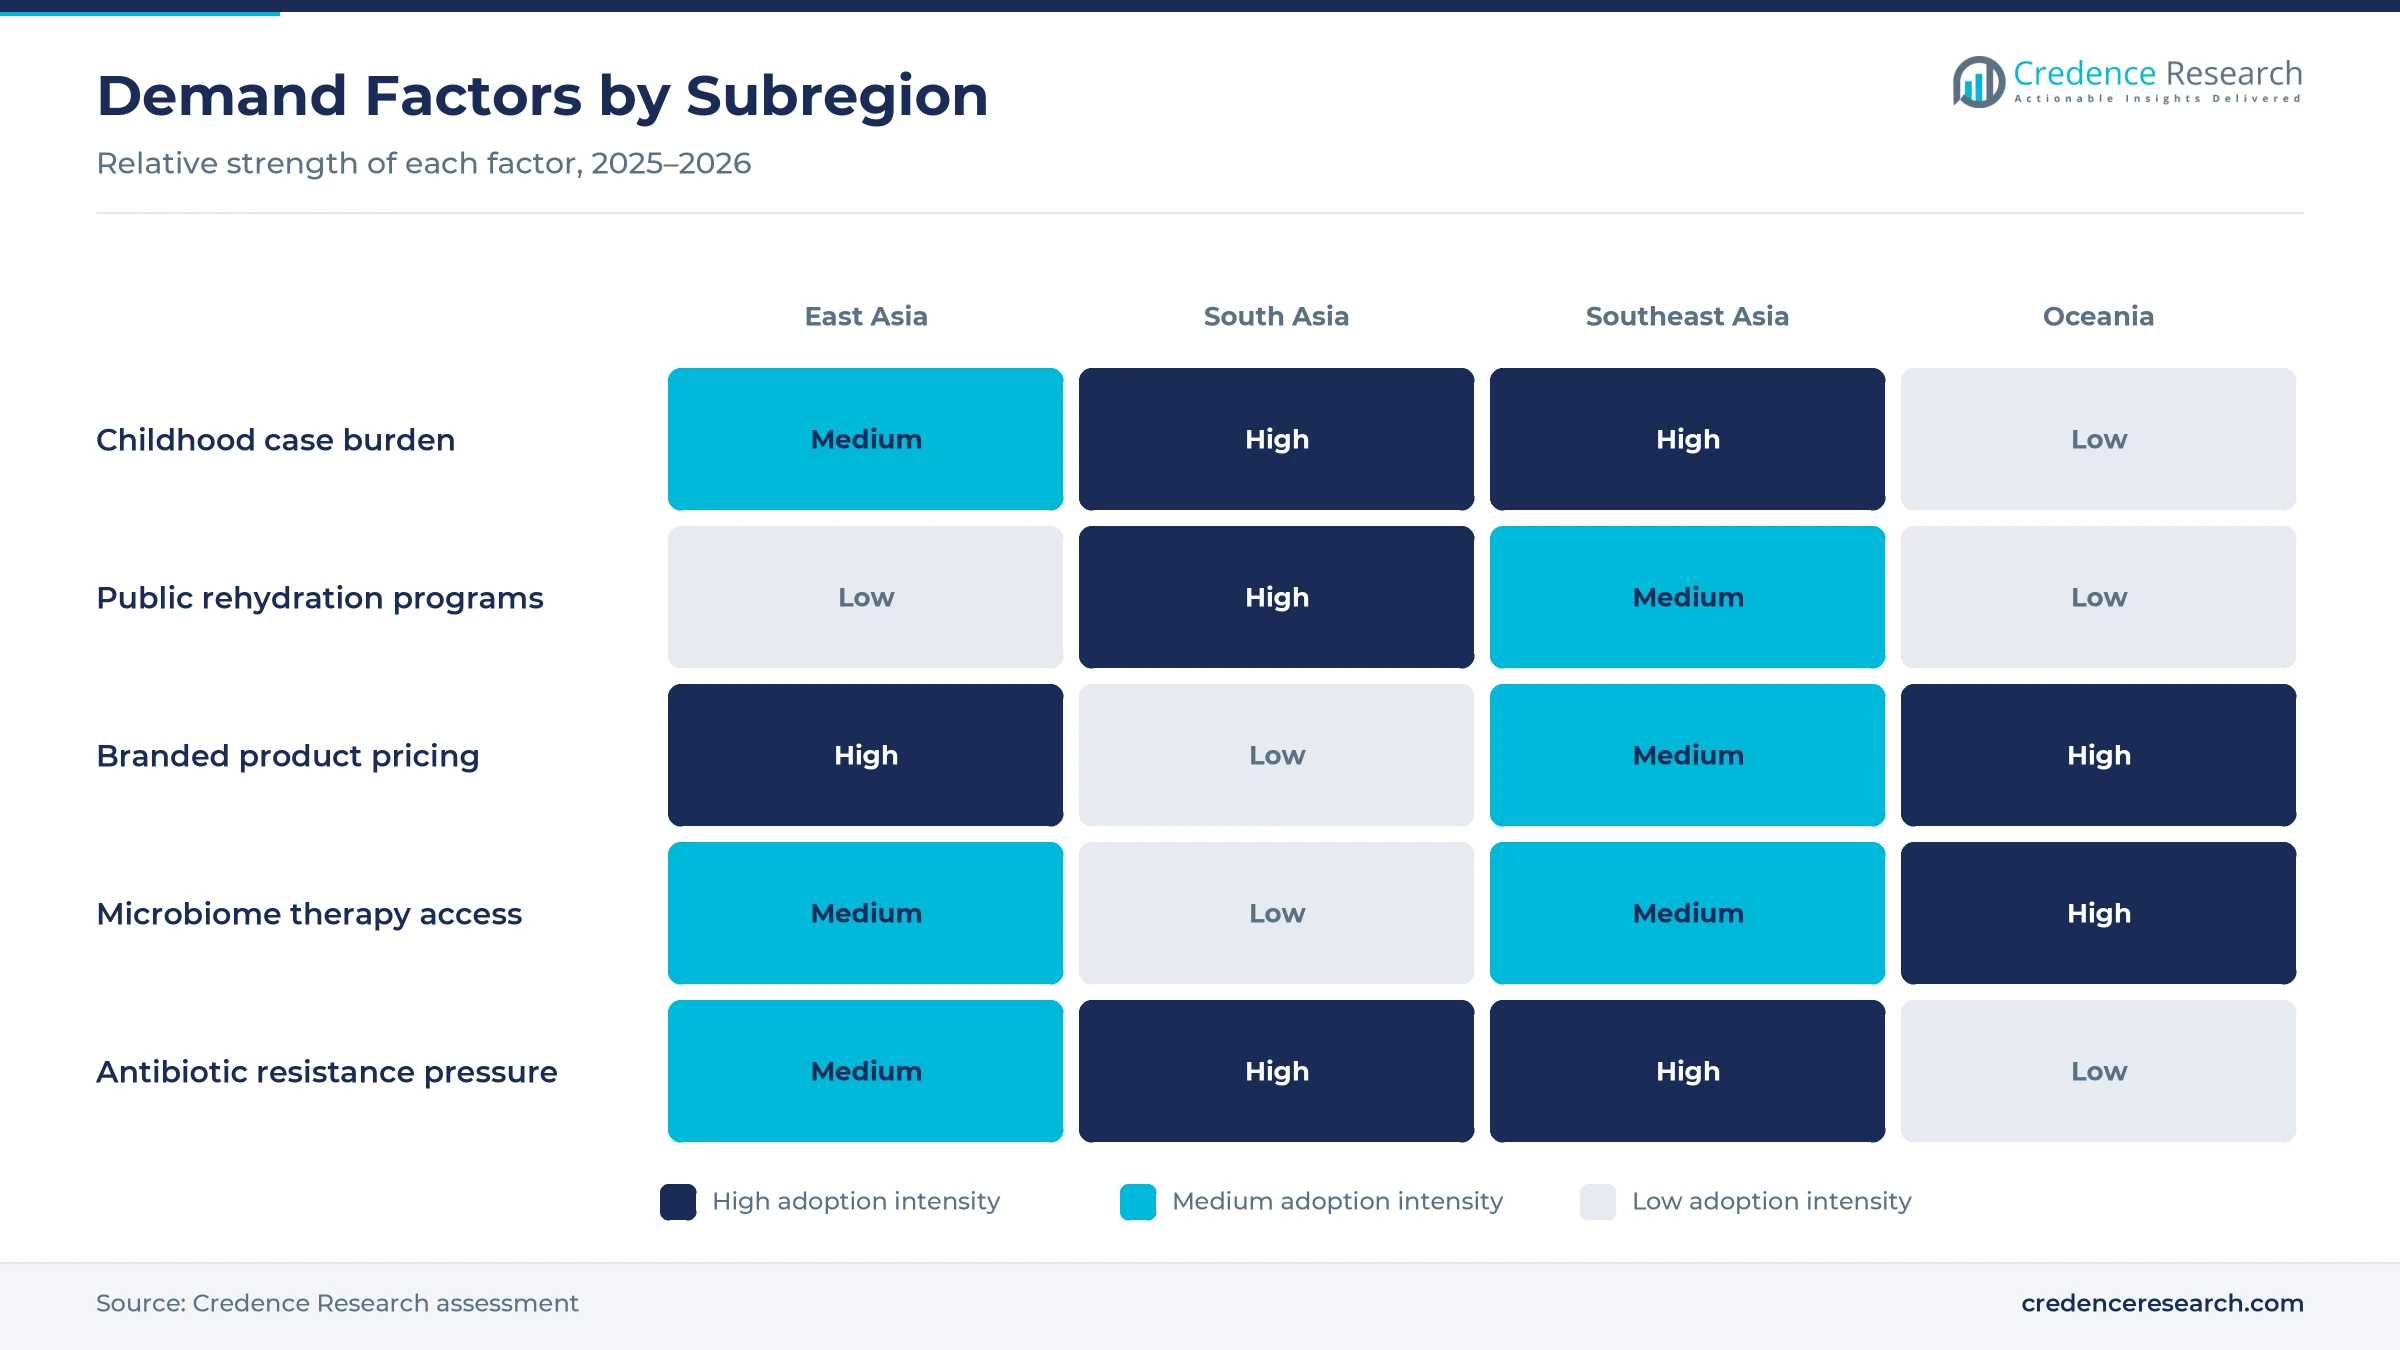
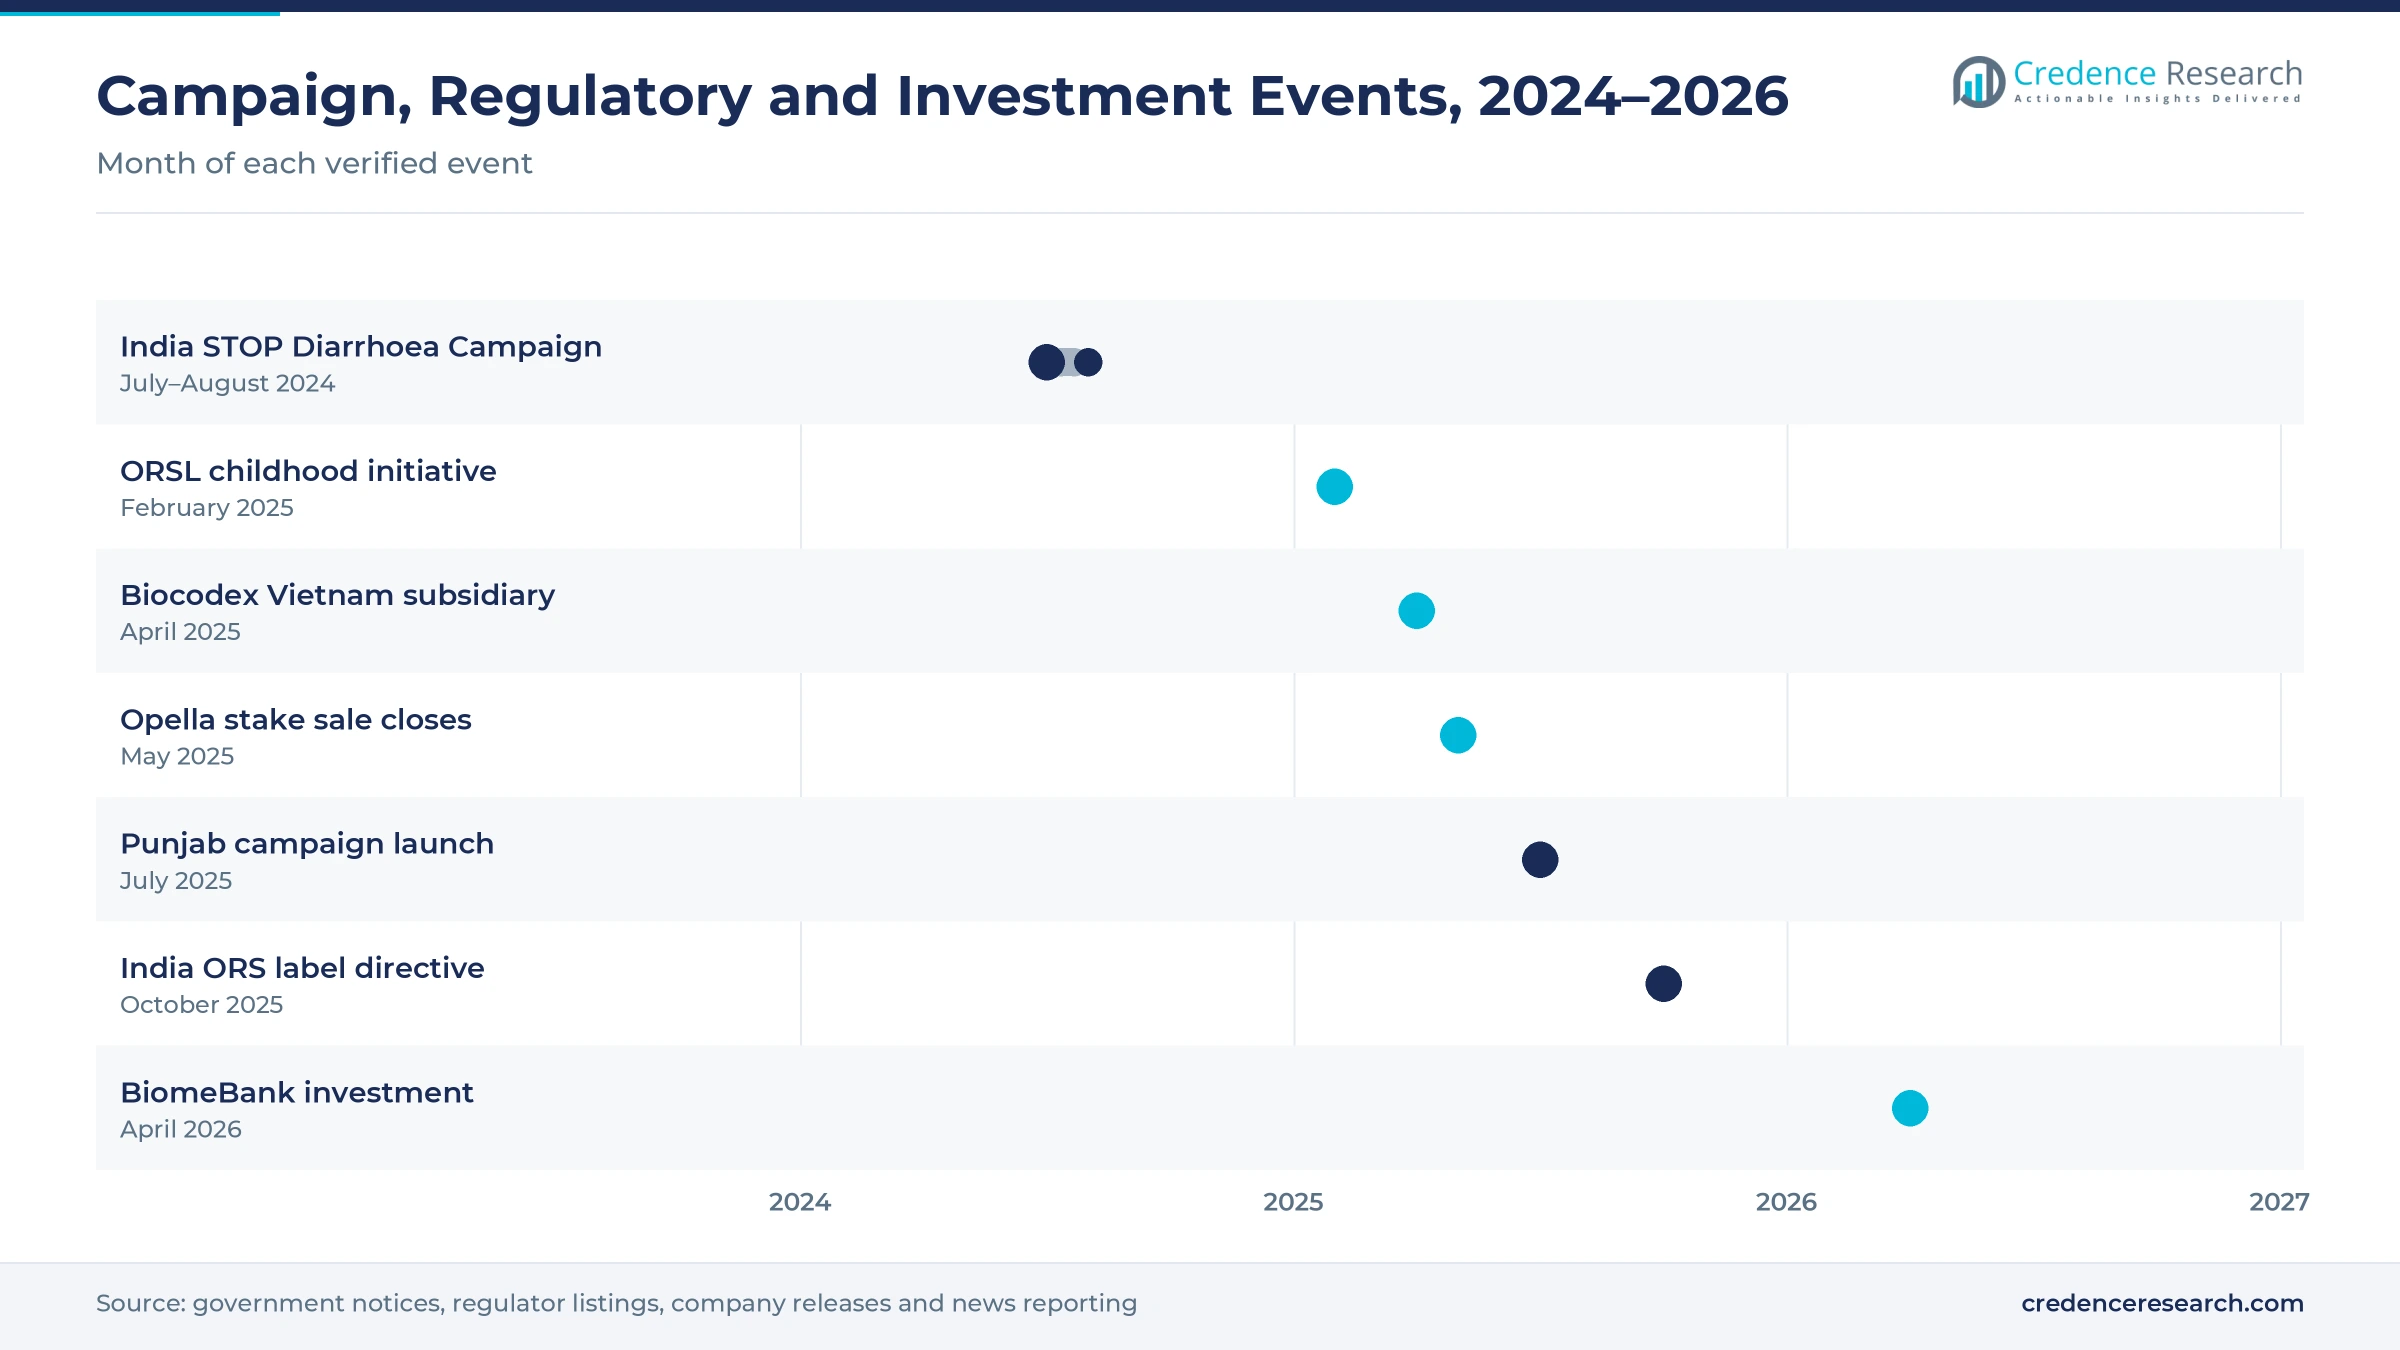
Essential rehydration availability widens access, because public programs now place salts and zinc in homes before children fall ill. India ran its STOP Diarrhoea Campaign from July 1 to Aug. 31, 2024, after a preparatory phase in June, as reported in coverage of the national launch. Each child under five received two ORS packets co-packaged with zinc, while health facilities and Anganwadi centers set up ORS-zinc corners. Punjab launched its own two-month campaign on July 15, 2025, with door-to-door kit distribution by ASHA workers. In turn, public health programs remain an important channel for infectious enteritis treatment in South Asia, where community workers reach homes that pharmacies do not serve.
How do specialist microbiota product pathways add value?
Specialist microbiota product pathways add value, because regulators now approve donor-derived therapies as medicines. The Therapeutic Goods Administration lists BiomeBank's Biomictra as a Class 2 biological, and its evaluation took 234 days. BiomeBank won the first regulatory approval in the world for a donor-based microbiome therapy in 2022, and the approval covers recurrent Clostridioides difficile infection. Blackmores signed a $15 million investment in BiomeBank, as reported on April 20, 2026. Specialist products such as these also serve patients after long antibiotic courses disturb gut bacteria. As a result, probiotics and microbiome therapeutics grow at 9.17% a year, the fastest product rate.
Why do high notified case loads sustain East Asian demand?
High notified case loads sustain East Asian demand, because each reported case usually leads to a clinic visit and a prescription. China reported 100,831 cases of infectious diarrhea in November 2024 alone, through its national notifiable disease reporting system. The same monthly report listed 2,128 dysentery cases, which add hospital antibiotic use. China also pays higher prices for branded probiotics and injectable drugs than lower-income markets in the region. In turn, East Asia remains the largest buyer of infectious enteritis treatment in the region, and bacterial enteritis leads disease area demand with a 40.0% share of 2025 value.
Stricter rehydration labels and probiotic adjuncts rise
How is the shift to WHO-formula rehydration labels changing sales?
The shift to WHO-formula rehydration labels is changing sales, because regulators now separate medical salts from sugary drinks. India's food regulator issued a directive on Oct. 14, 2025, that withdrew permissions granted in July 2022 and February 2024, according to news reporting on the order. The WHO formula has a total osmolarity of 245 mOsm per liter, while some marketed drinks held up to 120 grams of sugar per liter. Cipla Health said on Oct. 28, 2025, that ProlyteORS follows the balance of electrolytes and glucose that WHO recommends. As a result, oral rehydration products grow at a steady rate as pharmacies stock compliant brands.
Why is the rise of probiotic adjuncts gaining weight?
The rise of probiotic adjuncts is gaining weight, because clinicians add spore and yeast strains to rehydration for young children. Enterogermina supplies 2 billion Bacillus clausii spores per 5 mL bottle, and clinical trials found it shortened acute diarrhea in children older than six months. Opella Healthcare India imports the product, and the Opella sale closed in May 2025 with a 50% stake held by Clayton, Dubilier & Rice. Sanofi kept 48.2% of the business, while Bpifrance holds 1.8% and a board seat. In turn, demand for probiotic supplements supports the fastest product growth in regional infectious enteritis treatment, especially in pediatric pharmacy sales.
Can closing rehydration gaps in Southeast Asia open demand?
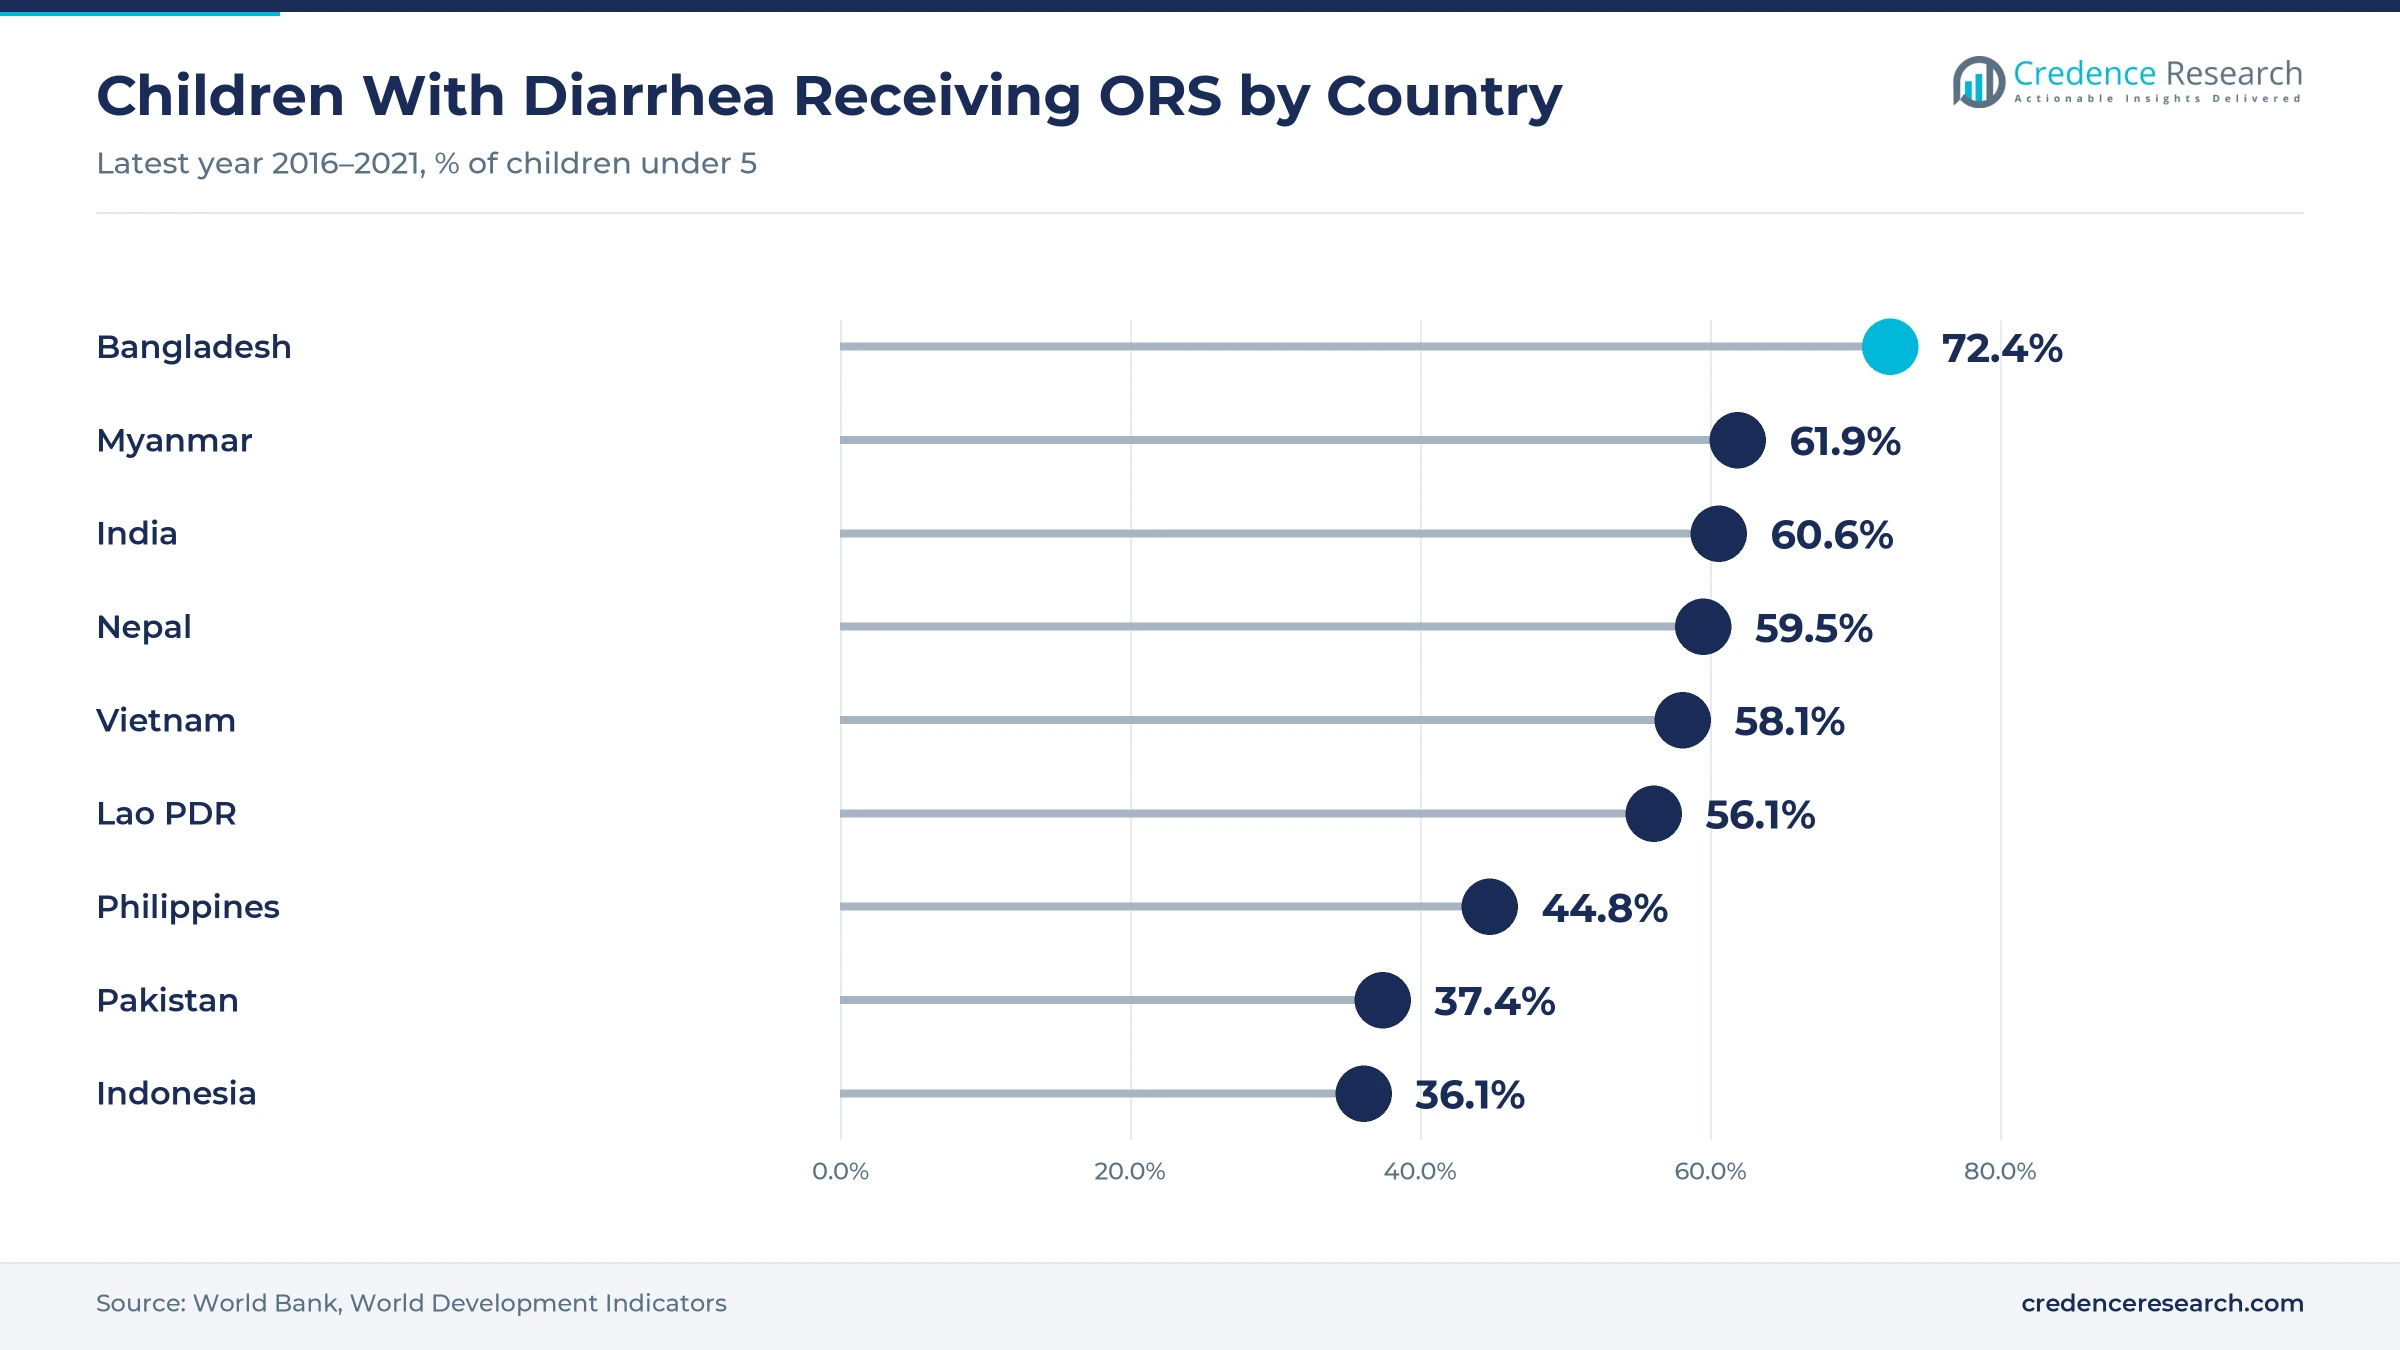
Closing rehydration gaps in Southeast Asia opens new demand, because many children with diarrhea still go without salts. Only 36.1% of children under five with diarrhea in Indonesia received oral rehydration salts in 2017, according to World Bank data. The rate was 44.8% in the Philippines in 2017 and 58.1% in Vietnam in 2021. Biocodex opened a subsidiary in Vietnam on April 4, 2025, as described in a company release, and its Saccharomyces boulardii strain was first found there in the 1920s. As a result, Southeast Asia grows at 9.09% a year, faster than the regional average, as pharmacies and clinics stock more salts and probiotics.
Is there room for growth in South Asian community care?
South Asian community care creates room for growth, because coverage of oral rehydration still varies widely by country. Bangladesh reached 72.4% coverage among children under five with diarrhea in 2019, while Pakistan recorded 37.4% in 2018 and Nepal recorded 59.5% in 2019. India's latest national family health survey found severe diarrhea prevalence among young children fell to 0.5% from 0.7% in the previous round. This progress shows that community programs can move cases into proper care. In turn, South Asia holds a 12.7% share of 2025 value, and community health workers remain the main route for infectious enteritis treatment in rural districts.
Drug resistance, informal sales and price pressure
How does antibiotic resistance limit treatment choices?
Antibiotic resistance limits treatment choices, because common gut bacteria no longer respond to older and cheaper drugs. WHO reported in October 2025 that about one in three laboratory-confirmed infections in the South-East Asian Region resisted treatment. As a result, clinicians switch to costlier drugs or longer courses, which raises spending and side effects. Governments respond with stewardship rules and laboratory testing, while drug makers add newer agents and combination packs to their portfolios across the region.
Why do informal sales weaken quality care?
Informal sales weaken quality care, because many families buy antibiotics and drinks without advice from a pharmacist or doctor. This practice leads to wrong doses, missed rehydration and resistant infections in children and older adults. In turn, branded makers lose sales to unregistered products in rural markets. Regulators respond with labeling rules and pharmacy inspections, while companies train pharmacists and fund awareness campaigns on correct rehydration and when to seek clinical care.
How does generic price pressure squeeze margins?
Generic price pressure squeezes margins, because public tenders buy oral rehydration salts, zinc and common antibiotics at very low unit prices. Many suppliers compete for the same tenders across South and Southeast Asia. As a result, smaller makers struggle to fund quality upgrades and new formats. Companies respond by moving into branded pharmacy products, ready-to-drink formats and probiotic combinations, which earn higher prices and support investment in quality systems.
Why does diagnostic uncertainty complicate treatment?
Diagnostic uncertainty complicates treatment, because most clinics cannot test stool samples to separate bacterial, viral and parasitic causes. Clinicians therefore treat many cases on symptoms alone, which leads to unneeded antibiotic use in viral cases. In turn, mixed or undetermined cases remain a large share of demand. Health systems respond with rapid stool tests and syndromic panels, while guidelines stress rehydration first and antibiotics only for bloody diarrhea or severe illness.
East Asia leads while South Asia grows fastest
| Subregion | Value, 2025 (USD million) | Share, 2025 | CAGR, 2026–2035 |
|---|---|---|---|
| East Asia | 84.7 | 70.9% | 7.89% |
| South Asia | 15.2 | 12.7% | 9.59% |
| Southeast Asia | 12.9 | 10.8% | 9.09% |
| Oceania | 6.7 | 5.6% | 7.59% |
Why does East Asia hold the largest share?
East Asia held a 70.9% share of 2025 value and grows at 7.89% a year, because China reports a large volume of notified gut infections and pays higher prices for branded products. China recorded 100,831 infectious diarrhea cases in November 2024 through its national reporting system. Japan and South Korea add demand through hospital care for older patients and wide pharmacy use of probiotic products in daily gut health routines.
How does South Asia become the fastest-growing subregion?
South Asia held a 12.7% share of 2025 value and grows fastest at 9.59% a year, because national campaigns move untreated childhood cases into care. India's 2024 STOP Diarrhoea Campaign gave each child under five two ORS packets co-packaged with zinc. Bangladesh reached 72.4% rehydration coverage in 2019, while Pakistan stood at 37.4% in 2018, which leaves a large gap for community programs and pharmacies to close.
What drives demand in Southeast Asia?
Southeast Asia held a 10.8% share of 2025 value and grows at 9.09% a year, because rehydration coverage remains low in several large countries. Indonesia stood at 36.1% coverage in 2017, which leaves many children without basic care. Biocodex opened a Vietnamese subsidiary in April 2025 that focuses on gut microbiota health, and pharmacies in Vietnam stock Bacillus clausii products for young children.
How does Oceania support specialist therapy demand?
Oceania held a 5.6% share of 2025 value and grows at 7.59% a year, because Australia funds specialist care for severe and recurrent infections. The Therapeutic Goods Administration lists Biomictra as a Class 2 biological for recurrent Clostridioides difficile infection. BiomeBank also secured a $15 million investment in April 2026, which supports new microbiome products for patients with irritable bowel syndrome and other serious bowel conditions.
Campaign, approval and investment milestones, 2024–2026
| Development | Status and market relevance |
|---|---|
| In June 2024, India launched its national STOP Diarrhoea Campaign, which ran from July 1 to Aug. 31, 2024. | Places ORS and zinc in homes with young children |
| In February 2025, the makers of ORSL launched an initiative to reach about 5 million children in Uttar Pradesh and Bihar. | Moves untreated childhood cases into rehydration care |
| In April 2025, Biocodex opened its Vietnamese subsidiary in Ho Chi Minh City. | Widens access to probiotic yeast products in Southeast Asia |
| In October 2025, India's food regulator barred the ORS name on drinks that do not follow the WHO formula. | Favors compliant medical rehydration brands |
| In April 2026, BiomeBank signed a $15 million investment from Blackmores. | Funds microbiome therapy development in Australia |
Low-osmolarity salts, spore strains and donor microbiota
- Low-osmolarity rehydration salts follow the WHO formula of 245 mOsm per liter, which reduces stool output and the need for intravenous fluids in children.
- Zinc co-packaging places zinc tablets in the same pack as rehydration salts, which helps families complete the full course of treatment at home.
- Spore-based probiotics use Bacillus clausii spores that survive stomach acid, which lets the strains reach the gut during and after antibiotic courses.
- Donor microbiota therapy transfers screened gut bacteria from healthy donors, which restores gut balance in patients with recurrent Clostridioides difficile infection.
Need a Custom Version of This Report?
Tailor the scope, geography, or segments to your exact requirements.
- Custom geography or segment scope
- Direct access to our analyst team
Generic makers and microbiome specialists compete on access
Competition combines large generic drug makers with branded consumer health firms and microbiome specialists. Cipla Health sells ProlyteORS in India and said in October 2025 that the brand follows the WHO electrolyte and glucose balance. Opella supplies Enterogermina in India through its local importer, and its ownership changed in May 2025 when Clayton, Dubilier & Rice took a 50% stake. Biocodex opened a subsidiary in Vietnam in April 2025 to support its gut microbiota products. BiomeBank supplies Biomictra in Australia and secured new funding in April 2026. Generic makers such as Sun Pharmaceutical Industries, Glenmark Pharmaceuticals and Dr. Reddy's Laboratories compete on price and reach in pharmacy channels. Companies compete on formula quality, tender pricing, pharmacy reach and clinical evidence for children.
Companies profiled and their roles in this market
| Company | Type | Role in the market |
|---|---|---|
| Cipla | Generic and consumer health maker | Sells ProlyteORS rehydration salts in India |
| Opella | Consumer health company | Supplies Enterogermina spores through Opella Healthcare India |
| Biocodex | Microbiota specialist | Opened a subsidiary in Vietnam in April 2025 |
| BiomeBank | Microbiome therapy developer | Supplies Biomictra for recurrent infection in Australia |
Credence Research view on regional diarrheal care demand
Credence Research's view is that Asia-Pacific demand for gut infection treatment will grow steadily because public programs, stricter labels and new microbiome products all lift spending. Antibiotics keep the largest product share, while probiotics and microbiome therapeutics grow fastest as clinicians add them to rehydration care. East Asia keeps the largest share, and South Asia grows fastest as campaigns reach more children. However, drug resistance and informal sales will slow quality gains. Makers that combine compliant formulas with wide pharmacy reach should gain share fastest.
How the regional gut infection care estimate was built
The report uses 2025 as the base year on a calendar basis, and market values come from the Credence Research model. That model combines disease burden data, rehydration coverage statistics, notified case counts, government campaign documents and company information on products and approvals. Segment splits and subregional growth rates are Credence Research estimates, while subregional shares follow the client-defined split. Sources used are official statistics, regulator listings, government and company releases and news reporting, and no interviews or surveys were used.
Rehydration access and microbiome care carry demand to 2035
Regional value for gut infection treatment is expected to reach USD 275.1 million by 2035, an 8.23% CAGR during 2026–2035, as more children receive proper rehydration and zinc. Growth should be strongest in South and Southeast Asia, where coverage gaps are widest and campaigns are expanding. After 2030, microbiome therapies and probiotic adjuncts will carry a larger part of value as regulators approve new products. Faster progress on drug resistance would support this outlook, while weak pharmacy oversight would slow it.
Frequently Asked Questions
How big is the APAC infectious enteritis treatment market?
Which product type leads regional demand?
Which subregion leads the regional market?
Why do pediatric patients lead end user demand?
How did India change rehydration labeling?
Which distribution channel leads the market?
Who are the leading companies in the region?
What are the main challenges for treatment makers?
Table of Content
Chapter 1 Market Segmentation
- 1.1 Segmentation Framework
- 1.1.1 Product and Service Classification
- 1.1.2 Application and End-Use Classification
- 1.1.3 Technology and Solution Classification
- 1.1.4 Customer and Distribution Channel Classification
- 1.1.5 Geographic Segmentation
- 1.1.6 Market Segment Definitions and Boundaries
- 1.2 By Product Type
- 1.2.1 Antibiotics
- 1.2.2 Oral Rehydration Products
- 1.2.3 Probiotics and Microbiome Therapeutics
- 1.2.4 Antiparasitic and Adjunctive Products
- 1.3 By Disease Area
- 1.3.1 Bacterial Enteritis
- 1.3.2 Viral Enteritis
- 1.3.3 Parasitic Enteritis
- 1.3.4 Mixed or Undetermined Infectious Enteritis
- 1.4 By End User
- 1.4.1 Pediatric Patients
- 1.4.2 Adult Patients
- 1.4.3 Geriatric Patients
- 1.5 By Subregion
- 1.5.1 East Asia
- 1.5.2 South Asia
- 1.5.3 Southeast Asia
- 1.5.4 Oceania
Chapter 2 Introduction
- 2.1 Report Objectives and Scope
- 2.2 Product Definition and Industry Terminology
- 2.3 Market Inclusions and Exclusions
- 2.4 Research Process
- 2.4.1 Primary Research and Expert Interviews
- 2.4.2 Secondary Research and Source Review
- 2.4.3 Top-Down and Bottom-Up Estimation
- 2.4.4 Data Triangulation and Verification
- 2.5 Market Size Measurement Basis
- 2.5.1 2025: USD 119.5 million → 2035: USD 275.1 million
- 2.6 Historical and Forecast Reference Periods
- 2.6.1 Historical Period: 2018-2025
- 2.6.2 Base Year: 2025
- 2.6.3 Forecast Period: 2025-2035
- 2.7 Research Assumptions and Limitations
Chapter 3 Executive Summary
- 3.1 Market Snapshot and Key Findings
- 3.2 Base-Year Market Size, 2025
- 3.3 Forecast Market Size, 2035
- 3.4 Revenue and Volume Growth Outlook
- 3.5 Key Demand and Supply Indicators
- 3.6 Leading Market Segments
- 3.7 Fastest-Growing Market Opportunities
- 3.8 Regional Performance Highlights
- 3.9 Technology and Industry Transformation
- 3.10 Competitive Landscape Summary
- 3.11 Analyst View and Strategic Implications
Chapter 4 APAC Infectious Enteritis Treatment Market Trends and Developments
- 4.1 Historical Industry Development, 2018-2025
- 4.2 Recent Market Trends and Developments
- 4.3 Demand and Customer Behavior Trends
- 4.4 Technology and Product Innovation
- 4.5 Artificial Intelligence, Automation and Digitalization
- 4.6 Local Manufacturing and Supply Chain Realignment
- 4.7 Industry Partnerships, Mergers and Acquisitions
- 4.8 Sustainability and Circular Economy Developments
- 4.9 Government and Private Sector Investment Trends
- 4.10 Emerging Business Models and Commercialization
- 4.11 Industry Developments and Announcements
Chapter 5 APAC Infectious Enteritis Treatment Market Production, Supply and Demand Analysis
- 5.1 Demand Trend and Consumption Analysis, 2018-2025
- 5.2 Demand Forecast, 2025-2035
- 5.3 Production and Output Trend, 2018-2025
- 5.4 Production and Output Forecast, 2025-2035
- 5.5 Installed Capacity and Capacity Utilization
- 5.6 Company-Wise Production Plants and Statistics
- 5.6.1 Installed Production Capacity
- 5.6.2 Actual Production
- 5.6.3 Planned Capacity and Expansion Targets
- 5.7 Supply Chain Structure and Procurement Trends
- 5.8 Supply-Demand Gap and Bottlenecks
- 5.9 Import Dependence and Sourcing Structure
- 5.10 Contract Manufacturing and Outsourcing
- 5.11 Regional Supply and Demand Concentration
Chapter 6 APAC Infectious Enteritis Treatment Market Pricing Analysis
- 6.1 Pricing Structure and Measurement
- 6.2 Historical Pricing Trends, 2018-2025
- 6.3 Pricing Outlook, 2025-2035
- 6.4 Average Selling Price and Unit Economics
- 6.5 Pricing by Product and Market Segment
- 6.6 Geographic Pricing Differences
- 6.7 Key Input, Energy, Labor and Logistics Costs
- 6.8 Contract Pricing and Purchasing Models
- 6.9 Pricing Sensitivity and Competitive Positioning
- 6.10 Price, Margin and Profitability Implications
Chapter 7 APAC Infectious Enteritis Treatment Market Dynamics
- 7.1 Market Growth Drivers
- 7.1.1 Demand-Side Drivers
- 7.1.2 Technology and Innovation Drivers
- 7.1.3 Infrastructure and Investment Drivers
- 7.1.4 Regulatory and Policy Drivers
- 7.2 Market Restraints
- 7.2.1 Cost and Affordability Constraints
- 7.2.2 Technology and Adoption Barriers
- 7.2.3 Supply Chain and Operational Constraints
- 7.3 Market Challenges
- 7.3.1 Competitive Pressure and Margin Erosion
- 7.3.2 Skills, Infrastructure and Implementation Gaps
- 7.4 Emerging Market Opportunities
- 7.5 Market Dynamics Impact and Time-Horizon Assessment
Chapter 8 APAC Infectious Enteritis Treatment Value Chain Analysis
- 8.1 Industry Value Chain Overview
- 8.2 Upstream Suppliers and Critical Inputs
- 8.3 Technology and Component Providers
- 8.4 Manufacturing or Service Delivery
- 8.5 Distribution, Channel Partners and Integrators
- 8.6 Downstream Applications and End Users
- 8.7 Value Addition and Profit Pools
- 8.8 Vertical Integration and Outsourcing
- 8.9 Supplier Concentration and Risk
- 8.10 Supply Chain Localization and Resilience
Chapter 9 APAC Infectious Enteritis Treatment Market Regulations and Policies
- 9.1 Relevant Laws, Standards and Compliance Frameworks
- 9.2 Product, Service, Safety and Quality Requirements
- 9.3 Government Policies, Incentives and Subsidies
- 9.4 Imports, Exports and Trade Barriers
- 9.5 Public Procurement and Local Content Requirements
- 9.6 Environmental and Sustainability Compliance
- 9.7 Upcoming Policy Changes and Market Implications
Chapter 10 APAC Infectious Enteritis Treatment Market Hotspots and Opportunities
- 10.1 Market Opportunity Mapping and Growth Hotspots
- 10.2 High-Growth Applications and Customer Groups
- 10.3 Underserved Markets and White-Space Opportunities
- 10.4 Emerging Technology and Product Opportunities
- 10.5 New Capacity and Investment Hotspots
- 10.6 Market Entry and Expansion Opportunities
- 10.7 Distribution and Partnership Opportunities
- 10.8 Near-Term and Long-Term Commercial Potential
- 10.9 Opportunity Attractiveness and Execution Risks
Chapter 11 APAC Infectious Enteritis Treatment Market Outlook, 2025-2035
- 11.1 Market Size and Analysis
- 11.1.1 Revenue (Market Measurement: 2025: USD 119.5 million → 2035: USD 275.1 million)
- 11.1.2 Market Volume and Quantity Sold
- 11.1.3 Historical Market Size, 2018-2025
- 11.1.4 Base-Year Market Size, 2025
- 11.2 Market Forecast, 2025-2035
- 11.2.1 Revenue Forecast to 2035
- 11.2.2 Volume Forecast to 2035
- 11.2.3 CAGR and Year-on-Year Growth
- 11.2.4 Incremental Revenue Opportunity
- 11.3 Forecast Assumptions and Scenario Analysis
- 11.3.1 Base-Case Forecast
- 11.3.2 Optimistic and Conservative Scenarios
- 11.3.3 Technology, Pricing and Policy Sensitivities
- 11.4 Market Attractiveness and Growth Outlook
Chapter 12 APAC Infectious Enteritis Treatment Market Segmentation and Outlook
- 12.1 Segmentation Summary and Market Shares, 2025
- 12.2 Largest and Fastest-Growing Segments
- 12.3 By Product Type - Market Size and Forecast, 2025-2035
- 12.3.1 Segment Definition and Scope
- 12.3.2 Historical Market Size, 2018-2025
- 12.3.3 Revenue Forecast, 2025-2035
- 12.3.4 Volume Forecast, 2025-2035
- 12.3.5 Base-Year Market Share, 2025
- 12.3.6 Segment CAGR and Growth Drivers
- 12.3.7 Subsegment Market Size and Forecast
- 12.3.7.1 Antibiotics
- 12.3.7.2 Oral Rehydration Products
- 12.3.7.3 Probiotics and Microbiome Therapeutics
- 12.3.7.4 Antiparasitic and Adjunctive Products
- 12.3.8 Subsegment Pricing and Adoption Trends
- 12.3.9 Leading Suppliers and Competition
- 12.3.10 Regional Demand and Opportunities
- 12.4 By Disease Area - Market Size and Forecast, 2025-2035
- 12.4.1 Segment Definition and Scope
- 12.4.2 Historical Market Size, 2018-2025
- 12.4.3 Revenue Forecast, 2025-2035
- 12.4.4 Volume Forecast, 2025-2035
- 12.4.5 Base-Year Market Share, 2025
- 12.4.6 Segment CAGR and Growth Drivers
- 12.4.7 Subsegment Market Size and Forecast
- 12.4.7.1 Bacterial Enteritis
- 12.4.7.2 Viral Enteritis
- 12.4.7.3 Parasitic Enteritis
- 12.4.7.4 Mixed or Undetermined Infectious Enteritis
- 12.4.8 Subsegment Pricing and Adoption Trends
- 12.4.9 Leading Suppliers and Competition
- 12.4.10 Regional Demand and Opportunities
- 12.5 By End User - Market Size and Forecast, 2025-2035
- 12.5.1 Segment Definition and Scope
- 12.5.2 Historical Market Size, 2018-2025
- 12.5.3 Revenue Forecast, 2025-2035
- 12.5.4 Volume Forecast, 2025-2035
- 12.5.5 Base-Year Market Share, 2025
- 12.5.6 Segment CAGR and Growth Drivers
- 12.5.7 Subsegment Market Size and Forecast
- 12.5.7.1 Pediatric Patients
- 12.5.7.2 Adult Patients
- 12.5.7.3 Geriatric Patients
- 12.5.8 Subsegment Pricing and Adoption Trends
- 12.5.9 Leading Suppliers and Competition
- 12.5.10 Regional Demand and Opportunities
- 12.6 By Subregion - Market Size and Forecast, 2025-2035
- 12.6.1 Segment Definition and Scope
- 12.6.2 Historical Market Size, 2018-2025
- 12.6.3 Revenue Forecast, 2025-2035
- 12.6.4 Volume Forecast, 2025-2035
- 12.6.5 Base-Year Market Share, 2025
- 12.6.6 Segment CAGR and Growth Drivers
- 12.6.7 Subsegment Market Size and Forecast
- 12.6.7.1 East Asia
- 12.6.7.2 South Asia
- 12.6.7.3 Southeast Asia
- 12.6.7.4 Oceania
- 12.6.8 Subsegment Pricing and Adoption Trends
- 12.6.9 Leading Suppliers and Competition
- 12.6.10 Regional Demand and Opportunities
- 12.7 Segment Growth Comparison
- 12.8 Segment Attractiveness and Priority Matrix
Chapter 13 APAC Infectious Enteritis Treatment End-Use and Application Market Outlook
- 13.1 End-Use Industry and Customer Demand Structure
- 13.2 Leading Applications and Customer Groups
- 13.3 End-Use Market Size, Share and Forecast
- 13.4 Major End-Use Industry Deep Dives
- 13.4.1 Customer Requirements and Use Cases
- 13.4.2 Demand and Replacement Cycles
- 13.4.3 Technical and Regulatory Considerations
- 13.4.4 Purchasing and Procurement Models
- 13.4.5 Leading Vendors and Distribution Channels
- 13.4.6 Forecast and Commercial Opportunities
- 13.5 Emerging Applications and Cross-Segment Demand
- 13.6 End-Use Industry Investment Priorities
Chapter 14 APAC Infectious Enteritis Treatment Geographic Market Outlook, 2025-2035
- 14.1 Regional Market Size and Country-Level Shares, 2025
- 14.2 Country Market Size Comparison, 2025
- 14.3 Country Market Forecasts, 2025-2035
- 14.4 Subregional Industrial and Demand Clusters
- 14.5 Intra-Regional Pricing and Cost Differences
- 14.6 Cross-Border Trade and Supply Networks
- 14.7 Regional Supply and Demand Balances
- 14.8 Country Opportunity Comparison and Prioritization
Note: Every listed country is covered on the structure shown under the first country.
Chapter 15 APAC Infectious Enteritis Treatment Technology, Innovation and Sustainability Outlook
- 15.1 Technology Landscape and Maturity
- 15.2 Product, Process and Service Innovation
- 15.3 AI, Automation and Digital Tools in the Industry
- 15.4 Technology Adoption and Performance Benchmarking
- 15.5 Innovation Pipeline and R&D Investment
- 15.6 Patent and Intellectual Property Trends
- 15.7 Energy Efficiency and Resource Management
- 15.8 Sustainability, Recycling and Circularity
- 15.9 Technology Roadmap, 2025-2035
- 15.10 Risks of Obsolescence and Technology Substitution
Chapter 16 APAC Infectious Enteritis Treatment Market Key Strategic Imperatives
- 16.1 Growth and Market Entry Priorities
- 16.2 High-Return Products and Segments
- 16.3 Pricing, Profitability and Cost Optimization
- 16.4 Technology Investment and Product Differentiation
- 16.5 Supply Chain Localization and Resilience
- 16.6 Distribution and Customer Acquisition
- 16.7 Partnership, Acquisition and Capacity Strategy
- 16.8 Regional Expansion Priorities
- 16.9 Short-, Medium- and Long-Term Actions
Chapter 17 Competition Outlook
- 17.1 Industry Competition Characteristics
- 17.2 Market Structure and Concentration
- 17.3 Market Share and Competitive Positioning, 2025
- 17.4 Company-Wise Revenue and Product Benchmarking
- 17.5 Production and Service Capacity Benchmarking
- 17.6 Technology, Pricing and Differentiation
- 17.7 Regional Footprint and Distribution Strength
- 17.8 Mergers, Acquisitions and Strategic Alliances
- 17.9 New Entrants and Competitive Threats
- 17.10 Porter's Five Forces and Industry Attractiveness
- 17.11 Competitive Outlook, 2025-2035
Chapter 18 Company Profiles
- 18.1 Company Coverage and Selection Criteria
- 18.2 Cipla
- 18.2.1 Business Description
- 18.2.2 Company Ownership and Geographic Presence
- 18.2.3 Product and Service Portfolio
- 18.2.4 Manufacturing and Operating Footprint
- 18.2.5 Production Capacity and Expansion Plans
- 18.2.6 Financial Performance and Investment
- 18.2.7 Market Share and Competitive Position
- 18.2.8 Technology and Innovation Capabilities
- 18.2.9 Strategic Alliances or Partnerships
- 18.2.10 Recent Developments
- 18.2.11 Growth Strategy and Outlook
- 18.3 Sun Pharmaceutical Industries
- 18.4 Glenmark Pharmaceuticals
- 18.5 AdvaCare Pharma
- 18.6 Biocodex
- 18.7 Opella
- 18.8 Mayoly
- 18.9 Dr. Reddy's Laboratories
- 18.10 Aristopharma
- 18.11 BiomeBank
- 18.12 Other Relevant Market Participants
Note: Every listed company is profiled on the structure shown under the first company. The company list is preliminary and may change based on research findings, market developments, data availability and client requirements.
Chapter 19 Disclaimer
- 19.1 Research and Forecast Disclaimer
- 19.2 Data Source and Estimation Limitations
Note: The depth of individual sections depends on data availability for this market. Volume, capacity, trade and other unit-based metrics are included where applicable.

