
Funded PRRT and rising diagnoses lift NEN treatment value
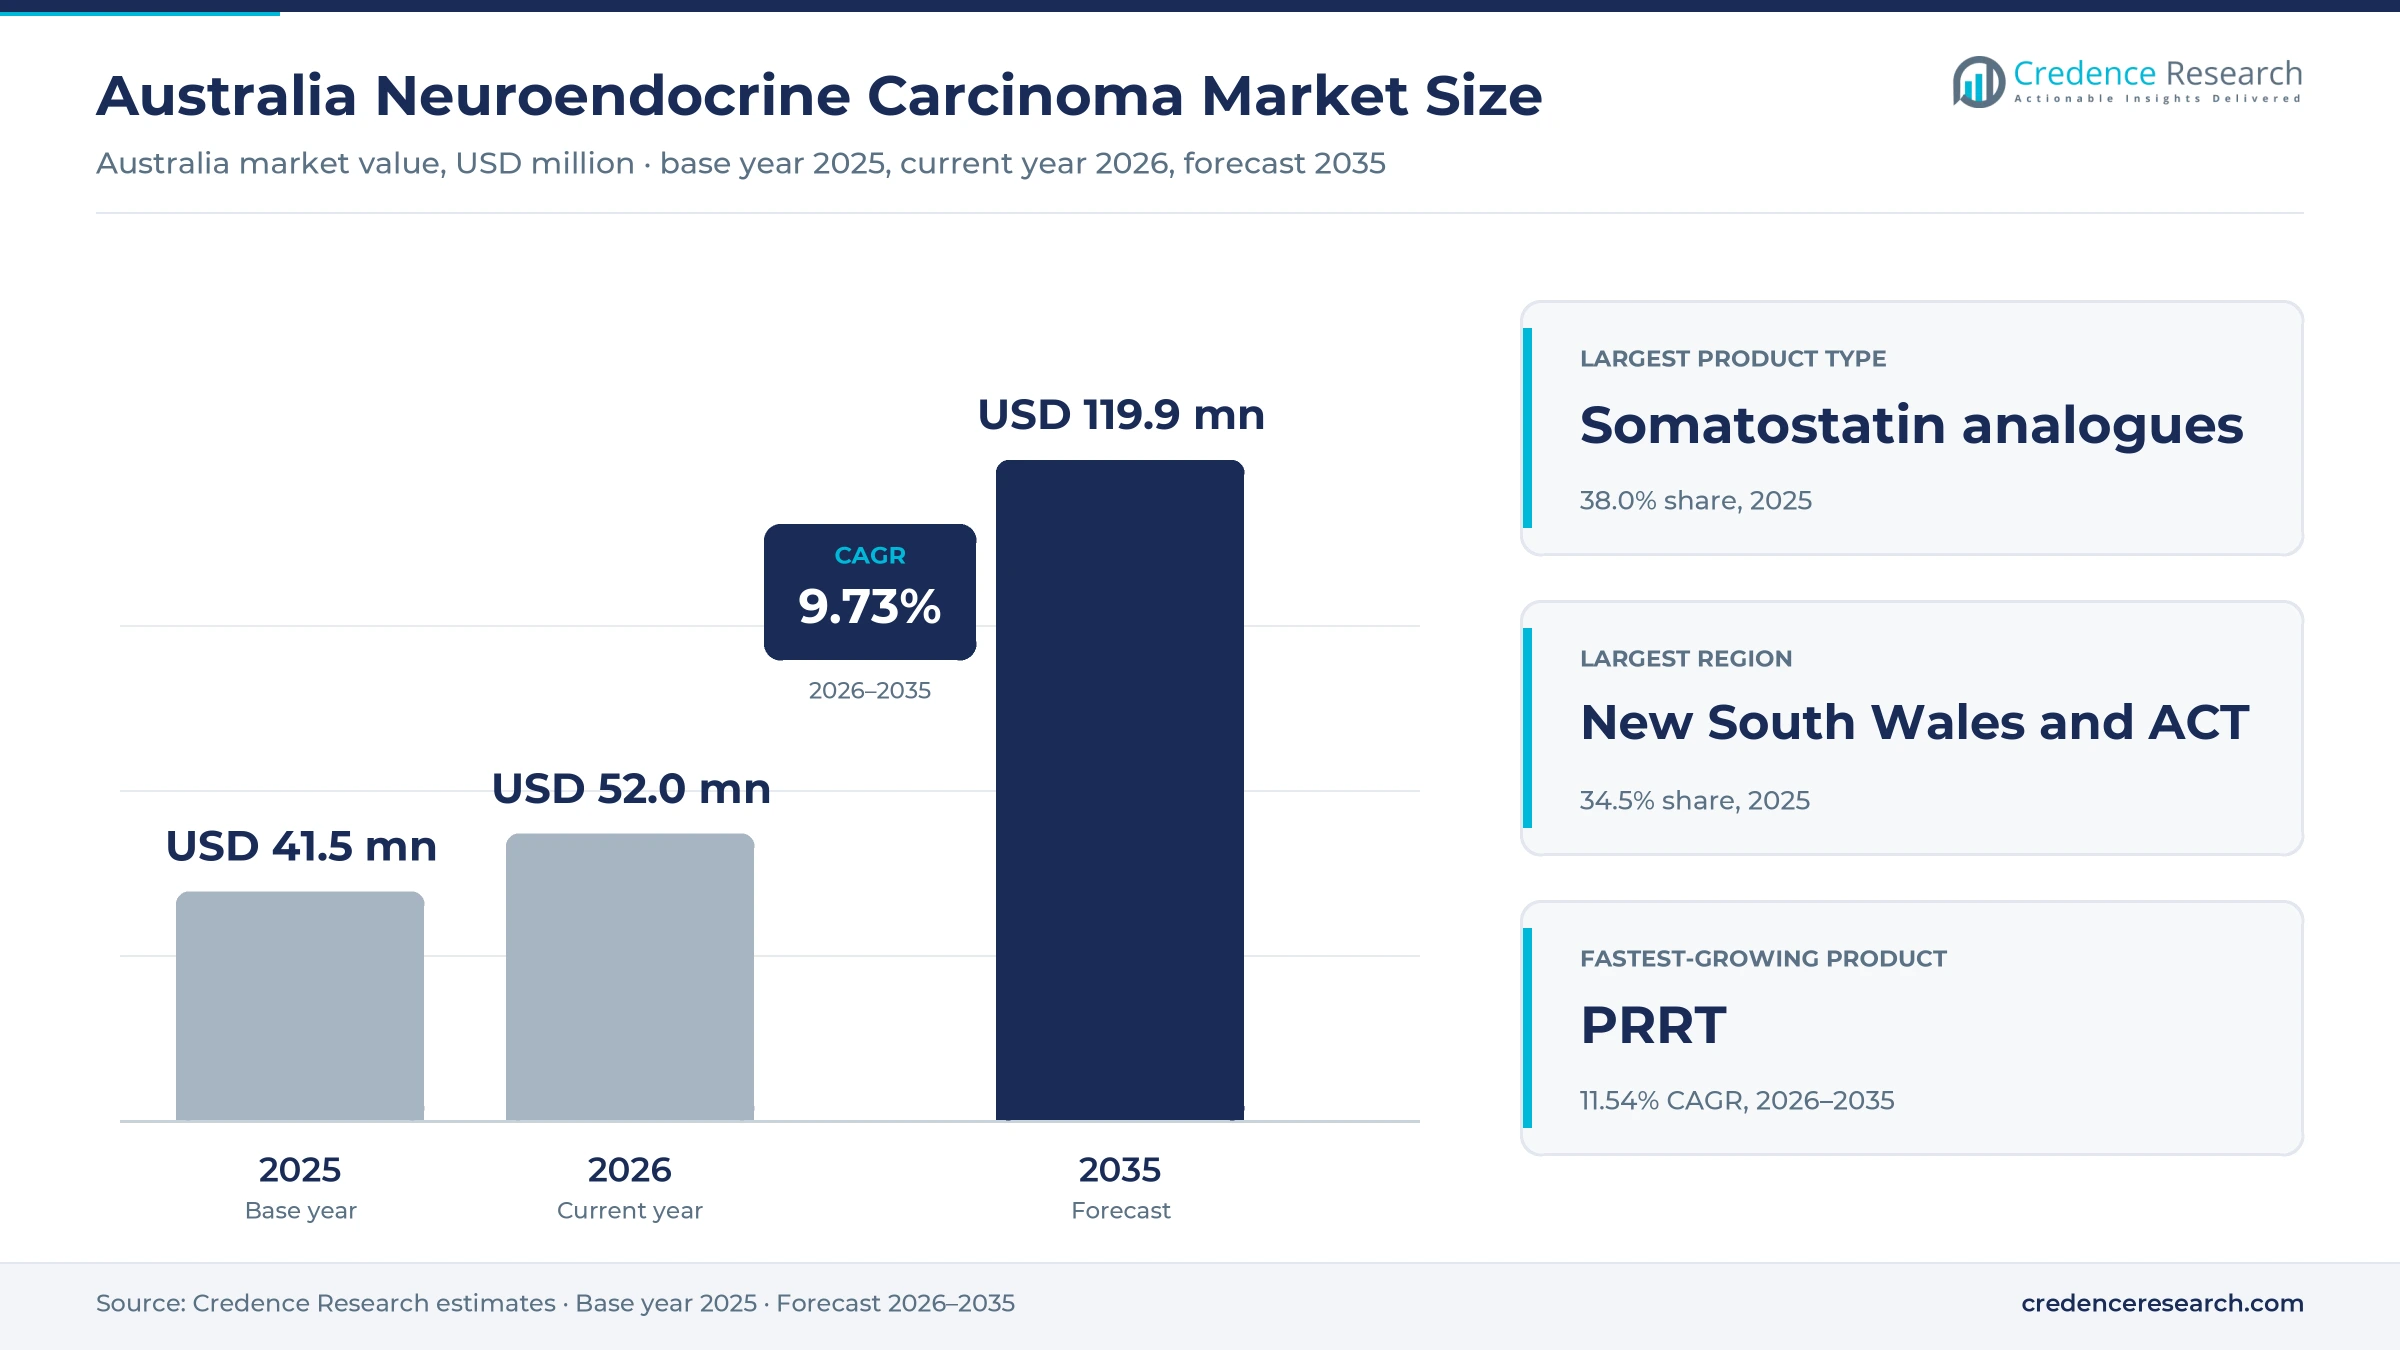
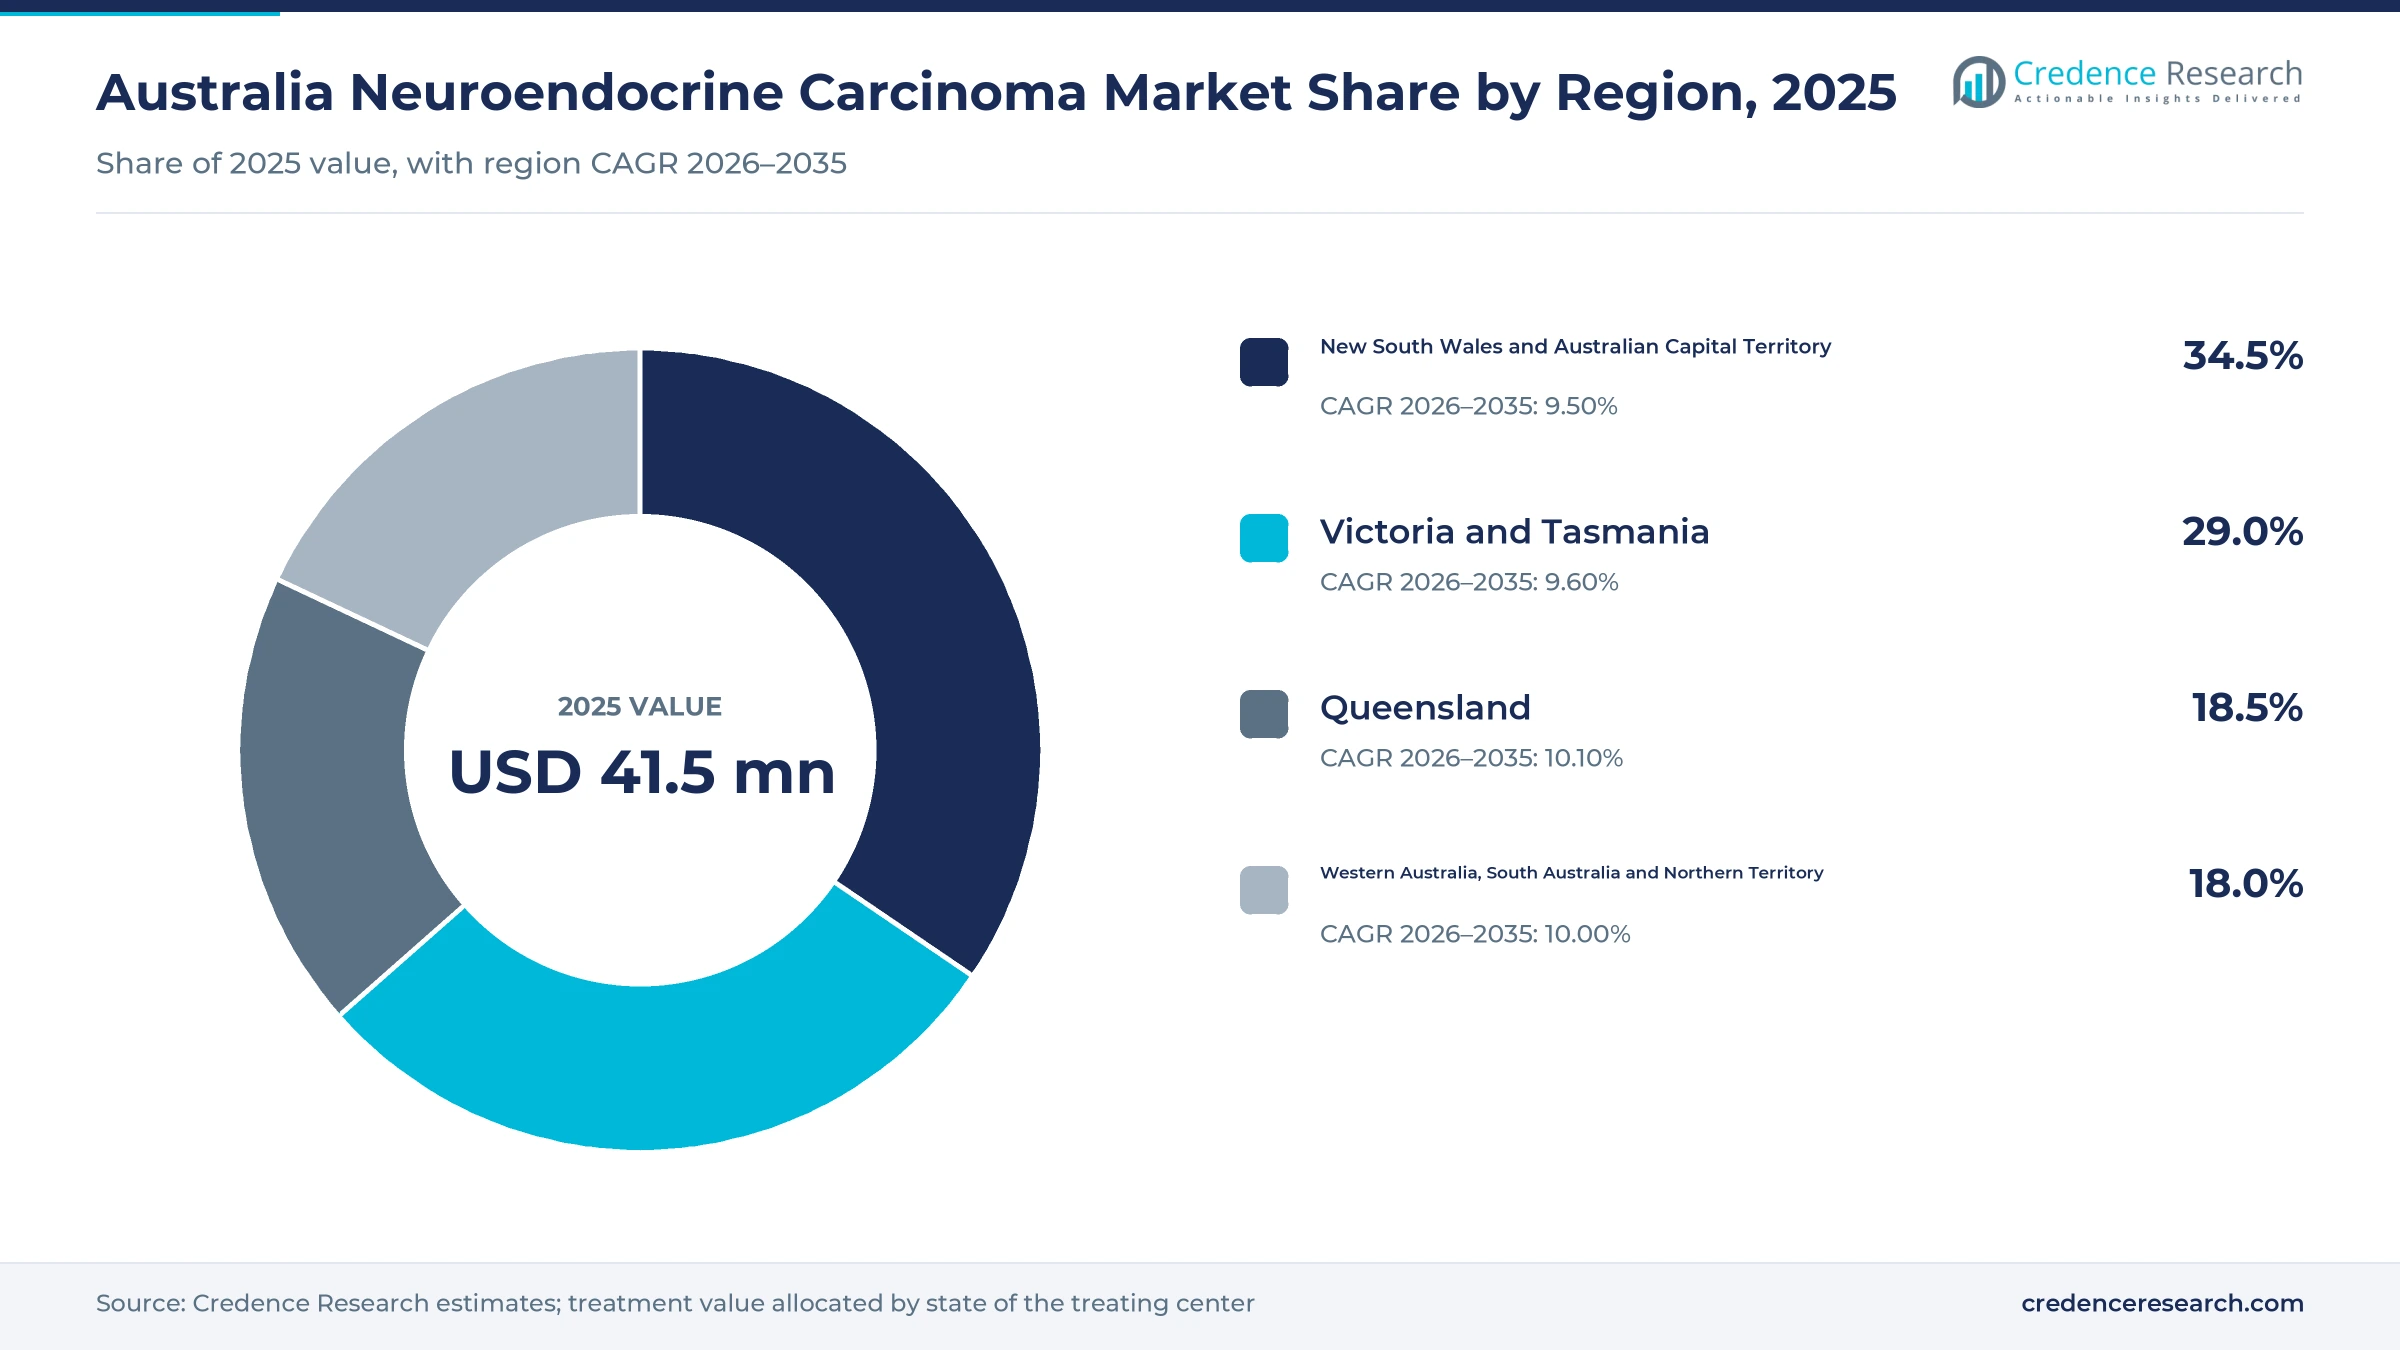
The Australia neuroendocrine carcinoma market was valued at USD 41.5 million in 2025 and is projected to increase from USD 52.0 million in 2026 to USD 119.9 million by 2035, registering a CAGR of 9.73% during 2026–2035. Demand comes from a growing number of Australians diagnosed with gastrointestinal, pancreatic and lung neuroendocrine neoplasms, specialist teams that prescribe long-acting somatostatin analogues, and nuclear medicine centers that deliver peptide receptor radionuclide therapy. New South Wales and the Australian Capital Territory held the largest regional share, 34.5% in 2025, because Sydney hosts designated public treatment services and large private imaging groups. Queensland is the fastest-growing region at 10.10% a year, as population growth adds older patients. In turn, a new Medicare item for lutetium-177 DOTA treatment took effect on Nov. 1, 2025, which lowers out-of-pocket costs for eligible patients in public and private settings.
Which neuroendocrine cancer treatments does the estimate cover?
The estimate measures the value of medicines, radionuclide therapy and diagnostic services used to manage neuroendocrine neoplasms in Australia, including well-differentiated tumors and poorly differentiated carcinomas. It covers somatostatin analogues, peptide receptor radionuclide therapy, targeted therapies, cytotoxic chemotherapy and diagnostic services such as somatostatin receptor PET imaging. Values include treatment paid by public budgets, private institutions and self-paying patients.
The estimate excludes surgery fees, general hospital bed costs, palliative care services and supportive medicines that are not specific to neuroendocrine disease. The value chain runs from drug sponsors, isotope producers and compounding facilities through hospital pharmacies and specialty distributors to multidisciplinary teams, nuclear medicine departments and imaging groups that diagnose and treat patients.
Australia Neuroendocrine Carcinoma Market Insights
- The Australia neuroendocrine carcinoma market was valued at USD 41.5 million in 2025 and is projected to reach USD 119.9 million by 2035, registering a CAGR of 9.73% during 2026–2035.
- New South Wales and the Australian Capital Territory held a 34.5% share of 2025 value, because Sydney hosts designated public lutetium therapy services.
- Somatostatin analogues led with a 38.0% share of 2025 value, because most patients with well-differentiated tumors receive long-acting injections for years.
- Medicare items for lutetium-177 DOTA treatment and gallium-68 DOTA PET imaging took effect on Nov. 1, 2025, funding each therapy cycle.
- The TGA approved Novartis's Lutathera on Nov. 14, 2025, giving Australia its first registered lutetium therapy for gastroenteropancreatic tumors.
Somatostatin analogues lead while PRRT grows fastest
Why do somatostatin analogues lead product demand?
Based on product type, the market is categorized into somatostatin analogues, PRRT, targeted therapies, cytotoxic chemotherapy and diagnostic services. Somatostatin analogues led with a 38.0% share of 2025 value, because most patients with well-differentiated disease receive monthly long-acting injections for many years. PRRT grows fastest at 11.54% a year, as Medicare funding and a registered product widen access to radionuclide therapy.
How do tumor sites split treatment value?
Based on disease area, the market is categorized into gastrointestinal NENs, pancreatic NENs, thoracic NENs and extra-gastrointestinal non-thoracic NENs. Gastrointestinal NENs led with a 44.0% share of 2025 value, because small bowel, appendix and rectal tumors make up the largest patient group. Pancreatic NENs grow fastest at 10.14% a year, as pancreatic patients use more targeted therapy and lutetium treatment.
Why does outpatient specialist care hold most value?
Based on care setting, the market is categorized into inpatient treatment, outpatient specialist care and community treatment. Outpatient specialist care led with a 55.0% share of 2025 value, because injections, imaging and most lutetium cycles are delivered in day units and clinics. Community treatment grows fastest at 10.22% a year, as community pharmacies can now start long-acting lanreotide treatment.
How do public and private purchasers fund treatment?
Based on customer type, the market is categorized into public purchasers, private institutional purchasers and self-paying patients. Public purchasers led with a 62.0% share of 2025 value, because PBS, Medicare and state hospital budgets pay for most medicines and therapy. Private institutional purchasers grow fastest at 9.93% a year, as private nuclear medicine groups bill the new Medicare items.
| Segment Group | Leading Sub-segment | Share, 2025 | Fastest-growing Sub-segment | CAGR, 2026–2035 |
|---|---|---|---|---|
| By Product Type | Somatostatin analogues | 38.0% | PRRT | 11.54% |
| By Disease Area | Gastrointestinal NENs | 44.0% | Pancreatic NENs | 10.14% |
| By Care Setting | Outpatient specialist care | 55.0% | Community treatment | 10.22% |
| By Customer Type | Public purchasers | 62.0% | Private institutional purchasers | 9.93% |
Request a Free Sample
Fill in your details and we'll send you a free sample report.
- Sample data tables & charts
- Research methodology
Medicare PRRT funding and new registrations drive demand
How does funded PRRT access widen treatment?
Funded PRRT access widens treatment, because patients no longer depend on state budgets or charity support to receive lutetium therapy. A new Medicare item 16060 for one lutetium-177 DOTA treatment cycle took effect on Nov. 1, 2025, with a fee of $9,999.95, according to the Medicare factsheet. The benefit reaches $9,895.45 at the 85% rate, which covers most of the listed fee. The item is not limited to a single product type, so compounded and registered doses both qualify. As a result, PRRT grows at 11.54% a year, the fastest product rate, as private and public nuclear medicine centers add treatment slots for eligible patients.
Why does an expanding diagnosed patient base lift demand?
An expanding diagnosed patient base lifts demand, because more Australians receive a neuroendocrine diagnosis each year and many live with the disease for a long time. Cancer Australia estimated 5,437 new cases in 2022, up from 4,508 in 2018, according to national cancer statistics. The age-standardized rate rose to 17 per 100,000 people from 9.0 in 1982. Five-year relative survival also reached 51% for 2014 to 2018, compared with 22% for 1989 to 1993, which shows how treatment now extends over many years. In turn, gastrointestinal NENs hold a 44.0% share of 2025 value, as long-term patients need repeat imaging and years of maintenance therapy.
How does registered radiopharmaceutical availability help?
Registered radiopharmaceutical availability helps demand, because hospitals can now choose a product reviewed by the national regulator. The TGA approved Lutathera from Novartis Pharmaceuticals Australia on Nov. 14, 2025, and entered it on the ARTG on Nov. 17, 2025, according to the public assessment report. The approved indication covers somatostatin receptor-positive gastroenteropancreatic tumors in adults. The regulator had accepted the application for evaluation in September 2024, after Novartis lodged a new medicine submission. Registration gives hospitals and private centers a product with a public quality and safety review. As a result, private institutional purchasers grow at 9.93% a year, as private centers add registered lutetium doses alongside wider radiopharmaceutical supply.
Why does community access to lanreotide sustain volumes?
Community access to lanreotide sustains volumes, because patients in regional areas can start treatment closer to home. The PBS listing that allows community access initiation of Somatuline Autogel took effect on Nov. 1, 2024, according to the PBS listing record. The advisory committee said the change would improve access for patients in rural and remote areas. Its review counted between 500 and 5,000 lanreotide patients a year in 2022 and 2023, with estimated market growth of 8% a year, which points to steady new patient starts. In turn, somatostatin analogues hold a 38.0% share of 2025 value, as long-acting somatostatin analog injections remain first-line care.
Imaging-led care and local isotope supply reshape treatment
How is the shift to imaging-led care changing treatment?
The shift to imaging-led care is changing treatment, because doctors now select therapy from receptor PET scans rather than from symptoms alone. Medicare item 61530 for a whole-body gallium-68 DOTA PET scan carries a fee of $953.00 from Nov. 1, 2025. The scan stages disease, confirms receptor expression before therapy, tracks response and checks suspected recurrence. Eligibility for lutetium treatment also requires review by a formal multidisciplinary board with at least one oncologist and one surgeon. As a result, diagnostic services keep a steady share of value, as each therapy course needs repeat cancer imaging before and after treatment.
Why is the rise of local isotope production important?
The rise of local isotope production is important, because lutetium doses decay quickly and need short supply chains. ANSTO and Cyclotek announced Applied Molecular Therapies in November 2021 to build what they described as Australia's first GMP theranostics facility, starting in Melbourne. The venture planned to make therapeutic radiopharmaceuticals, initially focused on non-carrier-added lutetium-177. In addition, the new Medicare item covers more than one Lu-DOTA product type, which keeps local compounding viable. The TGA also entered Lutathera on the ARTG on Nov. 17, 2025, adding a registered imported option. In turn, outpatient specialist care holds a 55.0% share of 2025 value, as reliable local doses let centers schedule lutetium cycles as day treatment.
Can regional and remote patient access open new growth?
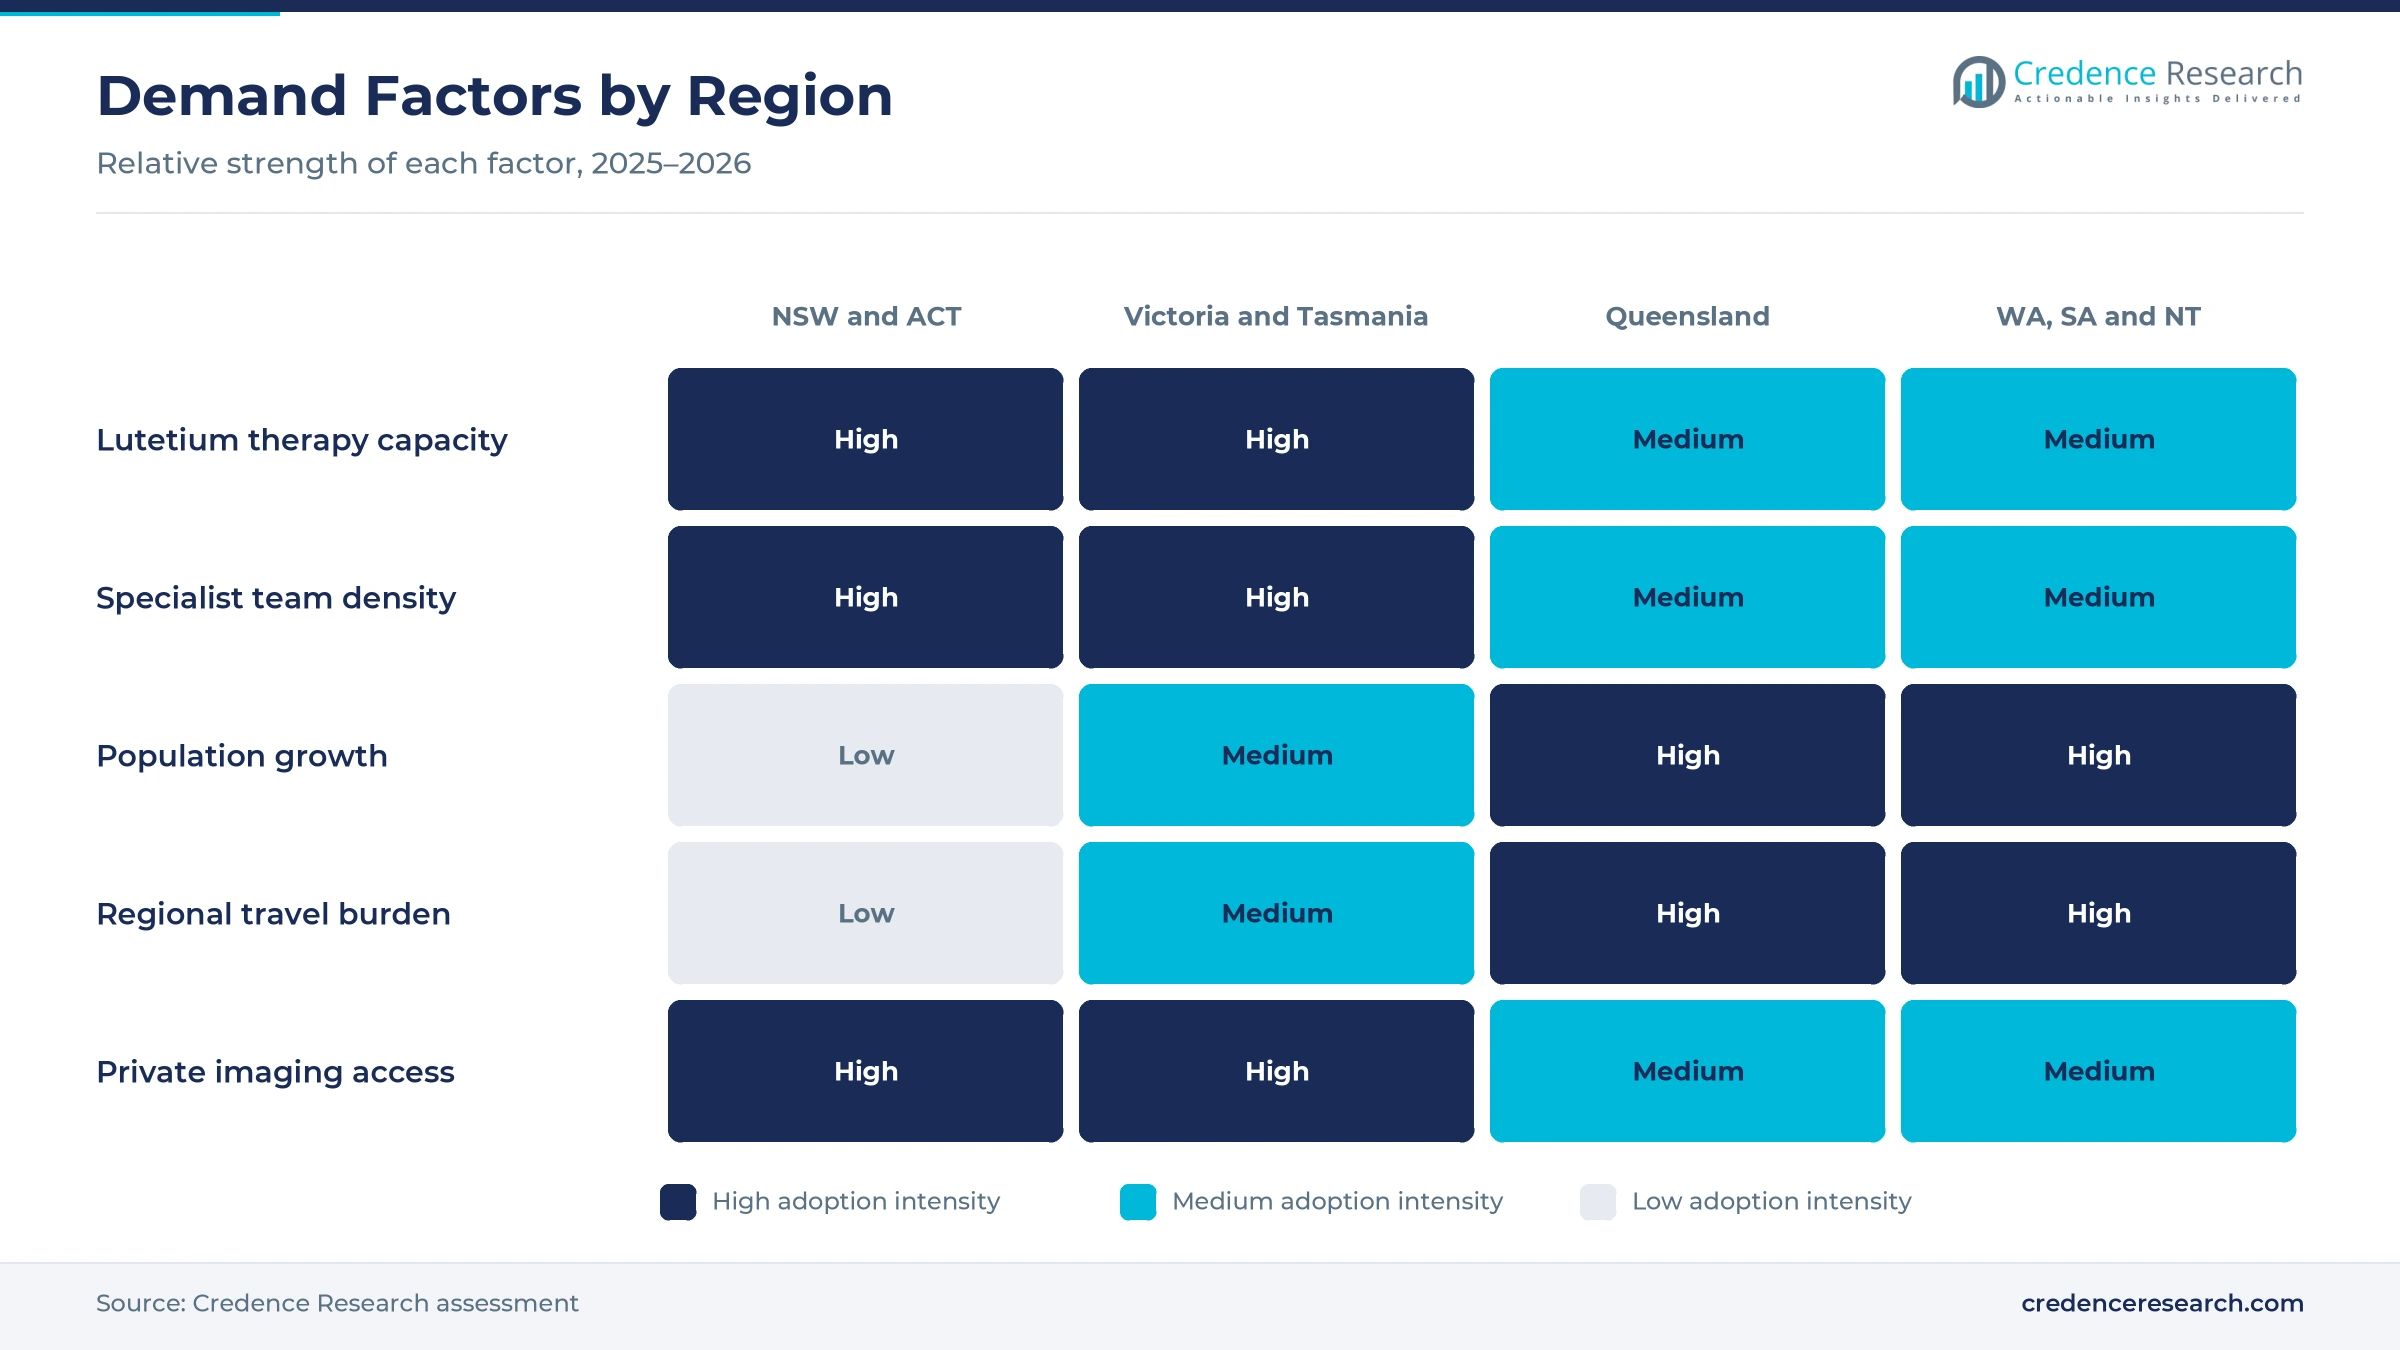
Regional and remote patient access offers a growth path, because many patients still travel long distances for therapy. The Queen Elizabeth Hospital in Adelaide is the only center in South Australia or the Northern Territory that delivers lutetium therapy. Its service has given 1,000 doses to 229 patients since April 2011, and one in four patients travels from regional or remote areas. The PBS change for lanreotide also targets rural and remote patients. As a result, community treatment grows at 10.22% a year, the fastest care setting rate, as more care moves closer to where patients live.
Is there room to grow care for long-term survivors?
Care for long-term survivors has room to grow, because better survival means more patients need years of monitoring and repeat therapy. About 24,285 people diagnosed between 1982 and 2017 were still alive at the end of 2017. Central Adelaide health services also report that more than 29,000 Australians now live with neuroendocrine cancer. Lifetime risk to age 85 reached 1 in 55 in the 2022 estimate, which keeps the patient pool growing. In turn, pancreatic NENs grow at 10.14% a year, the fastest disease area rate, as survivors cycle through targeted therapy, lutetium treatment and other cancer drugs.
Cycle costs, few centers and generics test suppliers
How do high cycle costs limit uptake?
High cycle costs limit uptake, because each lutetium cycle carries a fee close to $10,000 and patients often need several cycles. Claims of $10,000 or more must be lodged on paper or in person rather than online. As a result, some patients face upfront payments before the Medicare benefit arrives. Providers respond with bulk billing for eligible patients, clear cost quotes before each cycle and staff who help patients complete paper claims. Hospital social workers also link patients with charity and travel funds that cover gaps.
Why do few treatment centers slow access?
Few treatment centers slow access, because lutetium therapy needs shielded rooms, trained staff and licensed isotope handling. New South Wales has only two designated public services, at Royal North Shore Hospital and St George Hospital. In turn, patients in outer suburbs and regional towns travel for each cycle. Health services respond with travel support, patient accommodation near hospitals and new private nuclear medicine sites. Each new site needs isotope supply contracts, radiation licenses and trained nuclear medicine physicians before it can open.
How does generic competition pressure analog prices?
Generic competition pressures analog prices, because the first generic lanreotide, Mytolac, was listed on the PBS on Aug. 1, 2023. Price cuts that follow generic entry reduce value per injection for originator brands. As a result, somatostatin analogue value grows more slowly than patient numbers. Sponsors respond with device improvements, patient support programs and community access listings that widen use. Generic suppliers, in turn, compete on price and supply reliability for hospital and community pharmacy contracts.
Why does late diagnosis complicate treatment?
Late diagnosis complicates treatment, because neuroendocrine tumors often grow slowly and cause vague symptoms for years. Some patients are diagnosed only after the disease has spread to the liver or other organs. In turn, treatment costs rise and fewer patients can have curative surgery. Specialist groups respond with awareness campaigns, nurse support lines and faster referral pathways to multidisciplinary teams. Wider use of receptor PET imaging also helps doctors confirm the diagnosis and stage the disease earlier.
New South Wales leads while Queensland grows fastest
| Region | Value, 2025 (USD million) | Share, 2025 | CAGR, 2026–2035 |
|---|---|---|---|
| New South Wales and Australian Capital Territory | 14.3 | 34.5% | 9.50% |
| Victoria and Tasmania | 12.0 | 29.0% | 9.60% |
| Queensland | 7.7 | 18.5% | 10.10% |
| Western Australia, South Australia and Northern Territory | 7.5 | 18.0% | 10.00% |
Why do New South Wales and the ACT hold the largest share?
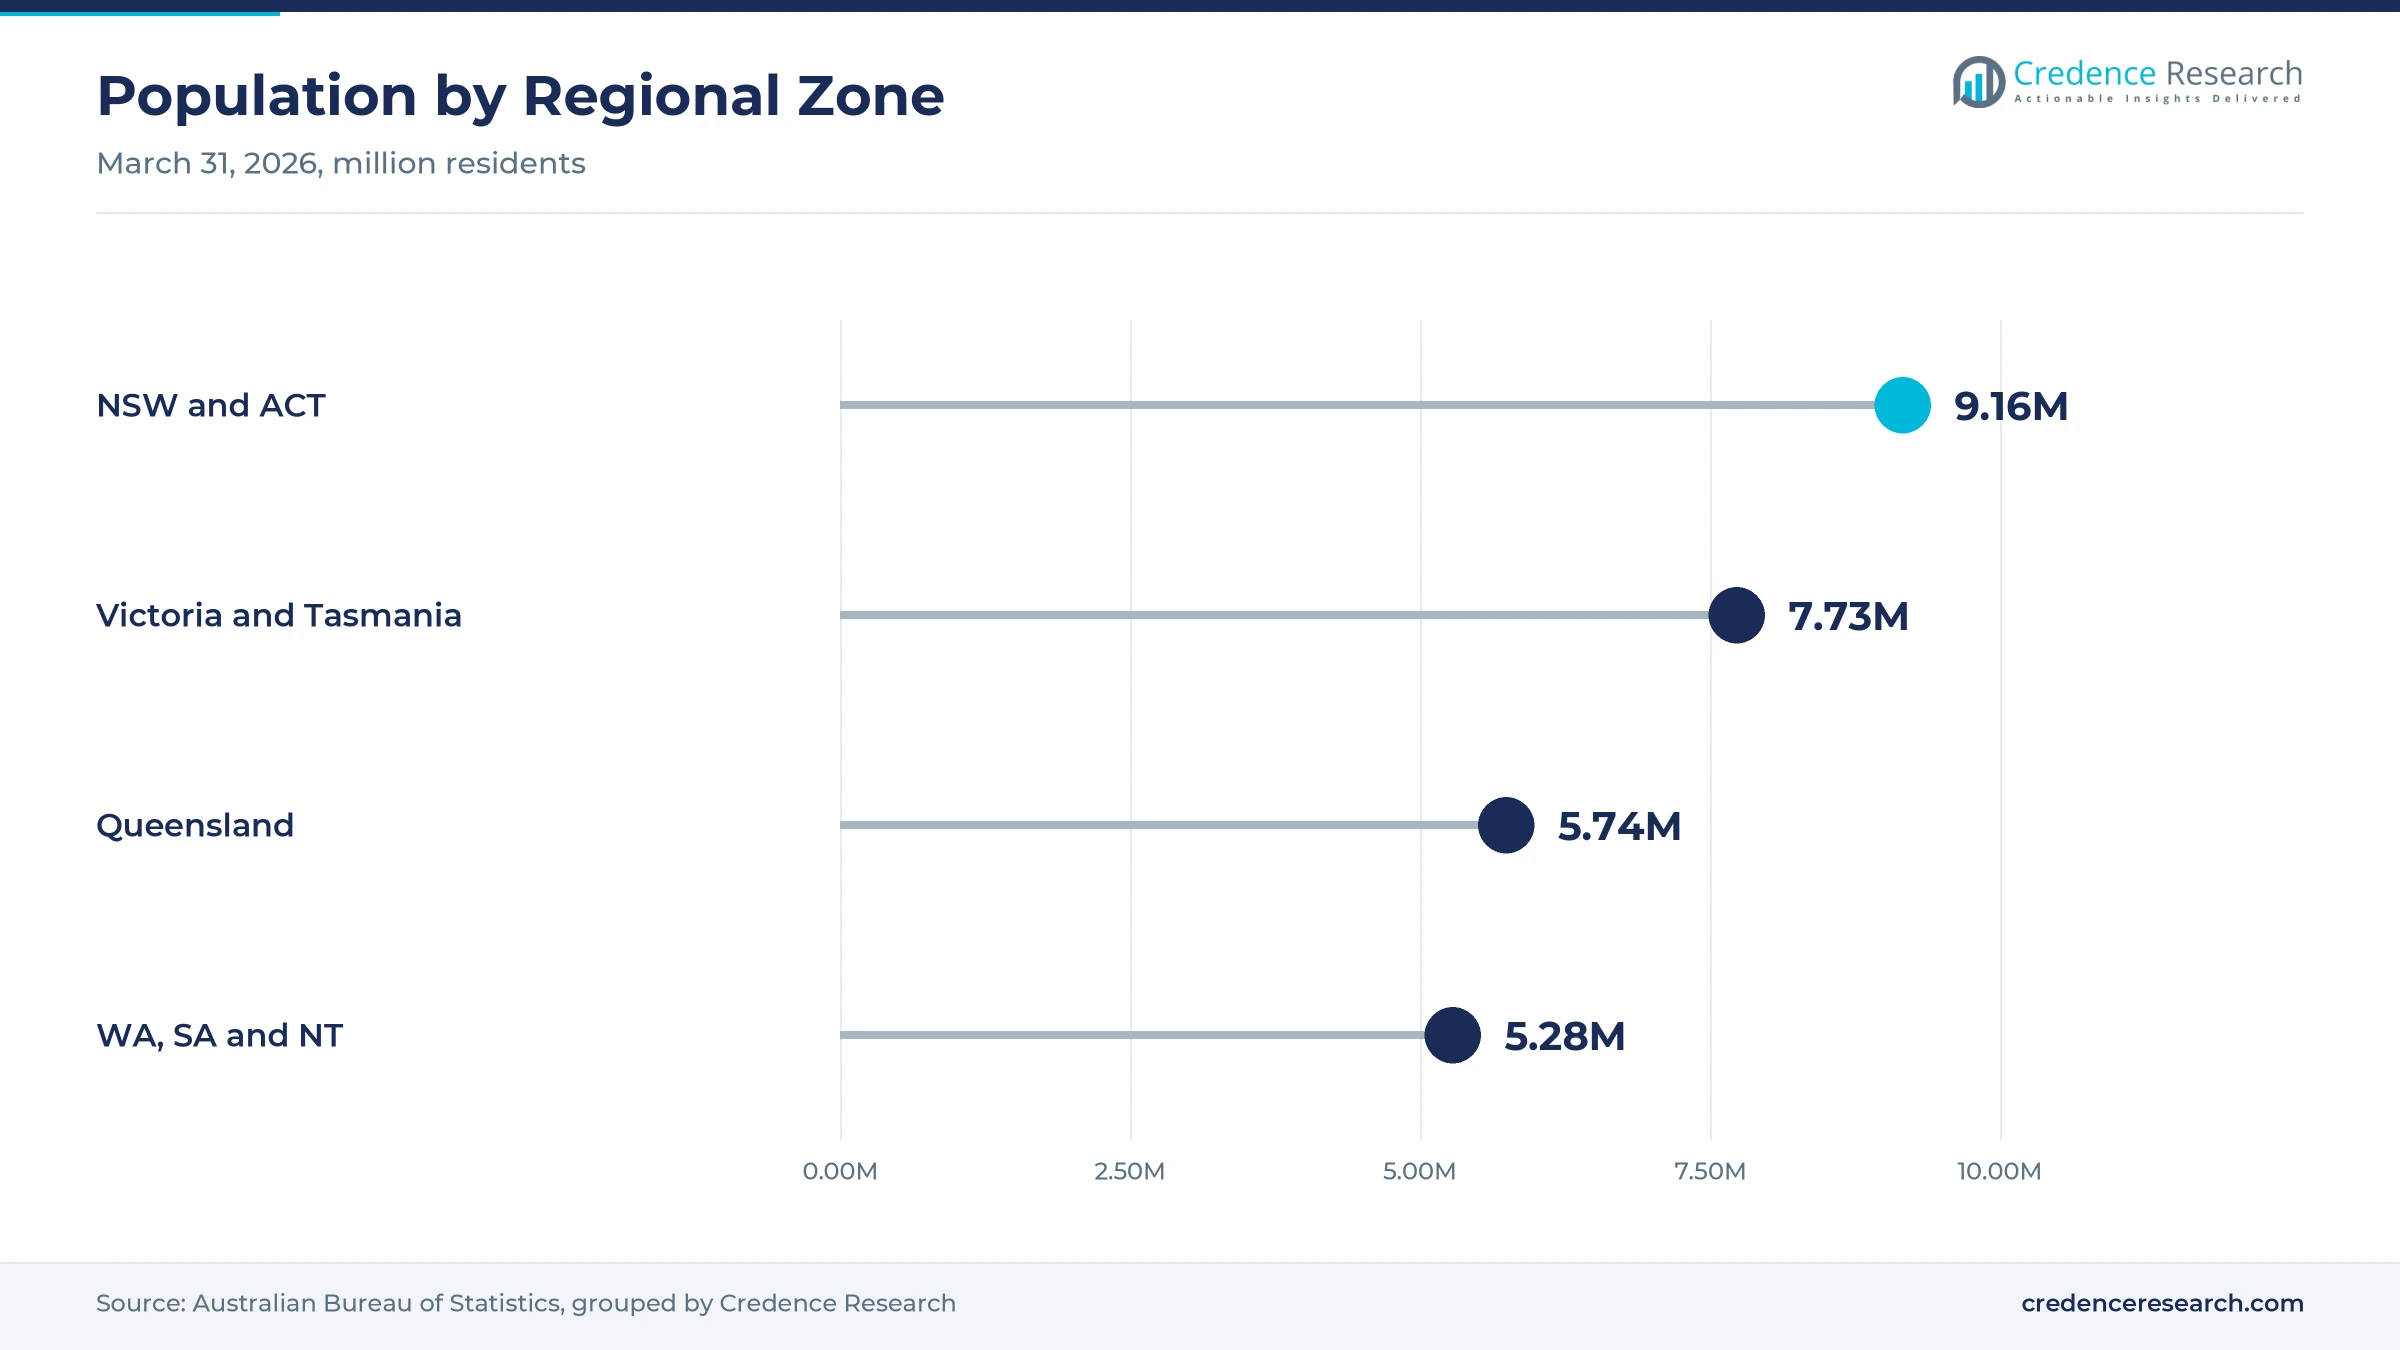
New South Wales and the Australian Capital Territory held a 34.5% share of 2025 value and grow at 9.50% a year, because Sydney hosts designated lutetium services at Royal North Shore Hospital and St George Hospital. The two jurisdictions had about 9.16 million residents at March 31, 2026. However, growth is slower than in other zones, as New South Wales grew only 1.1% in the year to March 2026. In turn, the zone keeps the largest share because both designated public services sit in the Sydney area.
How do Victoria and Tasmania support treatment demand?
Victoria and Tasmania held a 29.0% share of 2025 value and grow at 9.60% a year, because Melbourne hosts the Peter MacCallum Cancer Centre and a planned local theranostics facility. The two states had about 7.73 million residents at March 31, 2026. Victoria also added about 109,500 residents in the year, which supports steady growth in diagnosed patients. In turn, Credence Research expects local lutetium production to support more treatment slots in the zone.
Why does Queensland grow fastest?
Queensland accounted for 18.5% of 2025 value and grows fastest at 10.10% a year, because the state added about 90,100 residents in the year to March 2026. Its population reached about 5.74 million, and growth of 1.6% adds older residents who face higher cancer risk. As a result, demand for imaging and maintenance therapy rises quickly. Credence Research expects new private imaging and therapy capacity in the state to follow this population growth.
How do Western Australia, South Australia and the NT build demand?
Western Australia, South Australia and the Northern Territory accounted for 18.0% of 2025 value and grow at 10.00% a year, because Adelaide and Perth run specialist centers for wide catchments. The Queen Elizabeth Hospital is the only lutetium center for South Australia and the Northern Territory. Western Australia also posted the fastest state population growth at 2.1% in the year to March 2026.
Registrations, listings and funding moves from 2024 to 2026
| Development | Status and market relevance |
|---|---|
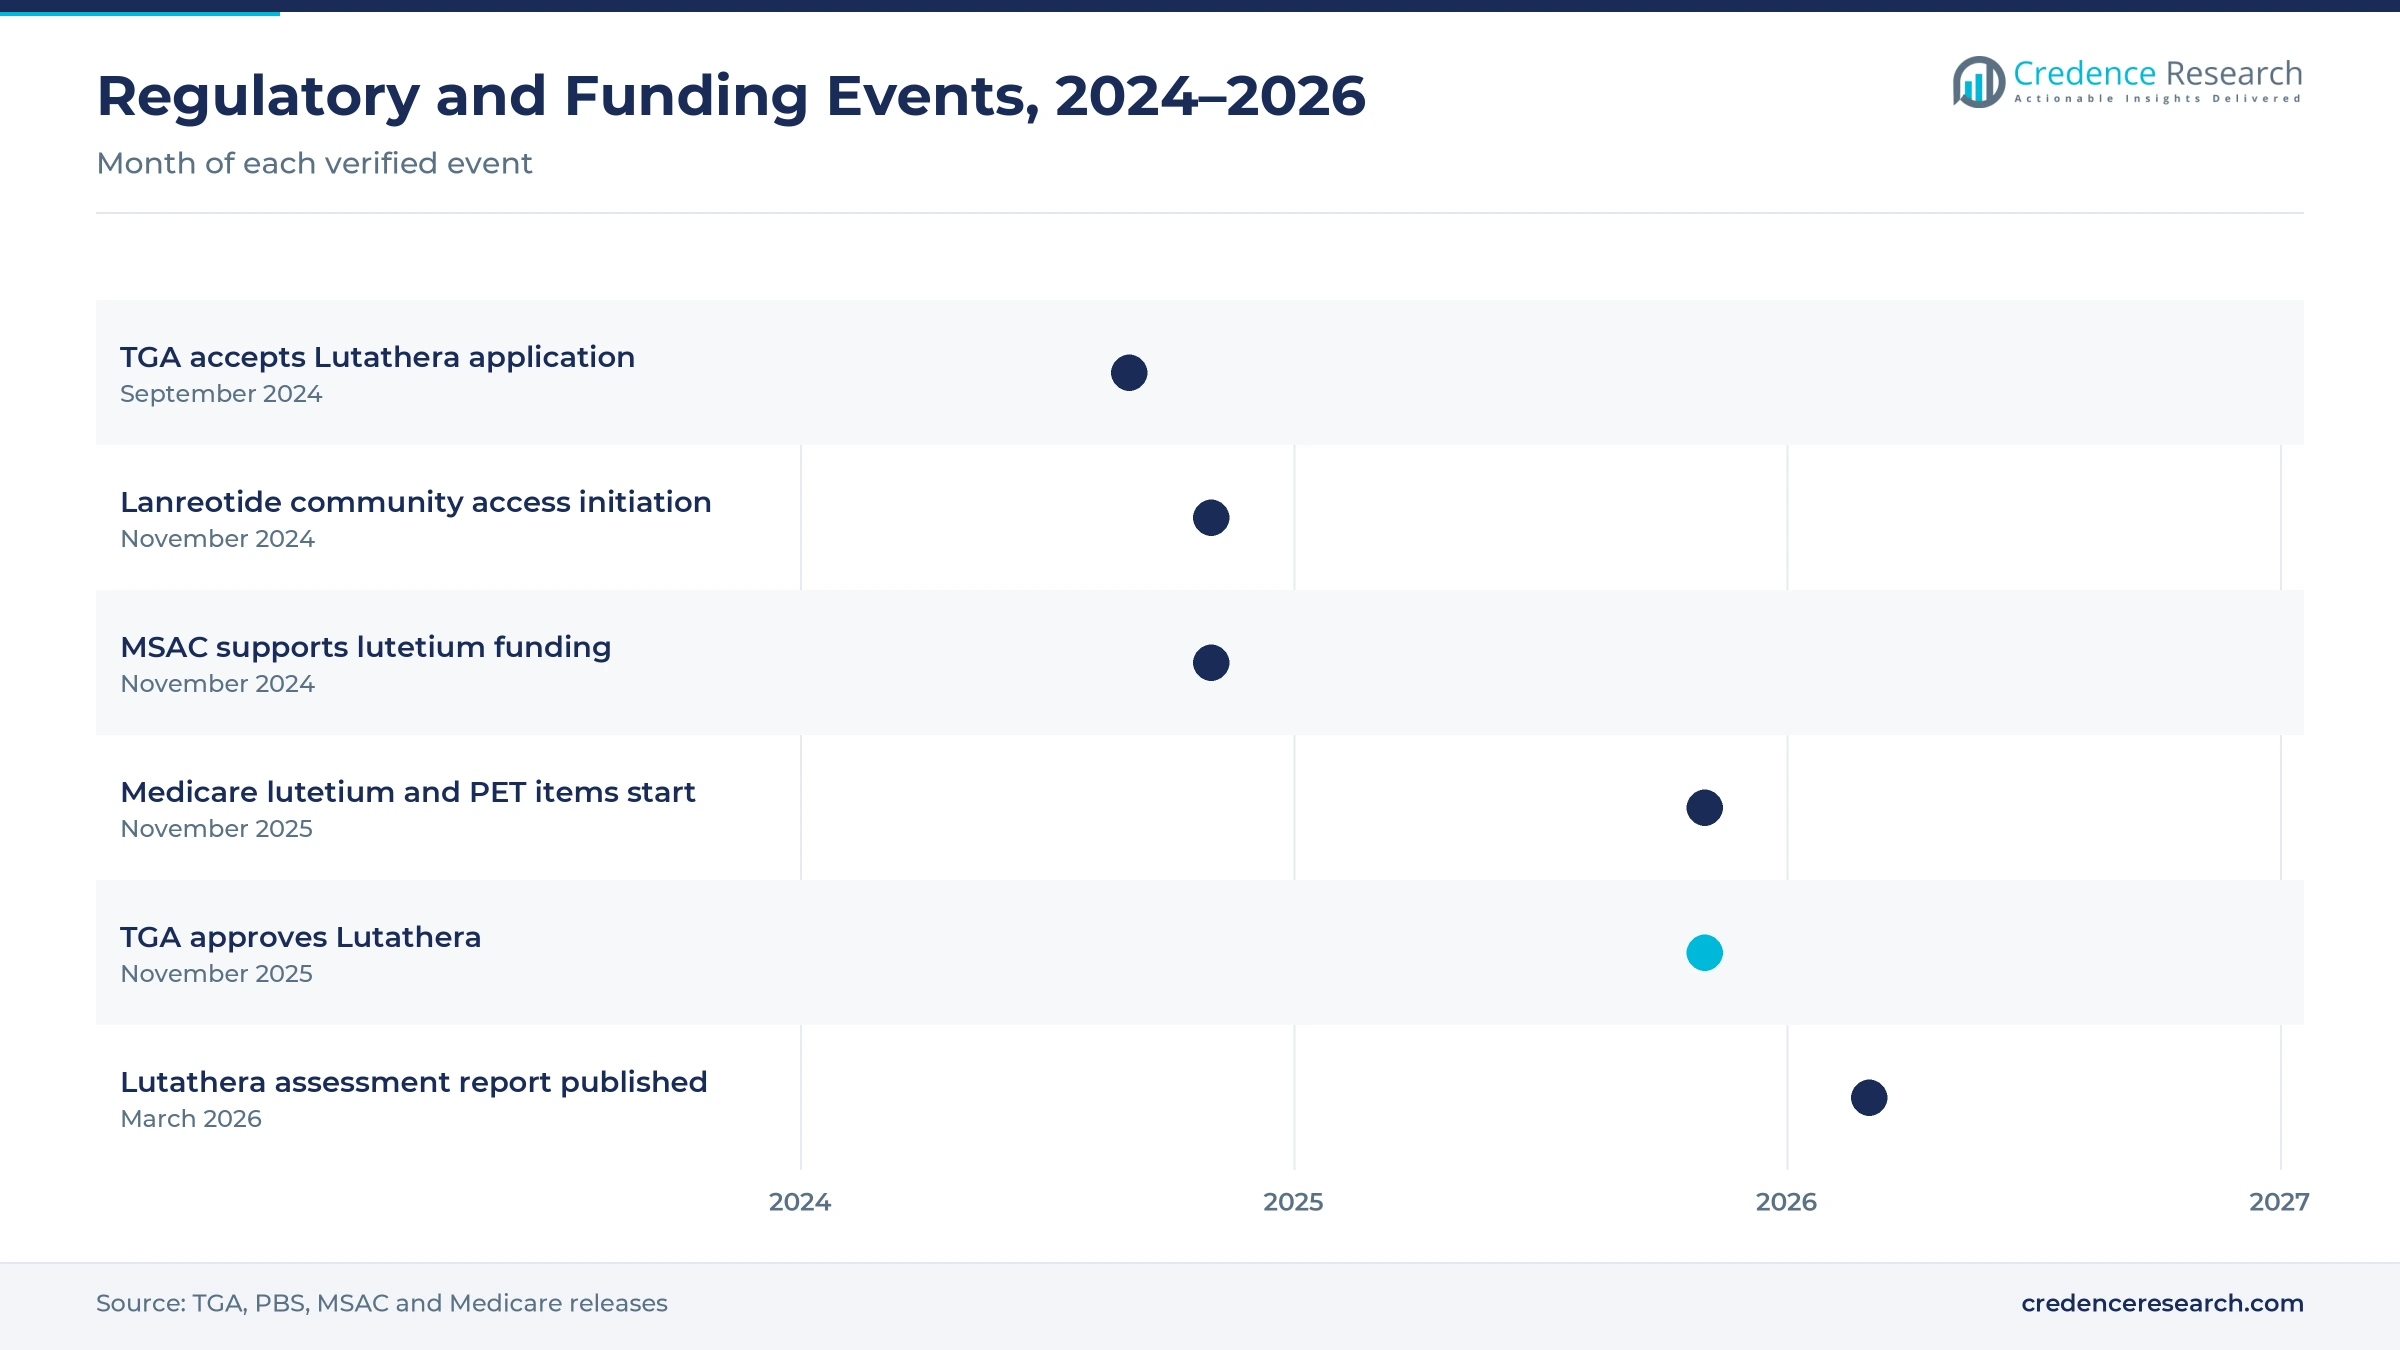
| In September 2024, the TGA accepted the Lutathera application from Novartis Pharmaceuticals Australia for evaluation. | Started review of a lutetium therapy for gastroenteropancreatic tumors |
| In November 2024, the PBS expanded community access so pharmacies can start Somatuline Autogel treatment. | Let community settings start lanreotide treatment |
| In November 2024, MSAC supported funding of lutetium-177 DOTA-octreotate for advanced neuroendocrine tumors. | Cleared the way for a Medicare therapy item |
| In November 2025, Medicare introduced items 16060 and 61530 for lutetium therapy and gallium-68 PET. | Funded each therapy cycle and staging scan |
| In November 2025, the TGA approved Lutathera for adult gastroenteropancreatic tumors. | Entered on the ARTG on Nov. 17, 2025 |
Ga-68 imaging and lutetium therapy reshape NEN care
- Gallium-68 DOTA PET imaging maps somatostatin receptor expression across the body, which guides staging, patient selection and response checks after each lutetium treatment course.
- Lutetium-177 DOTA therapy delivers radiation directly to receptor-positive tumor cells, which slows progression in advanced disease and can ease hormone symptoms in functioning tumors.
- Long-acting peptide injections release somatostatin analogues over four weeks, which controls hormone symptoms and tumor growth, and generic versions now lower the cost per dose.
- Oral targeted therapies block growth signals inside tumor cells, which offers another option for advanced pancreatic disease when injections or lutetium therapy stop working.
Need a Custom Version of This Report?
Tailor the scope, geography, or segments to your exact requirements.
- Custom geography or segment scope
- Direct access to our analyst team
Drug sponsors and nuclear medicine centers share the field
Competition combines drug sponsors that supply long-acting injections and targeted medicines with nuclear medicine centers that deliver lutetium therapy. Novartis Pharmaceuticals Australia received TGA approval for Lutathera in November 2025. Ipsen sponsors Somatuline Autogel, which gained community access initiation on the PBS in November 2024. Pfizer's Sutent has carried a PBS listing for metastatic pancreatic tumors since 2013. Applied Molecular Therapies was formed by ANSTO and Cyclotek, which announced the venture in November 2021, to make lutetium radiopharmaceuticals in Melbourne. Peter MacCallum Cancer Centre and Royal North Shore Hospital run specialist programs that treat referred patients. Rivals compete on product registration, PBS and Medicare listings, isotope supply reliability, treatment capacity and support for regional patients. Generic suppliers add price pressure on older medicines, while private imaging groups compete for funded PET scans and therapy cycles under the new Medicare items.
Companies profiled and their roles in this market
| Company | Type | Role in the market |
|---|---|---|
| Novartis Pharmaceuticals Australia Pty Ltd | Drug sponsor | Lutathera approved by the TGA in November 2025 |
| Ipsen Australia Pty Ltd | Drug sponsor | Somatuline Autogel community access initiation from November 2024 |
| Pfizer Australia Pty Ltd | Drug sponsor | Sutent listed on the PBS for metastatic pancreatic tumors |
| Applied Molecular Therapies Pty Ltd | Radiopharmaceutical manufacturer | ANSTO and Cyclotek venture for lutetium products |
| Peter MacCallum Cancer Centre | Specialist treatment center | Melbourne center with published lutetium therapy research |
| Royal North Shore Hospital | Specialist treatment center | One of two designated NSW public lutetium services |
Credence Research view on Australian NEN treatment
Credence Research's view is that Australian neuroendocrine treatment value will grow quickly because funding, registration and diagnosis trends now point in the same direction. Medicare funding of lutetium therapy removes the main cost barrier, while a registered product gives private centers a reliable supply option. Somatostatin analogues remain the base of care, although generic pricing slows their value growth. Suppliers and centers that combine receptor imaging, steady isotope supply and regional outreach should gain share fastest.
How the Australian NEN treatment estimate was built
The report uses 2025 as the base year on a calendar basis, and market values come from the Credence Research model. That model combines national cancer incidence and survival statistics, Medicare and PBS listing documents, TGA assessment reports, state health service releases, World Bank health spending data, population statistics and company announcements. Segment splits, regional zones, regional shares and growth rates are Credence Research estimates, because the client sheet named only the eastern seaboard. Sources used are public reports, official statistics and company releases, and no interviews or surveys were used.
Theranostics and longer survival carry growth to 2035
Treatment value is expected to reach USD 119.9 million by 2035, a 9.73% CAGR during 2026–2035, as funded lutetium therapy, receptor imaging and longer survival keep demand rising. Growth should be strongest through 2028 as Medicare-funded cycles replace self-paid and charity-funded treatment. After that, wider imaging use and new centers in growing states will carry more growth. Australia already spent about 10.4% of GDP on health in 2023, according to World Bank data, which supports continued funding for specialist cancer care.
Frequently Asked Questions
How big is the Australia neuroendocrine carcinoma market?
Which product type leads Australian neuroendocrine treatment value?
Which region leads the Australia neuroendocrine carcinoma market?
How many Australians are diagnosed with neuroendocrine tumors?
When did Medicare start funding lutetium therapy?
Is Lutathera registered in Australia?
Who are the leading companies in the Australia neuroendocrine carcinoma market?
What are the main challenges for neuroendocrine treatment providers?
Table of Content
Chapter 1 Market Segmentation
- 1.1 Segmentation Framework
- 1.1.1 Product and Service Classification
- 1.1.2 Application and End-Use Classification
- 1.1.3 Technology and Solution Classification
- 1.1.4 Customer and Distribution Channel Classification
- 1.1.5 Geographic Segmentation
- 1.1.6 Market Segment Definitions and Boundaries
- 1.2 By Product Type
- 1.2.1 Somatostatin analogues
- 1.2.2 PRRT
- 1.2.3 Targeted therapies
- 1.2.4 Cytotoxic chemotherapy
- 1.2.5 Diagnostic services
- 1.3 By Disease Area
- 1.3.1 Gastrointestinal NENs
- 1.3.2 Pancreatic NENs
- 1.3.3 Thoracic NENs
- 1.3.4 Extra-gastrointestinal non-thoracic NENs
- 1.4 By Care Setting
- 1.4.1 Inpatient treatment
- 1.4.2 Outpatient specialist care
- 1.4.3 Community treatment
- 1.5 By Customer Type
- 1.5.1 Public purchasers
- 1.5.2 Private institutional purchasers
- 1.5.3 Self-paying patients
Chapter 2 Introduction
- 2.1 Report Objectives and Scope
- 2.2 Product Definition and Industry Terminology
- 2.3 Market Inclusions and Exclusions
- 2.4 Research Process
- 2.4.1 Primary Research and Expert Interviews
- 2.4.2 Secondary Research and Source Review
- 2.4.3 Top-Down and Bottom-Up Estimation
- 2.4.4 Data Triangulation and Verification
- 2.5 Market Size Measurement Basis
- 2.5.1 2025: USD 41.5 million → 2035: USD 119.9 million
- 2.6 Historical and Forecast Reference Periods
- 2.6.1 Historical Period: 2018-2025
- 2.6.2 Base Year: 2025
- 2.6.3 Forecast Period: 2025-2035
- 2.7 Research Assumptions and Limitations
Chapter 3 Executive Summary
- 3.1 Market Snapshot and Key Findings
- 3.2 Base-Year Market Size, 2025
- 3.3 Forecast Market Size, 2035
- 3.4 Revenue and Volume Growth Outlook
- 3.5 Key Demand and Supply Indicators
- 3.6 Leading Market Segments
- 3.7 Fastest-Growing Market Opportunities
- 3.8 Regional Performance Highlights
- 3.9 Technology and Industry Transformation
- 3.10 Competitive Landscape Summary
- 3.11 Analyst View and Strategic Implications
Chapter 4 Australia Neuroendocrine Carcinoma Market Trends and Developments
- 4.1 Historical Industry Development, 2018-2025
- 4.2 Recent Market Trends and Developments
- 4.3 Demand and Customer Behavior Trends
- 4.4 Technology and Product Innovation
- 4.5 Artificial Intelligence, Automation and Digitalization
- 4.6 Local Manufacturing and Supply Chain Realignment
- 4.7 Industry Partnerships, Mergers and Acquisitions
- 4.8 Sustainability and Circular Economy Developments
- 4.9 Government and Private Sector Investment Trends
- 4.10 Emerging Business Models and Commercialization
- 4.11 Industry Developments and Announcements
Chapter 5 Australia Neuroendocrine Carcinoma Market Production, Supply and Demand Analysis
- 5.1 Demand Trend and Consumption Analysis, 2018-2025
- 5.2 Demand Forecast, 2025-2035
- 5.3 Production and Output Trend, 2018-2025
- 5.4 Production and Output Forecast, 2025-2035
- 5.5 Installed Capacity and Capacity Utilization
- 5.6 Company-Wise Production Plants and Statistics
- 5.6.1 Installed Production Capacity
- 5.6.2 Actual Production
- 5.6.3 Planned Capacity and Expansion Targets
- 5.7 Supply Chain Structure and Procurement Trends
- 5.8 Supply-Demand Gap and Bottlenecks
- 5.9 Import Dependence and Sourcing Structure
- 5.10 Contract Manufacturing and Outsourcing
- 5.11 Regional Supply and Demand Concentration
Chapter 6 Australia Neuroendocrine Carcinoma Market Pricing Analysis
- 6.1 Pricing Structure and Measurement
- 6.2 Historical Pricing Trends, 2018-2025
- 6.3 Pricing Outlook, 2025-2035
- 6.4 Average Selling Price and Unit Economics
- 6.5 Pricing by Product and Market Segment
- 6.6 Geographic Pricing Differences
- 6.7 Key Input, Energy, Labor and Logistics Costs
- 6.8 Contract Pricing and Purchasing Models
- 6.9 Pricing Sensitivity and Competitive Positioning
- 6.10 Price, Margin and Profitability Implications
Chapter 7 Australia Neuroendocrine Carcinoma Market Dynamics
- 7.1 Market Growth Drivers
- 7.1.1 Demand-Side Drivers
- 7.1.2 Technology and Innovation Drivers
- 7.1.3 Infrastructure and Investment Drivers
- 7.1.4 Regulatory and Policy Drivers
- 7.2 Market Restraints
- 7.2.1 Cost and Affordability Constraints
- 7.2.2 Technology and Adoption Barriers
- 7.2.3 Supply Chain and Operational Constraints
- 7.3 Market Challenges
- 7.3.1 Competitive Pressure and Margin Erosion
- 7.3.2 Skills, Infrastructure and Implementation Gaps
- 7.4 Emerging Market Opportunities
- 7.5 Market Dynamics Impact and Time-Horizon Assessment
Chapter 8 Australia Neuroendocrine Carcinoma Value Chain Analysis
- 8.1 Industry Value Chain Overview
- 8.2 Upstream Suppliers and Critical Inputs
- 8.3 Technology and Component Providers
- 8.4 Manufacturing or Service Delivery
- 8.5 Distribution, Channel Partners and Integrators
- 8.6 Downstream Applications and End Users
- 8.7 Value Addition and Profit Pools
- 8.8 Vertical Integration and Outsourcing
- 8.9 Supplier Concentration and Risk
- 8.10 Supply Chain Localization and Resilience
Chapter 9 Australia Neuroendocrine Carcinoma Market Regulations and Policies
- 9.1 Relevant Laws, Standards and Compliance Frameworks
- 9.2 Product, Service, Safety and Quality Requirements
- 9.3 Government Policies, Incentives and Subsidies
- 9.4 Imports, Exports and Trade Barriers
- 9.5 Public Procurement and Local Content Requirements
- 9.6 Environmental and Sustainability Compliance
- 9.7 Upcoming Policy Changes and Market Implications
Chapter 10 Australia Neuroendocrine Carcinoma Market Hotspots and Opportunities
- 10.1 Market Opportunity Mapping and Growth Hotspots
- 10.2 High-Growth Applications and Customer Groups
- 10.3 Underserved Markets and White-Space Opportunities
- 10.4 Emerging Technology and Product Opportunities
- 10.5 New Capacity and Investment Hotspots
- 10.6 Market Entry and Expansion Opportunities
- 10.7 Distribution and Partnership Opportunities
- 10.8 Near-Term and Long-Term Commercial Potential
- 10.9 Opportunity Attractiveness and Execution Risks
Chapter 11 Australia Neuroendocrine Carcinoma Market Outlook, 2025-2035
- 11.1 Market Size and Analysis
- 11.1.1 Revenue (Market Measurement: 2025: USD 41.5 million → 2035: USD 119.9 million)
- 11.1.2 Market Volume and Quantity Sold
- 11.1.3 Historical Market Size, 2018-2025
- 11.1.4 Base-Year Market Size, 2025
- 11.2 Market Forecast, 2025-2035
- 11.2.1 Revenue Forecast to 2035
- 11.2.2 Volume Forecast to 2035
- 11.2.3 CAGR and Year-on-Year Growth
- 11.2.4 Incremental Revenue Opportunity
- 11.3 Forecast Assumptions and Scenario Analysis
- 11.3.1 Base-Case Forecast
- 11.3.2 Optimistic and Conservative Scenarios
- 11.3.3 Technology, Pricing and Policy Sensitivities
- 11.4 Market Attractiveness and Growth Outlook
Chapter 12 Australia Neuroendocrine Carcinoma Market Segmentation and Outlook
- 12.1 Segmentation Summary and Market Shares, 2025
- 12.2 Largest and Fastest-Growing Segments
- 12.3 By Product Type - Market Size and Forecast, 2025-2035
- 12.3.1 Segment Definition and Scope
- 12.3.2 Historical Market Size, 2018-2025
- 12.3.3 Revenue Forecast, 2025-2035
- 12.3.4 Volume Forecast, 2025-2035
- 12.3.5 Base-Year Market Share, 2025
- 12.3.6 Segment CAGR and Growth Drivers
- 12.3.7 Subsegment Market Size and Forecast
- 12.3.7.1 Somatostatin analogues
- 12.3.7.2 PRRT
- 12.3.7.3 Targeted therapies
- 12.3.7.4 Cytotoxic chemotherapy
- 12.3.7.5 Diagnostic services
- 12.3.8 Subsegment Pricing and Adoption Trends
- 12.3.9 Leading Suppliers and Competition
- 12.3.10 Regional Demand and Opportunities
- 12.4 By Disease Area - Market Size and Forecast, 2025-2035
- 12.4.1 Segment Definition and Scope
- 12.4.2 Historical Market Size, 2018-2025
- 12.4.3 Revenue Forecast, 2025-2035
- 12.4.4 Volume Forecast, 2025-2035
- 12.4.5 Base-Year Market Share, 2025
- 12.4.6 Segment CAGR and Growth Drivers
- 12.4.7 Subsegment Market Size and Forecast
- 12.4.7.1 Gastrointestinal NENs
- 12.4.7.2 Pancreatic NENs
- 12.4.7.3 Thoracic NENs
- 12.4.7.4 Extra-gastrointestinal non-thoracic NENs
- 12.4.8 Subsegment Pricing and Adoption Trends
- 12.4.9 Leading Suppliers and Competition
- 12.4.10 Regional Demand and Opportunities
- 12.5 By Care Setting - Market Size and Forecast, 2025-2035
- 12.5.1 Segment Definition and Scope
- 12.5.2 Historical Market Size, 2018-2025
- 12.5.3 Revenue Forecast, 2025-2035
- 12.5.4 Volume Forecast, 2025-2035
- 12.5.5 Base-Year Market Share, 2025
- 12.5.6 Segment CAGR and Growth Drivers
- 12.5.7 Subsegment Market Size and Forecast
- 12.5.7.1 Inpatient treatment
- 12.5.7.2 Outpatient specialist care
- 12.5.7.3 Community treatment
- 12.5.8 Subsegment Pricing and Adoption Trends
- 12.5.9 Leading Suppliers and Competition
- 12.5.10 Regional Demand and Opportunities
- 12.6 By Customer Type - Market Size and Forecast, 2025-2035
- 12.6.1 Segment Definition and Scope
- 12.6.2 Historical Market Size, 2018-2025
- 12.6.3 Revenue Forecast, 2025-2035
- 12.6.4 Volume Forecast, 2025-2035
- 12.6.5 Base-Year Market Share, 2025
- 12.6.6 Segment CAGR and Growth Drivers
- 12.6.7 Subsegment Market Size and Forecast
- 12.6.7.1 Public purchasers
- 12.6.7.2 Private institutional purchasers
- 12.6.7.3 Self-paying patients
- 12.6.8 Subsegment Pricing and Adoption Trends
- 12.6.9 Leading Suppliers and Competition
- 12.6.10 Regional Demand and Opportunities
- 12.7 Segment Growth Comparison
- 12.8 Segment Attractiveness and Priority Matrix
Chapter 13 Australia Neuroendocrine Carcinoma End-Use and Application Market Outlook
- 13.1 End-Use Industry and Customer Demand Structure
- 13.2 Leading Applications and Customer Groups
- 13.3 End-Use Market Size, Share and Forecast
- 13.4 Major End-Use Industry Deep Dives
- 13.4.1 Customer Requirements and Use Cases
- 13.4.2 Demand and Replacement Cycles
- 13.4.3 Technical and Regulatory Considerations
- 13.4.4 Purchasing and Procurement Models
- 13.4.5 Leading Vendors and Distribution Channels
- 13.4.6 Forecast and Commercial Opportunities
- 13.5 Emerging Applications and Cross-Segment Demand
- 13.6 End-Use Industry Investment Priorities
Chapter 14 Australia Neuroendocrine Carcinoma Geographic Market Outlook, 2025-2035
- 14.1 Domestic Market Distribution and Demand Clusters
- 14.2 State- or Province-Wise Market Size and Forecast, 2025-2035
- 14.3 City and Metropolitan Market Outlook
- 14.4 Industrial, Manufacturing and Commercial Clusters
- 14.5 Geographic Concentration of Key End Users
- 14.6 Local Pricing and Purchasing Differences
- 14.7 Domestic Production Facilities and Capacity Map
- 14.8 Local Infrastructure and Project Pipeline
- 14.9 State-Level Policy and Incentive Differences
- 14.10 Subnational Investment Hotspots and Opportunities
- 14.11 Distribution and Logistics Networks
- 14.12 Domestic Competitive Footprint
Chapter 15 Australia Neuroendocrine Carcinoma Technology, Innovation and Sustainability Outlook
- 15.1 Technology Landscape and Maturity
- 15.2 Product, Process and Service Innovation
- 15.3 AI, Automation and Digital Tools in the Industry
- 15.4 Technology Adoption and Performance Benchmarking
- 15.5 Innovation Pipeline and R&D Investment
- 15.6 Patent and Intellectual Property Trends
- 15.7 Energy Efficiency and Resource Management
- 15.8 Sustainability, Recycling and Circularity
- 15.9 Technology Roadmap, 2025-2035
- 15.10 Risks of Obsolescence and Technology Substitution
Chapter 16 Australia Neuroendocrine Carcinoma Market Key Strategic Imperatives
- 16.1 Growth and Market Entry Priorities
- 16.2 High-Return Products and Segments
- 16.3 Pricing, Profitability and Cost Optimization
- 16.4 Technology Investment and Product Differentiation
- 16.5 Supply Chain Localization and Resilience
- 16.6 Distribution and Customer Acquisition
- 16.7 Partnership, Acquisition and Capacity Strategy
- 16.8 Regional Expansion Priorities
- 16.9 Short-, Medium- and Long-Term Actions
Chapter 17 Competition Outlook
- 17.1 Industry Competition Characteristics
- 17.2 Market Structure and Concentration
- 17.3 Market Share and Competitive Positioning, 2025
- 17.4 Company-Wise Revenue and Product Benchmarking
- 17.5 Production and Service Capacity Benchmarking
- 17.6 Technology, Pricing and Differentiation
- 17.7 Regional Footprint and Distribution Strength
- 17.8 Mergers, Acquisitions and Strategic Alliances
- 17.9 New Entrants and Competitive Threats
- 17.10 Porter's Five Forces and Industry Attractiveness
- 17.11 Competitive Outlook, 2025-2035
Chapter 18 Company Profiles
- 18.1 Company Coverage and Selection Criteria
- 18.2 Novartis Pharmaceuticals Australia Pty Ltd
- 18.2.1 Business Description
- 18.2.2 Company Ownership and Geographic Presence
- 18.2.3 Product and Service Portfolio
- 18.2.4 Manufacturing and Operating Footprint
- 18.2.5 Production Capacity and Expansion Plans
- 18.2.6 Financial Performance and Investment
- 18.2.7 Market Share and Competitive Position
- 18.2.8 Technology and Innovation Capabilities
- 18.2.9 Strategic Alliances or Partnerships
- 18.2.10 Recent Developments
- 18.2.11 Growth Strategy and Outlook
- 18.3 Ipsen Australia Pty Ltd
- 18.4 Pfizer Australia Pty Ltd
- 18.5 Applied Molecular Therapies Pty Ltd
- 18.6 Amdipharm Mercury Australia Pty Ltd
- 18.7 Sun Pharma ANZ Pty Ltd
- 18.8 Sandoz Pty Ltd
- 18.9 Peter MacCallum Cancer Centre
- 18.10 Royal North Shore Hospital
- 18.11 Jones Radiology
- 18.12 Other Relevant Market Participants
Note: Every listed company is profiled on the structure shown under the first company. The company list is preliminary and may change based on research findings, market developments, data availability and client requirements.
Chapter 19 Disclaimer
- 19.1 Research and Forecast Disclaimer
- 19.2 Data Source and Estimation Limitations
Note: The depth of individual sections depends on data availability for this market. Volume, capacity, trade and other unit-based metrics are included where applicable.

