
Medicare equipment age rules set the replacement cycle
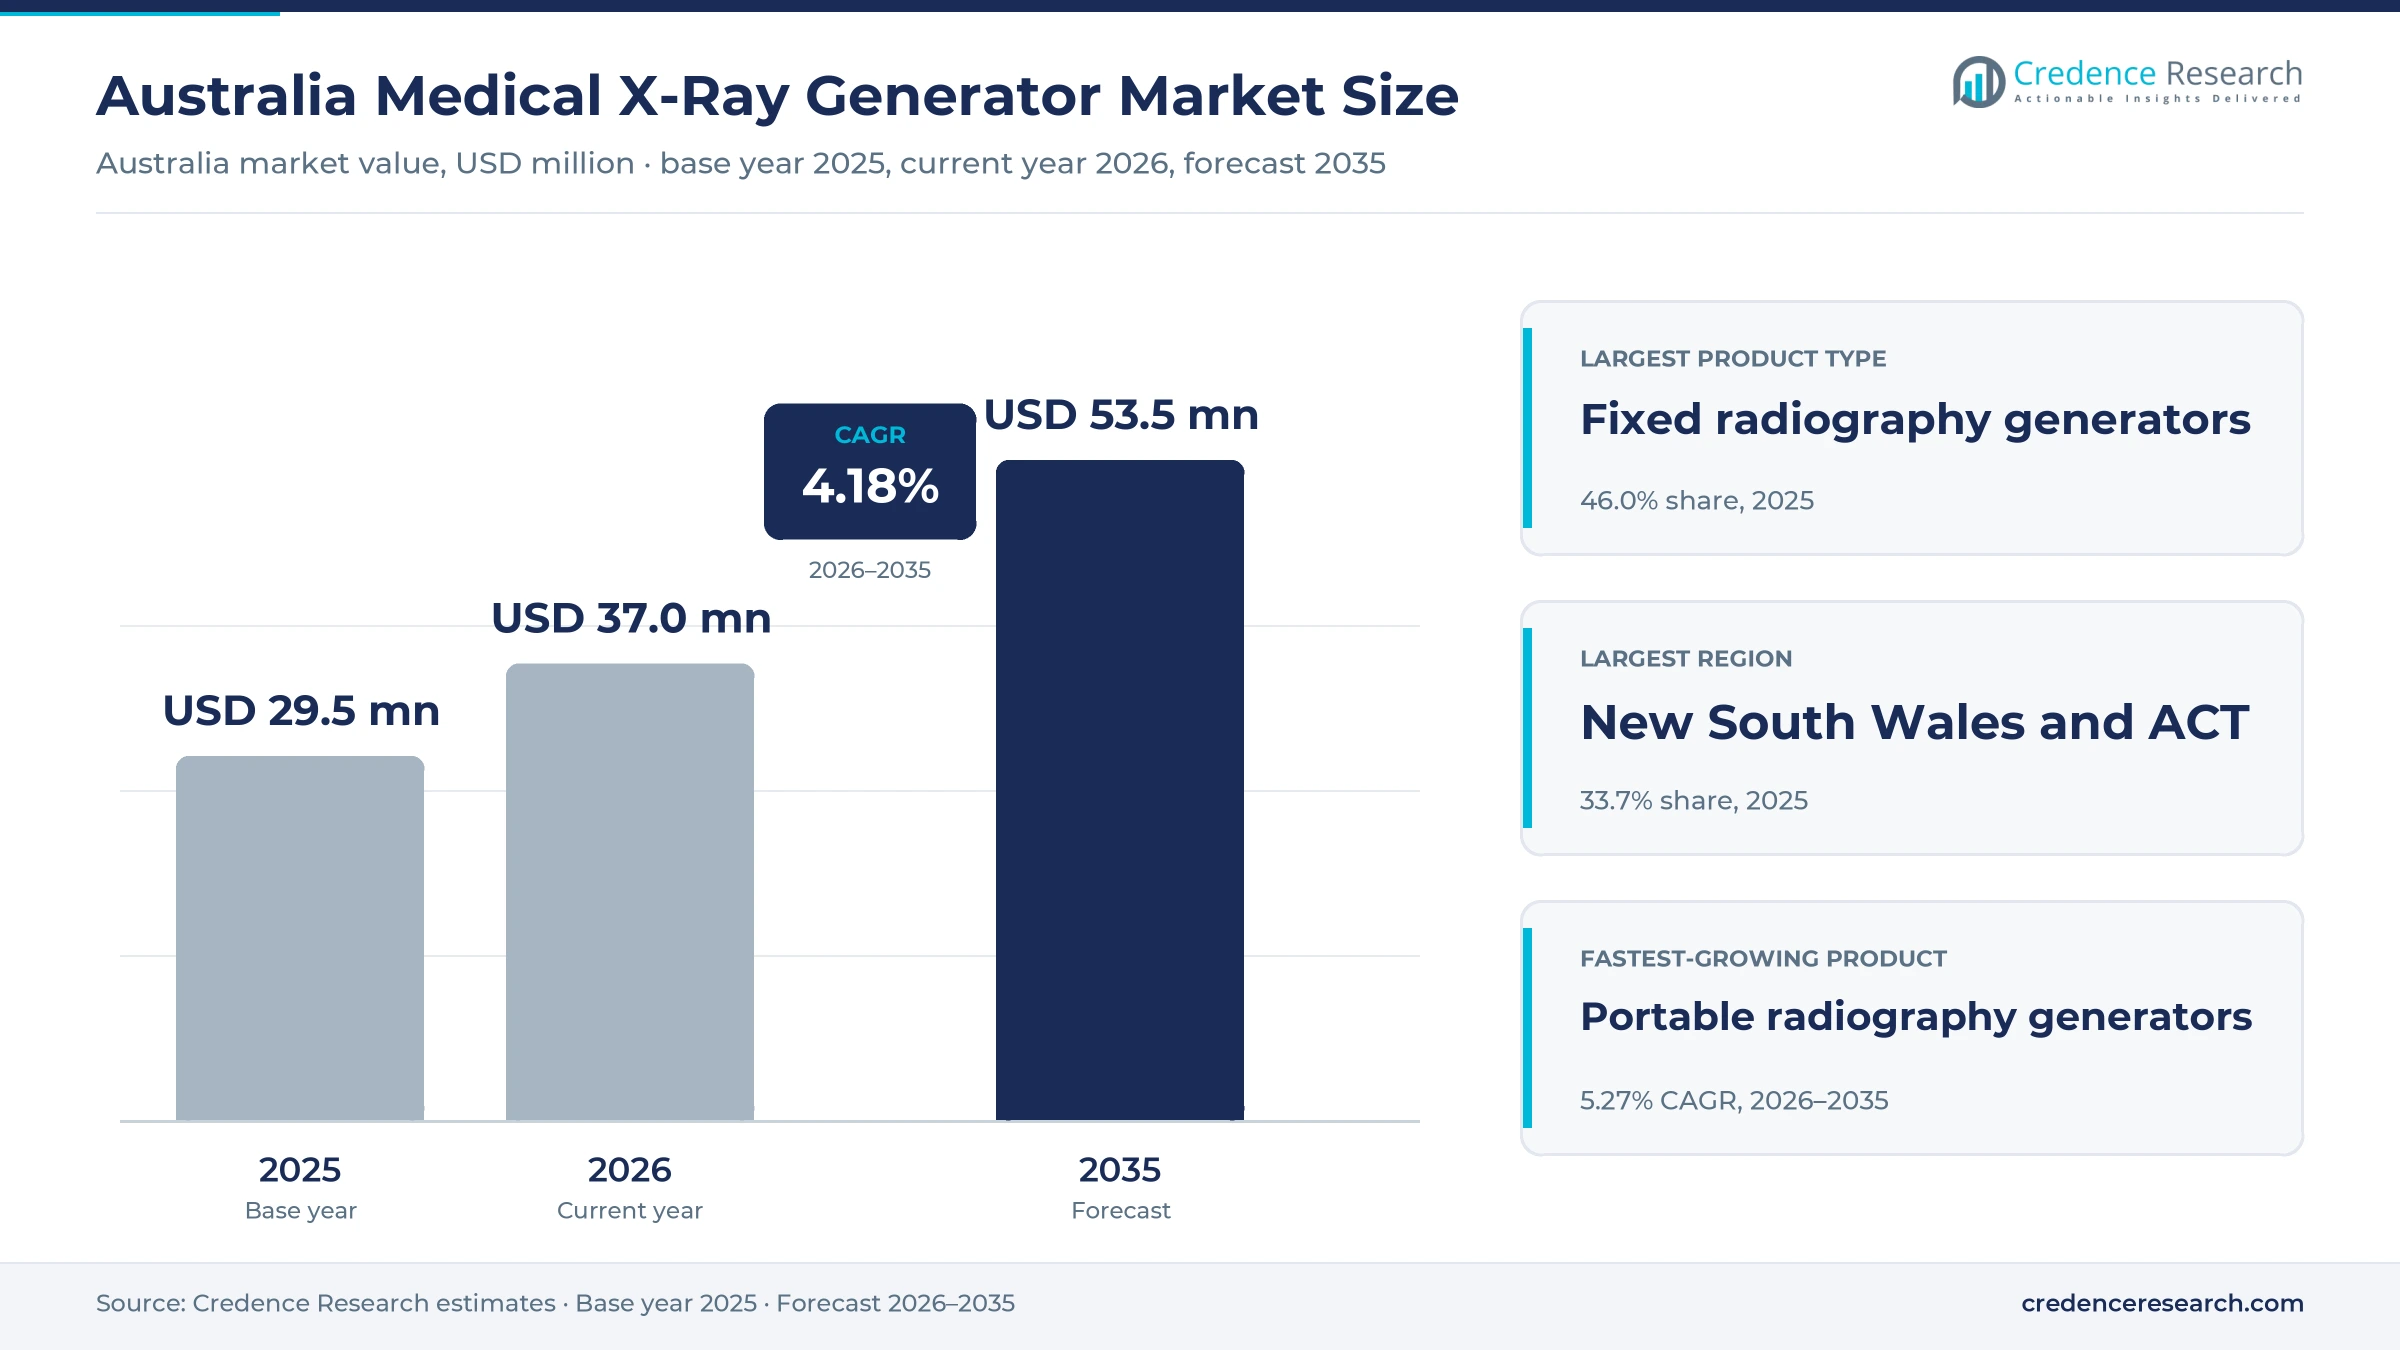
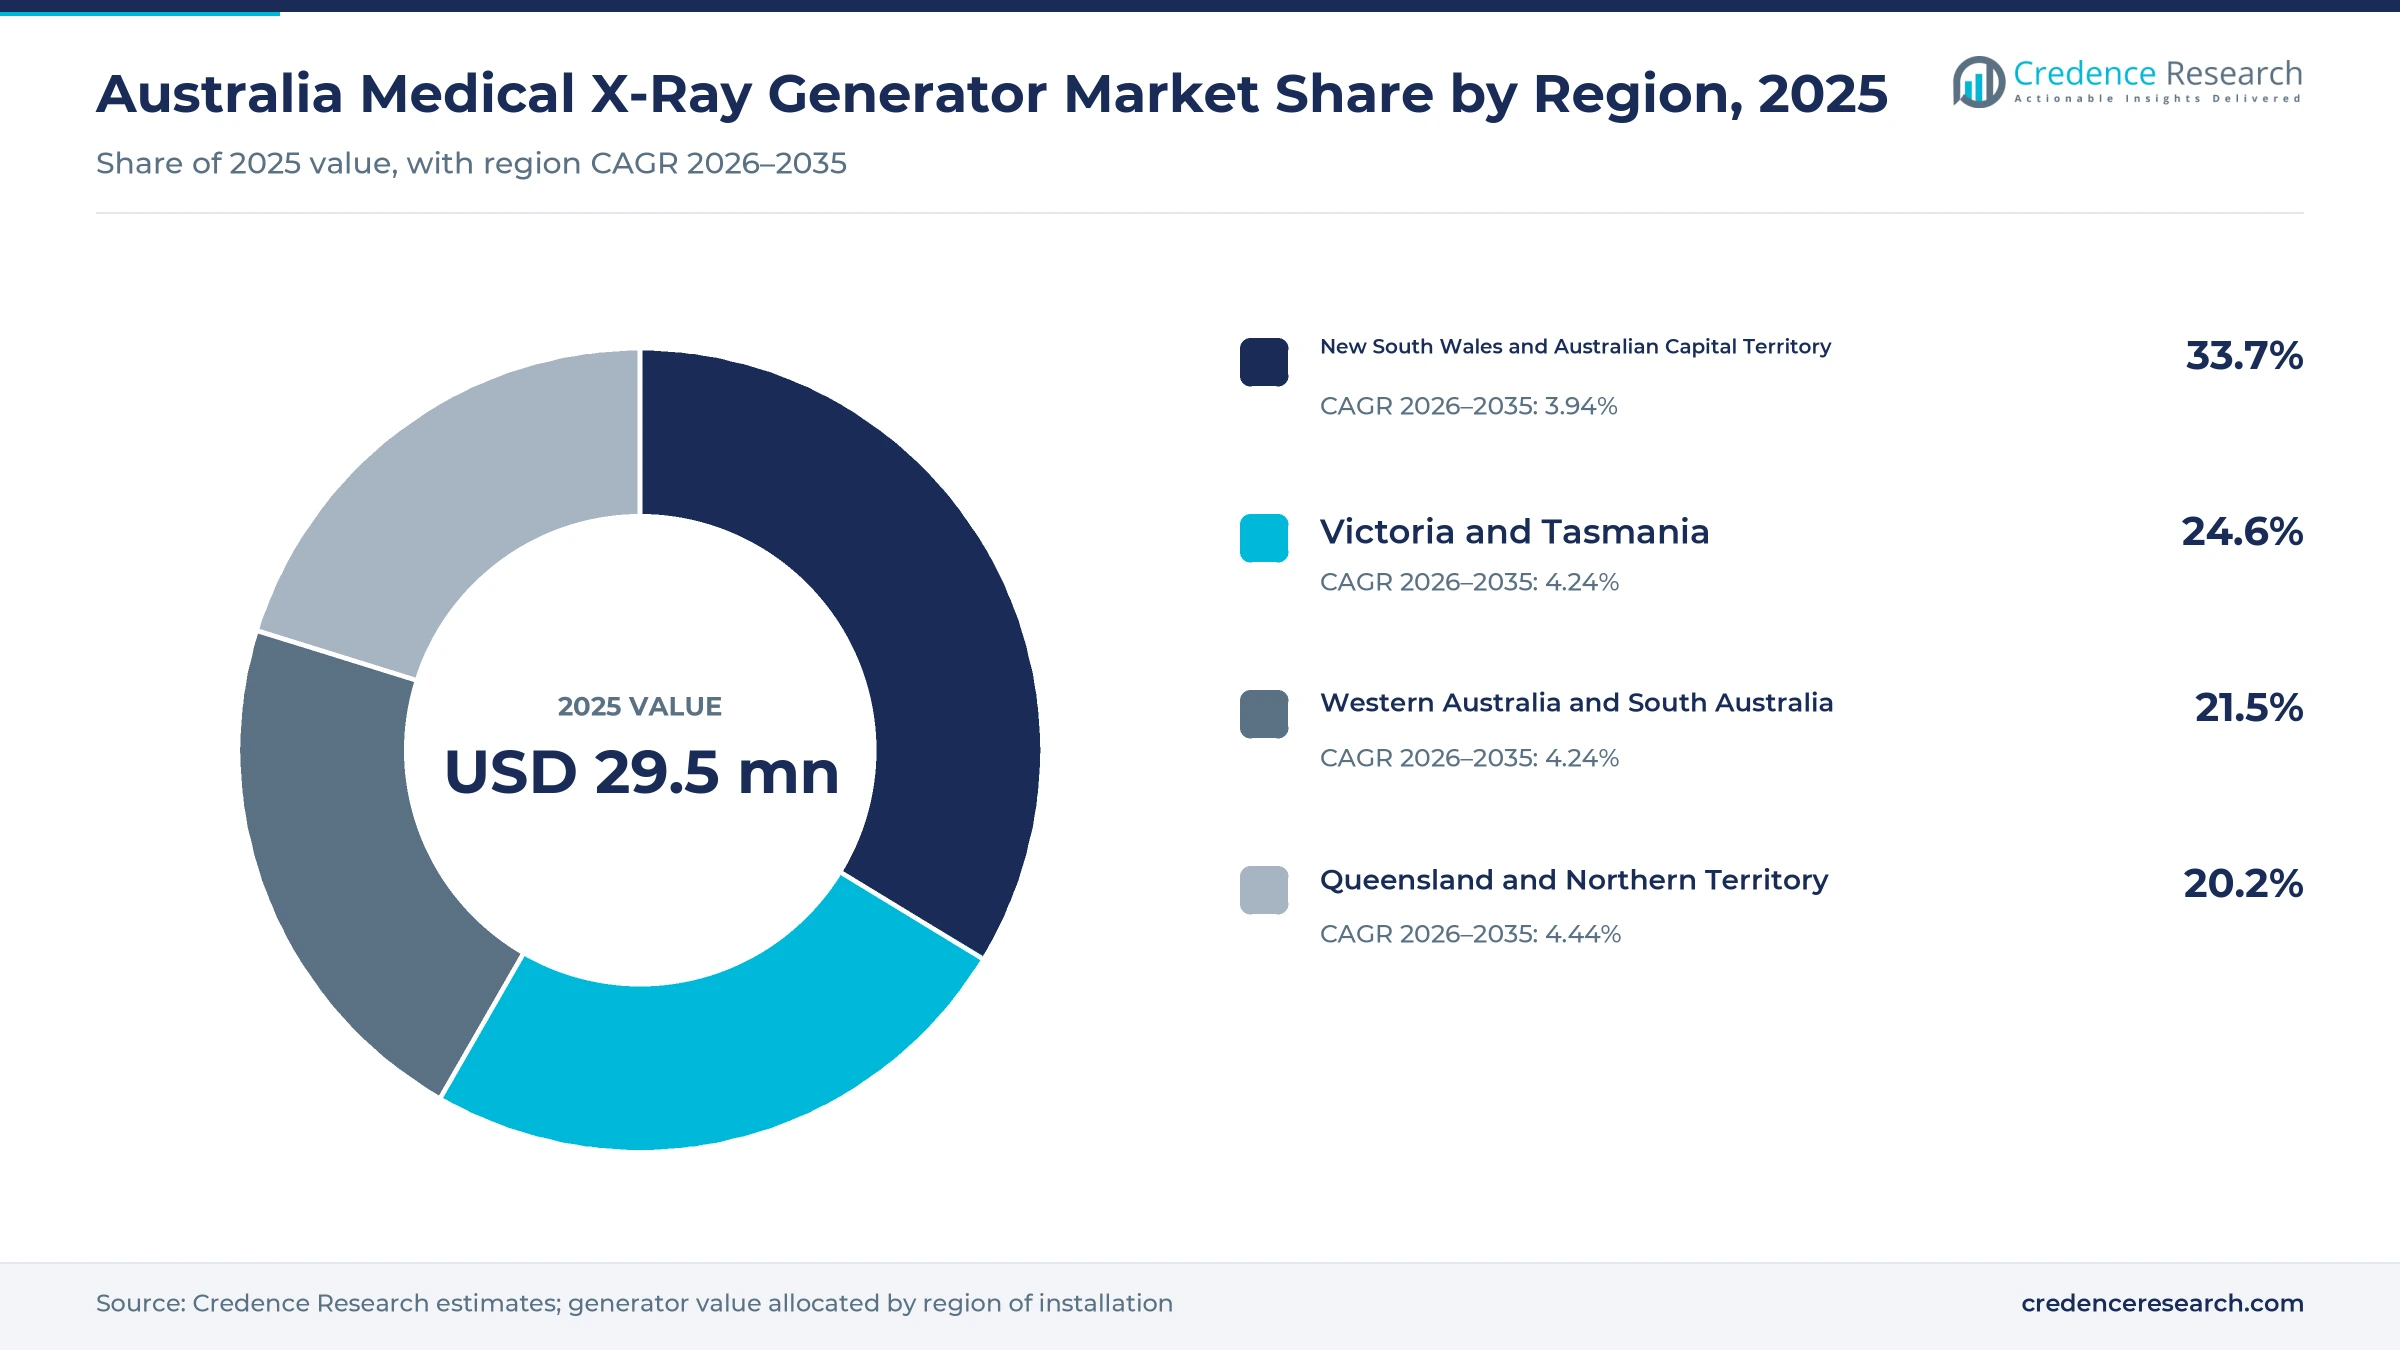
The Australia medical X-ray generator market was valued at USD 29.5 million in 2025 and is projected to increase from USD 37.0 million in 2026 to USD 53.5 million by 2035, registering a CAGR of 4.18% during 2026–2035. Demand comes from public hospitals, corporate radiology groups and community imaging services that replace fixed, mobile and portable X-ray units as Medicare equipment age rules take effect. New South Wales and the Australian Capital Territory held the largest regional share, 33.7% in 2025, because Sydney and Canberra host the largest hospital and private imaging networks. Queensland and the Northern Territory form the fastest-growing zone at 4.44% a year, as population growth and regional screening programs widen the installed base. Most generators are imported and sold as part of complete radiography systems. Indexation of diagnostic radiology rebates from July 2025 also improved the funding case for clinics that plan to replace older equipment.
Which X-ray generators does the Australian estimate cover?
The estimate measures the value of high-voltage generators used in medical radiography in Australia, whether sold as stand-alone units or as part of fixed, mobile, portable and specialty imaging systems. It covers generators bought by public hospitals, corporate radiology groups and independent clinics. Values are stated at supplier selling prices and include new and refurbished equipment sold through manufacturers and specialist distributors.
The estimate excludes X-ray tubes, detectors, software and service contracts when priced separately, as well as dental, veterinary and industrial X-ray generators. The value chain runs from global imaging makers and component suppliers through local subsidiaries and distributors to hospitals and clinics, where accredited practices bill imaging services to Medicare.
Australia Medical X-Ray Generator Market Insights
- The Australia medical X-ray generator market was valued at USD 29.5 million in 2025 and is projected to reach USD 53.5 million by 2035, registering a CAGR of 4.18% during 2026–2035.
- New South Wales and the Australian Capital Territory held a 33.7% share of 2025 value, because Sydney hosts the largest hospital and imaging networks.
- Fixed radiography generators led with a 46.0% share of 2025 value, because hospital and clinic X-ray rooms carry most general radiography volume.
- Medicare treats X-ray equipment as having a 15-year effective life and a 20-year maximum extended life, which sets a firm replacement cycle for imaging practices.
- BreastScreen Australia screened about 1.9 million women aged 50 to 74 in 2023-24, a participation rate of 52%, which keeps mammography fleets busy.
Fixed generators lead while portable units grow fastest
Why do fixed radiography generators lead demand?
Based on product type, the market is categorized into fixed radiography generators, mobile radiography generators, portable radiography generators and specialty imaging generators. Fixed radiography generators led with a 46.0% share of 2025 value, because hospital and clinic X-ray rooms handle most chest and skeletal studies. Portable radiography generators grow fastest at 5.27% a year, as aged care visits and bedside imaging call for lighter units.
How do community services gain ground on hospitals?
Based on care setting, the market is categorized into hospital imaging departments, outpatient imaging centres and community imaging services. Hospital imaging departments led with a 52.0% share of 2025 value, because public and private hospitals run the largest X-ray fleets. Community imaging services grow fastest at 5.04% a year, as mobile screening vans and aged care visits bring imaging closer to patients.
Why are corporate private providers growing faster?
Based on customer type, the market is categorized into public healthcare providers, corporate private providers and independent healthcare providers. Public healthcare providers led with a 44.0% share of 2025 value, because state health services fund hospital imaging fleets. Corporate private providers grow fastest at 4.47% a year, as radiology groups consolidate clinics and standardize equipment across larger networks.
Why are stored-energy generators growing fastest?
Based on technology, the market is categorized into mains-powered high-frequency generators, stored-energy high-frequency generators and line-frequency generators. Mains-powered high-frequency generators led with a 74.0% share of 2025 value, because fixed rooms run on hospital power supplies. Stored-energy high-frequency generators grow fastest at 5.21% a year, as battery-driven mobile units can image patients in wards and aged care homes without a high-power outlet.
| Segment Group | Leading Sub-segment | Share, 2025 | Fastest-growing Sub-segment | CAGR, 2026–2035 |
|---|---|---|---|---|
| By Product Type | Fixed radiography generators | 46.0% | Portable radiography generators | 5.27% |
| By Care Setting | Hospital imaging departments | 52.0% | Community imaging services | 5.04% |
| By Customer Type | Public healthcare providers | 44.0% | Corporate private providers | 4.47% |
| By Technology | Mains-powered high-frequency generators | 74.0% | Stored-energy high-frequency generators | 5.21% |
Request a Free Sample
Fill in your details and we'll send you a free sample report.
- Sample data tables & charts
- Research methodology
Fleet renewal, breast screening and mobile care lift demand
How does hospital fleet renewal drive generator sales?
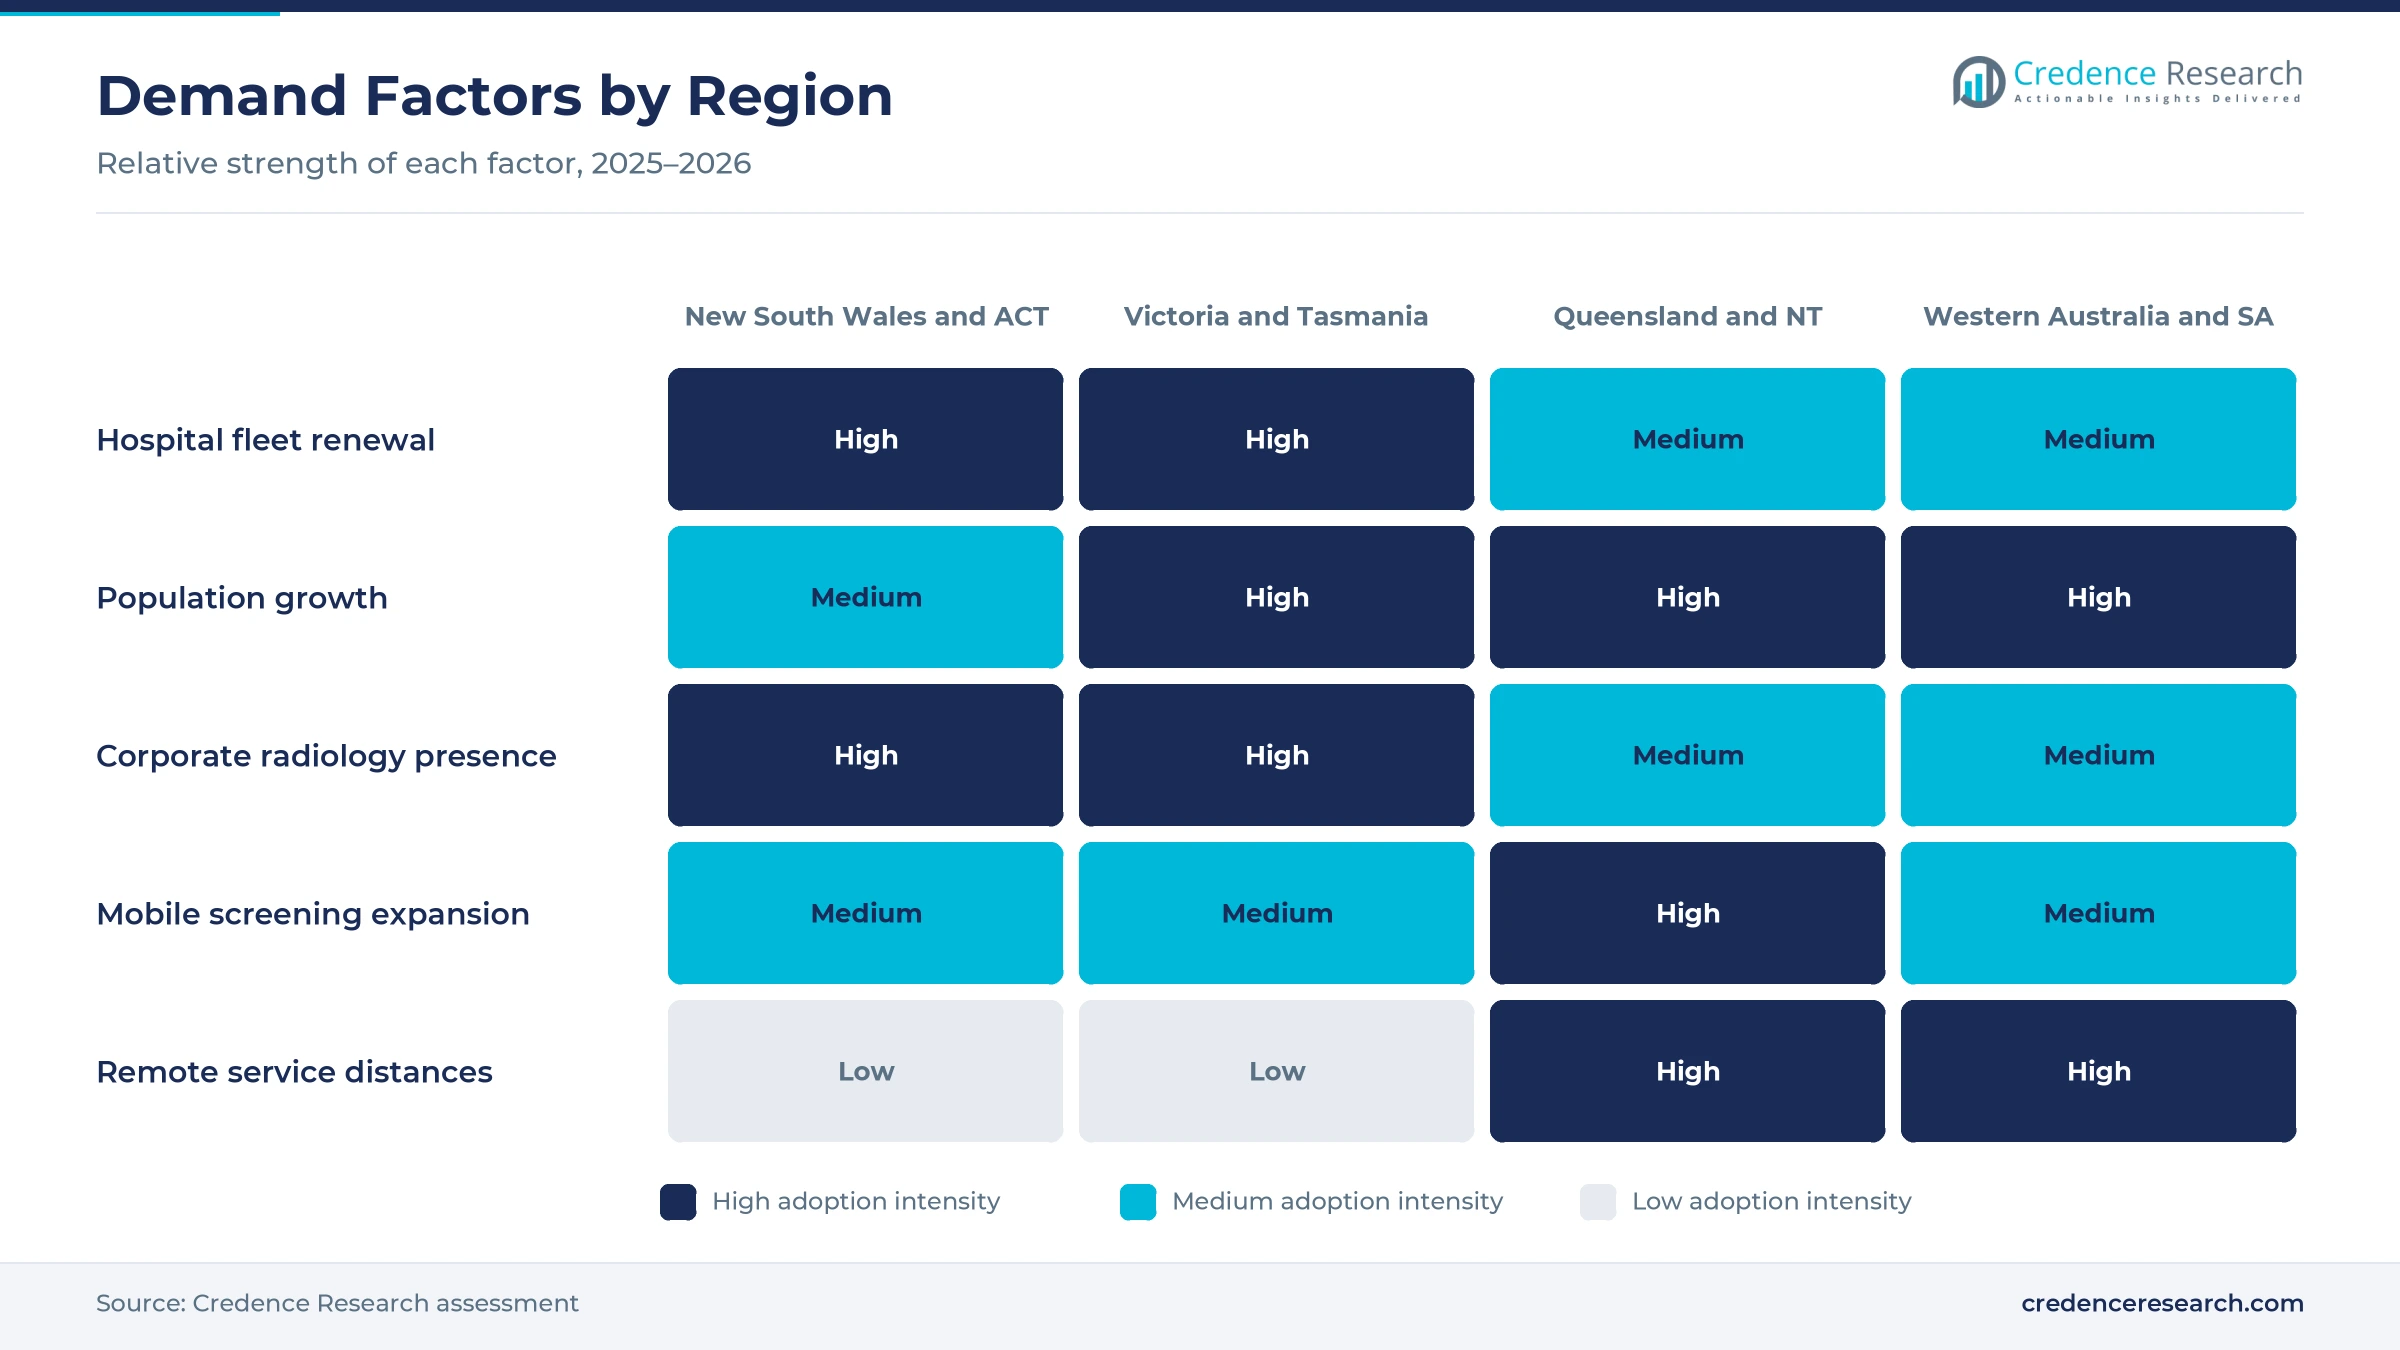
Hospital fleet renewal drives generator sales, because Medicare links benefits to the age of imaging equipment. Under capital sensitivity rules, X-ray equipment has a 15-year effective life and a 20-year maximum extended life, according to the Department of Health. Equipment past that age no longer qualifies for Medicare benefits, which forces practices to replace or upgrade older rooms. The NSW Government also plans to invest A$12.4 billion in health infrastructure over four years, with A$3.3 billion in 2025-26. In Victoria, the Medical Equipment Replacement Program reached A$367.25 million after an extra A$52.25 million in the 2025-26 budget. As a result, hospital imaging departments hold a 52.0% share of 2025 value.
Why do breast-imaging fleet requirements lift demand?
Breast-imaging fleet requirements lift demand, because national screening depends on a large and aging base of mammography units. BreastScreen Australia screened about 1.9 million women aged 50 to 74 in 2023-24, a participation rate of 52%, according to Breast Cancer Network Australia. However, that rate remains well short of the 70% benchmark set by the Australian Government, which keeps pressure on states to add capacity. Medicare also gives mammography equipment a shorter 10-year effective life and a 15-year maximum extended life. In turn, specialty imaging generators grow faster than fixed rooms, as screening services replace units more often than general X-ray rooms and add vans for regional women.
How does decentralised mobile imaging widen the customer base?
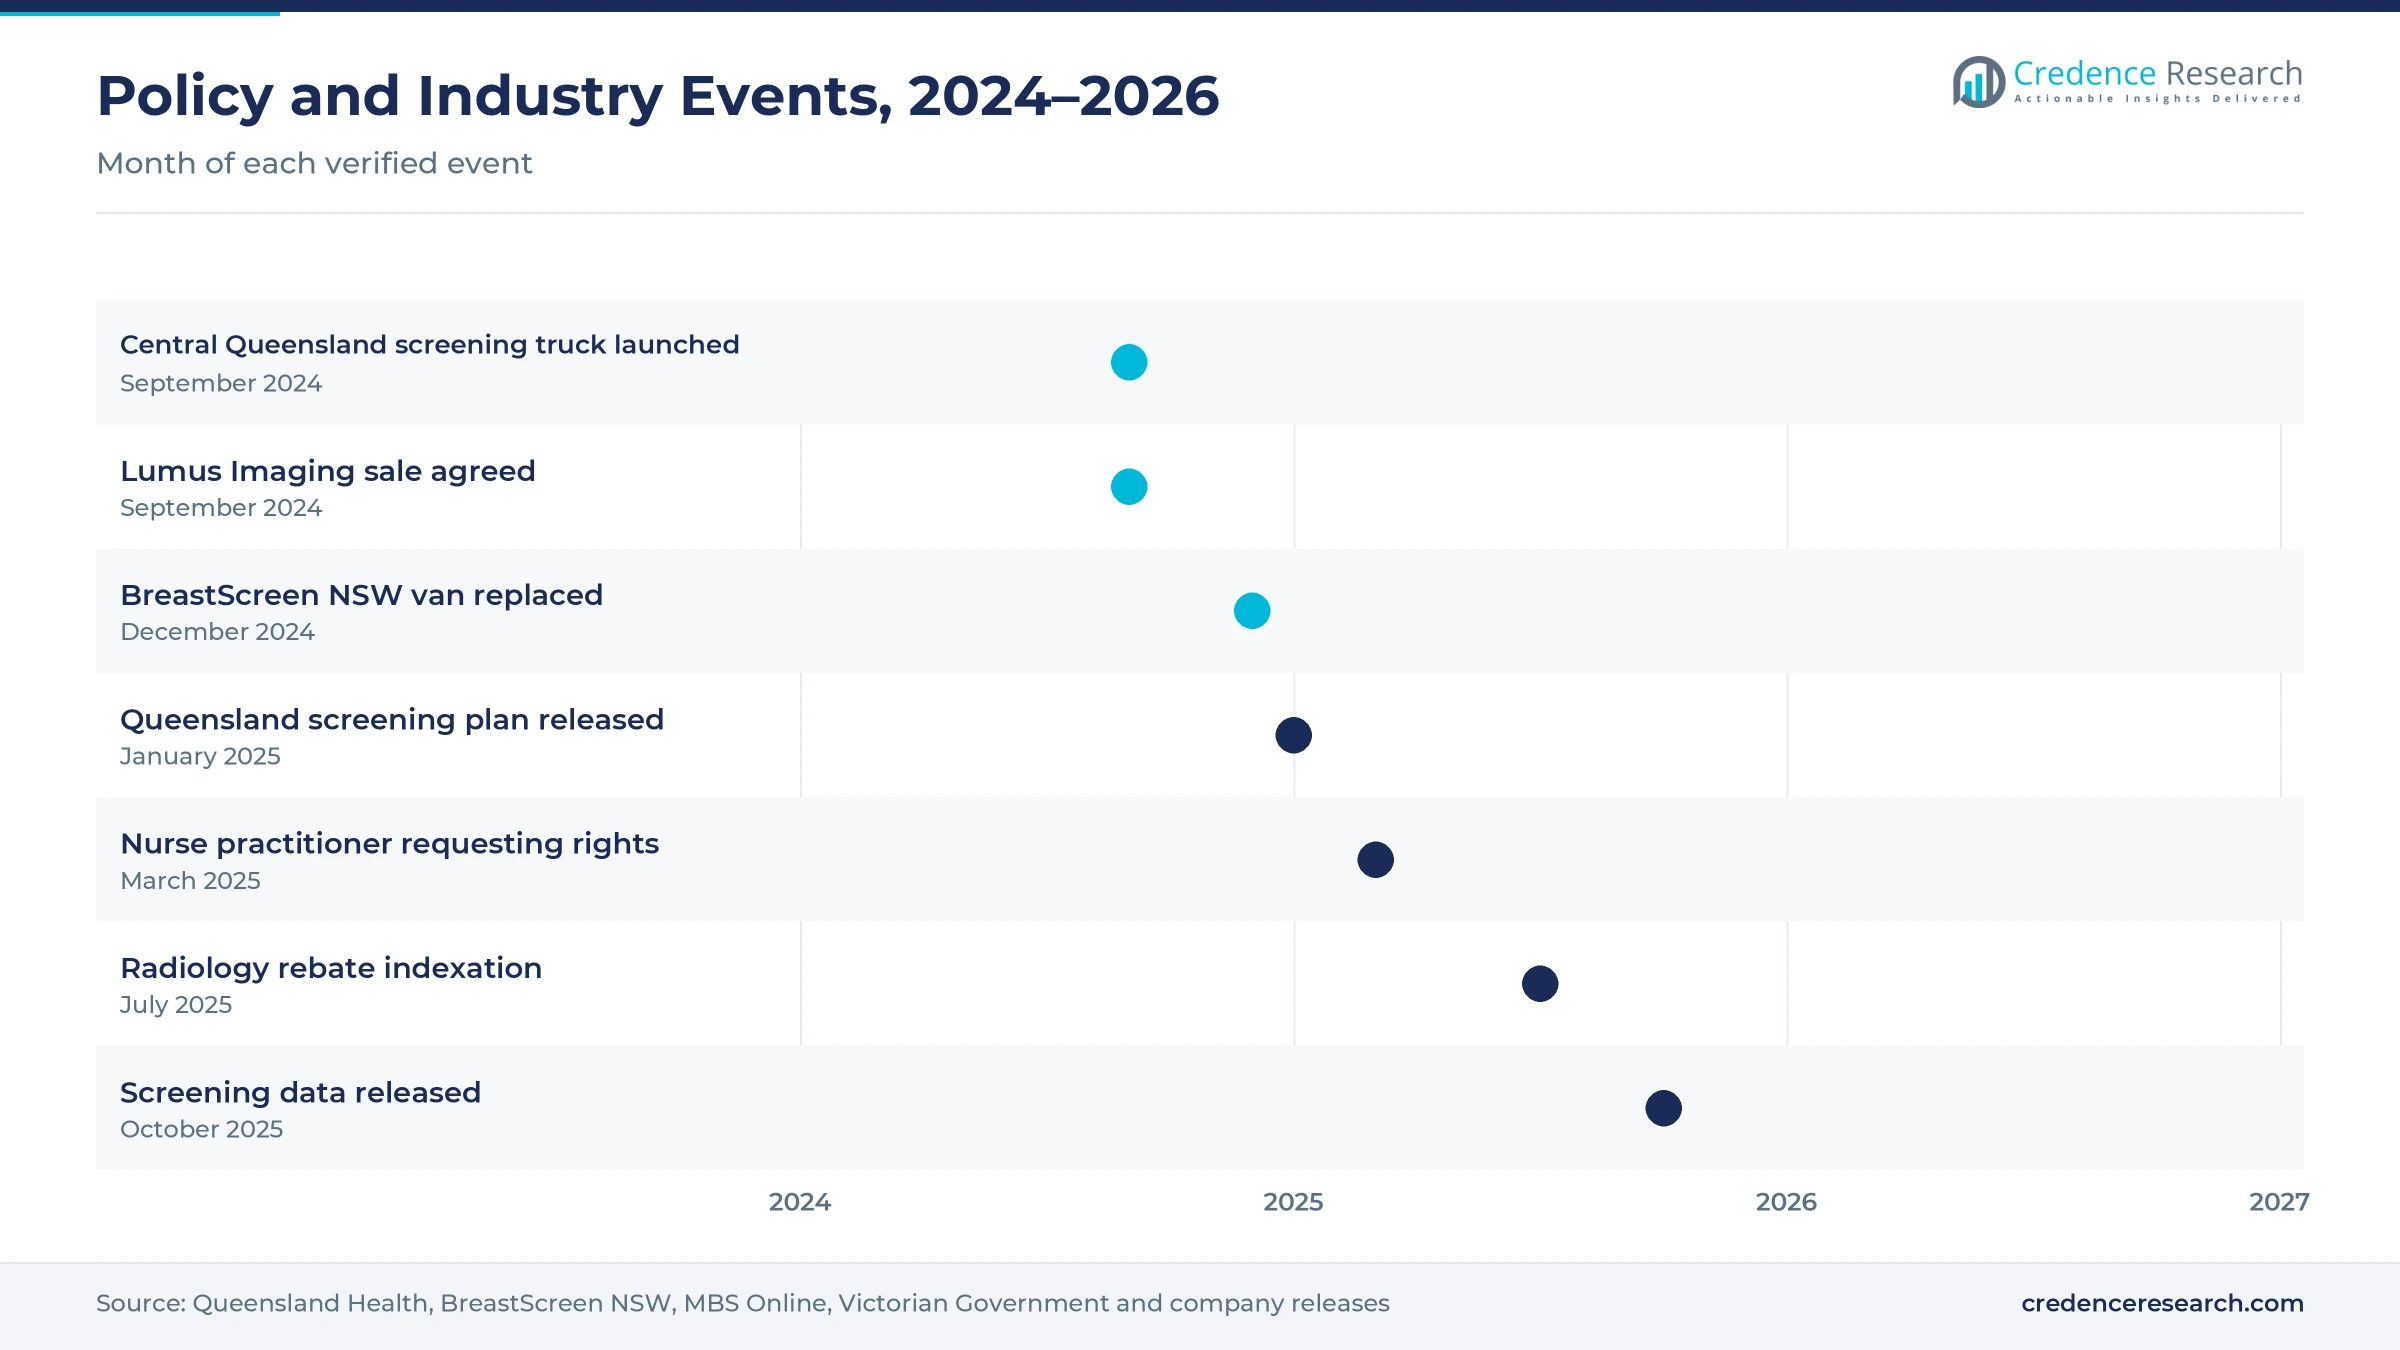
Decentralized mobile imaging widens the customer base, because residents of aged care homes can be X-rayed without a hospital transfer. Medicare item 57541 has paid a call-out fee for mobile skeletal, chest and abdominal X-rays in residential aged care since Nov. 1, 2019, according to MBS Online. The fee rose to A$84.55 from July 1, 2025, and participating nurse practitioners gained requesting rights for related items from March 1, 2025. Mobile screening trucks add further demand, and a Central Queensland unit fitted with a Siemens Revelation mammography system screens about 23 women a day. As a result, community imaging services grow at 5.04% a year.
Why does an older population raise imaging volumes?
An older population raises imaging volumes, because falls, fractures, pneumonia and heart failure become more common with age. People aged 65 and over made up about 18.1% of the Australian population in 2025, up from 17.1% in 2022, according to World Bank data. Australia's population also reached 27.92 million at March 31, 2026, growing 1.4% over the year, which adds patients across every state. Medicare indexed diagnostic radiology items by 2.4% from July 1, 2025, which supports the revenue base that practices use to fund new equipment. In turn, mobile radiography generators grow faster than fixed units, as hospitals add bedside imaging for frail patients.
Corporate imaging networks and battery units reshape buying
How is the rise of corporate imaging networks changing buying?
The rise of corporate imaging networks is changing buying, because larger groups negotiate fleet-wide equipment deals with fewer suppliers. Affinity Equity Partners agreed to buy Lumus Imaging from Healius in 2024, gaining 150 diagnostic imaging locations across Australia. Integral Diagnostics, which owned 67 clinics, also proposed a merger with Capitol Health in June 2024 that went to competition review. These deals concentrate purchasing in groups that standardize generators, detectors and service contracts across many sites. As a result, corporate private providers grow at 4.47% a year, the fastest customer rate, while independent clinics face higher pressure to join larger networks or buy refurbished imaging devices.
Why is the shift to battery-powered mobile units gaining ground?
The shift to battery-powered mobile units is gaining ground, because wards, emergency departments and aged care homes need imaging where high-power outlets are scarce. Stored-energy generators let radiographers drive a unit to the bedside and expose without a dedicated circuit. Medicare's mobile X-ray call-out fee, worth A$84.55 from July 1, 2025, covers fall-related skeletal studies, suspected pneumonia or heart failure, and suspected bowel obstruction in aged care residents. The Medical Services Advisory Committee first supported these mobile services in June 2018, and a wider pool of requesters since March 1, 2025 lifts the number of eligible visits. In turn, stored-energy high-frequency generators grow at 5.21% a year, as buyers pair them with wireless flat-panel detectors for faster bedside workflows.
Can regional screening plans open room for specialty units?
Regional screening plans open room for specialty units, because states are adding mobile vans to reach women outside major cities. The BreastScreen Queensland Strategic Plan 2025-2032 targets 60% participation by 2032, up from 51.3%, and adds a new A$1 million mobile van in Townsville, according to the Queensland Government. Eligible Queensland women are expected to rise from over 1.3 million in 2024 to over 1.6 million in 2032. BreastScreen NSW also launched a new van in December 2024 to replace one lost in the 2022 floods. As a result, suppliers of mammography systems and compact generators gain a steady stream of regional orders.
Is there room for suppliers in state equipment programs?
State equipment programs create room for suppliers, because health departments fund imaging replacement through dedicated grant rounds. Victoria announced A$35 million for 10 equipment projects across eight health services in July 2025, mostly for CT, MRI and other imaging systems. The wider Medical Equipment Replacement Program now totals A$367.25 million, which gives suppliers a clear pipeline of public tenders. In New South Wales, A$3.3 billion of health infrastructure spending in 2025-26 includes new and expanded hospitals that need fitted X-ray rooms. In turn, public healthcare providers hold a 44.0% share of 2025 value, and suppliers that bundle generators with digital radiography rooms win most tenders.
Budget limits, long equipment lives and staffing slow sales
How do public budget limits delay replacement?
Public budget limits delay replacement, because state health services must balance imaging upgrades against staffing and hospital beds. Grant rounds fund only a share of the equipment that reaches its effective life each year. As a result, some hospitals extend older rooms toward the maximum allowed age. Suppliers respond with leasing, staged upgrades and service contracts that spread the cost over several budget years and keep older systems compliant.
Why do long equipment lives slow unit sales?
Long equipment lives slow unit sales, because Medicare allows X-ray equipment to stay in use for up to 20 years. Generators are robust, so many practices replace detectors and software before the generator itself. In turn, suppliers sell fewer complete systems in years when the installed base is young. Vendors respond with upgrade paths that add digital detectors and dose software to existing rooms, then win the full replacement when the room reaches its age limit.
How do radiographer shortages limit new capacity?
Radiographer shortages limit new capacity, because extra rooms and mobile units need trained staff to run them. Regional and remote services find it hardest to recruit, which delays new screening and mobile programs. As a result, some buyers postpone fleet expansion even when funding exists. Suppliers respond with automated positioning, exposure presets and remote support that help smaller teams run more studies each day with consistent image quality.
Why does refurbished equipment pressure new prices?
Refurbished equipment pressures new prices, because independent clinics can buy used rooms at a fraction of the cost. However, Medicare counts the age of used equipment from its first use in Australia or from the manufacture of its oldest component, which limits how long refurbished units can earn benefits. In turn, suppliers of new units stress longer eligible life, warranty cover and lower dose, while refurbishers focus on low-volume rural sites.
New South Wales leads while Queensland grows fastest
| Region | Value, 2025 (USD million) | Share, 2025 | CAGR, 2026–2035 |
|---|---|---|---|
| New South Wales and Australian Capital Territory | 9.9 | 33.7% | 3.94% |
| Victoria and Tasmania | 7.3 | 24.6% | 4.24% |
| Western Australia and South Australia | 6.3 | 21.5% | 4.24% |
| Queensland and Northern Territory | 6.0 | 20.2% | 4.44% |
Why does New South Wales hold the largest share?
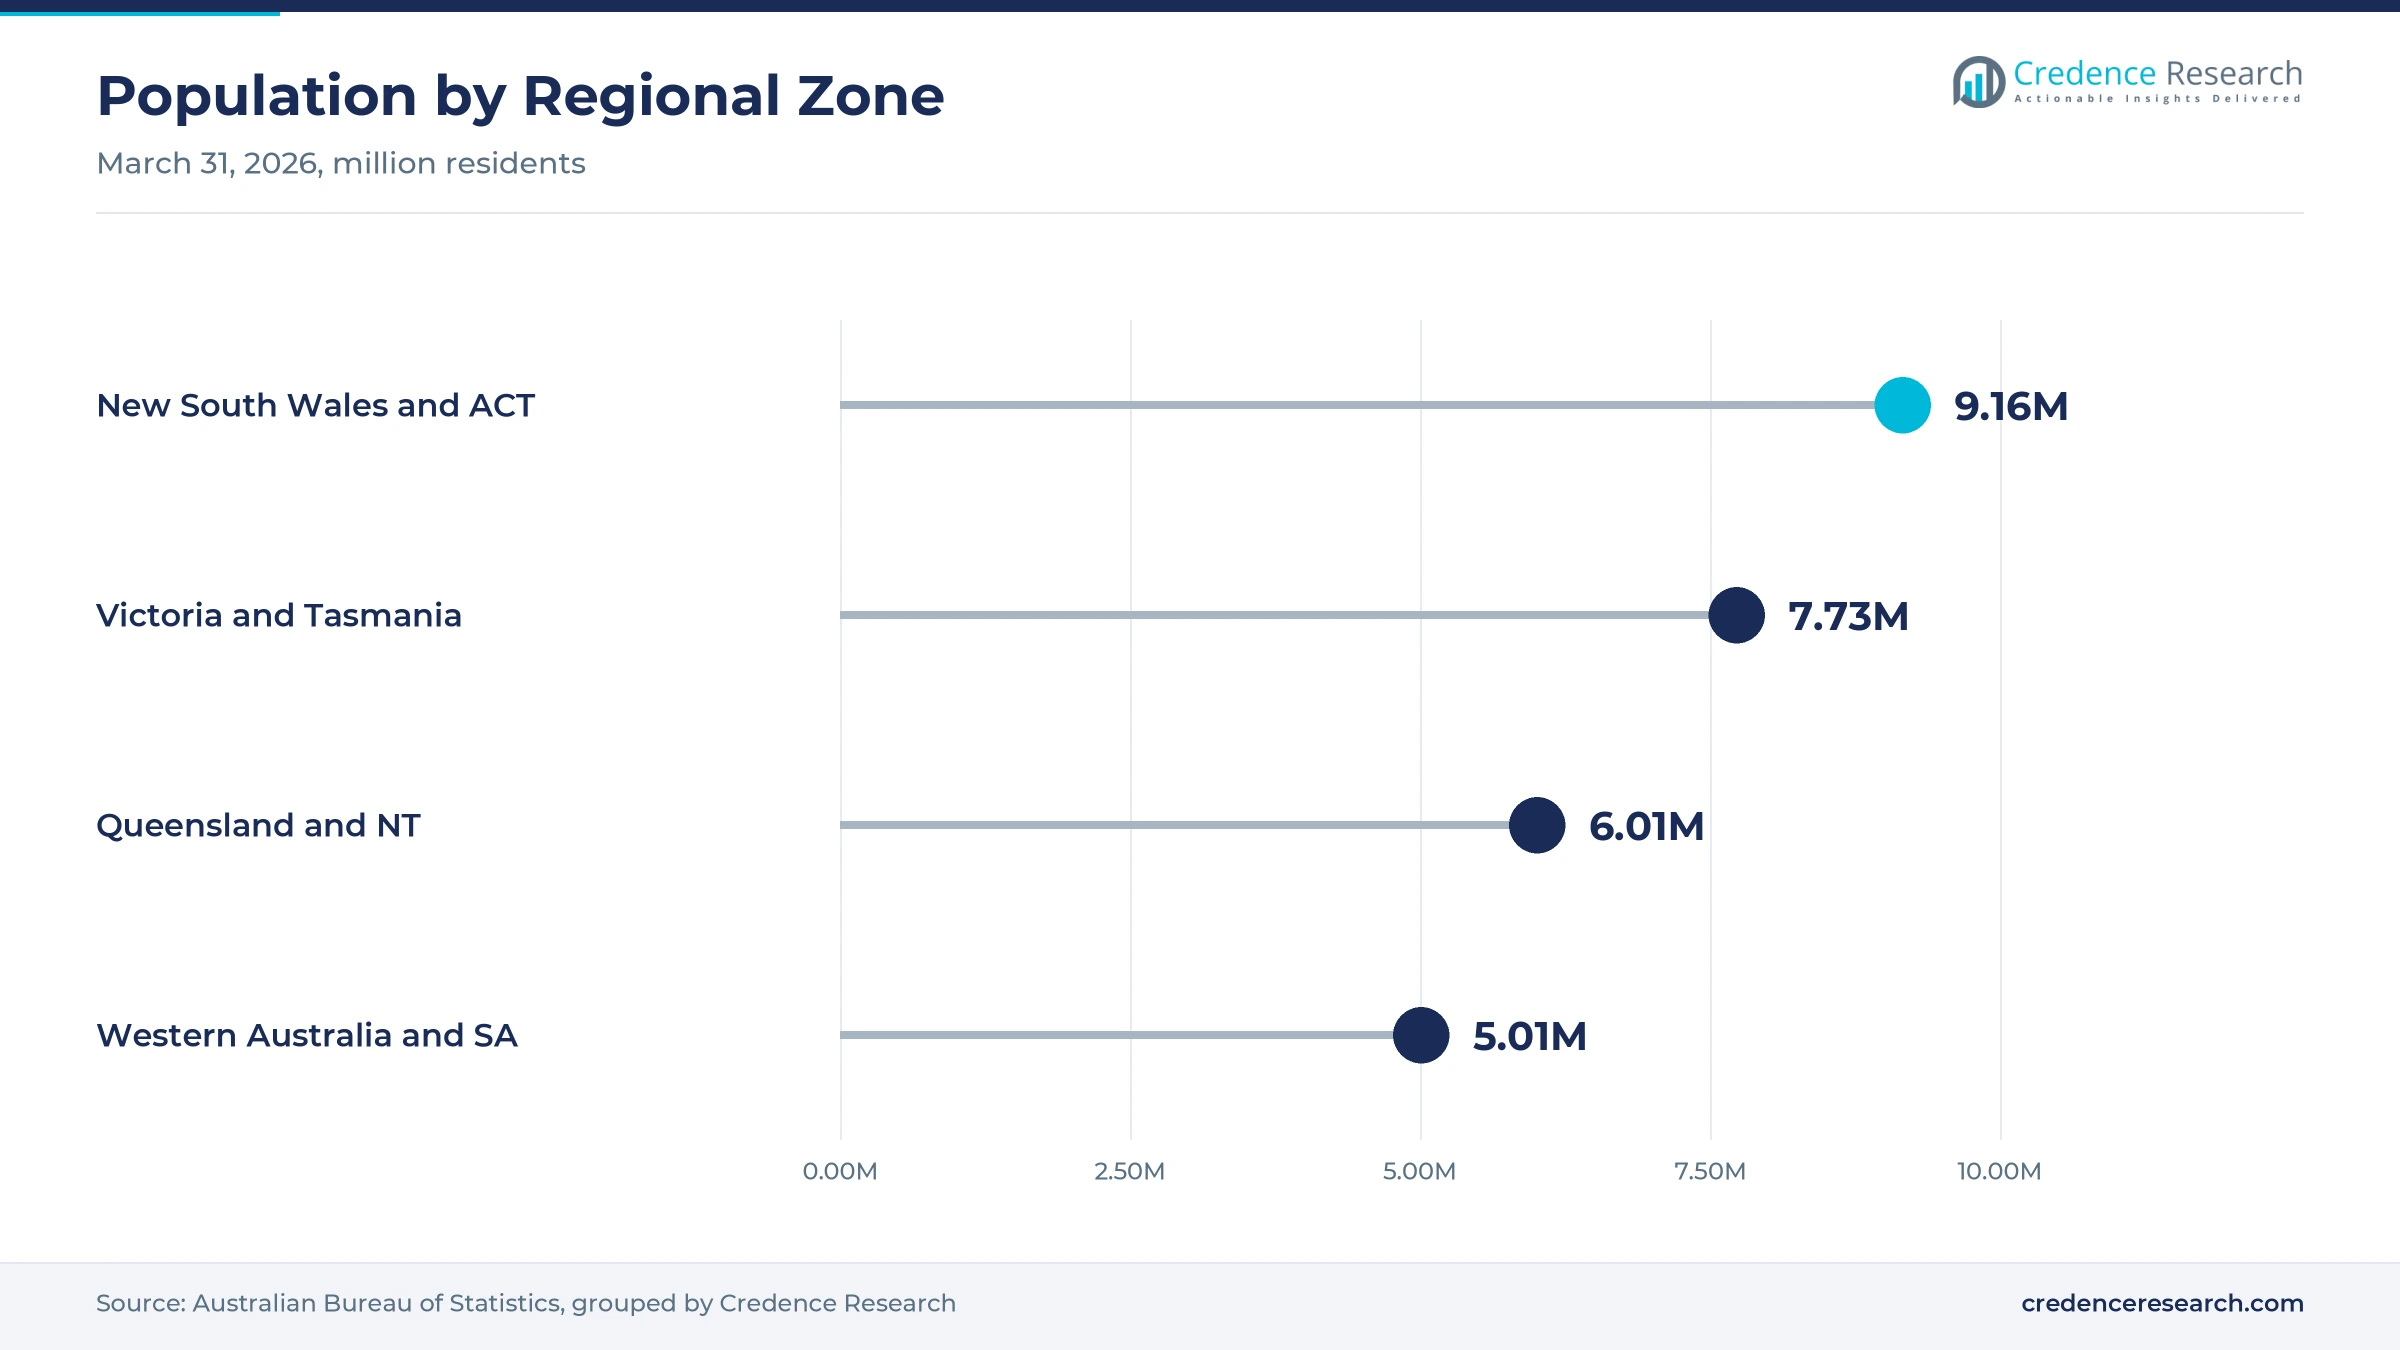
New South Wales and the Australian Capital Territory held a 33.7% share of 2025 value and grow at 3.94% a year, because Sydney and Canberra host the largest public hospital and private radiology networks. The two jurisdictions had about 9.16 million residents in March 2026. However, growth is slower than in Queensland because the installed base is mature and replacement, rather than new rooms, drives most orders. The NSW plan to spend A$12.4 billion on health infrastructure over four years still supports steady demand for fitted X-ray rooms in new and expanded hospitals.
How do Victoria and Tasmania fund imaging upgrades?
Victoria and Tasmania held a 24.6% share of 2025 value and grow at 4.24% a year, because Melbourne hospitals and radiology groups run large X-ray fleets. Victoria's population grew 1.6% in the year to March 2026, which adds imaging demand. As a result, state equipment grants and private clinic openings keep orders steady, while Tasmania adds smaller regional replacement projects. The state equipment program now totals A$367.25 million, which gives hospitals a regular source of funding for imaging upgrades.
Why are Queensland and the Northern Territory growing fastest?
Queensland and the Northern Territory held a 20.2% share of 2025 value and grow fastest at 4.44% a year, because the two jurisdictions had about 6.01 million residents and growing regional needs. Queensland's population grew 1.6% in the year to March 2026. In turn, new screening vans, regional hospital upgrades and long travel distances favor mobile and portable generators. The state screening plan also expects eligible women to rise from over 1.3 million in 2024 to over 1.6 million in 2032.
What drives demand in Western Australia and South Australia?
Western Australia and South Australia held a 21.5% share of 2025 value and grow at 4.24% a year, because Perth and Adelaide host major teaching hospitals and private imaging groups. Western Australia had the fastest population growth at 2.1% in the year to March 2026. As a result, remote mining and farming regions add demand for mobile units that travel long distances. Long transfer times to city hospitals also favor local imaging in regional towns.
Screening vans, rebate changes and deals marked 2024 to 2026
| Development | Status and market relevance |
|---|---|
| In September 2024, Central Queensland Hospital and Health Service put a new mobile breast screening unit on the road. | Fitted with a Siemens Revelation mammography system and screens about 23 women a day |
| In September 2024, Healius agreed to sell Lumus Imaging to Affinity Equity Partners. | Moved 150 diagnostic imaging locations into a private equity-backed network |
| In January 2025, the Queensland Government released the BreastScreen Queensland Strategic Plan 2025-2032. | Targets 60% participation by 2032 and adds a mobile van in Townsville |
| In July 2025, Medicare indexed diagnostic radiology items by 2.4% and raised the mobile X-ray call-out fee. | Improves funding for practices that replace equipment |
| In July 2025, Victoria announced A$35 million for 10 medical equipment projects across eight health services. | Adds public tender demand for imaging systems |
Battery power and digital detectors change generator design
- Stored-energy generators use onboard batteries to deliver exposures without a high-power outlet, which suits wards and aged care visits.
- High-frequency inverters produce a stable tube voltage with low ripple, which improves image quality and reduces patient dose.
- Wireless digital detectors pair with mobile and fixed generators to show images within seconds, which speeds bedside workflows.
- Automatic exposure control adjusts exposure to patient size and anatomy, which helps smaller teams deliver consistent image quality.
Need a Custom Version of This Report?
Tailor the scope, geography, or segments to your exact requirements.
- Custom geography or segment scope
- Direct access to our analyst team
Global imaging makers compete through local service networks
Competition is led by global imaging makers that sell complete radiography systems through Australian subsidiaries and service teams. Siemens Healthineers supplies mammography and radiography systems, including a Revelation unit fitted to a Central Queensland screening truck in 2024. Philips supplied DigitalDiagnost C90 rooms to Perth Children's Hospital, while Canon Medical Systems ANZ, based in Castle Hill, sells general, digital and fluoroscopy X-ray equipment. Fujifilm Australia sponsors digital X-ray systems on the national device register, and GE HealthCare runs a local Australian business. Rivals compete on image quality, dose reduction, service response times, upgrade paths and fleet pricing for corporate radiology groups, while specialist distributors and refurbishers serve price-sensitive independent clinics.
Companies profiled and their roles in this market
| Company | Type | Role in the market |
|---|---|---|
| Siemens Healthineers | Imaging system maker | Supplies mammography units for Queensland mobile screening |
| Philips | Imaging system maker | Supplied digital X-ray rooms to Perth Children's Hospital |
| Canon Medical Systems | Imaging system maker | Sells general, digital and fluoroscopy X-ray from Castle Hill |
| Fujifilm Healthcare | Imaging system maker | Sponsors digital X-ray systems through Fujifilm Australia |
| GE HealthCare | Imaging system maker | Offers mobile and fixed X-ray through its Australian business |
Credence Research view on Australian generator demand
Credence Research's view is that Australian demand for medical X-ray generators will grow steadily because Medicare age rules force regular replacement and an older population needs more imaging. Fixed rooms remain the base of the market, while portable and stored-energy units gain share as aged care visits and bedside imaging expand. Screening programs that target 60% to 70% participation will keep mammography fleets growing. However, public budget limits, long equipment lives and staffing gaps will slow orders. Suppliers with strong service networks and fleet deals should gain share fastest.
Medicare age rules and screening data anchor the sizing
The report uses 2025 as the base year on a calendar basis, and market values come from the Credence Research model. That model combines Medicare equipment age rules and rebate changes, screening participation data, population statistics, World Bank age data, state budget papers and company information on products and installations. Segment splits and regional growth rates are Credence Research estimates, while regional shares follow the client-defined split. Sources used are public reports, official statistics, trade press and company websites, and no interviews or surveys were used.
Replacement cycles and mobile imaging carry demand to 2035
Sales of medical X-ray generators in Australia are expected to reach USD 53.5 million by 2035, a 4.18% CAGR during 2026–2035, as fleet renewal, screening growth and mobile imaging keep demand rising. Growth should stay steady through 2028 while hospitals replace rooms that reach their Medicare age limit. After that, portable and stored-energy units will carry more growth as aged care and regional services expand. Tighter state budgets would lower this outlook, while faster screening expansion would raise it. Suppliers with local service teams and fleet pricing are expected to gain the most.
Frequently Asked Questions
How big is the Australia medical X-ray generator market?
Which product type leads generator demand in Australia?
Which region leads the Australia medical X-ray generator market?
How do Medicare rules affect generator replacement?
What drives demand for X-ray generators in Australia?
Which technology is growing fastest?
Who are the leading suppliers of X-ray generators in Australia?
What are the main challenges for generator suppliers?
Table of Content
Chapter 1 Market Segmentation
- 1.1 Segmentation Framework
- 1.1.1 Product and Service Classification
- 1.1.2 Application and End-Use Classification
- 1.1.3 Technology and Solution Classification
- 1.1.4 Customer and Distribution Channel Classification
- 1.1.5 Geographic Segmentation
- 1.1.6 Market Segment Definitions and Boundaries
- 1.2 By Product Type
- 1.2.1 Fixed radiography generators
- 1.2.2 Mobile radiography generators
- 1.2.3 Portable radiography generators
- 1.2.4 Specialty imaging generators
- 1.3 By Care Setting
- 1.3.1 Hospital imaging departments
- 1.3.2 Outpatient imaging centres
- 1.3.3 Community imaging services
- 1.4 By Customer Type
- 1.4.1 Public healthcare providers
- 1.4.2 Corporate private providers
- 1.4.3 Independent healthcare providers
- 1.5 By Technology
- 1.5.1 Mains-powered high-frequency generators
- 1.5.2 Stored-energy high-frequency generators
- 1.5.3 Line-frequency generators
Chapter 2 Introduction
- 2.1 Report Objectives and Scope
- 2.2 Product Definition and Industry Terminology
- 2.3 Market Inclusions and Exclusions
- 2.4 Research Process
- 2.4.1 Primary Research and Expert Interviews
- 2.4.2 Secondary Research and Source Review
- 2.4.3 Top-Down and Bottom-Up Estimation
- 2.4.4 Data Triangulation and Verification
- 2.5 Market Size Measurement Basis
- 2.5.1 2025: USD 29.5 million → 2035: USD 53.5 million
- 2.6 Historical and Forecast Reference Periods
- 2.6.1 Historical Period: 2018-2025
- 2.6.2 Base Year: 2025
- 2.6.3 Forecast Period: 2025-2035
- 2.7 Research Assumptions and Limitations
Chapter 3 Executive Summary
- 3.1 Market Snapshot and Key Findings
- 3.2 Base-Year Market Size, 2025
- 3.3 Forecast Market Size, 2035
- 3.4 Revenue and Volume Growth Outlook
- 3.5 Key Demand and Supply Indicators
- 3.6 Leading Market Segments
- 3.7 Fastest-Growing Market Opportunities
- 3.8 Regional Performance Highlights
- 3.9 Technology and Industry Transformation
- 3.10 Competitive Landscape Summary
- 3.11 Analyst View and Strategic Implications
Chapter 4 Australia Medical X-Ray Generator Market Trends and Developments
- 4.1 Historical Industry Development, 2018-2025
- 4.2 Recent Market Trends and Developments
- 4.3 Demand and Customer Behavior Trends
- 4.4 Technology and Product Innovation
- 4.5 Artificial Intelligence, Automation and Digitalization
- 4.6 Local Manufacturing and Supply Chain Realignment
- 4.7 Industry Partnerships, Mergers and Acquisitions
- 4.8 Sustainability and Circular Economy Developments
- 4.9 Government and Private Sector Investment Trends
- 4.10 Emerging Business Models and Commercialization
- 4.11 Industry Developments and Announcements
Chapter 5 Australia Medical X-Ray Generator Market Production, Supply and Demand Analysis
- 5.1 Demand Trend and Consumption Analysis, 2018-2025
- 5.2 Demand Forecast, 2025-2035
- 5.3 Production and Output Trend, 2018-2025
- 5.4 Production and Output Forecast, 2025-2035
- 5.5 Installed Capacity and Capacity Utilization
- 5.6 Company-Wise Production Plants and Statistics
- 5.6.1 Installed Production Capacity
- 5.6.2 Actual Production
- 5.6.3 Planned Capacity and Expansion Targets
- 5.7 Supply Chain Structure and Procurement Trends
- 5.8 Supply-Demand Gap and Bottlenecks
- 5.9 Import Dependence and Sourcing Structure
- 5.10 Contract Manufacturing and Outsourcing
- 5.11 Regional Supply and Demand Concentration
Chapter 6 Australia Medical X-Ray Generator Market Pricing Analysis
- 6.1 Pricing Structure and Measurement
- 6.2 Historical Pricing Trends, 2018-2025
- 6.3 Pricing Outlook, 2025-2035
- 6.4 Average Selling Price and Unit Economics
- 6.5 Pricing by Product and Market Segment
- 6.6 Geographic Pricing Differences
- 6.7 Key Input, Energy, Labor and Logistics Costs
- 6.8 Contract Pricing and Purchasing Models
- 6.9 Pricing Sensitivity and Competitive Positioning
- 6.10 Price, Margin and Profitability Implications
Chapter 7 Australia Medical X-Ray Generator Market Dynamics
- 7.1 Market Growth Drivers
- 7.1.1 Demand-Side Drivers
- 7.1.2 Technology and Innovation Drivers
- 7.1.3 Infrastructure and Investment Drivers
- 7.1.4 Regulatory and Policy Drivers
- 7.2 Market Restraints
- 7.2.1 Cost and Affordability Constraints
- 7.2.2 Technology and Adoption Barriers
- 7.2.3 Supply Chain and Operational Constraints
- 7.3 Market Challenges
- 7.3.1 Competitive Pressure and Margin Erosion
- 7.3.2 Skills, Infrastructure and Implementation Gaps
- 7.4 Emerging Market Opportunities
- 7.5 Market Dynamics Impact and Time-Horizon Assessment
Chapter 8 Australia Medical X-Ray Generator Value Chain Analysis
- 8.1 Industry Value Chain Overview
- 8.2 Upstream Suppliers and Critical Inputs
- 8.3 Technology and Component Providers
- 8.4 Manufacturing or Service Delivery
- 8.5 Distribution, Channel Partners and Integrators
- 8.6 Downstream Applications and End Users
- 8.7 Value Addition and Profit Pools
- 8.8 Vertical Integration and Outsourcing
- 8.9 Supplier Concentration and Risk
- 8.10 Supply Chain Localization and Resilience
Chapter 9 Australia Medical X-Ray Generator Market Regulations and Policies
- 9.1 Relevant Laws, Standards and Compliance Frameworks
- 9.2 Product, Service, Safety and Quality Requirements
- 9.3 Government Policies, Incentives and Subsidies
- 9.4 Imports, Exports and Trade Barriers
- 9.5 Public Procurement and Local Content Requirements
- 9.6 Environmental and Sustainability Compliance
- 9.7 Upcoming Policy Changes and Market Implications
Chapter 10 Australia Medical X-Ray Generator Market Hotspots and Opportunities
- 10.1 Market Opportunity Mapping and Growth Hotspots
- 10.2 High-Growth Applications and Customer Groups
- 10.3 Underserved Markets and White-Space Opportunities
- 10.4 Emerging Technology and Product Opportunities
- 10.5 New Capacity and Investment Hotspots
- 10.6 Market Entry and Expansion Opportunities
- 10.7 Distribution and Partnership Opportunities
- 10.8 Near-Term and Long-Term Commercial Potential
- 10.9 Opportunity Attractiveness and Execution Risks
Chapter 11 Australia Medical X-Ray Generator Market Outlook, 2025-2035
- 11.1 Market Size and Analysis
- 11.1.1 Revenue (Market Measurement: 2025: USD 29.5 million → 2035: USD 53.5 million)
- 11.1.2 Market Volume and Quantity Sold
- 11.1.3 Historical Market Size, 2018-2025
- 11.1.4 Base-Year Market Size, 2025
- 11.2 Market Forecast, 2025-2035
- 11.2.1 Revenue Forecast to 2035
- 11.2.2 Volume Forecast to 2035
- 11.2.3 CAGR and Year-on-Year Growth
- 11.2.4 Incremental Revenue Opportunity
- 11.3 Forecast Assumptions and Scenario Analysis
- 11.3.1 Base-Case Forecast
- 11.3.2 Optimistic and Conservative Scenarios
- 11.3.3 Technology, Pricing and Policy Sensitivities
- 11.4 Market Attractiveness and Growth Outlook
Chapter 12 Australia Medical X-Ray Generator Market Segmentation and Outlook
- 12.1 Segmentation Summary and Market Shares, 2025
- 12.2 Largest and Fastest-Growing Segments
- 12.3 By Product Type - Market Size and Forecast, 2025-2035
- 12.3.1 Segment Definition and Scope
- 12.3.2 Historical Market Size, 2018-2025
- 12.3.3 Revenue Forecast, 2025-2035
- 12.3.4 Volume Forecast, 2025-2035
- 12.3.5 Base-Year Market Share, 2025
- 12.3.6 Segment CAGR and Growth Drivers
- 12.3.7 Subsegment Market Size and Forecast
- 12.3.7.1 Fixed radiography generators
- 12.3.7.2 Mobile radiography generators
- 12.3.7.3 Portable radiography generators
- 12.3.7.4 Specialty imaging generators
- 12.3.8 Subsegment Pricing and Adoption Trends
- 12.3.9 Leading Suppliers and Competition
- 12.3.10 Regional Demand and Opportunities
- 12.4 By Care Setting - Market Size and Forecast, 2025-2035
- 12.4.1 Segment Definition and Scope
- 12.4.2 Historical Market Size, 2018-2025
- 12.4.3 Revenue Forecast, 2025-2035
- 12.4.4 Volume Forecast, 2025-2035
- 12.4.5 Base-Year Market Share, 2025
- 12.4.6 Segment CAGR and Growth Drivers
- 12.4.7 Subsegment Market Size and Forecast
- 12.4.7.1 Hospital imaging departments
- 12.4.7.2 Outpatient imaging centres
- 12.4.7.3 Community imaging services
- 12.4.8 Subsegment Pricing and Adoption Trends
- 12.4.9 Leading Suppliers and Competition
- 12.4.10 Regional Demand and Opportunities
- 12.5 By Customer Type - Market Size and Forecast, 2025-2035
- 12.5.1 Segment Definition and Scope
- 12.5.2 Historical Market Size, 2018-2025
- 12.5.3 Revenue Forecast, 2025-2035
- 12.5.4 Volume Forecast, 2025-2035
- 12.5.5 Base-Year Market Share, 2025
- 12.5.6 Segment CAGR and Growth Drivers
- 12.5.7 Subsegment Market Size and Forecast
- 12.5.7.1 Public healthcare providers
- 12.5.7.2 Corporate private providers
- 12.5.7.3 Independent healthcare providers
- 12.5.8 Subsegment Pricing and Adoption Trends
- 12.5.9 Leading Suppliers and Competition
- 12.5.10 Regional Demand and Opportunities
- 12.6 By Technology - Market Size and Forecast, 2025-2035
- 12.6.1 Segment Definition and Scope
- 12.6.2 Historical Market Size, 2018-2025
- 12.6.3 Revenue Forecast, 2025-2035
- 12.6.4 Volume Forecast, 2025-2035
- 12.6.5 Base-Year Market Share, 2025
- 12.6.6 Segment CAGR and Growth Drivers
- 12.6.7 Subsegment Market Size and Forecast
- 12.6.7.1 Mains-powered high-frequency generators
- 12.6.7.2 Stored-energy high-frequency generators
- 12.6.7.3 Line-frequency generators
- 12.6.8 Subsegment Pricing and Adoption Trends
- 12.6.9 Leading Suppliers and Competition
- 12.6.10 Regional Demand and Opportunities
- 12.7 Segment Growth Comparison
- 12.8 Segment Attractiveness and Priority Matrix
Chapter 13 Australia Medical X-Ray Generator End-Use and Application Market Outlook
- 13.1 End-Use Industry and Customer Demand Structure
- 13.2 Leading Applications and Customer Groups
- 13.3 End-Use Market Size, Share and Forecast
- 13.4 Major End-Use Industry Deep Dives
- 13.4.1 Customer Requirements and Use Cases
- 13.4.2 Demand and Replacement Cycles
- 13.4.3 Technical and Regulatory Considerations
- 13.4.4 Purchasing and Procurement Models
- 13.4.5 Leading Vendors and Distribution Channels
- 13.4.6 Forecast and Commercial Opportunities
- 13.5 Emerging Applications and Cross-Segment Demand
- 13.6 End-Use Industry Investment Priorities
Chapter 14 Australia Medical X-Ray Generator Geographic Market Outlook, 2025-2035
- 14.1 Domestic Market Distribution and Demand Clusters
- 14.2 State- or Province-Wise Market Size and Forecast, 2025-2035
- 14.3 City and Metropolitan Market Outlook
- 14.4 Industrial, Manufacturing and Commercial Clusters
- 14.5 Geographic Concentration of Key End Users
- 14.6 Local Pricing and Purchasing Differences
- 14.7 Domestic Production Facilities and Capacity Map
- 14.8 Local Infrastructure and Project Pipeline
- 14.9 State-Level Policy and Incentive Differences
- 14.10 Subnational Investment Hotspots and Opportunities
- 14.11 Distribution and Logistics Networks
- 14.12 Domestic Competitive Footprint
Chapter 15 Australia Medical X-Ray Generator Technology, Innovation and Sustainability Outlook
- 15.1 Technology Landscape and Maturity
- 15.2 Product, Process and Service Innovation
- 15.3 AI, Automation and Digital Tools in the Industry
- 15.4 Technology Adoption and Performance Benchmarking
- 15.5 Innovation Pipeline and R&D Investment
- 15.6 Patent and Intellectual Property Trends
- 15.7 Energy Efficiency and Resource Management
- 15.8 Sustainability, Recycling and Circularity
- 15.9 Technology Roadmap, 2025-2035
- 15.10 Risks of Obsolescence and Technology Substitution
Chapter 16 Australia Medical X-Ray Generator Market Key Strategic Imperatives
- 16.1 Growth and Market Entry Priorities
- 16.2 High-Return Products and Segments
- 16.3 Pricing, Profitability and Cost Optimization
- 16.4 Technology Investment and Product Differentiation
- 16.5 Supply Chain Localization and Resilience
- 16.6 Distribution and Customer Acquisition
- 16.7 Partnership, Acquisition and Capacity Strategy
- 16.8 Regional Expansion Priorities
- 16.9 Short-, Medium- and Long-Term Actions
Chapter 17 Competition Outlook
- 17.1 Industry Competition Characteristics
- 17.2 Market Structure and Concentration
- 17.3 Market Share and Competitive Positioning, 2025
- 17.4 Company-Wise Revenue and Product Benchmarking
- 17.5 Production and Service Capacity Benchmarking
- 17.6 Technology, Pricing and Differentiation
- 17.7 Regional Footprint and Distribution Strength
- 17.8 Mergers, Acquisitions and Strategic Alliances
- 17.9 New Entrants and Competitive Threats
- 17.10 Porter's Five Forces and Industry Attractiveness
- 17.11 Competitive Outlook, 2025-2035
Chapter 18 Company Profiles
- 18.1 Company Coverage and Selection Criteria
- 18.2 Siemens Healthineers
- 18.2.1 Business Description
- 18.2.2 Company Ownership and Geographic Presence
- 18.2.3 Product and Service Portfolio
- 18.2.4 Manufacturing and Operating Footprint
- 18.2.5 Production Capacity and Expansion Plans
- 18.2.6 Financial Performance and Investment
- 18.2.7 Market Share and Competitive Position
- 18.2.8 Technology and Innovation Capabilities
- 18.2.9 Strategic Alliances or Partnerships
- 18.2.10 Recent Developments
- 18.2.11 Growth Strategy and Outlook
- 18.3 GE HealthCare
- 18.4 Philips
- 18.5 Canon Medical Systems
- 18.6 Fujifilm Healthcare
- 18.7 Other Relevant Market Participants
Note: Every listed company is profiled on the structure shown under the first company. The company list is preliminary and may change based on research findings, market developments, data availability and client requirements.
Chapter 19 Disclaimer
- 19.1 Research and Forecast Disclaimer
- 19.2 Data Source and Estimation Limitations
Note: The depth of individual sections depends on data availability for this market. Volume, capacity, trade and other unit-based metrics are included where applicable.

