
Market Overview
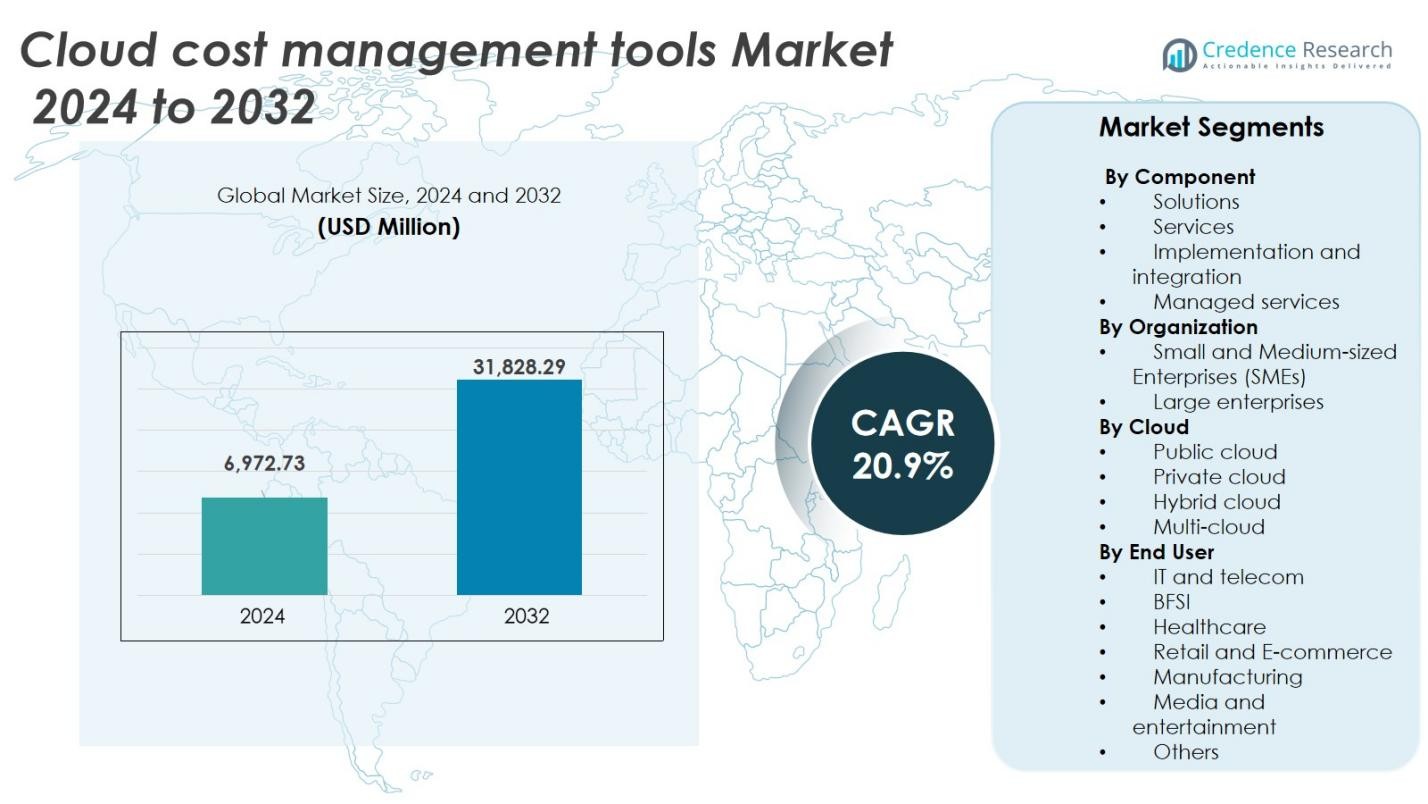
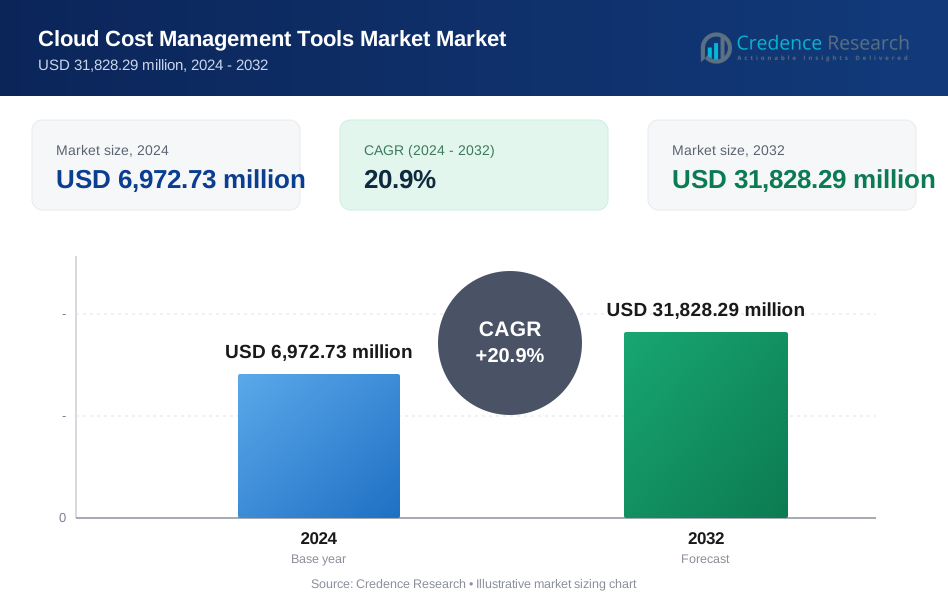
Cloud Cost Management Tools Market size was valued USD 6,972.73 million in 2024 and is anticipated to reach USD 31,828.29 million by 2032, at a CAGR of 20.9% during the forecast period.
| REPORT ATTRIBUTE | DETAILS |
|---|---|
| Historical Period | 2020-2023 |
| Base Year | 2024 |
| Forecast Period | 2025-2032 |
| Cloud Cost Management Tools Market Size 2024 | USD 6,972.73 Million |
| Cloud Cost Management Tools Market, CAGR | 20.9% |
| Cloud Cost Management Tools Market Size 2032 | USD 31,828.29 Million |
Top players in the cloud cost management tools market include Microsoft Corporation, AWS, Google LLC, IBM Corporation, VMware, Apptio, Datadog, Flexera, Harness, and Hewlett Packard Enterprise. These vendors compete through AI-driven cost analytics, automated rightsizing, multi-cloud dashboards, and deep integrations with public cloud platforms. North America remains the leading regional market, holding 39% of the global share in 2024, supported by high cloud spending, FinOps adoption, and strong enterprise use of AWS, Azure, and Google Cloud. Europe follows with significant demand from regulated industries, while Asia-Pacific shows the fastest growth with rising multi-cloud deployments across telecom, e-commerce, and financial services.
Market Insights
- The cloud cost management tools market reached USD 6,972.73 million in 2024 and will reach USD 31,828.29 million by 2032 at a CAGR of 20.9%.
- Rising multi-cloud adoption and complex billing models drive strong demand for cost visibility, automated rightsizing, and AI-based forecasting, leading enterprises to adopt FinOps platforms at a faster pace.
- Vendors enhance capabilities with Kubernetes cost allocation, real-time anomaly detection, and hybrid optimization, while partnerships with cloud providers expand market reach and service integration.
- Limited FinOps expertise, data security concerns, and integration complexity restrain adoption, especially for SMEs and highly regulated sectors requiring strict governance.
- North America leads with 39% share, followed by Europe, while Asia-Pacific records the fastest growth; solutions dominate the component segment, and large enterprises hold the largest share due to higher cloud spending.
Market Segmentation Analysis:
By Component
Solutions held the dominant share in the cloud cost management tools market in 2024, accounting for around 68% of total revenue. Enterprises prefer automated cost analytics, budgeting, and chargeback tools that provide real-time usage visibility and optimization insights. Strong demand for multi-cloud monitoring dashboards and AI-based spending forecasts boosted adoption. Services accounted for the remaining 32%, including implementation and integration, as companies seek guidance to align tools with existing cloud architectures. Managed services also see steady traction, particularly among firms lacking in-house FinOps capabilities.
- For instance, CloudZero provides real-time cost intelligence with hourly reports, enabling companies like Drift to save millions in cloud spend by identifying the cost per customer and other granular metrics.
By Organization Size
Large enterprises captured the dominant market share in 2024, accounting for about 64% of total revenue, driven by higher cloud spending, complex hybrid environments, and strict compliance needs. These organizations adopt cost optimization platforms to control waste from containerized workloads, virtual machines, and microservices. Small and Medium-sized Enterprises (SMEs) held the remaining 36%, with adoption expanding as subscription-based pricing lowers entry barriers. Cost transparency, automated invoice reconciliation, and real-time usage alerts help smaller
- For instance, Accruent, a workplace management software provider with over 85 cloud accounts, leveraged a unified cost visibility solution from Flexera to save $200,000 annually by centralizing cloud spend management.
By Cloud Deployment & End User
Public cloud led the market share in 2024, accounting for around 59% of total revenue, driven by heavy use of AWS, Azure, and Google Cloud. Scalable workloads and flexible pricing models created strong demand for cost governance and resource efficiency. Hybrid and multi-cloud deployments represented about 41%, rising as enterprises diversify vendor portfolios. IT and telecom dominated the end-user segment with roughly 34% share, powered by high infrastructure spending and container-based architectures. BFSI and healthcare collectively accounted for about 28%, supported by compliance tracking, secure billing analytics, and audit-ready cost reporting.
Key Growth Drivers
Rising Multi-Cloud Adoption and Cost Complexity
Multi-cloud usage is expanding as enterprises combine AWS, Azure, Google Cloud, and private cloud platforms to reduce vendor lock-in and enhance workload flexibility. However, this shift increases billing complexity, as each provider offers distinct pricing models for compute, storage, and networking. Companies adopt cloud cost management tools to centralize billing, forecast usage, and automate budget enforcement across multiple cloud environments. These platforms deliver granular visibility, detect idle resources, and track spending by department, application, or project. Strong demand from IT, telecom, BFSI, and digital-native enterprises continues to drive revenue, as FinOps practices become standard for cost governance.
- For instance, AWS introduced an open-source standard for cloud billing data that simplifies cost reporting across multiple cloud services, helping organizations centralize and analyze usage efficiently.
AI and Automation for Cloud Cost Optimization
Enterprises seek automation to reduce waste and improve operational efficiency, making AI-driven cost optimization a major growth catalyst. Cloud cost tools now integrate intelligent forecasting, anomaly detection, rate optimization, and automated rightsizing of compute and storage. These capabilities help enterprises prevent bill overruns, reduce cloud sprawl, and match resource allocation with real-time demand. Automated shutdown of idle instances, dynamic provisioning, and purchasing recommendations for reserved or spot instances enhance savings. As workloads become more complex, manual tracking becomes ineffective, encouraging organizations to adopt intelligent cost platforms. High cloud spending across banking, telecom, e-commerce, SaaS, and gaming accelerates demand for AI-based systems that ensure predictable cost outcomes.
- For instance, Google Cloud's native Cost Management Suite offers integrated AI tools for anomaly detection and dynamic provisioning, enabling businesses to match resource allocation with real-time demand and enhance savings.
Strong Enterprise Shift Toward FinOps Adoption
FinOps teams are becoming essential for cloud governance as enterprises prioritize transparency, shared accountability, and continuous optimization. Cloud cost management tools support FinOps frameworks through budget allocation, departmental chargeback, policy enforcement, and financial dashboards. Large companies rely on these platforms to align engineering, finance, and procurement teams, enabling better decision-making and spending compliance. Growing enterprise mandates for ROI validation, automated reporting, and compliance tracking push adoption even higher. Mid-size companies increasingly invest in FinOps tools as cloud usage expands, while service providers offer managed FinOps to organizations lacking technical staff. With multi-cloud growth, Kubernetes adoption, and pay-as-you-go billing, FinOps platforms are expected to see sustained demand through 2032.
Key Trends & Opportunities
Growing Demand for Multi-Cloud and Hybrid Optimization
Organizations are diversifying workloads across public, private, and on-premise infrastructure to ensure business continuity, security compliance, and operational efficiency. This shift strengthens demand for platforms that unify cost tracking and performance visibility. Cloud cost management vendors provide integrations with major cloud providers and support multi-billing consolidation. The opportunity expands as enterprises seek tools that optimize workload placement, compare cloud pricing models, and automatically shift workloads to the lowest-cost environment. Hybrid optimization also supports edge computing and distributed AI workflows, making cross-platform cost analytics a strategic priority for enterprises and digital service providers.
- For instance, IBM Cloudability enables financial accountability and governance across multi-cloud environments, helping organizations optimize costs with real-time visibility and workload planning across AWS, Azure, and Google Cloud.
Advancements in Container and Kubernetes Cost Visibility
Containerized applications and microservices increase resource fragmentation, making traditional reporting insufficient. Advanced cloud cost systems are adding Kubernetes-specific cost allocation, usage metering, and real-time monitoring for pods, nodes, and clusters. This creates strong market opportunity as DevOps teams seek accurate cost attribution for workloads running across hybrid and public clouds. Tools that link container spending to teams, applications, or customers enhance financial accountability and accelerate FinOps maturity. As Kubernetes adoption grows in telecom, fintech, SaaS, and gaming, demand for deep container cost visibility is expected to increase sharply.
Key Challenges
Lack of Cloud Cost Transparency and Skilled FinOps Personnel
Many enterprises struggle to interpret complex billing structures, especially when using multiple clouds or variable workloads. Without skilled FinOps teams, companies fail to track runaway spending, underutilized resources, or inefficient architectures. Limited knowledge of pricing models-such as reserved instances, spot pricing, and pay-as-you-go options-creates barriers for optimization. This challenge is higher among SMEs, which often lack technical staff and rely on manual reporting. Cloud cost tools provide automation, but many firms still face organizational gaps in governance, policies, and accountability. The shortage of FinOps professionals makes it difficult to maximize the value of cost management platforms.
Security and Integration Barriers in Large Enterprises
Large organizations operate complex architecture with legacy systems, private clouds, and strict compliance requirements, making integration difficult. Cloud cost platforms must connect with diverse billing APIs, security policies, and workload environments without exposing sensitive data. Concerns around data privacy, audit readiness, and governance slow adoption, especially in BFSI and healthcare. Integration delays and high implementation costs discourage some enterprises, particularly those with on-premise storage or regulated workloads. Although vendors offer secure connectors and compliance certifications, security-related hesitation remains a key adoption barrier for highly regulated sectors.
Regional Analysis
North America
North America held the largest share in the cloud cost management tools market in 2024, 39% of global revenue. The region’s high cloud spending, rapid multi-cloud adoption, and widespread FinOps practices in U.S. and Canadian enterprises drive strong demand. The mature SaaS ecosystem, strong vendor presence, and advanced cloud-cost governance practices in IT, telecom, and BFSI sectors further anchor growth. Investment in AI-based automation, container workload management, and hybrid-cloud analytics continues to expand the market footprint across North America.
Europe
Europe represented a significant share of the global market in 2024, around 27% of revenue. Enterprises in Germany, the U.K., France, and the Nordics are adopting cloud cost tools to meet strict cost compliance and data protection standards. Major migrations of mission-critical workloads and multi-cloud hybrid deployments are raising transparency needs. Vendors’ partnerships with European hyperscalers and managed service providers strengthen regional growth, especially in financial services, manufacturing, and telecom verticals.
Asia-Pacific
The Asia-Pacific region recorded the fastest growth rate in 2024, and had an estimated share of about 23% of the cloud cost management tools market. Cloud transformation across China, India, Japan, and Southeast Asia is driving demand for real-time cost monitoring and automated optimization. Telecom, retail, e-commerce, and manufacturing enterprises are rapidly scaling cloud services, and public cloud adoption is accelerating via major providers like AWS, Azure, Alibaba Cloud, and Google Cloud. Multi-cloud usage, pay-as-you-go pricing, and AI-based optimization are key growth levers in the region.
Latin America
Latin America accounted for a smaller but growing share of 5% of the global cloud cost management tools market in 2024. Enterprises in Brazil, Mexico, Argentina, and Chile are migrating to public and hybrid clouds and adopting cost optimization platforms. Major growth is seen in e-commerce, telecom, and IT outsourcing sectors, supported by partnerships between global vendors and local service integrators to strengthen cost-governance capabilities.
Middle East & Africa (MEA) The Middle East & Africa region captured 5% share of the cloud cost management tools market in 2024smaller than other regions but expanding. Emerging cloud investments in the UAE, Saudi Arabia, South Africa, and Qatar across BFSI, telecom, energy, and government sectors drive adoption. Growth is enabled by local data center expansions, multi-cloud and hybrid environments, and increasing demand for compliance, secure integration, and pay-as-you-go cost-control tools.
Market Segmentations
By Component
- Solutions
- Services
- Implementation and integration
- Managed services
By Organization
- Small and Medium-sized Enterprises (SMEs)
- Large enterprises
By Cloud
- Public cloud
- Private cloud
- Hybrid cloud
- Multi-cloud
By End User
- IT and telecom
- BFSI
- Healthcare
- Retail and E-commerce
- Manufacturing
- Media and entertainment
- Others
By Geography
- North America
- U.S.
- Canada
- Mexico
- Europe
- Germany
- France
- U.K.
- Italy
- Spain
- Rest of Europe
- Asia Pacific
- China
- Japan
- India
- South Korea
- South-east Asia
- Rest of Asia Pacific
- Latin America
- Brazil
- Argentina
- Rest of Latin America
- Middle East & Africa
- GCC Countries
- South Africa
- Rest of the Middle East and Africa
Competitive Landscape
The cloud cost management tools market is highly competitive, with global players and emerging FinOps-focused platforms expanding their offerings through automation, AI-driven analytics, and deep integrations with major cloud providers. Leading vendors such as AWS, Microsoft Corporation, Google LLC, IBM Corporation, VMware, Apptio, Datadog, Flexera, and Harness continuously enhance capabilities like real-time cost visibility, automated rightsizing, and anomaly detection. Many providers support multi-cloud governance and containerized workloads, which strengthens demand among large enterprises with complex architectures. Partnerships with hyperscalers, managed service providers, and FinOps consulting firms accelerate market reach. Vendors also focus on intuitive dashboards, policy controls, and integration with CI/CD pipelines to attract DevOps teams. Growing competition drives frequent upgrades, subscription-based pricing models, and acquisitions aimed at strengthening automation, budgeting, and compliance capabilities. As cloud usage increases, enterprises compare providers based on scalability, accuracy of forecasting, pricing analytics, and integration depth, making innovation a key competitive factor.
Key Player Analysis
- VMware, Inc.
- Datadog
- Google LLC
- Harness
- IBM Corporation
- Flexera
- AWS (Amazon Web Services)
- Hewlett Packard Enterprise
- Apptio, Inc.
- Microsoft Corporation
Recent Developments
- In 2025, Microsoft Cost Management added new features such as APIs for partner billing data access and near-real-time monitoring across multiple customers.
- In October 2024, Flexera achieved yet another milestone in cloud cost management, claiming the Gartner Magic Quadrant for 2024 cloud financial management tools for the flexera universe with my organization adding that the firm was recognized as a leader in that segment. This acknowledgement underscores Flexera's profound execution skill and comprehensive vision in managing cloud spend.
- In September 2024, IBM reported the purchase of Kubecost, a young firm that focuses on Kubernetes cost management and optimization, together with its goals on enhancing its FinOps Suite which already possesses functionalities from its earlier acquisition, Apptio. The incorporation of Kubecost is expected to reinforce IBM has in the competition for the fast-changing and expanding FinOps marketplace that is critical to the management of cloud, hybrid, and on-premises systems in enterprises.
Report Coverage
The research report offers an in-depth analysis based on Component, Organization, Cloud, End-User and Geography. It details leading market players, providing an overview of their business, product offerings, investments, revenue streams, and key applications. Additionally, the report includes insights into the competitive environment, SWOT analysis, current market trends, as well as the primary drivers and constraints. Furthermore, it discusses various factors that have driven market expansion in recent years. The report also explores market dynamics, regulatory scenarios, and technological advancements that are shaping the industry. It assesses the impact of external factors and global economic changes on market growth. Lastly, it provides strategic recommendations for new entrants and established companies to navigate the complexities of the market.
Future Outlook
- Demand for AI-driven cloud optimization and automated cost control will increase.
- Multi-cloud and hybrid adoption will strengthen the need for unified billing visibility.
- FinOps will become a standard practice across large enterprises and growing SMEs.
- Kubernetes and container cost allocation will emerge as core optimization priorities.
- Vendors will integrate deeper with CI/CD pipelines to support DevOps workflows.
- Real-time anomaly detection and auto-remediation will reduce budget overruns.
- Managed FinOps services will expand for organizations lacking in-house expertise.
- Compliance-focused industries will adopt advanced billing governance and audit-ready reporting.
- Partnerships between cloud providers and cost tool vendors will accelerate global penetration.
- Increased focus on carbon-aware cloud cost analytics will support sustainability initiatives.
Request a Free Sample
Fill in your details and we'll send you a free sample report.
- Sample data tables & charts
- Research methodology
Need a Custom Version of This Report?
Tailor the scope, geography, or segments to your exact requirements.
- Custom geography or segment scope
- Direct access to our analyst team
Frequently Asked Questions
What is the current market size for the Cloud cost management tools market, and what is its projected size in 2032?
At what Compound Annual Growth Rate is the Cloud cost management tools market projected to grow between 2025 and 2032?
Which Cloud cost management tools market segment held the largest share in 2024?
What are the primary factors fueling the growth of the Cloud cost management tools market?
Who are the leading companies in the Cloud cost management tools market?
Which region commanded the largest share of the Cloud cost management tools market in 2024?
Table of Content
Chapter 1. Report Introduction
- 1.1 Report Description & Purpose
- 1.1.1 Report Title & Market Definition
- 1.1.2 Unique Selling Propositions (USP) & Key Differentiators
- 1.1.3 Value Proposition for Stakeholders
- 1.2 Research Objectives
- 1.2.1 Market Sizing Objectives (Volume & Revenue)
- 1.2.2 Segmentation Objectives
- 1.2.3 Competitive Intelligence Objectives
- 1.2.4 Forecast & Scenario Objectives
- 1.3 Report Scope
- 1.3.1 Cloud Cost Management Tools Market Scope – Types & Subtypes Covered
- 1.3.2 Geographic Scope – Regions & Countries Covered
- 1.3.3 Historical Period, Base Year & Forecast Period (2024; forecast to 2032)
- 1.3.4 Inclusions & Exclusions
- 1.4 HS Code & Classification Framework
- 1.5 Currency, Units & Pricing Basis
- 1.6 Target Stakeholders
- 1.7 Limitations & Assumptions
Chapter 2. Executive Summary
- 2.1 Global Cloud Cost Management Tools Market Market Snapshot
- 2.1.1 Market Size – Historical (2024) & Forecast (2024-2032) (2024: USD 6,972.73 million → 2032: USD 31,828.29 million)
- 2.1.2 Volume & Revenue – Global Totals
- 2.1.3 Key Market Highlights – Top Five Facts
- 2.2 Cloud Cost Management Tools Market Market Segmentation Snapshot
- 2.2.1 Market Split by Region – 2024 vs. 2032
- 2.3 Competitive Snapshot
- 2.3.1 Top 10 Players by Revenue Share – 2024
- 2.3.2 Top 10 Players by Volume Share – 2024
- 2.3.3 Recent Strategic Developments (18-Month Summary)
- 2.4 Key Investment Highlights & Strategic Conclusions
Chapter 3. Cloud Cost Management Tools Market Market Dynamics & Industry Analysis
- 3.1 Market Overview & Context
- 3.1.1 Cloud Cost Management Tools Market Market Position in the Broader Automotive Value Chain
- 3.1.2 OEM vs. Replacement Market Dynamics
- 3.1.3 Market Maturity & Development Stage by Region
- 3.2 Cloud Cost Management Tools Market Market Drivers
- 3.3 Cloud Cost Management Tools Market Market Restraints & Challenges
- 3.4 Cloud Cost Management Tools Market Market Opportunities
- 3.5 Porter's Five Forces Analysis
- 3.5.1 Threat of New Entrants
- 3.5.2 Bargaining Power of Suppliers
- 3.5.3 Bargaining Power of Buyers
- 3.5.4 Threat of Substitutes
- 3.5.5 Competitive Rivalry – Intensity Assessment
- 3.6 Cloud Cost Management Tools Market Value Chain Analysis
- 3.6.1 Upstream – Raw Material/Input Suppliers
- 3.6.1.1 Raw Material/Input 1
- 3.6.1.2 Raw Material/Input 2
- 3.6.1.3 Raw Material/Input 3
- 3.6.2 Midstream – Production/Manufacturing/Service Delivery
- 3.6.2.1 Production/Process Overview
- 3.6.2.2 Key Facility Locations & Capacity by Manufacturer
- 3.6.3 Downstream – Distribution & End Consumer
- 3.6.3.1 Primary Channel – B2B/OEM
- 3.6.3.2 Secondary Channels – Dealer, Retail, Online, Direct
- 3.6.4 Value Chain Profitability Analysis
- 3.6.1 Upstream – Raw Material/Input Suppliers
- 3.7 PESTEL Analysis
- 3.7.1 Political Factors
- 3.7.2 Economic Factors
- 3.7.3 Social Factors
- 3.7.4 Technological Factors
- 3.7.5 Environmental Factors
- 3.7.6 Legal Factors
- 3.8 Cloud Cost Management Tools Market Supply Chain Analysis
- 3.8.1 Raw Material/Input Supply Risk Assessment
- 3.8.2 Manufacturing Concentration Risk (Geographic Exposure)
- 3.8.3 Trade Disruption Impact Analysis
- 3.9 Regulatory & Policy Landscape
Note: The regulatory and policy landscape section covers regulations based on their applicability to the market, Cloud Cost Management Tools Market category, geography, and scope of the study. Only regulatory frameworks with a material impact on operations, compliance, trade, sustainability, or market access are analyzed in detail.
Chapter 4. Key Investment Pockets & Opportunity Analysis
- 4.1 Cloud Cost Management Tools Market Market Attractiveness Analysis
- 4.1.1 By Region – Investment Attractiveness Matrix (Volume × CAGR)
- 4.2 Absolute Revenue Growth Opportunity
- 4.2.1 By Region – Absolute USD Growth Through 2032
- 4.3 Incremental Volume Opportunity
- 4.3.1 By Region – Incremental Volume Through 2032
- 4.3.2 Segment – Incremental Volume
- 4.4 Emerging Submarket Opportunity Deep Dive (Subject to Applicability)
- 4.5 Emerging Market Opportunity Scorecards
- 4.5.1 United States
- 4.5.2 Europe
- 4.5.3 Asia
- 4.5.4 Middle East & Africa
Note: Emerging Market Opportunity Scorecards will be included based on relevance and strategic importance. Regions listed are indicative and may vary depending on data availability and market dynamics.
Chapter 5. Cloud Cost Management Tools Market Import-Export Analysis & Trade Flows
- 5.1 Global Trade Overview
- 5.1.1 Global Export Value by Country (2024)
- 5.1.2 Global Export Volume by Country (2024)
- 5.1.3 Global Import Value by Country (2024)
- 5.1.4 Global Import Volume by Country (2024)
- 5.1.5 Net Trade Balance by Country (2024)
- 5.2 Export Analysis – Segment
- 5.2.1 Type 1 (HS Code)
- 5.2.2 Type 2 (HS Code)
- 5.2.3 Type 3 (HS Code)
- 5.2.4 Type 4 (HS Code)
- 5.2.5 Type 5 (HS Code)
- 5.3 Import Analysis – Segment
- 5.3.1 Type 1 (HS Code)
- 5.3.2 Type 2 (HS Code)
- 5.3.3 Type 3 (HS Code)
- 5.3.4 Type 4 (HS Code)
- 5.3.5 Type 5 (HS Code)
- 5.4 Average Unit Trade Prices
- 5.4.1 Average Export Price – Segment & Country
- 5.4.2 Average Import Price – Segment & Source Country
- 5.4.3 Price Trends (2024)
- 5.5 Key Trade Route Analysis
- 5.5.1 Trade Route 1
- 5.5.2 Trade Route 2
- 5.5.3 Trade Route 3
- 5.5.4 Trade Route 4
- 5.5.5 Trade Route 5
- 5.6 Trade Policy Impact Assessment
- 5.6.1 US Anti-Dumping & Section 301 Tariffs
- 5.6.2 EU Customs Union Impact
- 5.6.3 Major Free Trade Agreements
- 5.6.4 USMCA Rules of Origin
Note: Trade policy analysis will be included only where relevant to the Cloud Cost Management Tools Market market.
Chapter 6. Competitive Landscape & Company Benchmarking
- 6.1 Cloud Cost Management Tools Market Market Concentration & Structure
- 6.1.1 Herfindahl-Hirschman Index (HHI) – vs. 2024
- 6.1.2 Tier 1, Tier 2 & Tier 3 Market Structure
- 6.1.3 Global, Regional & Local Player Dynamics
- 6.2 Cloud Cost Management Tools Market Market Share Analysis – 2024
- 6.2.1 Global Revenue Share by Company
- 6.2.2 Global Volume Share by Company
- 6.2.3 Regional Revenue Share
- 6.2.4 Market Share Evolution ( vs. 2024)
- 6.2.5 OEM Segment Share by Company
- 6.2.6 Replacement Segment Share by Company
- 6.3 Production/Delivery Capacity & Facility Analysis
- 6.3.1 Global Installed Capacity
- 6.3.2 Capacity Utilization Rates
- 6.3.3 Production/Output Volume
- 6.3.4 Facility Locations & Capacity Map
- 6.3.5 Planned Capacity Additions
- 6.4 Cloud Cost Management Tools Market Competitive Benchmarking Matrix
- 6.4.1 Revenue, Volume, CAGR & Profitability Comparison
- 6.4.2 Channel Revenue Mix
- 6.4.3 Geographic Revenue Exposure
- 6.4.4 R&D Intensity
- 6.4.5 Sustainability Maturity
- 6.5 Strategic Developments in Cloud Cost Management Tools Market (Last 24 Months)
- 6.5.1 Mergers, Acquisitions & Divestments
- 6.5.2 New Cloud Cost Management Tools Market Launches
- 6.5.3 Facility Expansions
- 6.5.4 Strategic Alliances, Joint Ventures & Partnerships
- 6.5.5 Distribution Expansion & Market Entry
- 6.5.6 Sustainability & ESG Initiatives
- 6.6 Competitive Strategy Mapping
- 6.6.1 Leader, Challenger, Follower & Niche Classification
- 6.6.2 Pricing Strategy Comparison
- 6.6.3 Channel Strategy Matrix
Note: Strategic developments are included based on their materiality and the availability of reliable information.
Chapter 7. Global Cloud Cost Management Tools Market Market – By Distribution Channel
- 7.1 Segment Overview
- 7.1.1 Volume & Revenue Split by Channel (2024 & 2032)
- 7.1.2 Channel Mix Evolution (2024-2032)
Chapter 8. Regional Market Analysis – Global Overview
- 8.1 Global Regional Overview
- 8.1.1 Regional Volume Share
- 8.1.2 Regional Revenue Share
- 8.1.3 Regional Volume by Region
- 8.1.4 Regional Revenue by Region
- 8.1.5 Regional Forecast Through 2032
- 8.2 Cross-Regional Segment Analysis
- 8.2.1 By Distribution Channel
- 8.2.2 By Brand/Price Tier
Chapter 9. North America Cloud Cost Management Tools Market Market
- 9.1 United States
- 9.2 Canada
- 9.3 Mexico
Chapter 10. Europe Cloud Cost Management Tools Market Market
- 10.1 Germany
- 10.2 France
- 10.3 Italy
- 10.4 United Kingdom
- 10.5 Spain
- 10.6 Poland
- 10.7 Russia
- 10.8 Netherlands
- 10.9 Belgium
- 10.10 Sweden
- 10.11 Denmark
- 10.12 Norway
- 10.13 Rest of Europe
Chapter 11. Asia Pacific Cloud Cost Management Tools Market Market
- 11.1 China
- 11.2 India
- 11.3 Japan
- 11.4 South Korea
- 11.5 Thailand
- 11.6 Indonesia
- 11.7 Vietnam
- 11.8 Malaysia
- 11.9 Australia
- 11.10 Rest of Asia Pacific
Chapter 12. Latin America Cloud Cost Management Tools Market Market
- 12.1 Brazil
- 12.2 Argentina
- 12.3 Colombia
- 12.4 Chile
- 12.5 Rest of Latin America
Chapter 13. Middle East Cloud Cost Management Tools Market Market
- 13.1 Saudi Arabia
- 13.2 United Arab Emirates
- 13.3 Turkey
- 13.4 Israel
- 13.5 Iran
- 13.6 Rest of the Middle East
Chapter 14. Africa Cloud Cost Management Tools Market Market
- 14.1 South Africa
- 14.2 Egypt
- 14.3 Nigeria
- 14.4 Morocco
- 14.5 Rest of Africa
Chapter 15. Cloud Cost Management Tools Market Company Profiles
- 15.1 [Company 01]
- 15.1.1 Company Overview
- 15.1.2 Key Management Personnel
- 15.1.3 Products & Services Portfolio
- 15.1.4 Financial Performance
- 15.1.5 Key Market Focus & Geographic Presence
- 15.1.6 Recent Developments & Strategic Initiatives
Note: The company profile list is preliminary and may change based on research findings, market developments, data availability, and client requirements.
Chapter 16. Appendices
- Appendix A – List of Abbreviations & Acronyms
- Appendix B – Industry Classification Code Reference – Full Series
- Appendix C – Production & Capacity Data Tables
- Appendix D – End-Use & Demand Base Tables
- Appendix E – Consumption & Replacement Rate Assumptions
- Appendix F – ASP Reference Tables
- Appendix G – Manufacturing & Facility Database
- Appendix H – Import-Export Data Tables
- Appendix I – Regulatory Summary Tables
- Appendix J – Primary Research Participant List (Anonymized)
- Appendix K – Primary Research Questionnaire Framework
- Appendix L – Data Sources & Bibliography
- Appendix M – Market Size Divergence & Source Comparison
Chapter 17. Research Methodology
- 17.1 Research Framework & Philosophy
- 17.2 Secondary Research – Sources, Hierarchy & Data Extraction
- 17.3 Data Modeling – Bottom-Up & Top-Down Market Sizing
- 17.4 Primary Research – Stakeholder Framework, LOI & Sample Sizes
- 17.5 Forecast Methodology – Regression, Scenario & Sensitivity Analysis
- 17.6 Quality Control – Four-Layer Validation Framework
- 17.7 Limitations & Standard Assumptions
- 17.8 Disclaimer
